")
Back to Journals » Medical Devices: Evidence and Research » Volume 14
A Novel Non-Invasive Device for the Assessment of Central Venous Pressure in Hospital, Office and Home
Authors Marcelli E, Cercenelli L , Bortolani B, Marini S, Arfilli L, Capucci A, Plicchi G
Received 26 February 2021
Accepted for publication 14 April 2021
Published 13 May 2021 Volume 2021:14 Pages 141—154
DOI https://doi.org/10.2147/MDER.S307775
Checked for plagiarism Yes
Review by Single anonymous peer review
Peer reviewer comments 2
Editor who approved publication: Dr Scott Fraser
Emanuela Marcelli,1,* Laura Cercenelli,1,* Barbara Bortolani,1 Saverio Marini,2 Luca Arfilli,3 Alessandro Capucci,4 Gianni Plicchi5
1eDIMES Lab-Laboratory of Bioengineering, Department of Experimental, Diagnostic and Specialty Medicine (DIMES), Alma Mater Studiorum University of Bologna, Bologna, Italy; 2Ars Medica: Associazione Medico-Chirurgica Della Gallura, Olbia, Italy; 3Villa Laura Ospedale Privato Accreditato, Bologna, Italy; 4Abcardio Cardiological Center, Bologna, Italy; 5TRE ESSE Progettazione Biomedica S.r.l., Bologna, 40138, Italy
*These authors contributed equally to this work
Correspondence: Laura Cercenelli
Laboratory of Bioengineering, Department of Experimental, Diagnostic and Specialty Medicine (DIMES), Alma Mater Studiorum University of Bologna, c/o S. Orsola Malpighi-Hospital, via Massarenti 9, Bologna, 40138, Italy
Tel +39 0516364603
Fax +39 0516364603
Email [email protected]
Background: Venous congestion can be quantified by central venous pressure (CVP) and its monitoring is crucial to understand and follow the hemodynamic status of patients with cardio-respiratory diseases. The standard technique for CVP measurement is invasive, requiring the insertion of a catheter into a jugular vein, with potential complications. On the other hand, the current non-invasive methods, mainly based on ultrasounds, remain operator-dependent and are unsuitable for use in the home environment. In this paper, we will introduce a novel, non-invasive device for the hospital, office and home assessment of CVP.
Methods: After describing the measurement concept, we will report a preliminary experimental study enrolling 5 voluntary healthy subjects to evaluate the VenCoM measurements’ repeatability, and the system’s capability in measuring small elicited venous pressure variations (2 mmHg), as well as an induced venous hypertension within a pathological range (12÷ 20 mmHg).
Results: The experimental measurements showed a repeatability of ± 1mmHg. The VenCoM device was able to reliably detect the elicited venous pressure variations and the simulated congestive status.
Discussion and Conclusion: The proposed non-invasive VenCoM device is able to provide a fast and repeatable CVP estimate, having a wide spectrum of potential clinical applications, including the monitoring of venous congestion in heart failure patients and in subjects with renal and hepatic dysfunction, as well as pulmonary hypertension (PH) that can be extended to pneumonia COVID-19 patients even after recovery. The device needs to be tested further on a large sample size of both healthy and pathological subjects, to systematically validate its reliability and impact in clinical setting.
Keywords: central venous pressure, pulmonary artery pressure, heart failure, non-invasive device, home monitoring, COVID-19, cardiovascular measurements
Introduction
The Central Venous Pressure (CVP) is the intravascular pressure in the great thoracic veins. It is conventionally measured at the junction of the superior vena cava and the right atrium and provides an estimate of the Right Atrial Pressure (RAP).
CVP is used in clinical practice to assess volume status and cardiac preload.1,2 Knowing a patient’s CVP can be helpful in the diagnosis and management of a variety of critical illnesses and injuries including congestive heart failure, impaired renal and hepatic function, diabetes, chronic obstructive pulmonary disease, cardiogenic shock, traumatic brain injury.3–9
Generally, CVP can be measured through different methods, which can be categorized as invasive and non-invasive. Measuring CVP by inserting a central venous catheter is the gold standard, but it is an invasive procedure. In addition, this is time-consuming, not practical in pre-hospital settings, and, even when recommended, it can be associated with potential risks of complications, including infection, catheter-induced thrombosis, and arrhythmias.10–13
Minimally invasive methods, involving the cannulation of peripheral limb veins or the internal or external jugular vein followed by transducing venous pressure, have been used and have shown mixed results.14,15
Physical examination of the Jugular Venous Pressure (JVP)16–18 or peripheral venous collapse19 are frequently used in routine clinical practice to non-invasively estimate the CVP, but with a poor sensitivity. The JVP method has largely been criticized because it is operator dependent, and also patient dependent, especially due to the increasing prevalence of obesity in critically ill patients.20,21 Moreover, such method has proven unreliable compared with invasive measurement using a catheter, demonstrating an accuracy no better than 50–60%.16,22
Various non-invasive echographic measurements have been proposed for CVP estimation21,23–25 and are recommended by the American Society of Echo26,27 as alternative approaches to invasive CVP assessment. The Inferior Vena Cava (IVC) is a compliant vessel whose size and shape vary with changes in CVP and intravascular volume. Parameters such as IVC diameter, collapsibility or Caval Index (IVCCI) assessed by sonographic clinic measurements are used as indirect indicators of CVP. An IVC diameter <2.1 cm that collapses >50% with a sniff suggests normal RAP of 3 mmHg (range, 0–5 mmHg), whereas an IVC diameter >2.1 cm that collapses <50% with a sniff suggests high RAP of 15 mmHg (range, 10–20 mmHg). If IVC diameter and collapse do not fit this paradigm, an intermediate value of 8 mmHg (range, 5–10 mmHg) may be used.26 Thalhammer et al28 proposed the “Compression Ultrasound” (CU) technique based on a portable ultrasound system and a translucent pressure manometer: such technique measures CVP by determining the pressure needed to compress completely a superficial vein at the forearm (preferentially the distal cephalic vein). The technique is characterized by high result variability, dependent on the physician’s training.29
In general, ultrasound-guided techniques are well accepted as non-invasive options for CVP assessment, being favorably validated compared to invasive hemodynamic measurements by numerous past and recent studies,30–33 although a recent review34 does not support the measurement by ultrasonography as an acceptable variable to determine CVP among critical patients. In any case these techniques remain operator-dependent and unsuitable for patients’ self-assessment in a home environment. Moreover, they generally display a limited accuracy, since only wide ranges of CVP can be identified (0–5 mmHg, 5–10 mmHg, 10–20 mmHg).27
Other recommended non-invasive methods include an optical principle using Near InfraRed Spectroscopy (NIRS): infrared sensors of the size of the superficial veins are used to detect the JVP in the neck, and therefore to yield a pressure waveform.35 Mespere VENUS 2000 CVP is a system based on NIRS, using single wavelength LED and photodetectors to detect the JVP in the neck and the height of the JVP column relative to the superior vena cava, thus requiring the patient to lie at an angle which aligns JVP pulse in the range of the sensor.35 Although this optical method yields readings consistently close to those measured invasively, it remains impractical for routine use in clinic and home environments.
Currently, to the authors’ knowledge there is a lack of non-invasive methods for CVP assessment having the accuracy necessary for interchangeability with traditional invasively measured CVP, as well as the ease of use for a routine adoption in outpatient and home settings.
In this paper, we introduce Venous Congestion Meter (VenCoM), a novel non-invasive device for the CVP assessment. Such device can be used in hospitals, offices, as well as at home. The presented VenCoM device and method fall into the category of plethysmographic techniques, which have already been explored for non-invasive assessment of venous pressure.36,37 As a key advantage the VenCoM device provides a CVP measurement using a quite compact and easy-to-use appliance, similar to those applied for standard automatic upper arm blood pressure monitor. The measurement takes only few tens of seconds.
Methods
The VenCoM Prototype
The prototypal VenCoM device (PCT patent pending), currently under development by an Italian research company38 consists of two pneumatic cuffs. The first pneumatic occlusive cuff (B1) is to be positioned on the upper portion of an arm; the second pneumatic cuff (B2), with “volume sensing” function, in accordance with the already proposed air plethysmography technique39–41 is to be secured to the forearm, thus monitoring its volume changes (Figure 1).
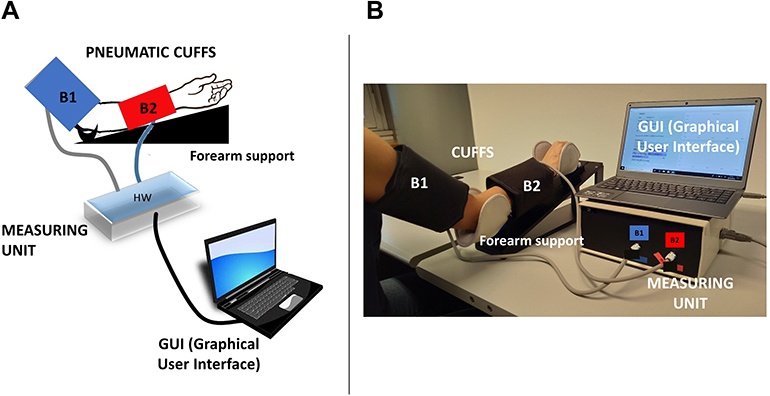 |
Figure 1 Schematic representation of the prototypal VenCoM device (A) and a photograph of the overall device assembly during a measuring session (B). |
Cuffs inflations/deflations are controlled by the Measuring Unit which includes:
- two rotary diaphragm micropumps (24TC27B RO-D, Schwarzer Precision, Essen, Germany) to inflate the B1 and B2 cuffs;
- two pressure sensors (5-PSI-D-HGRADE-MV/0.3-PSI-D-HGRADE-MV, Amphenol All Sensors, Wallingford, CT, USA) for the accurate measurement of pressure inside the cuffs;
- two solenoid valves (EV1, EV2);
- a custom-made microcontroller for driving the micropumps, the solenoid valves, as well as for the acquisition and processing of pressure signals.
The user can start the automatic CVP measurement via a Graphical User Interface (GUI) on a laptop that allows the setting of input parameters (eg, patient ID, weight, height, and age), and provides displaying of PB1 and PB2 curves as well as the output estimated CVP value.
A block diagram of the VenCoM device is reported in Figure 2.
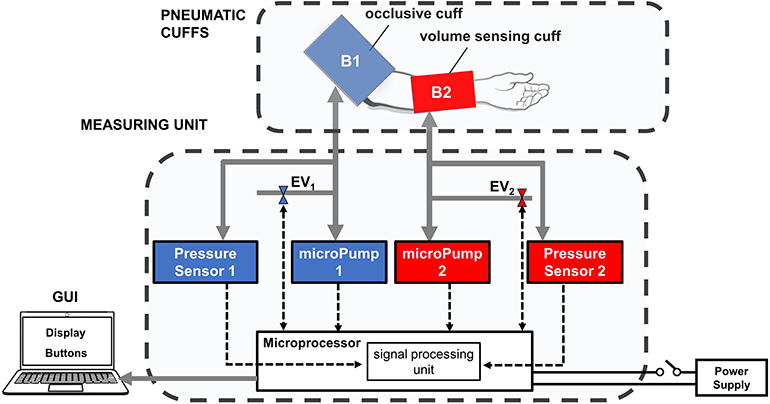 |
Figure 2 Block diagram of the main components of VenCoM device. |
For the correct execution of the measurement, a dedicated support system for the forearm has been designed to be used in combination with VenCoM device (Figure 1).
The Measuring Concept and Method
The VenCoM measuring concept relies on the widely demonstrated principles of Venous Occlusive Plethysmography (VOP) and physiological findings about limb venous compliance in humans,36,37,42–45 ie when an occlusive cuff is placed around the arm, the pressure in excess of the existing venous pressure is transmitted with high fidelity to intraluminal vein pressure; this causes a Rapid Volume Change (RVC) of the forearm, which is attributable to vascular distension44 (Figure 3).
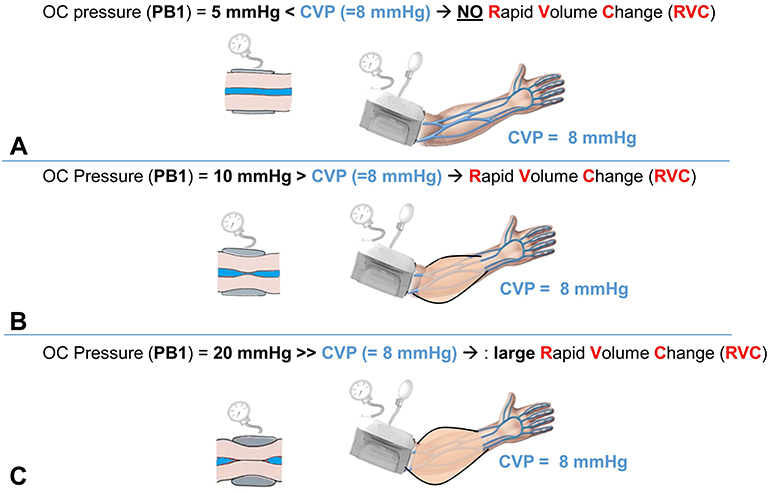 |
Figure 3 Example of VOP principle: (B, C) rapid volume change (RVC) in the forearm occurring when an occlusive (OC) pressure exceeding the actual central venous pressure (CVP) is applied to the arm; (A) no RVC is observed if OC pressure is below the actual CVP. |
One of the main assumptions of VOP technique is that the cuff pressure applied to the limb equals the venous pressure at the level of the strain gauge used in the forearm to measure the volume response. No volume response will occur until the occlusive cuff pressure exceeds the ambient venous pressure, so that the first sign of a volume response will indicate that the ambient venous pressure has been exceeded.43
Following this principle in VenCoM, if the occlusive pressure applied through B1 is lower than the actual venous pressure, there will be no volumetric variation at the level of the forearm “OFF Response”, whereas if the occlusive pressure is higher than the actual venous pressure, a volumetric response (RVC) occurs in the forearm “ON Response”, and it can be detected as pressure variation in the sensing cuff B2.
The VenCoM device calculates the CVP by measuring pressures within the cephalic, basilic, and brachial veins, ie, Peripheral Venous Pressures (PVP), which are very close to those of the superior vena cava (Figure 4), due to the low resistance to venous return.37
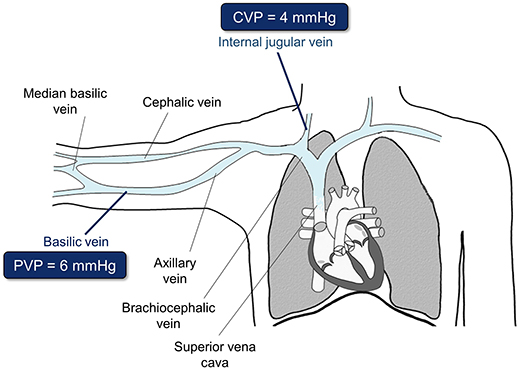 |
Figure 4 Relation between central venous pressure (CVP) and peripheral venous pressure (PVP). |
A highly significant positive correlation (r=0.86÷0.89, p<0.001) between central venous and peripheral venous pressures has been previously reported.14,46 Among studies comparing PVP with CVP,29 the ones involving a rather large population14,46 found a mean difference between peripheral and central venous pressure of 2 mmHg, thus suggesting the measured PVP should be adjusted by the average bias of −2 mmHg to estimate CVP.
Following these findings, the VenCoM device provides an estimated CVP value (eCVP), by subtracting a 2 mmHg offset value from the measured PVP.
The VenCoM measuring algorithm consists of a series of steps of cuff inflations/deflations and automatic processing of the two acquired pressure signals from the cuffs, in order to provide an estimated CVP value in just few tens of seconds. At each step of inflation, the PB1 cuff is used to induce an equal intraluminal vein pressure in the forearm, how has been widely described.28
This automatic multi-step measuring algorithm is exemplified with an equivalent hydraulic scheme in Figure 5.
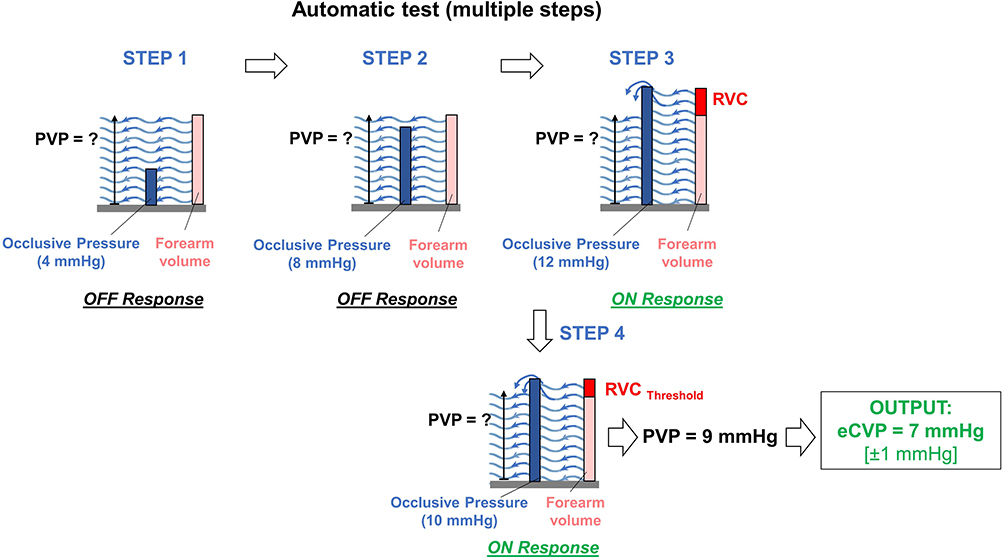 |
Figure 5 The multi-step measuring algorithm used in VenCoM to obtain a quite accurate estimate of CVP (eCVP) by consecutive approximations is illustrated here through an hydraulic scheme. PVP stands for “peripheral venous pressure” (directly correlated to CVP). Blue bars represent the applied occlusive (OC) pressure at each step. The red bar represents the forearm volume, therefore the rapid volume change (RVC) that occurs when an OC pressure exceeds the actual venous pressure. |
During the measurement session, pressure signals (PB1, PB2) from sensors connected to the two pneumatic cuffs are captured in real time via the GUI, and at the end of the measuring sequence the eCVP, obtained from the measured PVP, is shown in mmHg.
Experimental Tests
We performed preliminary experimental tests to evaluate the VenCoM device in terms of measurements’ repeatability, and the system’s capability in assessing small elicited venous pressure variations, as well as a simulated venous hypertension condition, by artificially inducing a venous pressure increase.
Five voluntary healthy subjects (3 females and 2 males, mean age 39 ± 9 years) underwent the experimental tests according to the study protocol approved by local Ethics Committee (Comitato Etico 1 Lazio, Italy). The tests were conducted in accordance with the Declaration of Helsinki, and subjects provided written informed consent to take part to the test sessions.
A first testing session (Test 1) consisted of 15 repeated CVP measurements, using the VenCoM device. Between one measurement and the next, the two measuring cuffs (B1, B2) were removed and put on again, in order to also take into account the effect of slight differences in positioning the cuffs, that may occur in clinical practice.
In a second session (Test 2), we changed the height between the centre of the occlusive cuff and the level of the right atrium by raising and lowering the arm with respect to the table by well-defined distances. This allowed, according to the hydrostatic law, to elicit controlled CVP reductions and increases starting from an initial condition of no difference (Figure 6). In the first measurement (a), the center of the occlusive cuff was kept at the same height as the heart (∆H=0). In the second measurement (b), the forearm was lifted through a 7.5 cm-high block to obtain a negative height difference (∆H1= −3 cm) between the heart and the center of the cuff, corresponding to a decrease, in mmHg, of about −2 mmHg (∆P1). In the third measurement (c), the arm was lowered relative to the level of the heart by lifting the seat through the same block, in order to obtain a positive height difference (∆H2=3 cm) between the heart and the center of the cuff, corresponding to an increase, in mmHg, of about 2 mmHg (∆P2) (Figure 6).
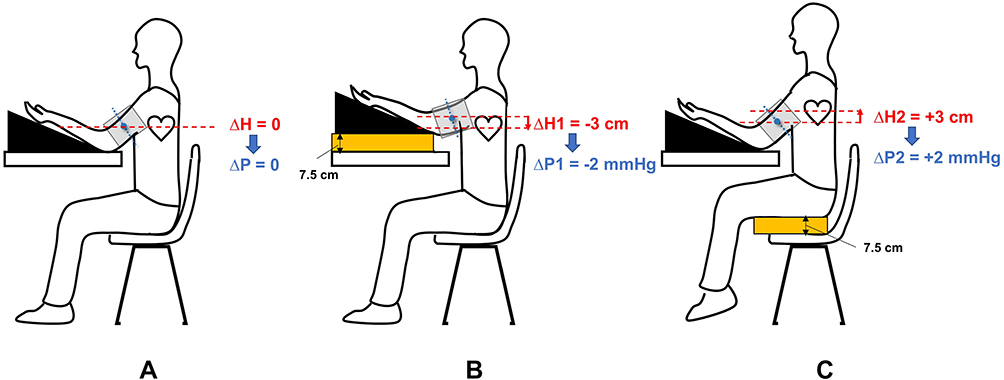 |
Figure 6 Scheme of the experimental set-up to elicit known venous pressure variations (∆P1, ∆P2) by changing the height (∆H1, ∆H2) between the center of the occlusive cuff and the level of the right atrium (B, C), starting from no height difference (A). |
When passing from measurement a) to measurement b), and to measurement c), it is expected eCVP variations corresponding to the elicited ∆P1, ∆P2 variations. For each condition (a, b, c), three repeated VenCoM measurements were carried out.
In a third session (Test 3), as reported in,28 an elicited venous hypertension was induced by applying an occlusive tourniquet (GIMA 25727, Milan, Italy) upstream of the occlusive cuff, and graduating the elastic band to reproduce a quite similar tension between one test and another. The tourniquet was applied in order to induce a venous hypertensive condition, which reproduces the value of a pathological congestive status (eg, within a range 12 ÷20 mmHg).
After 1 minute of applying the tourniquet, the corresponding eCVP value was measured. The eCVP measurement was repeated 3 times, by releasing and applying again the tourniquet with the same tension and position.
Results
Test 1 results showed a repeatability of ±1mmHg for eCVP measurements provided by VenCoM device (Figure 7).
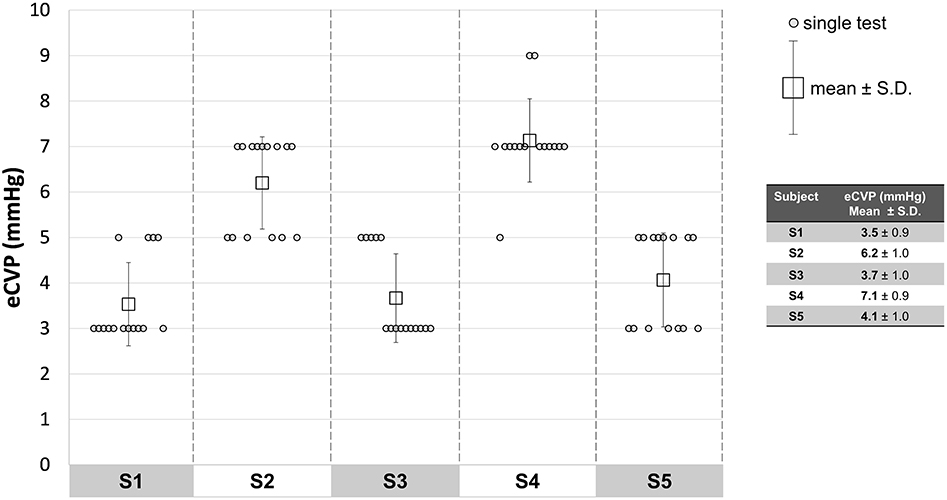 |
Figure 7 Results of repeatability tests, performed in 5 subjects. |
The device was also able to reliably detect the elicited venous pressure variations. Results from Test 2 showed a good correspondence between the elicited small venous pressure variations (∆P1= −2 mmHg, ∆P2= +2 mmHg), and the obtained eCVP measurements (Figure 8).
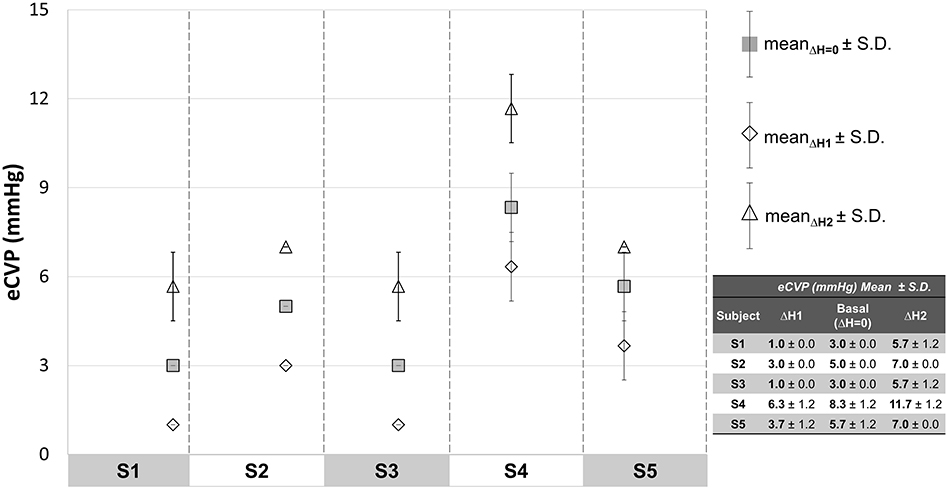 |
Figure 8 Results collected when eliciting small venous pressure variations by changing the relative position between the center of the occlusive cuff and the heart (∆H1, ∆H2). |
In Test 3, the tourniquet application induced a repeatable increase of venous pressure from a basal condition to a venous hypertensive status falling within the pathology range (12÷20 mmHg). The VenCoM device was therefore able to reliably detect such state of venous congestion (Figure 9).
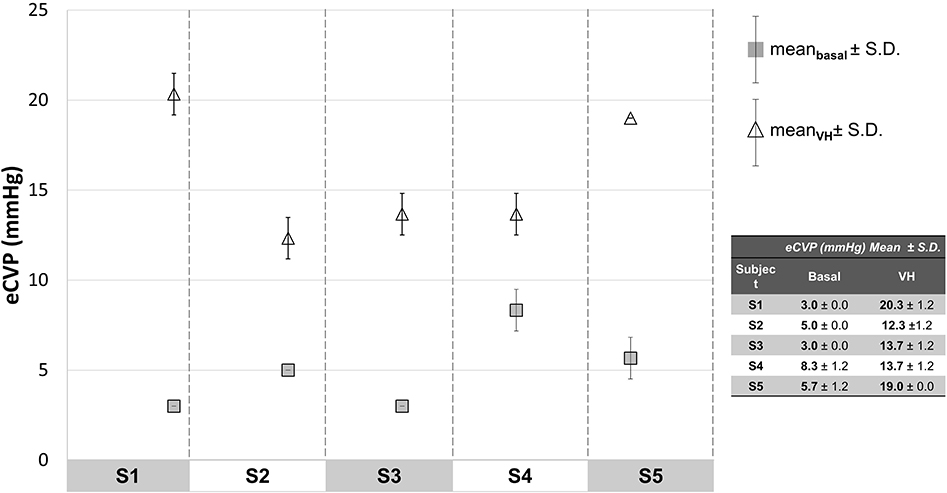 |
Figure 9 Results collected with elicited venous hypertension (VH). |
Discussion
The proposed VenCoM device is an automatic and easy-to-use system, which is able to provide a fast and repeatable CVP estimate. The experimental tests performed on voluntary healthy subjects showed a solid repeatability in the provided eCVP measurements, and the capability of the VenCoM device to reliably detect the elicited venous pressure variations, including small controlled CVP reductions and increases, as well as an induced venous hypertension condition. The great potential of the VenCoM device over the other currently used techniques for CVP assessment is that it may provide a non-invasive measurement, without being operator-dependent. Indeed, even if echo-derived indexes (ie, IVC diameter and collapsibility or Caval Index, IVCCI) are well-accepted and used in the clinical practice for non-invasive CVP assessment, they require highly skilled examiners to be correctly performed, thus they remain essentially operator-dependent, and they are viable only in a hospital or office setting. Conversely, the VenCoM device provides an objective CVP estimation, which is independent from the operator who performs the measurement. Moreover, considering a future release of the device as a sort of “portable venous sphygmomanometer”, it may be suitable also for patients’ self-assessment in home environment.
The main limitation of the described VenCoM device is its current prototypal nature, although the system functionality and principle have been extensively tested in the laboratory setting.
The device needs to be tested on a large sample size of both healthy and pathological subjects. For this purpose, a systematic clinical investigation with the device has been planned including CVP assessment in HF (Stressecho 2020: Prot. N. 592/CE Lazio 1), hepatic and renal dysfunctions, and COVID-19 disease.
For the clinical validation of the device, we have planned to perform VenCoM measurements on a large cohort of outpatients requiring abdominal ultrasound imaging, in order to compare the obtained eCVP values with the echo-derived indexes of non-invasive CVP assessment (ie, IVC diameter and collapsibility or Caval Index, IVCCI).
Indeed, although an ideal gold standard for CVP assessment would be invasive measurements using a manometered tip catheter, such invasive measurements would be impractical and unethical considering the potential risks of catheter insertion, and the patient recruitment would be limited to critical care settings.
For this reason, we chose echo-based CVP assessment, which is considered a well-accepted and reliable non-invasive technique,26,27 that has been favourably validated relative to invasive hemodynamic measurements by numerous past and recent studies,30–33 but not by a recent review,34 which does not seem to support these echo-derived measurements.
In future clinical studies, the inclusion of critically ill patients will be considered in order to validate the VenCoM system also versus invasive CVP measurements.
During the clinical evaluation, we have planned to carry out a usability assessment of the new measurement device, both from the healthcare professionals, eg, collecting their perceived ease of using the device, and from the patients.
In the following sections, we give an overview of potential clinical applications of the novel VenCoM device, including monitoring of venous congestion in heart failure patients and in subjects with hepatic and renal dysfunction, as well as pulmonary hypertension (PH) also extendable to Coronavirus disease 2019 (COVID-19) patients even after recovery.
VenCoM in Heart Failure
Heart Failure (HF) patients represent one of the most common and most fragile hospital populations. In western countries, they are estimated to account for a prevalence of >2% of the population with a 0.3–0.5% annual increase in new cases.47,48 HF prevalence in US is predicted to increase from 2.42% in 2012 to 2.97% in 2030. The frequent hospitalizations and long hospital stays lead to an extremely high economic burden that healthcare institutions need to take on for the management of these patients.49 To cope with this health emergency, a more efficient patient management and better diagnostic tools outside of hospitals are of extreme importance, in order to improve patient monitoring, their quality of life, and to prevent decompensation events reducing hospitalization frequency as a consequence.
It is well known that an increase of cardiac filling pressure anticipates by several days (up to 25) the acute HF event. Patients remain asymptomatic until the dyspnea phase occurs, which usually triggers the need of hospitalization.50,51 Indeed, the increase in filling pressures (hemodynamic congestion) is the first indicator of the onset of the decompensation process, which precedes the “clinical congestion” occurring with the objective symptoms and signs, eg, dyspnoea, orthopnea, cough, pulmonary rales and resulting in hospitalization.
The CVP corresponds to the average pressure in the vena cava or in the right atrium (RAP, Right Atrial Pressure), and in the absence of tricuspid stenosis, it is a direct indicator of the filling pressure of the right ventricle.16 As clearly reported in,52 given the strong relationship between right-sided filling pressures (RAP) and left-sided filling pressures pulmonary capillary wedge pressure (PCWP), accurate estimation of RAP can potentially guide therapy in approximately 80% of chronic heart failure patients.
In this context, the VenCoM device, providing a non-invasive assessment of CVP in hospital, office and home settings, fits perfectly within the strategy to monitor RAP. This allows for the early identification of patients who will present a new episode of acute HF, and for the prompt optimization of their pharmacological treatment for an overall reduction of HF hospitalizations.
An example of VenCoM use for monitoring HF patients is represented in Figure 10.
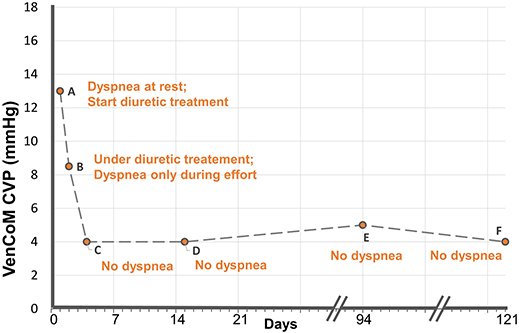 |
Figure 10 Example of CVP trend assessed with VenCoM device in a subject with congestive heart failure before (measurement (A) and after successfully diuretic treatment (B–F measurements). |
The VenCoM device may guide the home management programs for recently hospitalized patients, contributing to improving symptoms, stabilizing decongestion, and preventing rehospitalization. In this perspective, the VenCoM device can offer a non-invasive alternative to the CardioMEMSTM system (by Abbott Laboratories), the first and only FDA-approved wireless implantable HF monitor for the assessment of pulmonary artery pressure (PAP).53 There is no evidence that CVP should be measured continuously during the day’s 24 hours; thus, the possibility of measuring an equivalent parameter through an external tool challenges the use of an implantable device. In addition, CardioMEMS has not been designed to work continuously.
VenCoM measurements can also be useful in categorizing patients admitted with a history of HF according to the previously identified four clinical profiles based on evidence of congestion and perfusion:54 Profile I Warm & Dry representing no congestion or hypoperfusion; profile II Warm & Wet, congestion without hypoperfusion; profile III Cold & Dry, hypoperfusion without congestion; and profile IV Cold & Wet, both congestion and hypoperfusion (Figure 11).
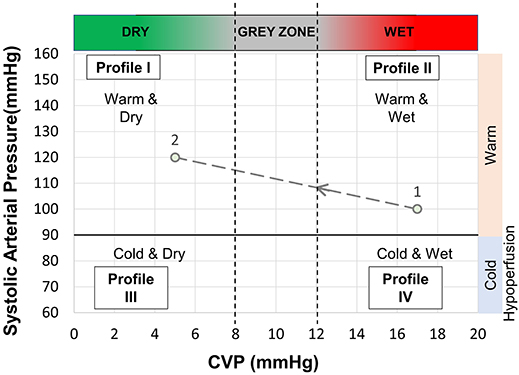 |
Figure 11 Example of use of VenCoM measurements for categorizing HF patient history according to the four clinical profiles of congestion dry/wet and perfusion warm/cold: transition from profile II (point 1) to profile I (point 2), after the infusion of a drug for treating pulmonary hypertension, ie, reducing CVP. |
VenCoM in Hepatic and Renal Dysfunction
The venous congestion, as a consequence of the right-side filling pressure increase and CVP as well, has important implications on secondary organ dysfunction mainly involving the kidneys and liver, as well as a pro-inflammatory effect on other districts like gastrointestinal tract, brain, and skeletal muscles.55 Hence, the VenCoM device could also play an important role for monitoring and for preventing these secondary organ dysfunctions.
With regards to kidneys, it is widely reported that venous congestion is an important factor contributing to the Worsening Renal Function (WRF) that follows HF-related hospitalizations, together with a reduced renal perfusion.56–58 Elevations of central venous pressure are rapidly transmitted to the renal veins, causing increased interstitial and tubular hydrostatic pressures, which decrease net glomerular filtration in both acute and chronic heart failure.59
The direct relationship between the venous congestion and the incidence of WRF is clearly shown in,60 that reports an incremental risk in WRF with increasing categories of baseline CVP with 75% of subjects with a baseline CVP >24 mm Hg developing WRF.
Additional studies confirm such direct relationship between elevated CVP values and renal congestion, as well as an association of increased CVP with reduced survival in a broad spectrum of patients with cardiovascular diseases.8 A recent study61 reports, again, that elevated CVP in HF promotes renal congestion, and underlines how there is no direct method to assess renal congestion. The VenCoM device may represent the answer to this so far unmet need, allowing for new insights on renal congestion.
When hepatic alterations are considered, a correlation between increased CVP and liver cirrhosis has been observed. As reported in,62 the “cardiac cirrhosis” is a typically non-inflammatory disease developing in patients with Right Heart Failure (RHF) and liver congestion, and it seems to be solely related to venous pressure. Increased CVP is associated with a pronounced pro-fibrogenic response and histological fibrosis progression in the absence of inflammation; therefore, patients with longstanding liver congestion during HF are prone to develop pressure-associated liver fibrosis.
Studies63,64 highlight how congestive hepatopathy arises from chronically elevated right sided heart pressures transmitted to the liver by passive venous congestion, and how hepatic congestion due to cardiac causes plays an important role in hepatic fibrosis. Many other studies65–68 demonstrated a linear correlation between CVP and Liver Stiffness (LS), which is not only determined by liver fibrosis, but it is also directly influenced by venous pressure.
Therefore, a non-invasive and accessible CVP measurement like the one provided by VenCoM device can be very useful for the purpose of discriminating those liver congestions that are mainly due to cardiac causes.
VenCoM in Pandemic COVID-19
Non-invasive CVP assessment using VenCoM may also have an important role in the monitoring and classification of pulmonary hypertension (PH) in COVID-19 patients during their hospital stay, as well as after discharge to appropriately manage any persistent or emerging long-term sequelae of the pathology.
Clinical observations in patients with COVID-19 showed that, in addition to the respiratory infection, a systemic inflammatory response occurs, which leads to coagulation disorders and consequent venous thromboembolism that may cause development of PH.69–71 PH, defined by a mean pulmonary artery pressure (mPAP) ≥25 mm Hg at rest, is the most common cause of Right Heart Failure (RHF).72 In patients with severe COVID-19, multiple concomitant mechanisms seem to contribute to the development of PH, this including cytokine storm, endothelial injury, hypercoagulability attributing to development of venous thromboembolism, worsening myocardial injury, and the presence of thrombotic microangiopathy.70
Concurrently, survivors of severe COVID-19 are expected to experience persistent impairment in the pulmonary function (eg, pulmonary fibrosis, elevated pulmonary artery pressures) and are predisposed to develop RHF.73,74 In a recent study,75 it was reported that in a cohort study on 1469 consecutive COVID-19 patients with pneumonia diagnosis, 412 (28%) showed an enlarged main pulmonary artery diameter (MPAD) and resulted to be associated with PH severity at RV catheterization and with higher rate of mortality.76 Elevated CVP may work as a preliminary indicator of right ventricular dysfunction, which is crucial during the development of PH. Elevated mean CVP (>12 mmHg) is independently associated with the occurrence of PH in patients with ARDS, thus highlighting the importance of CVP monitoring in the management of ARDS.77,78
Therefore, the long-term follow-up of cardiopulmonary function for COVID-19 survivors could become a relevant health problem in the near future, given the large number of patients infected by COVID-2019 worldwide. In this context, measuring the venous congestion in a quick and practical manner by the new VenCoM device, could be extremely useful for both the management of clinical PH following COVID-19 during the acute phase, and the monitoring of pulmonary and vascular remodeling effects after recovery to provide the best long-term management of survivors.
VenCoM in Preventive Medicine
Smart non-invasive systems are an interesting solution for home-based and clinic-based health monitoring, providing a safe and comfortable environment for home healthcare, preventive medicine, and public health.
A prospective use in preventive medicine for the VenCoM device is also conceivable, similar to the current widespread adoption of electronic blood pressure monitors.
To date, no stratification for CVP values exists for the healthy population, eg, by sex, age, BMI, since it is not currently possible to measure CVP in a simple and non-invasive way. Such stratification may become increasingly important as the general patient population ages and patients have a variety of pre-existing chronic disease states (such as hypertension, heart failure, diabetes, and chronic obstructive pulmonary disease) that may have a direct reflection on an increased CVP.
Clinical experience shows the significant incidence of hepatic and renal pathologies in correspondence with an HF-derived venous congestion (CVP>12 mmHg),55 independently from the reduced cardiac output.9
A more general vision might lead to hypothesize the existence of a still unexplored “grey zone” CVP = 8÷12 mmHg), in which venous congestion has no clinical evidence, but may contribute, if persistent in the long term, to develop secondary organ dysfunctions, like hepatic and renal alterations (Figure 12).
 |
Figure 12 Scheme depicting the supposed CVP-based stratification of population in normal/grey zone/congestion that could be achieved by measuring CVP in a simple and non-invasive way, for preventive medicine purposes. |
A future widespread use of the VenCoM device in the normal asymptomatic population would pave the way to define a CVP-based stratification for preventive purposes; the device could be used, for example, to identify the grey zone in those subjects, who are at higher risk of developing congestion-related diseases.
Conclusions
In this work, we have introduced a novel, non-invasive device for the hospital, office and home assessment of CVP. Compared to the currently used and proposed non-invasive techniques for CVP assessment, the VenCoM device has the advantage of being an automatic and easy-to-use system which is able, in proof of concept healthy subjects, to provide a fast and repeatable CVP estimate.
The device needs to be tested further on a large sample size of both healthy and pathological subjects, to systematically validate its reliability and impact in clinical setting.
Disclosure
E.M., L.C., B.B. have served as consultants for TRE ESSE Progettazione Biomedica srl. within the consultancy agreement between DIMES Department of Alma Mater Studiorum - Università di Bologna, and TRE ESSE Progettazione Biomedica srl.
G.P. is the Scientific Director of TRE ESSE Progettazione Biomedica srl; in addition, G.P. has patents pending: 1 Italian Patent Application (IT201900010248, Filed: 27 June 2019); Dispositivo per la rilevazione della pressione venosa; Applicant: TRE ESSE Progettazione Biomedica srl; Inventor: Gianni Plicchi; 1 PCT Application (PCT/IB2020/055060, Filed 28 May 2020): Device for venous pressure sensing; Applicant: TRE ESSE Progettazione Biomedica srl; Inventor: Gianni Plicchi.
The authors reported no other potential conflicts of interest for this work.
References
1. Magder S. Central venous pressure monitoring. Current Opinion in Critical Care. 2006;12(3):219–227. doi:10.1097/01.ccx.0000224866.01453.43.
2. Monge García MI, Santos Oviedo A. Why should we continue measuring central venous pressure? Medicina Intensiva. 2017;41(8):483–486. doi:10.1016/j.medin.2016.12.006.
3. Dellinger RP, Levy MM, Rhodes A, et al. Surviving sepsis campaign: international guidelines for management of severe sepsis and septic shock: 2012. Crit Care Med. 2013;41(2):580–637. doi:10.1097/CCM.0b013e31827e83af.
4. Hariri RJ, et al. Traumatic brain injury, hemorrhagic shock, and fluid resuscitation: effects on intracranial pressure and brain compliance. J Neurosurg. 1993;79(3):421–427. doi:10.3171/jns.1993.79.3.0421.
5. Isaacson IJ, Lowdon JD, Berry AJ, et al. The value of pulmonary artery and central venous monitoring in patients undergoing abdominal aortic reconstructive surgery: a comparative study of two selected, randomized groups. J Vasc Surg. 1990;12(6):754–760. doi:10.1067/mva.1990.24456.
6. Pilcher DV, Scheinkestel CD, Snell GI, Davey-Quinn A, Bailey MJ, Williams TJ. High central venous pressure is associated with prolonged mechanical ventilation and increased mortality after lung transplantation. J Thorac Cardiovasc Surg. 2005;129(4):912–918. doi:10.1016/j.jtcvs.2004.07.006.
7. Stevenson LW, Tillisch JH, Hamilton M, et al. Importance of hemodynamic response to therapy in predicting survival with ejection fraction less than or equal to 20% secondary to ischemic or nonischemic dilated cardiomyopathy. Am J Cardiol. 1990;66(19):1348–1354. doi:10.1016/0002-9149(90)91166-4.
8. Damman K, van Deursen VM, Navis G, Voors AA, van Veldhuisen DJ, Hillege HL. Increased central venous pressure is associated with impaired renal function and mortality in a broad spectrum of patients with cardiovascular disease. J Am Coll Cardiol. 2009;53(7):582–588. doi:10.1016/j.jacc.2008.08.080.
9. Cops J, Mullens W, Verbrugge FH, et al. Selective abdominal venous congestion induces adverse renal and hepatic morphological and functional alterations despite a preserved cardiac function. Sci Rep. 2018;8(1):17757. doi:10.1038/s41598-018-36189-3.
10. Teichgräber UK, Gebauer B, Benter T, Wagner HJ. Central venous access catheters: radiological management of complications. Cardiovasc Intervent Radiol. 2003;26(4):321–333. doi:10.1007/s00270-003-0112-z.
11. Arenas-Marquez H, Anaya-Prado R, Barrera-Zepeda LM, Gonzalez-Ojeda A. Complications of central venous catheters. Curr Opin Clin Nutr Metab Care. 2001;4(3):207–210. doi:10.1097/00075197-200105000-00007.
12. Girbes ARJ. Mechanical and infectious complications of central venous catheters. Minerva Anestesiol. 2003;69(5):330–332.
13. Ruesch S, Walder B, Tramèr MR. Complications of central venous catheters: internal jugular versus subclavian access–a systematic review. Crit Care Med. 2002;30(2):454–460. doi:10.1097/00003246-200202000-00031.
14. Amar D, Melendez JA, Zhang H, Dobres C, Leung DH, Padilla RE. Correlation of peripheral venous pressure and central venous pressure in surgical patients. J Cardiothorac Vasc Anesth. 2001;15(1):40–43. doi:10.1053/jcan.2001.20271.
15. Charalambous C, et al. Comparison of peripheral and central venous pressures in critically Ill patients. Anaesth Intensive Care. 2003;31(1):34–39. doi:10.1177/0310057X0303100106.
16. McGee SR. Physical examination of venous pressure: a critical review. Am Heart J. 1998;136(1):10–18. doi:10.1016/s0002-8703(98)70175-9.
17. Constant J. Using internal jugular pulsations as a manometer for right atrial pressure measurements. Cardiology. 2000;93(1–2):26–30. doi:10.1159/000006998.
18. Cook DJ, Simel DL. The Rational Clinical Examination. Does this patient have abnormal central venous pressure? JAMA. 1996;275(8):630–634.
19. Rizkallah J, Jack M, Saeed M, Shafer LA, Vo M. Non-invasive bedside assessment of central venous pressure: scanning into the future. PLoS One. 2014;9(10):e109215. doi:10.1371/journal.pone.0109215.
20. Jauhar S. The demise of the physical exam. Engl J Med. 2006;354(6):548–551. doi:10.1056/NEJMp068013.
21. Lipton B. Estimation of central venous pressure by ultrasound of the internal jugular vein. Am J Emerg Med. 2000;18(4):432–434. doi:10.1053/ajem.2000.7335.
22. Stevenson LW, Perloff JK. The limited reliability of physical signs for estimating hemodynamics in chronic heart failure. JAMA. 1989;261(6):884–888.
23. Baumann UA, Marquis C, Stoupis C, Willenberg TA, Takala J, Jakob SM. Estimation of central venous pressure by ultrasound. Resuscitation. 2005;64(2):193–199. doi:10.1016/j.resuscitation.2004.08.015.
24. Marcelino P, Fernandes AP, Marum S, Ribeiro JP. Non-invasive evaluation of central venous pressure by echocardiography. Rev Port Cardiol Orgao Soc Port Cardiol Port J Cardiol Off J Port Soc Cardiol. 2002;21(2):125–133.
25. Brennan JM, Ronan A, Goonewardena S, et al. Handcarried ultrasound measurement of the inferior vena cava for assessment of intravascular volume status in the outpatient hemodialysis clinic. Clin J Am Soc Nephrol . 2006;1(4):749–753. doi:10.2215/CJN.00310106.
26. Rudski LG, et al. Guidelines for the Echocardiographic Assessment of the Right Heart in Adults: a Report from the American Society of Echocardiography. Endorsed by the European Association of Echocardiography, a registered branch of the European Society of Cardiology, and the Canadian Society of Echocardiography. J Am Soc Echocardiogr. 2010;23(7):
27. Porter TR, Shillcutt SK, Adams MS, et al. Guidelines for the use of echocardiography as a monitor for therapeutic intervention in adults: a report from the American Society of Echocardiography. J Am Soc Echocardiogr off Publ Am Soc Echocardiogr. 2015;28(1):40–56. doi:10.1016/j.echo.2014.09.009.
28. Thalhammer C, Aschwanden M, Odermatt A, et al. Noninvasive central venous pressure measurement by controlled compression sonography at the forearm. J Am Coll Cardiol. 2007;50(16):1584–1589. doi:10.1016/j.jacc.2007.07.022.
29. Thalhammer C, Aschwanden M, Odermatt A, et al. Non-invasive central venous pressure measurement by compression ultrasound–a step into real life. Resuscitation. 2009;80(10):1130–1136. doi:10.1016/j.resuscitation.2009.06.027.
30. Wiwatworapan Ratanajaratroj W, Sookananchai B. Correlation between inferior vena cava diameter and central venous pressure in critically ill patients. J Med Assoc Thail Chotmaihet Thangphaet. 2012;95(3):320–324.
31. Dipti A, Soucy Z, Surana A, Chandra S. Role of inferior vena cava diameter in assessment of volume status: a meta-analysis. Am J Emerg Med. 2012;30(8):1414–1419. doi:10.1016/j.ajem.2011.10.017.
32. Yildirimturk O, Tayyareci Y, Erdim R, et al. Assessment of right atrial pressure using echocardiography and correlation with catheterization. J Clin Ultrasound JCU. 2011;39(6):337–343. doi:10.1002/jcu.20837.
33. Schefold JC, Storm C, Bercker S, et al. Inferior vena cava diameter correlates with invasive hemodynamic measures in mechanically ventilated intensive care unit patients with sepsis. J Emerg Med. 2010;38(5):632–637. doi:10.1016/j.jemermed.2007.11.027.
34. Alavi-Moghaddam M, Kabir A, Shojaee M, Manouchehrifar M, Moghimi M. Ultrasonography of inferior vena cava to determine central venous pressure: a meta-analysis and meta-regression. Acta Radiol Stockh Swed. 2017;58(5):537–541. doi:10.1177/0284185116663045.
35. Sathish N, Singh NG, Nagaraja PS, et al. Comparison between noninvasive measurement of central venous pressure using near infrared spectroscopy with an invasive central venous pressure monitoring in cardiac surgical Intensive Care Unit. Ann Card Anaesth. 2016;19(3):405–409. doi:10.4103/0971-9784.185520.
36. Ward KR, et al. A new noninvasive method to determine central venous pressure. Resuscitation. 2006;70(2):238–246. doi:10.1016/j.resuscitation.2005.12.013.
37. Ward KR, Tiba MH, Draucker GT, et al. A novel noninvasive impedance-based technique for central venous pressure measurement. Shock Augusta Ga. 2010;33(3):269–273. doi:10.1097/SHK.0b013e3181ab9b9b.
38. TRE ESSE Progettazione Biomedica srl - Bologna, Italy - [email protected].
39. Christopoulos DG, Nicolaides AN, Szendro G, Irvine AT, Bull ML, Eastcott HH. Air-plethysmography and the effect of elastic compression on venous hemodynamics of the leg. J. Vasc. Surg. 1987;5(1):148–159. doi:10.1067/mva.1987.avs0050148.
40. Raju S, Knepper J, May C, Knight Pace A, Jayaraj A. Ambulatory venous pressure, air plethysmography, and the role of calf venous pump in chronic venous disease. J Vasc Surg Venous Lymphat Disord. 2019;7(3):428–440. doi:10.1016/j.jvsv.2018.08.009.
41. Bays RA, Healy DA, Atnip RG, Neumyer M, Thiele BL. Validation of air plethysmography, photoplethysmography, and duplex ultrasonography in the evaluation of severe venous stasis. J Vasc Surg. 1994;20(5):721–727. doi:10.1016/s0741-5214(94)70159-8.
42. Halliwill JR, Minson CT, Joyner MJ. Measurement of limb venous compliance in humans: technical considerations and physiological findings. J Appl Physiol. 1999;87(4):1555–1563. doi:10.1152/jappl.1999.87.4.1555.
43. Christ F, Gamble J, Baschnegger H, Gartside IB. Relationship between venous pressure and tissue volume during venous congestion plethysmography in man. J Physiol. 1997;503(Pt 2):463–467. doi:10.1111/j.1469-7793.1997.463bh.x.
44. Bauer A, Bruegger D, Gamble J, Christ EF. Influence of different cuff inflation protocols on capillary filtration capacity in human calves – a congestion plethysmography study. J Physiol. 2002;543(Pt 3):1025–1031. doi:10.1113/jphysiol.2002.018291.
45. Gamble J, Gartside IB, Christ F. A reassessment of mercury in silastic strain gauge plethysmography for microvascular permeability assessment in man. J Physiol. 1993;464:407–422. doi:10.1113/jphysiol.1993.sp019642.
46. Tugrul M, Camci E, Pembeci K, Al-Darsani A, Telci L. Relationship between peripheral and central venous pressures in different patient positions, catheter sizes, and insertion sites. J Cardiothorac Vasc Anesth. 2004;18(4):446–450. doi:10.1053/j.jvca.2004.05.022.
47. Virani SS, Alonso A, Benjamin EJ, et al. Heart disease and stroke statistics-2020 update: a report from the American Heart Association. Circulation. 2020;141(9):e139–e596. doi:10.1161/CIR.0000000000000757.
48. Mosterd A, Hoes AW. Clinical epidemiology of heart failure. Heart Br Card Soc. 2007;93(9):1137–1146. doi:10.1136/hrt.2003.025270.
49. Chun S, Tu JV, Wijeysundera HC, et al. Lifetime analysis of hospitalizations and survival of patients newly admitted with heart failure. Circ Heart Fail. 2012;5(4):414–421. doi:10.1161/CIRCHEARTFAILURE.111.964791.
50. Zile MR, et al. Transition from chronic compensated to acute decompensated heart failure: pathophysiological insights obtained from continuous monitoring of intracardiac pressures. Circulation. 2008;118(14):1433–1441. doi:10.1161/CIRCULATIONAHA.108.783910.
51. Adamson PB. Pathophysiology of the transition from chronic compensated and acute decompensated heart failure: new insights from continuous monitoring devices. Curr Heart Fail Rep. 2009;6(4):287–292. doi:10.1007/s11897-009-0039-z.
52. Drazner MH, Hamilton MA, Fonarow G, Creaser J, Flavell C, Stevenson LW. Relationship between right and left-sided filling pressures in 1000 patients with advanced heart failure. J Heart Lung Transplant off Publ Int Soc Heart Transplant. 1999;18(11):1126–1132. doi:10.1016/s1053-2498(99)00070-4.
53. Heywood JT, Jermyn R, Shavelle D, et al. Impact of practice-based management of pulmonary artery pressures in 2000 patients implanted with the CardioMEMS sensor. Circulation. 2017;135(16):
54. Nohria A, et al. Clinical assessment identifies hemodynamic profiles that predict outcomes in patients admitted with heart failure. J Am Coll Cardiol. 2003;41(10):1797–1804. doi:10.1016/s0735-1097(03)00309-7.
55. Rosenkranz S, Howard LS, Gomberg-Maitland M, Hoeper MM. Systemic consequences of pulmonary hypertension and right-sided heart failure. Circulation. 2020;141(8):678–693. doi:10.1161/CIRCULATIONAHA.116.022362.
56. Damman K, Testani JM. The kidney in heart failure: an update. Eur. Heart J. 2015;36(23):1437–1444. doi:10.1093/eurheartj/ehv010.
57. Fudim M, Ambrosy AP. A balancing act: preserving renal function and the need for decongestion. J Card Fail. 2019;25(8):643–644. doi:10.1016/j.cardfail.2019.06.007.
58. Chen X, Wang X, Honore PM, Spapen HD, Liu D. Renal failure in critically ill patients, beware of applying (central venous) pressure on the kidney. Ann Intensive Care. 2018;8(1):91. doi:10.1186/s13613-018-0439-x.
59. Costanzo MR. Ultrafiltration in Acute Heart Failure. Card Fail Rev. 2019;5(1):9–18. doi:10.15420/cfr.2018.29.2.
60. Mullens W, et al. Importance of venous congestion for worsening of renal function in advanced decompensated heart failure. J Am Coll Cardiol. 2009;53(7):589–596. doi:10.1016/j.jacc.2008.05.068.
61. Afsar B, Ortiz A, Covic A, Solak Y, Goldsmith D, Kanbay M. Focus on renal congestion in heart failure. Clin Kidney J. 2016;9(1):39–47. doi:10.1093/ckj/sfv124.
62. Mueller S. Does pressure cause liver cirrhosis? The sinusoidal pressure hypothesis. World J Gastroenterol. 2016;22(48):10482–10501. doi:10.3748/wjg.v22.i48.10482.
63. Lemmer A, VanWagner LB, Ganger D. Assessment of advanced liver fibrosis and the risk for hepatic decompensation in patients with congestive hepatopathy. Hepatology. 2018;68(4):1633–1641. doi:10.1002/hep.30048.
64. Takahashi T, Watanabe T, Shishido T, et al. The impact of non-alcoholic fatty liver disease fibrosis score on cardiac prognosis in patients with chronic heart failure. Heart Vessels. 2018;33(7):733–739. doi:10.1007/s00380-017-1113-1.
65. Villemain O, Sitefane F, Pernot M, et al. Toward noninvasive assessment of CVP variations using real-time and quantitative liver stiffness estimation. JACC Cardiovasc Imaging. 2017;10(10 Pt B):1285–1286. doi:10.1016/j.jcmg.2017.01.018.
66. Jalal Z, Iriart X, De Lédinghen V, et al. Liver stiffness measurements for evaluation of central venous pressure in congenital heart diseases. Heart Br Card Soc. 2015;101(18):1499–1504. doi:10.1136/heartjnl-2014-307385.
67. Millonig G, et al. Liver stiffness is directly influenced by central venous pressure. J Hepatol. 2010;52(2):206–210. doi:10.1016/j.jhep.2009.11.018.
68. Mueller S, Sandrin L. Liver stiffness: a novel parameter for the diagnosis of liver disease. Hepatic Med Evid Res. 2010;2:49–67. doi:10.2147/hmer.s7394.
69. McGonagle D, O’Donnell JS, Sharif K, Emery P, Bridgewood C. Immune mechanisms of pulmonary intravascular coagulopathy in COVID-19 pneumonia. Lancet Rheumatol. 2020;2(7):e437–e445. doi:10.1016/S2665-9913(20)30121-1.
70. Potus F, Mai V, Lebret M, et al. Novel insights on the pulmonary vascular consequences of COVID-19. Am J Physiol - Lung Cell Mol Physiol. 2020;319(2):L277–L288. doi:10.1152/ajplung.00195.2020.
71. Dhawan RT, et al. Beyond the clot: perfusion imaging of the pulmonary vasculature after COVID-19. Lancet Respir Med. 2021;9(1):107–116. doi:10.1016/S2213-2600(20)30407-0.
72. Zelt JGE, Chaudhary KR, Cadete VJ, Mielniczuk LM, Stewart DJ. Medical therapy for heart failure associated with pulmonary hypertension. Circ Res. 2019;124(11):1551–1567. doi:10.1161/CIRCRESAHA.118.313650.
73. Park JF, Banerjee S, Umar S. In the eye of the storm: the right ventricle in COVID-19. Pulm Circ. 2020;10(3). doi:10.1177/2045894020936660.
74. Ullah W, Saeed R, Sarwar U, Patel R, Fischman DL. COVID-19 complicated by acute pulmonary embolism and right-sided heart failure. JACC Case Rep. 2020;2(9):1379–1382. doi:10.1016/j.jaccas.2020.04.008.
75. Esposito A, et al. Chest CT-derived pulmonary artery enlargement at the admission predicts overall survival in COVID-19 patients: insight from 1461 consecutive patients in Italy. Eur Radiol. 2020. doi:10.1007/s00330-020-07622-x.
76. Truong U, et al. Update on noninvasive imaging of right ventricle dysfunction in pulmonary hypertension. Cardiovasc Diagn Ther. 2020;10(5):
77. Li D-K, Mao J-Y, Long Y, Liu D-W, Wang X-T. Pulmonary hypertension with adult respiratory distress syndrome: prevalence, clinical impact, and association with central venous pressure. Pulm Circ. 2020;10(3):2045894020933087. doi:10.1177/2045894020933087.
78. Feng W-X, Yang Y, Wen J, Liu Y-X, Liu L, Feng C. Implication of inhaled nitric oxide for the treatment of critically ill COVID-19 patients with pulmonary hypertension. ESC Heart Fail. 2020. doi:10.1002/ehf2.13023.
 © 2021 The Author(s). This work is published and licensed by Dove Medical Press Limited. The full terms of this license are available at https://www.dovepress.com/terms.php and incorporate the Creative Commons Attribution - Non Commercial (unported, v3.0) License.
By accessing the work you hereby accept the Terms. Non-commercial uses of the work are permitted without any further permission from Dove Medical Press Limited, provided the work is properly attributed. For permission for commercial use of this work, please see paragraphs 4.2 and 5 of our Terms.
© 2021 The Author(s). This work is published and licensed by Dove Medical Press Limited. The full terms of this license are available at https://www.dovepress.com/terms.php and incorporate the Creative Commons Attribution - Non Commercial (unported, v3.0) License.
By accessing the work you hereby accept the Terms. Non-commercial uses of the work are permitted without any further permission from Dove Medical Press Limited, provided the work is properly attributed. For permission for commercial use of this work, please see paragraphs 4.2 and 5 of our Terms.