")
Back to Journals » Journal of Hepatocellular Carcinoma » Volume 8
A Novel Metabolism-Related Signature as a Candidate Prognostic Biomarker for Hepatocellular Carcinoma
Authors Wang Z, Embaye KS, Yang Q, Qin L, Zhang C, Liu L, Zhan X, Zhang F , Wang X, Qin S
Received 26 November 2020
Accepted for publication 1 February 2021
Published 16 March 2021 Volume 2021:8 Pages 119—132
DOI https://doi.org/10.2147/JHC.S294108
Checked for plagiarism Yes
Review by Single anonymous peer review
Peer reviewer comments 2
Editor who approved publication: Dr Ahmed Kaseb
Zhihao Wang,1 Kidane Siele Embaye,1 Qing Yang,2 Lingzhi Qin,1 Chao Zhang,1 Liwei Liu,1 Xiaoqian Zhan,1 Fengdi Zhang,3 Xi Wang,1 Shenghui Qin1
1Institute of Pathology, Tongji Hospital, Tongji Medical College, Huazhong University of Science and Technology, Wuhan, 430030, People’s Republic of China; 2Department of Pharmacy, Hiser Medical Center of Qingdao, Qingdao, 266033, People’s Republic of China; 3Department of Pathology, Wuhan Third Hospital, Wuhan, 430030, People’s Republic of China
Correspondence: Shenghui Qin
Institute of Pathology, Tongji Hospital, Tongji Medical College, Huazhong University of Science and Technology, Wuhan, 430030, People’s Republic of China
Tel +86-15102744765
Fax + 86-027-87541509
Email [email protected]
Purpose: Given that metabolic reprogramming has been recognized as an essential hallmark of cancer cells, this study sought to investigate the potential prognostic values of metabolism-related genes (MRGs) for the diagnosis and treatment of hepatocellular carcinoma (HCC).
Methods: In total, 2752 metabolism-related gene sequencing data of HCC samples with clinical information were obtained from the International Cancer Genome Consortium (ICGC) and The Cancer Genome Atlas (TCGA). One hundred and seventy-eight the differentially expressed MRGs were identified from the ICGC cohort and TCGA cohort. Then, univariate Cox regression analysis was performed to identify these genes that were related to overall survival (OS). A novel metabolism-related prognostic signature was developed using the least absolute shrinkage and selection operator (Lasso) and multivariate Cox regression analyses in the ICGC dataset. The Broad Institute’s Connectivity Map (CMap) was used in predicting which compounds on the basis of the prognostic MRGs. Furthermore, the signature was validated in the TCGA dataset. Finally, the expression levels of hub genes were validated in HCC cell lines by Western blotting (WB) and quantitative real-time PCR (qRT-PCR).
Results: We found that 17 MRGs were most significantly associated with OS in HCC. Then, the Lasso and multivariate Cox regression analyses were applied to construct the novel metabolism-relevant prognostic signature, which consisted of six MRGs. The prognostic value of this prognostic model was further successfully validated in the TCGA dataset. Further analysis indicated that this particular signature could be an independent prognostic indicator after adjusting to other clinical factors. Six MRGs (FLVCR1, MOGAT2, SLC5A11, RRM2, COX7B2, and SCN4A) showed high prognostic performance in predicting HCC outcomes. Candidate drugs that aimed at hub ERGs were identified. Finally, hub genes were chosen for validation and the protein, mRNA expression of FLVCR1, SLC5A11, and RRM2 were significantly increased in human HCC cell lines compared to normal human hepatic cell lines, which were in agreement with the results of differential expression analysis.
Conclusion: Our data provided evidence that the metabolism-related signature could serve as a reliable prognostic and predictive tool for OS in patients with HCC.
Keywords: hepatocellular carcinoma, metabolism-related genes, prognostic signature, biomarker
Introduction
According to the 2018 Global Cancer Statistics, liver cancer is the sixth most common human malignancy worldwide (841,080 cases/year) and the fourth leading cause of cancer-related deaths (781,631 cases/year).1 Hepatocellular carcinoma (HCC) originates from hepatocytes and accounts for the vast majority (approximately 75–85%) of primary liver cancers. Despite recent advances in early detection and management, mortality from HCC still remains high due to the low rate of early diagnosis.2 Therefore, it is necessary to urgently identify effective prognostic biomarkers and therapeutic targets to complement and improve current screening strategies for HCC diagnosis and prognosis.
Recently, metabolic reprogramming has been recognized as a novel and essential hallmark of cancer cells.3 Cancer cells are able to regulate their metabolism to promote the production of energy, the synthesis of macromolecules and the maintenance of redox balance so as to support their rapid cell growth and proliferation.4,5 Increased glycolysis under normoxic condition (Warburg effect) and glutamine metabolism are the best characterized metabolic changes seen in tumor cells.5,6 Accumulating evidence has indicated that abnormal metabolism is associated with poor prognosis in many tumor types, including HCC.7,8 Luo et al9 screened the combination of phenylalanyl-tryptophan and glycine as liver cancer metabolic markers, and confirmed that their diagnostic sensitivity was superior to AFP. A series of combined markers, such as lactic acid, glycolamine, phenylalanine, aconitic acid and ribose, were screened for identification of patients with and without recurrence.10 A recent study revealed thousands of metabolism-relevant genes encoding all known human metabolic enzymes and transporters,11 however, the definitive role and underlying mechanisms of them in the development and prognosis of HCC remains poorly understood. More importantly, there are few models based on metabolism-related genes to predict the prognosis of HCC patients. Thus, it is of great clinical significance to establish a novel metabolism-related prognostic signature that can reliably predict the prognosis of HCC.
In this study, we identified the differentially expressed MRGs in HCC patients by associating the gene expression profiles with MRGs in two database systems, namely, TCGA and the ICGC. The functional enrichment analysis and prognostic value of the differentially expressed MRGs were also determined. The prognostic model was finally established based on Cox regression and Lasso regression analyses. To verify the accuracy of the model, the Kaplan-Meier (KM) estimator and the receiver operating characteristic (ROC) curve were applied. Moreover, the prognostic value of our metabolism-related prognostic model was further validated in TCGA database.
Materials and Methods
Data Collection
The transcriptomic and the corresponding clinical data of patients with hepatocellular carcinoma (HCC) were downloaded from the International Cancer Genome Consortium (ICGC; https://icgc.org/) and The Cancer Genome Atlas (TCGA; https://portal.gdc.cancer.gov/) databases. The RNA-seq data, including 243 HCC and 202 adjacent non-tumor cases from ICGC database, and 374 HCC and 50 adjacent non-tumor cases from TCGA database were examined. The current study did not require ethical approval, because all data had been collected from publicly available data in the ICGC and TCGA databases.
The Differentially Expressed MRGs Screening
In total, 2752 metabolism-related genes (MRGs), which have been reported to encode all known human metabolic enzymes and transporters, were obtained from Possemato’s research.11 The differentially expressed MRGs in HCC and normal tissues were detected using the Wilcoxon test method.12 |logFC|>1 and adjusted p<0.05 were considered as significant. MRGs with common differential expression were identified from the ICGC and the TCGA databases by using FunRich software. These intersection MRGs were selected for further analyses.
Functional Enrichment Analysis of MRGs
Gene Ontology (GO)13 and Kyoto Encyclopedia of Genes and Genomes (KEGG) pathway enrichment analysis14 were performed by “clusterprofiler” R package and “enrichplot” R package in R software.15 Functional categories with false discovery rate (FDR) of less than 0.05 were considered statistically significant.
Survival-Associated MRGs
We collected clinical information of 232 HCC patients from the ICGC database. A total of 3 patients who were followed for less than 30 days or more than 2000 days were excluded to avoid the interference of irrelevant factors. Survival analysis was performed on 229 patients. To screen out the MRGs associated with prognosis in HCC patients, univariate Cox analysis was implemented by the R “survival” package, and data were visualized using forest plots. Only differentially expressed MRGs with a p value <0.001 were considered for subsequent analyses. To screen candidate small molecules that might be useful for HCC patients, the Broad Institute’s Connectivity Map (CMap) was used in predicting which compounds on the base of the prognostic MRGs.16
Construction of Metabolism-Related Signature for HCC
HCC patients in ICGC were used for constructing the COX prognostic signature, and patients in TCGA dataset were used for validating the signature. Lasso and multivariate Cox regression analyses were performed to construct a prognostic model.17 To avoid overfitting of the prognostic signature and consequent removal of highly related survival-related prognostic MRGs, Lasso Cox regression was carried out using R “survival” and “glmnet” package. MRGs detected via Lasso algorithm were evaluated by stepwise multivariate Cox regression analysis. By weighting the estimated Cox regression coefficients, the model of tumor-related metabolism genes risk was constructed.18 The prognostic metabolism-related gene signatures were shown as risk score = Ʃ (βi × Expi), where βi referred to the coefficients and represented the weight of the respective signature, whereas Expi represented the expression value. Based on the risk score formula, patients were assigned into the low-risk group and high-risk group with the median risk score as the cut-off point. The Kaplan-Meier (K-M) survival curve was used with the Log rank test to evaluate the differences in survival rate between the two groups. Furthermore, the receiver operating characteristic (ROC) curve was implemented by R “survival ROC” package19 and the corresponding Area Under the ROC Curve (AUC) was measured to assess the sensitivity and specificity of the metabolism-related signature.
Validation of Metabolism-Related Signature
To verify the prognostic value of metabolism-related signature, we used the TCGA database as a validation cohort. The same formula was used to calculate the risk scores for each patient. Survival and ROC curve analyses were implemented as described above. In addition, univariate and multivariate analyses were used to estimate the effect of risk scores on OS and the clinicopathologic features. We also explored the correlation between the expression of these MRGs and several clinical features. For further validation of our analyses, the Human Protein Atlas (HPA) online database (http://www.proteinatlas.org/) was applied to identify the expression of these MRGs at a translational level.20
Cell Culture
Human normal hepatocyte cell line (LO2) and HCC cell lines (HepG2, Hep3B, HLF and PLC/PRF/5) which were purchased from National Collection of Authenticated Cell Cultures (https://www.cellbank.org.cn) were maintained in the DMEM medium (Gibco, Wuhan, China) with 10% heat-inactivated fetal bovine serum (FBS, GibcoBRL) and antibiotics of 1% streptomycin and penicillin at 37° C in an atmosphere of 5% CO2.
Quantitative Real-Time PCR
Total RNA from collected cells was extracted using TRIzol reagent. Quantitative real-time PCR was performed as described previously.21 The primer pairs used were as follows: human SLC5A11 (forward 5′-CCAAGGACATTCAGCACTGG-3′ and reverse 5′-GAAGCCATAGAAACAGCGGG-3′), human FLVCR1 (forward 5′-AGCTCTTCAAGACAGTCCCC-3′ and reverse 5′-TTAGCCCAATCCTTCCAGCA-3′), human RRM2 (forward 5′- CCAAGGACATTCAGCACTGG-3′ and reverse 5′-GAAGCCATAGAAACAGCGGG-3′), and human GAPDH (forward 5′-TCAAGAAGGTGGTGAAGCAGG-3′ and reverse 5′-TCAAAGGTGGAGGAGTGGGT-3′). The results were normalized to GAPDH.
Western Blotting Analysis
The protein extraction and Western blot analysis were performed as described previously.22
Statistical Analysis
All statistical analyses were performed by version 3.6.1 of R software (https://www.r-project.org/) and version 3.1.3 of FunRich software (http://www.funrich.org/), along with version 3.7.2 of Cytoscape software (http://www.cytoscape.org/). If not otherwise stated, data were considered to be statistically significant with p value <0.05.
Results
Identification of Differentially Expressed MRGs
The flowchart of our study was shown in Figure S1. A total of 2752 MRGs that encoded all known human metabolic enzymes and transporters were obtained from Possemato’s study11 (Table S1), and we matched these genes with the sequence data of HCC related mRNA in the ICGC and TCGA databases. The differentially expressed MRGs from HCC and normal samples were identified by Wilcoxon rank-sum test. Considering the cutoff criteria (adjusted p value <0.05 and |log FC| > 1.0), 475 differentially expressed MRGs (consisting of 94 downregulated and 381 upregulated genes) were extracted from the ICGC database (Figure 1A and C, Table S2), and 251 differentially expressed MRGs (consisting of 36 downregulated and 215 upregulated genes) were extracted from the TCGA database (Figure 1B and D, Table S3). Finally, a total of 178 differentially expressed MRGs that were common for both databases (consisting of 28 downregulated and 150 upregulated genes) (Figure 1E, Table S4) were selected for subsequent analysis.
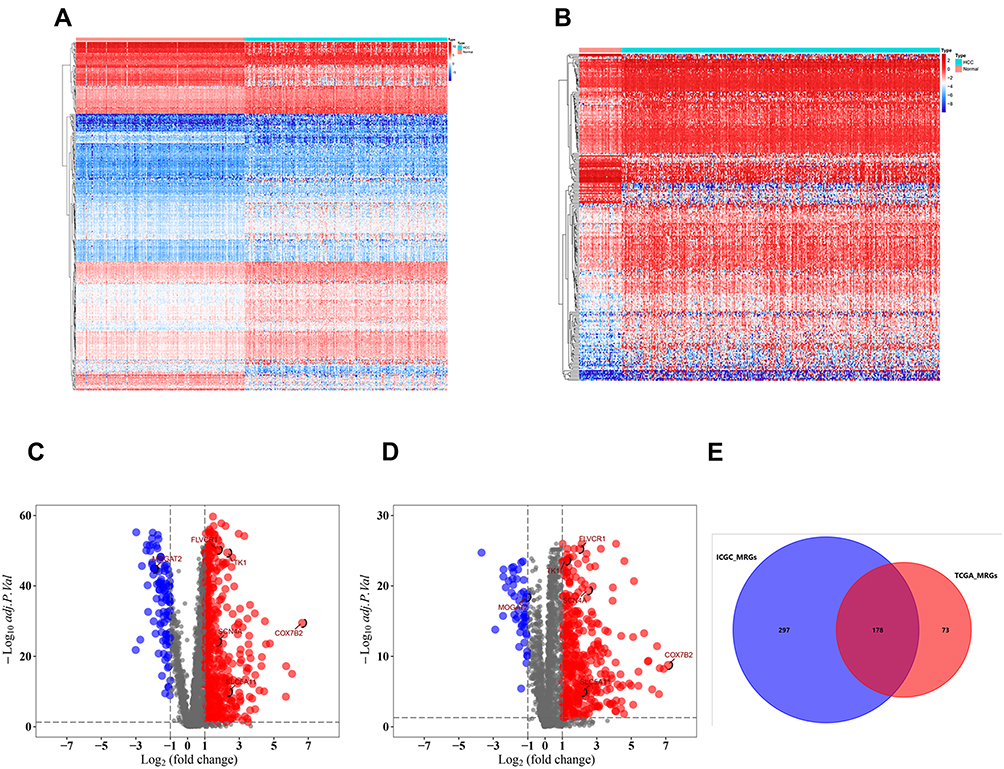 |
Figure 1 Differentially expressed metabolism-related genes (MRGs) in hepatocellular carcinoma (HCC). Heatmap of MRGs between HCC and nontumor tissues in ICGC database (A) and TCGA database (B). The color from blue to red represents the progression from low expression to high expression; Volcano plot of MRGs in ICGC database (C) and TCGA database (D). The red dots in the plot represents upregulated genes and blue dots represents downregulated genes with statistical significance. Black dots represent no differentially expressed genes. (E) Venn diagram showing the gene numbers of the MRGs of HCC in ICGC and TCGA database. |
GO, KEGG and PPI Analysis of Metabolism-Related DEGs
To evaluate the potential molecular mechanisms of MRGs in HCC, the 178 differentially expressed MRGs were further analyzed by GO functional annotation and KEGG pathway enrichment. The results showed the top 10 biological processes including GO terms, cellular component GO terms, molecular function GO terms (Figure 2A), and the top 10 KEGG pathway terms (Figure 2C). The correlation between the intersection genes and the top 5 biological processes (organic anion transport, organic acid transport, carboxylic acid transport, lipid catabolic process, and monovalent inorganic cation transport) was shown in Figure 2B. The KEGG analysis revealed that the intersection genes were associated with lipid metabolism and amino acid metabolism, especially arachidonic acid metabolism.
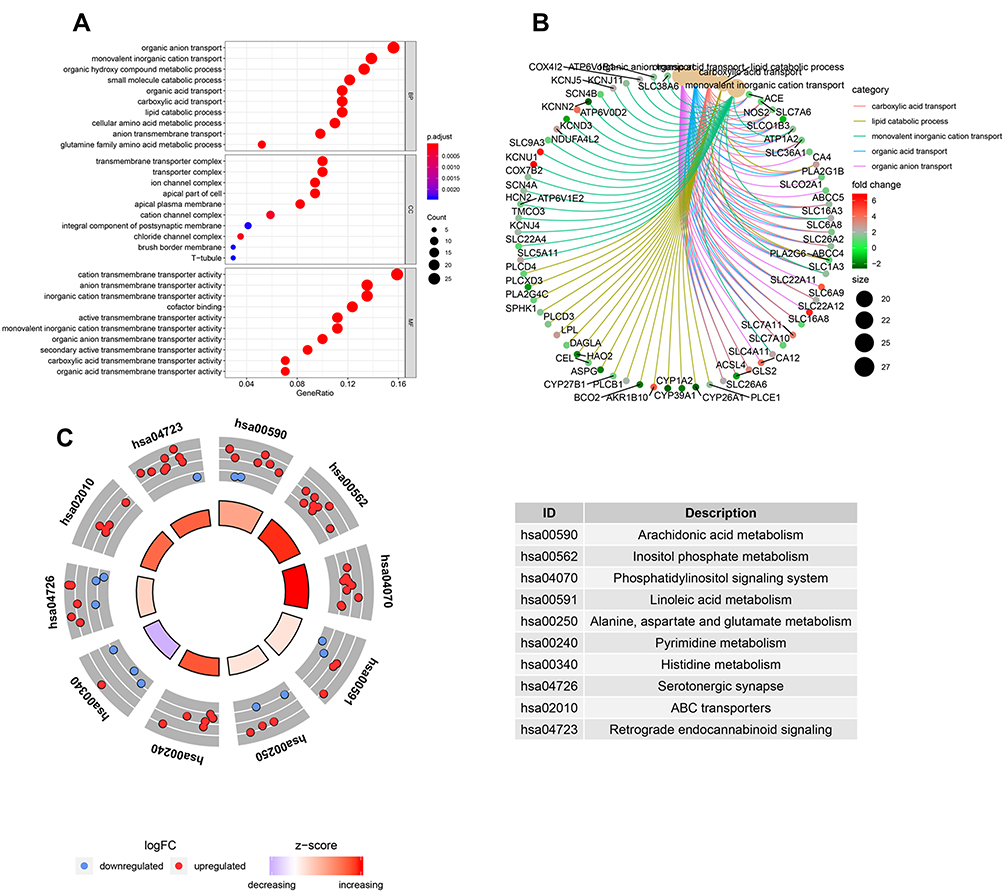 |
Figure 2 The GO and KEGG analysis of differentially expressed MRGs. (A) the top 10 of biological processes GO terms, cellular component GO terms, molecular function GO terms. (B) The correlation between intersection genes and top 5 biological processes GO terms. (C) The KEGG pathway analysis of differentially expressed MRGs. |
Prognostic Values and Candidate Drugs of Survival-Related MRGs
To better define the characteristics of survival-related MRGs, we explored the differentially expressed MRGs associated with survival in HCC samples. In the univariate Cox proportional hazards regression analysis, 17 genes with significant effects on prognosis were identified. The resulting forest plot shown in Figure 3A demonstrated that 15 genes have the characteristics of HR>1, whereas 2 genes have the characteristics of HR<1. This suggested that most survival-related MRGs were risk factors for HCC prognosis. According to CMap database analysis, Cmap mode-of-action (MoA) analysis of 21 compounds indicated 11 mechanisms of action shared by the above drugs (Figure 3B), five drugs (BRD-K34437622, carmofur, raltitrexed, tegafur, capecitabine) shared the MoA of thymidylate synthase inhibitor, four drugs (CO-102862, flecainide, mexiletine, zonisamide) shared the MoA of sodium channel blocker, three drugs (cladribine, clofarabine, gemcitabine) shared the MoA of ribonucleoside reductase inhibitor, and two drugs (floxuridine, fludarabine) shared the MoA of DNA synthesis inhibitor. Our study identified candidate drugs targeting the survival-related MRGs, and might provide therapeutic targets for further analysis (Figure 3B). Furthermore, scatter plots were used to display the expression patterns of 17 differentially expressed MRGs from HCC and normal liver tissues in ICGC database (Figure 3C) and TCGA database (Figure 3D). Scatter plot showed expression patterns of 1 down-regulated genes (MOGAT2) and 16 up-regulated genes (ASRGL1, COX7B2, MTHFD1L, B3GALNT1, ITPKA, SCN4A, PLCB1, NQO1, RRM2, FLVCR1, TMCO3, CAD, TK1, TYMS, SLC5A11 and SPNS1) (Figure 3C and D).
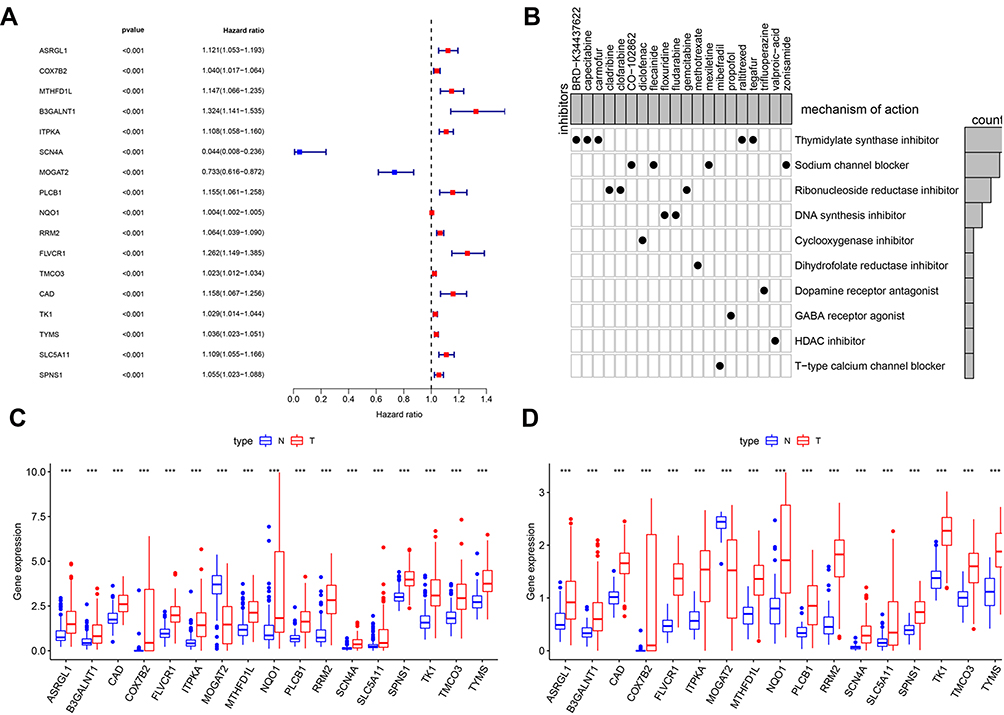 |
Figure 3 Identification of survival-related differentially expressed MRGs and candidate drugs. (A) Forest plot of hazard ratios showing survival-related MRGs. p values <0.001 are considered to be statistically significant. (B) CMap database analysis identifies novel candidate drugs targeting the prognostic genes. The expression of 17 metabolism-related prognostic genes between HCC and normal tissues in ICGC database (C) and TCGA database (D), the red box shows the gene expression in HCC and the blue box shows the gene expression in normal liver tissue, ***p < 0.001. |
Construction of Metabolism-Related Prognostic Signature for HCC
The clinical data of 229 HCC patients in ICGC database and 193 HCC patients in TCGA database are shown in Table 1. To establish the metabolism-associated prognostic signature, the Lasso regression and multivariate Cox proportional hazards regression analyses were conducted. The Lasso regression analysis was applied to exclude genes that might be highly correlated with other genes (Figure 4A and B, Table S5). Then, a prognostic signature model was established based on six MRGs selected from further multivariate Cox regression analysis (Figure 4C). Finally, a prognostic model was constructed to evaluate the prognosis of each patient as follows: Risk score = (0.031755×expression value of COX7B2) + (−2.27007×expression value of SCN4A) + (−0.15919 ×expression value of MOGAT2) + (0.164689×expression value of FLVCR1) + (0.02915×expression value of RRM2) + (0.068413×expression value of SLC5A11).
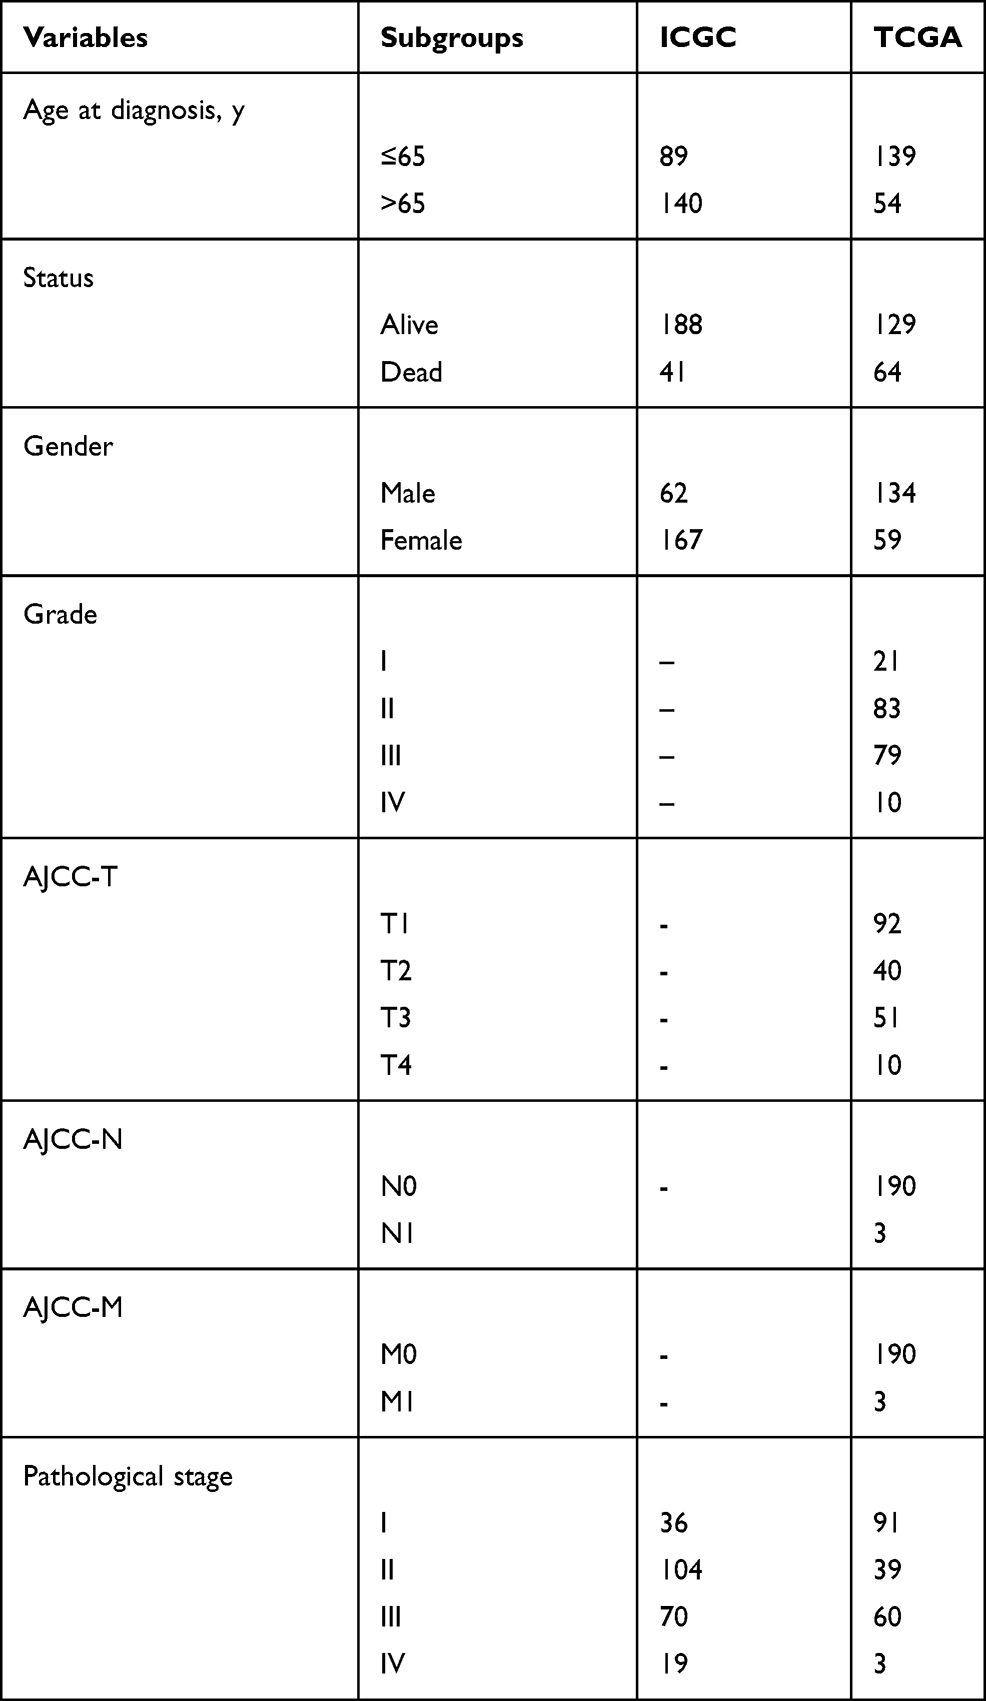 |
Table 1 Clinical Characteristics of Hepatocellular Carcinoma Patients in the ICGC and TCGA Database |
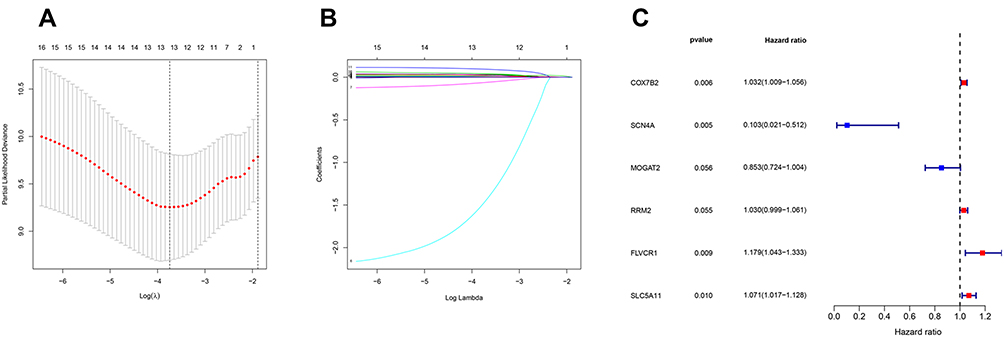 |
Figure 4 Establishment of metabolism-related prognostic signature. (A) Screening of optimal parameter (lambda) at which the vertical lines were drawn. (B) Lasso coefficient profiles of the seventeen MRGs with non-zero coefficients determined by the optimal lambda. (C) Multivariate analyses assessing relationship between expression levels of MRGs and OS in patients with HCC. |
Then, the risk score of each patient was calculated according to this prognostic model. Based on the median risk score, 229 HCC patients were classified into a high-risk group (n = 114) and a low-risk group (n = 115). The risk score, survival status and gene expression heatmap of these prognostic MRGs are presented in Figure 5A–C. Kaplan-meier Log rank test indicated that patients in the high-risk group showed markedly poorer OS than those in the low-risk group (Figure 5D). Areas under the curve with the value of the signature predicting 1-, 3- and 4-year OS rates were 0.805, 0.803 and 0.94, respectively, indicating that this prognostic model exhibited a good sensitivity and specificity (Figure 5E). Since only one patient had a follow-up period of 5 years, we did not plot the ROC curve for 5 years.
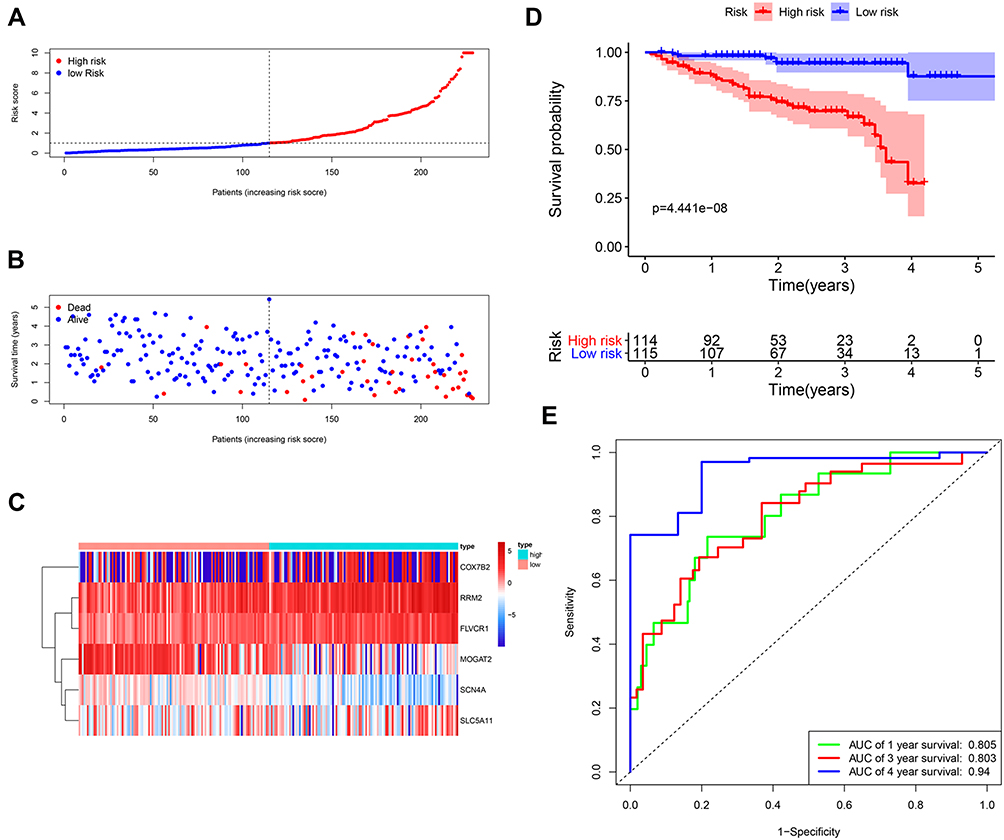 |
Figure 5 Construction of the metabolism-based prognostic risk signature in the ICGC cohorts. (A) The risk score distribution of HCC patients. (B) Survival status and duration of patients; (C) Heatmap of the metabolism‐related genes expression; (D) Survival curves for the low-risk and high-risk groups. (E) Time-independent receiver operating characteristic (ROC) analysis of risk scores for prediction the overall survival in the ICGC set. |
Validation of the Metabolism-Related Prognostic Signature by TCGA Database
The TCGA database including 193 HCC samples was used for the validation of metabolism-related signature. According to the median risk score, we divided patients into high-risk (n = 80) and low-risk groups (n = 113). Consistent with the results derived from the ICGC dataset, the Kaplan–Meier curve demonstrated that patients in the high-risk group exhibited markedly poorer OS than those in the low-risk group (p< 0.001; Figure 6D). The risk score, survival status and gene expression heatmap of these prognostic MRGs are shown in Figure 6A–C. The AUCs for 1-, 3- and 5-year OS rates were 0.721, 0.693 and 0.737, respectively (Figure 6E). Univariate and multivariate Cox regression analyses were conducted to evaluate the independent prediction ability of metabolism-related prognostic signature between the signature and other common prognostic factors, such as age, gender, histological grade, pathological stage and TNM stage. Although univariate Cox analysis indicated that pathologic stage, T stage and our model were markedly associated with OS (Figure 6F, p<0.001), after the multivariate analysis, only metabolism-related prognostic signature (p<0.001) could be used as an independent prognostic factor (Figure 6G). These results demonstrated that this prognostic model exhibited great applicability and stability in predicting the prognosis of HCC patients.
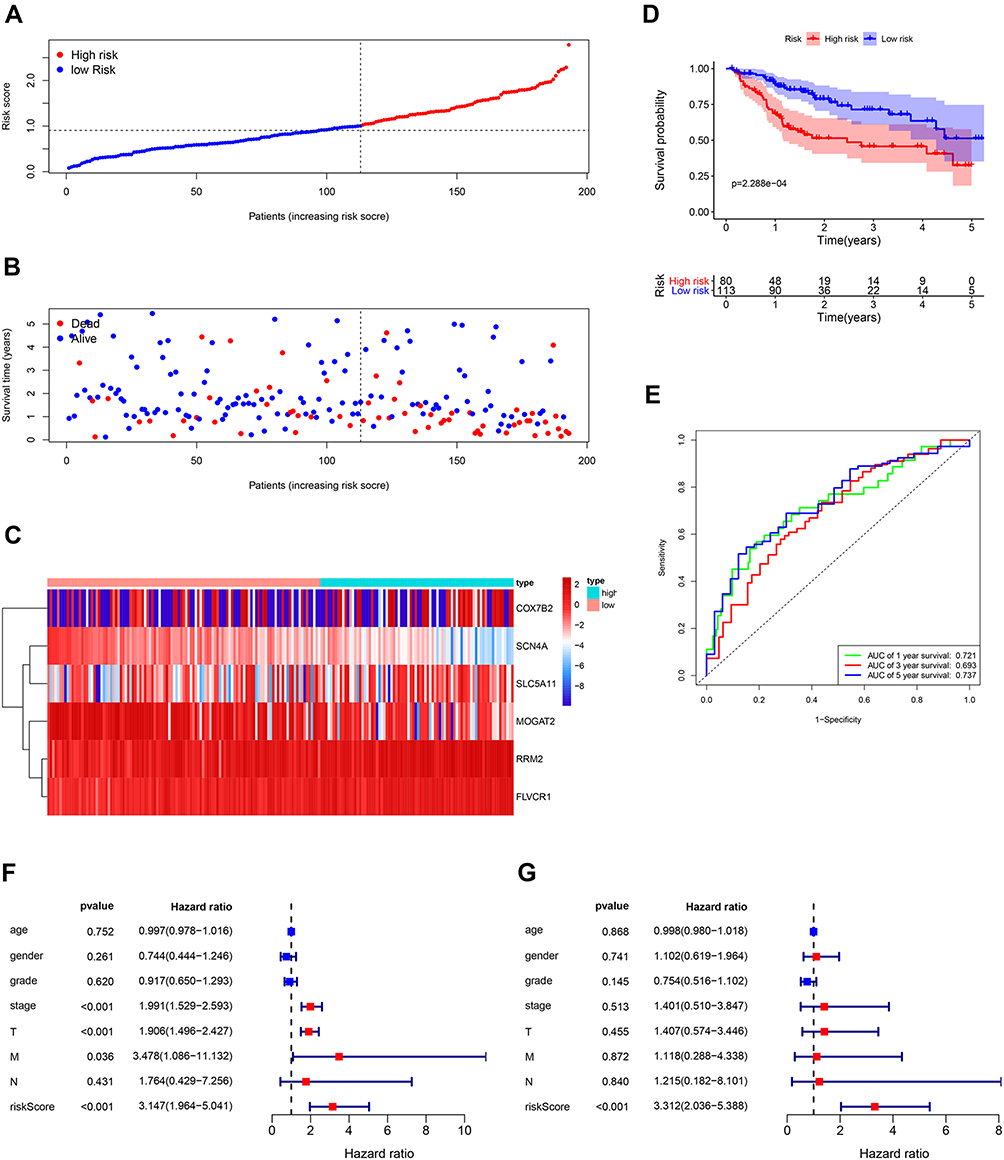 |
Figure 6 Validation of the metabolism-based prognostic risk signature in the TCGA cohorts. (A) The risk score distribution of HCC patients. (B) Survival status and duration of patients. (C) Heatmap of the metabolism-related genes expression. (D) Survival curves for the low-risk and high-risk groups. (E) Time-independent receiver operating characteristic (ROC) analysis of risk scores for prediction the overall survival in the TCGA set. (F) Univariate Cox regression analysis of discrete clinical factors. (G) Multivariate Cox regression analysis of discrete clinical factors. |
To validate the MRGs in this model, the protein expression levels were analyzed using the HPA database. The results showed that FLVCR1, SLC5A11, MOGAT2, and RRM2 protein levels matched their mRNA expression levels (Figure 7). However, representative images of the SCN4A and COX7B2 protein levels were not available in the HPA database.
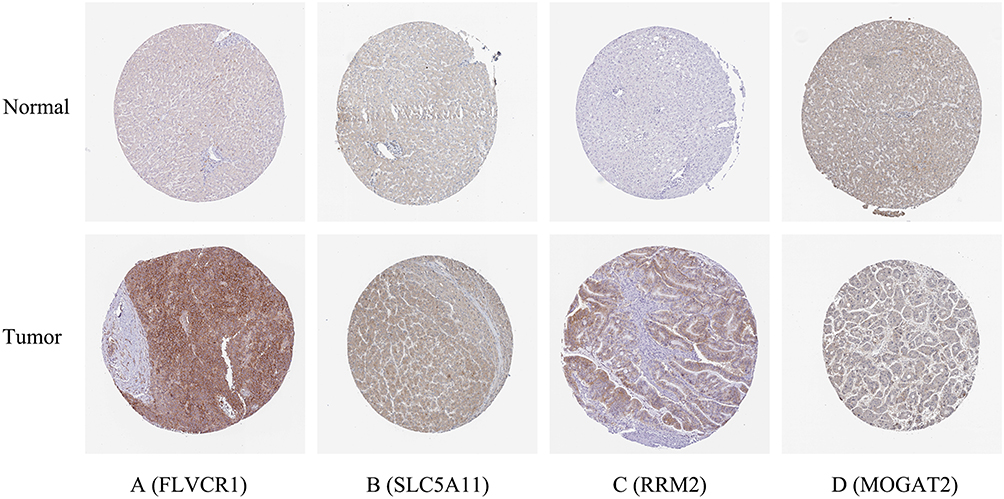 |
Figure 7 Verification of hub MRGs expression in HCC and normal liver tissue using the HPA database. (A) FLVCR1, (B) SLC5A11, (C) RRM2, (D) MOGAT2. |
Clinical Value of Prognostic Signature
To further evaluate the clinical value of MRGs, the relationship between MRGs’ prognostic indicators and clinical features were investigated, and the results indicated that FLVCR1, MOGAT2, RRM2, SCN4A, and COX7B2 were differentially expressed in patients with various clinical features (Figure 8). To validate the clinical value of the metabolism-related prognostic signatures, the association between the risk score and clinical characteristics was subsequently assessed, and the results demonstrated that high-risk scores were positively associated with histological grade, and survival status in patients with HCC (Figure 8).
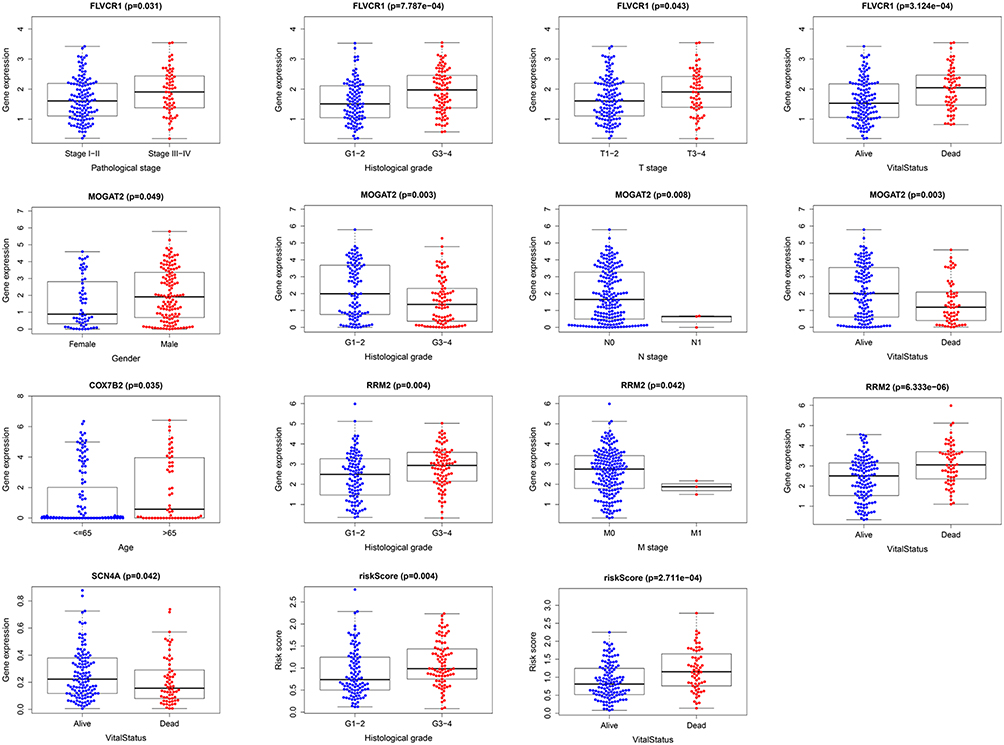 |
Figure 8 Relationships between MRGs expression and clinicopathological factors in HCC (p < 0.05). |
Validation of Hub Genes by WB and qRT-PCR
In order to further validate the hub genes expression in the lab, FLVCR1, SLC5A11 and RRM2 were tested by WB and qRT-PCR in normal hepatocyte cell line (LO2) and HCC cell lines (HepG2, Hep3B, HLF and PLC/PRF/5). As illustrated in Figure 9, the protein and mRNA expression levels of FLVCR1, SLC5A11 and RRM2 were significantly increased in human hepatocellular carcinoma cell lines compared with LO2, which were consistent with our bioinformatics analysis results.
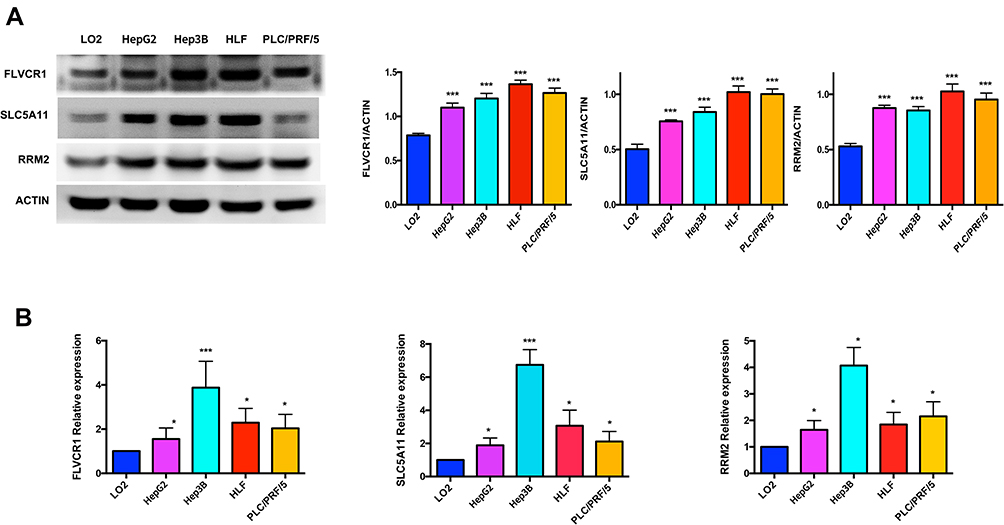 |
Figure 9 Validation of hub genes by WB and qRT-PCR. The protein and mRNA expression of FLVCR1, SLC5A11 and RRM2 were further validated in HCC cell lines by WB (A) and qRT-PCR (B). *p < 0.05, ***p < 0.001. |
Discussion
The metabolic changes and regulatory mechanisms involved in hepatocellular carcinoma are very complex and thus need further elucidation. HCC is different from normal liver tissue in terms of glucose metabolism, lipid metabolism and protein metabolism, and also different from other tumors. These disparate metabolic phenotypes provide a theoretical basis for therapeutic strategies targeting tumor metabolism in patients with HCC. To date, there are only few reports on MRGs-based prognostic signatures for HCC patients. Therefore, there is an urgent need to determine reliable metabolic biomarkers and predictive models to predict the prognosis of patients with HCC.
In the current study, based on the analysis of ICGC dataset and TCGA dataset, 178 differentially expressed MRGs were screened. In order to better understand how differentially expressed MRGs were involved in biological processes and signal transduction processes, GO and KEGG enrichment analyses were conducted. The results of the GO enrichment revealed that the above genes were primarily related to metabolic response. The KEGG pathways were mainly focused on metabolism-related pathways. In univariate regression analysis, performed for the differentially expressed metabolism-related genes, 17 genes were detected to display significant association with OS. Then, the metabolism-related prognostic model based on six prognostic MRGs (FLVCR1, MOGAT2, RRM2, SCN4A, SLC5A11, and COX7B2) was constructed by the Lasso and multivariate Cox regression analyses. Using this model, every HCC patient was assigned a particular risk score. The differences in survival between patients with low and high scores were significant in both the ICGC cohorts and the TCGA cohorts. The ROC curves and AUCs indicated that both models of the ICGC and TCGA cohorts performed well. Furthermore, we confirmed the important roles of MRGs in HCC through immunohistochemistry. Finally, FLVCR1, SLC5A11 and RRM2 were successfully validated with their high expression in HCC cell lines, which were in agreement with the results of bioinformatics analysis, indicating that bioinformatics analysis method was reliable.
Six metabolism-related genes that constituted the prognosis model were identified as potential biomarkers of HCC. SLC5A11, an inositol-specific sodium-dependent glucose cotransporter responsible for inositol uptake, has been reportedly related to anaplastic thyroid carcinoma, but its relationship with HCC has not been described previously.23,24 In this study, our results indicated SLC5A11 might act as a potential oncogene in HCC. Several previous reports indicated that Ribonucleotide Reductase M2 subunit (RRM2) played an important role in the proliferation, invasion and metastasis of tumor cells, and thereby participating in many types of malignancies tumor including HCC.25–27 A study done by Liu et al revealed that HBV induced upregulation of RRM2 and promoted the development of HCC, while suppression of RRM2 inhibited the growth of HCC.28 In line with these studies, we demonstrated a high expression of RRM2 that might serve as a poor prognostic factor for HCC. Monoacylglycerol O-acyltransferase 2 (MOGAT2), a member of MOGAT gene family, played an important role in the monoacylglycerol pathway for triacylglycerol synthesis and was highly expressed in the small intestine and liver of humans.29,30 Recent studies have shown that MOGAT2 was an attractive target for the treatment of obesity, type 2 diabetes mellitus, and nonalcoholic steatohepatitis.31,32 Lian et al reported that MOGAT2 could have applications as a novel biomarker affecting the metastasis of colorectal cancer treatment.33 So far, little is known about the existence of molecular links between MOGAT2 and HCC. In our study, however, MOGAT2 was found to be highly decreased which might indicate its protective role as a prognostic marker in HCC. Sodium voltage-gated channel alpha subunit 4 (SCN4A), encoding a skeletal muscle voltage-gated sodium channel, Nav1.4,34 has been reportedly associated with neuromuscular disorders like hypo- and hyperkalaemic periodic paralyses, paramyotonia congenita, sodium channel myotonias and congenital myasthenic syndrome.35 However, its underlying molecular mechanisms in cancers have not been explored. Liang et al reported that the single nucleotide polymorphism of the cytochromooxidase VIIb 2 (COX7B2) gene was associated with familial nasopharyngeal carcinoma.36 On the other hand, COX7B2 was found to be a susceptibility gene for type 2 diabetes in an extended Arab family.37 Nevertheless, little is known about the roles of COX7B2 in human cancers and other diseases. Herein, we demonstrated that COX7B2 was overexpressed in patients with HCC. Feline leukemia virus subgroup C receptor 1 (FLVCR1) encoding a ubiquitous heme exporter was demonstrated to promote the proliferation and tumorigenicity through inhibiting apoptosis and autophagy.38,39 Recently, Wei et al reported that FLVCR1 showed the intracellular overproduction in HCC cell lines and that FLVCR1 expression was significantly associated with survival in HCC patients, which was consistent with our study.40
In the current study, we not only identified six powerful MRGs prognostic signature for HCC, but also provided potential drugs for targeted therapy by targeting these six hub genes. As predicted, part of the 21 targeted drugs were already used in clinical for HCC treatment. Hepatic arterial infusion chemotherapy with raltitrexed and oxaliplatin post-TACE was a safe and efficacious therapy for patients with HCC.41 Capecitabine could be considered an active and safe option in advanced HCC, especially for patients unfit for other treatments.42 On the other hand, we developed six hub genes expression in cholangiocarcinoma (another common liver cancer), only FLVCRL1 and RRM2 were significantly overexpressed in cholangiocarcinoma, but all six hub genes expression could not be prognostic signatures for CholangiocarcinomaD patients (Figure S2). They were also not overexpressed in liver tissue from pathologies, such as cholestasis, NASH, cirrhosis (data were not shown). Herein, six powerful MRGs prognostic signatures were specific to HCC.
Although our research provides new insights into the treatment of HCC, there are some limitations. Firstly, the diagnostic efficiency and prognostic value of the key genes were analyzed and verified only in TCGA dataset. Therefore, predictive performance needs to be validated in other independent databases. Secondly, further experimental studies are needed to validate the predictive value of the six MRGs based on tumor samples and clinical data. In addition, more in vivo and in vitro experiments should be conducted in order to explore the functional role of the critical genes in the setting of HCC.
Conclusions
In this study, we assessed the expression profiles of metabolism-related genes based on both ICGC and TCGA databases. Moreover, a novel metabolism-related prognostic model was constructed, which could serve as an independent prognostic predictor for patients with HCC. The prognostic value of the metabolism-related prognostic model was further validated in TCGA database. Candidate drugs that aimed at hub ERGs were identified. Finally, the protein and mRNA expression were further validated in human hepatocellular carcinoma cell lines. Taken together, our findings may provide a novel prognostic model that would be effective in predicting the prognosis of HCC patients and providing targeted candidates drug for treatment.
Supplementary Materials and Methods
The Supplementary Materials and Methods file includes details of the expression and prognosis value of hub genes in cholangiocarcinoma (assessed by GEPIA database43).
Data Sharing Statement
All data used in this study were acquired from The Cancer Genome Atlas (TCGA) and the International Cancer Genome Consortium (ICGC) portal.
Funding
This research was supported by a grant from the National Natural Science Foundation of China (Grant 81700012).
Disclosure
The authors declare that they have no conflicts of interest for this work.
References
1. Bray F, Ferlay J, Soerjomataram I, Siegel RL, Torre LA, Jemal A. Global cancer statistics 2018: GLOBOCAN estimates of incidence and mortality worldwide for 36 cancers in 185 countries. CA Cancer J Clin. 2018;68(6):394–424. doi:10.3322/caac.21492
2. Bruix J, Reig M, Sherman M. Evidence-based diagnosis, staging, and treatment of patients with hepatocellular carcinoma. Gastroenterology. 2016;150(4):835–853. doi:10.1053/j.gastro.2015.12.041
3. Hanahan D, Weinberg RA. Hallmarks of cancer: the next generation. Cell. 2011;144(5):646–674. doi:10.1016/j.cell.2011.02.013
4. Jones RG, Thompson CB. Tumor suppressors and cell metabolism: a recipe for cancer growth. Genes Dev. 2009;23(5):537–548. doi:10.1101/gad.1756509
5. Hsu PP, Sabatini DM. Cancer cell metabolism: warburg and beyond. Cell. 2008;134(5):703–707. doi:10.1016/j.cell.2008.08.021
6. Qu W, Oya S, Lieberman BP, et al. Preparation and characterization of L- 5-C-11 -glutamine for metabolic imaging of tumors. J Nucl Med. 2012;53(1):98–105. doi:10.2967/jnumed.111.093831
7. Kroemer G, Pouyssegur J. Tumor cell metabolism: cancer’s Achilles’ heel. Cancer Cell. 2008;13(6):472–482. doi:10.1016/j.ccr.2008.05.005
8. Heiden MGV, Cantley LC, Thompson CB. Understanding the Warburg Effect: the metabolic requirements of cell proliferation. Science. 2009;324(5930):1029–1033. doi:10.1126/science.1160809
9. Luo P, Yin P, Hua R, et al. A Large-scale, multicenter serum metabolite biomarker identification study for the early detection of hepatocellular carcinoma. Hepatology. 2018;67(2):662–675. doi:10.1002/hep.29561
10. Ye G, Zhu B, Yao Z, et al. Analysis of urinary metabolic signatures of early hepatocellular carcinoma recurrence after surgical removal using gas chromatography-mass spectrometry. J Proteome Res. 2012;11(8):4361–4372. doi:10.1021/pr300502v
11. Possemato R, Marks KM, Shaul YD, et al. Functional genomics reveal that the serine synthesis pathway is essential in breast cancer. Nature. 2011;476(7360):346–U119. doi:10.1038/nature10350
12. Noble WS. How does multiple testing correction work? Nat Biotechnol. 2009;27(12):1135–1137. doi:10.1038/nbt1209-1135
13. Harris MA, Clark JI, Ireland A, et al. The gene ontology (GO) project in 2006. Nucleic Acids Res. 2006;34:D322–D326.
14. Kanehisa M, Furumichi M, Tanabe M, Sato Y, Morishima K. KEGG: new perspectives on genomes, pathways, diseases and drugs. Nucleic Acids Res. 2017;45(D1):D353–D361. doi:10.1093/nar/gkw1092
15. Yu G, Wang L-G, Han Y, He Q-Y. clusterProfiler: an R package for comparing biological themes among gene clusters. OMICS. 2012;16(5):284–287. doi:10.1089/omi.2011.0118
16. Lamb J, Crawford ED, Peck D, et al. The connectivity Map: using gene-expression signatures to connect small molecules, genes, and disease. Science. 2006;313(5795):1929–1935. doi:10.1126/science.1132939
17. Sauerbrei W, Royston P, Binder H. Selection of important variables and determination of functional form for continuous predictors in multivariable model building. Stat Med. 2007;26(30):5512–5528. doi:10.1002/sim.3148
18. Zhang Z, Reinikainen J, Adeleke KA, Pieterse ME, Groothuis-Oudshoorn CGM. Time-varying covariates and coefficients in Cox regression models. Ann Transl Med. 2018;6(7):121. doi:10.21037/atm.2018.02.12
19. Heagerty PJ, Lumley T, Pepe MS. Time-dependent ROC curves for censored survival data and a diagnostic marker. Biometrics. 2000;56(2):337–344. doi:10.1111/j.0006-341X.2000.00337.x
20. Thul PJ, Akesson L, Wiking M, et al. A subcellular map of the human proteome. Science. 2017;356:eaal3321. doi:10.1126/science.aal3321
21. Qin L, Qin S, Zhang Y, et al. p120 modulates LPS-induced NF-κB activation partially through RhoA in bronchial epithelial cells. Biomed Res Int. 2014;2014:932340. doi:10.1155/2014/932340
22. Qin S, Qin L, Zhang C, et al. p120-Catenin modulating nuclear factor-κB activation is partially RhoA/ROCKdependent in scratch injury. Wound Repair Regen. 2015;23(2):231–240. doi:10.1111/wrr.12270
23. Higgins BD, Kane MT. Inositol transport in mouse embryonic stem cells. Reprod Fertil Dev. 2005;17(6):633–639. doi:10.1071/RD05021
24. Kasaian K, Wiseman SM, Walker BA, et al. The genomic and transcriptomic landscape of anaplastic thyroid cancer: implications for therapy. Bmc Cancer. 2015;15. doi:10.1186/s12885-015-1955-9
25. Zhong Z, Cao Y, Yang S, Zhang S. Overexpression of RRM2 in gastric cancer cell promotes their invasiveness via AKT/NF-kappa B signaling pathway. Pharmazie. 2016;71(5):280–284.
26. Wang N, Zhan T, Ke T, et al. Increased expression of RRM2 by human papillomavirus E7 oncoprotein promotes angiogenesis in cervical cancer. Br J Cancer. 2014;110(4):1034–1044. doi:10.1038/bjc.2013.817
27. Tian H, Ge C, Li H, et al. Ribonucleotide reductase M2B inhibits cell migration and spreading by early growth response protein 1-mediated phosphatase and tensin homolog/Akt1 pathway in hepatocellular carcinoma. Hepatology. 2014;59(4):1459–1470. doi:10.1002/hep.26929
28. Liu X, Xu Z, Hou C, et al. Inhibition of hepatitis B virus replication by targeting ribonucleotide reductase M2 protein. Biochem Pharmacol. 2016;103:118–128. doi:10.1016/j.bcp.2016.01.003
29. Yen CL, Farese RV. MGAT2, a monoacylglycerol acyltransferase expressed in the small intestine. J Biol Chem. 2003;278(20):18532–18537. doi:10.1074/jbc.M301633200
30. Cao JS, Lockwood J, Burn P, Shi YG. Cloning and functional characterization of a mouse intestinal Acyl-CoA: monoacylglycerol acyltransferase, MGAT2. J Biol Chem. 2003;278(16):13860–13866. doi:10.1074/jbc.M300139200
31. Jaeger S, Wahl S, Kroeger J, et al. Genetic variants including markers from the exome chip and metabolite traits of type 2 diabetes. Sci Rep. 2017;7.
32. Yang M, Nickels JT. MOGAT2: a new therapeutic target for metabolic syndrome. Diseases. 2015;3(3):176–192. doi:10.3390/diseases3030176
33. Lian W, Jin H, Cao J, et al. Identification of novel biomarkers affecting the metastasis of colorectal cancer through bioinformatics analysis and validation through qRT-PCR. Cancer Cell Int. 2020;20:105. doi:10.1186/s12935-020-01180-4
34. Ptácek LJ, George AL, Griggs RC, et al. Identification of a mutation in the gene causing hyperkalemic periodic paralysis. Cell. 1991;67(5):1021–1027. doi:10.1016/0092-8674(91)90374-8
35. Vicart S, Sternberg D, Fontaine B, Meola G. Human skeletal muscle sodium channelopathies. Neurol Sci. 2005;26(4):194–202. doi:10.1007/s10072-005-0461-x
36. Liang H, Chen HK, Shen YY, et al. A rare polymorphism of the COX7B2 gene in a Cantonese family with nasopharyngeal carcinoma. Sci Chin Ser C Life Sci. 2004;47(5):449–453. doi:10.1360/03yc0037
37. Al Safar HS, Cordell HJ, Jafer O, et al. A genome-wide search for type 2 diabetes susceptibility genes in an extended Arab family. Ann Hum Genet. 2013;77:488–503. doi:10.1111/ahg.12036
38. Khan AA, Quigley JG. Heme and FLVCR-related transporter families SLC48 and SLC49. Mol Aspects Med. 2013;34(2–3):669–682. doi:10.1016/j.mam.2012.07.013
39. Peng C, Song Y, Chen W, et al. FLVCR1 promotes the proliferation and tumorigenicity of synovial sarcoma through inhibiting apoptosis and autophagy. Int J Oncol. 2018;52(5):1559–1568. doi:10.3892/ijo.2018.4312
40. Wei X, Ke J, Huang H, et al. Screening and identification of potential biomarkers for hepatocellular carcinoma: an analysis of TCGA database and clinical validation. Cancer Manag Res. 2020;12:1991–2000. doi:10.2147/CMAR.S239795
41. Liu B, Zhu X, Gao S, et al. Safety and efficacy of hepatic arterial infusion chemotherapy with raltitrexed and oxaliplatin post-transarterial chemoembolization for unresectable hepatocellular carcinoma. J Interv Med. 2019;2(2):91–96. doi:10.1016/j.jimed.2019.07.006
42. Pelizzaro F, Sammarco A, Dadduzio V, et al. Capecitabine in advanced hepatocellular carcinoma: a multicenter experience. Dig Liver Dis. 2019;51(12):1713–1719. doi:10.1016/j.dld.2019.06.015
43. Tang Z, Li C, Kang B, Gao G, Li C, Zhang Z. GEPIA: a web server for cancer and normal gene expression profiling and interactive analyses. Nucleic Acids Res. 2017;45(W1):W98–W102. doi:10.1093/nar/gkx247.
 © 2021 The Author(s). This work is published and licensed by Dove Medical Press Limited. The full terms of this license are available at https://www.dovepress.com/terms.php and incorporate the Creative Commons Attribution - Non Commercial (unported, v3.0) License.
By accessing the work you hereby accept the Terms. Non-commercial uses of the work are permitted without any further permission from Dove Medical Press Limited, provided the work is properly attributed. For permission for commercial use of this work, please see paragraphs 4.2 and 5 of our Terms.
© 2021 The Author(s). This work is published and licensed by Dove Medical Press Limited. The full terms of this license are available at https://www.dovepress.com/terms.php and incorporate the Creative Commons Attribution - Non Commercial (unported, v3.0) License.
By accessing the work you hereby accept the Terms. Non-commercial uses of the work are permitted without any further permission from Dove Medical Press Limited, provided the work is properly attributed. For permission for commercial use of this work, please see paragraphs 4.2 and 5 of our Terms.