")
Back to Journals » International Journal of General Medicine » Volume 14
A Novel Glycosyltransferase-Related Gene Signature for Overall Survival Prediction in Patients with Ovarian Cancer
Authors Wang L
Received 6 August 2021
Accepted for publication 14 December 2021
Published 25 December 2021 Volume 2021:14 Pages 10337—10350
DOI https://doi.org/10.2147/IJGM.S332945
Checked for plagiarism Yes
Review by Single anonymous peer review
Peer reviewer comments 3
Editor who approved publication: Dr Scott Fraser
Liang Wang
Department of Gynecology and Obstetrics, Tianjin NanKai Hospital, Tianjin, 300100, People’s Republic of China
Correspondence: Liang Wang
Department of Gynecology and Obstetrics, Tianjin NanKai Hospital, No. 6 Changjiang Road, Nankai District, Tianjin, 300100, People’s Republic of China
Tel +86-13802092719
Email [email protected]
Background: Ovarian cancer is a highly malignant epithelial tumor. Recently, it has been reported the role of glycosyltransferases (GTs) in various cancers. However, the prognostic value of GTs-related genes in ovarian cancer remained largely unknown.
Methods: RNA-sequencing (RNA-seq) data and corresponding clinical characteristics of patients with ovarian cancer were extracted from the public database of the Cancer Genome Atlas (TCGA) and Genotype-Tissue Expression (GTEx). We constructed the least absolute shrinkage and selection operator (LASSO) Cox regression model to explore a multigene signature comprising GTs-related genes in the TCGA and GTEx cohort. Patients with ovarian cancer in International Cancer Genome Consortium (ICGC) database were applied for further validation. We also performed functional analysis on the differentially expressed genes (DEGs) of high-risk and low-risk groups in the TCGA cohort. Additionally, the immune status between the two risk groups was assessed, respectively.
Results: Our results showed that 64 GTs-related genes were differentially expressed between tumor tissues and normal tissues in the TCGA and GTEx cohort. A prognostic model of 15 candidate genes was constructed, which classified patients into high- and low-risk groups. Compared with low-risk patients, high-risk patients had an obvious worse overall survival (OS) (P < 0.0001 in the TCGA and GTEx cohort and P = 0.042 in the ICGC cohort). Multivariate Cox regression analysis revealed that the risk score was an independent factor for OS of ovarian cancer. Functional analysis indicated that these DEGs were also enriched in immune-related pathways, and the immune status was significantly different between the two risk groups in TCGA cohort.
Conclusion: In conclusion, a novel GTs-related gene signature may be used for the prognosis of ovarian cancer. Targeting GTs-related gene can act as a therapeutic alternative for ovarian cancer.
Keywords: ovarian cancer, glycosyltransferase, prognosis
Introduction
Ovarian cancer is the leading cause of death from gynecologic cancer in the world. Surveillance, Epidemiology, and End Results (SEER) data show that 21,410 new cases and 13,770 deaths of ovarian cancer are expected in the United States in 2021.1 The high mortality rate is mainly due to the lack of effective diagnostic and prognostic methods for cancer occurrence and recurrence.2 So far, there was still a poor prognosis of ovarian cancer patients. Therefore, it is very important to discover more effective prognostic model for ovarian cancer.
On the basis of bioinformatics methods, more and more genes related to the prognosis of ovarian cancer had been found. Feng et al had found four significant up-regulated DEGs (BUB1B, BUB1, TTK and CCNB1) with poor prognosis in OC by integrated bioinformatical methods, which could be potential biomarkers for OC patients.3 Zheng et al found that thirty genes were associated with the prognosis of ovarian cancer by bioinformatics analysis.4 At present, microarray technology and bioinformatic analysis have rapidly developed and have been widely used in diagnosis, treatment, and prognosis of ovarian cancers, which can enable us to identify the DEGs and find the interactions among them.
Glycosylation is the most common post-translational modification of proteins and lipids, which is essential for cell adhesion and stability as well as cell to cell communication.5 Studies have shown that the increase of glycosylation level and abnormal expression of related enzymes are closely related to the occurrence and development of various cancers. The expression levels of glycosyltransferase (GTs) and O-glycosylation in breast cancer (BC) tissues were significantly higher than those in adjacent tissues.6–10 Compared with colon cancer metastases, the expression of glycosyltransferase was significantly decreased in the primary tumor.6,10 In endometrial cancer, prostate cancer, lung cancer and liver cancer,11–14 the glycosylation level had strong correlations with the degree of tumor malignant. In addition, a large number of studies had shown that abnormal glycosylation can increase the risk of pancreatic cancer, liver cancer, breast cancer, rectal cancer and gastric cancer, indicating that abnormal glycosylation may contribute to the occurrence and development of tumors.15,16
In recent years, abnormal expression of glycosylation and related enzymes had also been found in ovarian cancer. Chou et al found that glycosyltransferase C1GALT1 could change the O-glycosylation level of glycoprotein in ovarian cancer cells, and it could promote the invasion and proliferation of tumor cells, and even improved the stem cell potential of tumor cells.17 Matthew et al found that glycosyltransferase ST6Gal-I was up-regulated in ovarian cancer and enriched in metastatic tumor, which was associated with decreased survival rate of patients.18
Although these glycosyltransferases had certain ability to predict prognosis, the prediction ability of single index was limited. It was more necessary to establish a multivariate prognostic model to improve the accuracy. Therefore, this study was based on the analysis of TCGA and ICGC databases and glycosyltransferase genes to provide new biomarkers for the prognosis of ovarian cancer. In this study, we used 15 differential expressed glycosylation genes to construct a prognostic model for ovarian cancer, which could better predict the survival of patients with ovarian cancer. Based on this model, the differential genes of the high- and low-risk groups were analyzed and found to be related to immune infiltration, which provided a new target and idea for the clinical diagnosis and treatment of ovarian cancer.
Materials and Methods
Data Collection
RNA sequencing data and corresponding clinical information of ovarian cancer patients were obtained from the TCGA database (Supplementary Table1). 379 tumor samples were included in the TCGA-Ovarian Cancer database. In this study, we excluded 3 samples with no clinical information and 5 samples labeled as non-primary tumors, and the remaining 371 samples were selected as the basis for subsequent analysis. Since there was a lack of data related to normal ovarian samples in the TCGA database, information on 180 normal ovarian tissue samples was collected from the GTEx database (https://www.gtexportal.org/home/) (Supplementary Table 2) and served as a normal control group in the subsequent analysis. Moreover, we obtained RNA-seq data and clinical information from 81 ovarian cancer patients (including time to complete survival) in the ICGC database, which was utilized as an independent external validation set to assess the general applicability of the risk score model. Moreover, the clinical information of the relevant samples from the GTEx, TCGA, and ICGC databases was presented in Supplementary Table 3. 210 GTs-related genes were obtained from the previous literature of NCBI’s publicly available PubMed database19 (Supplementary Table 4).
Differential Expression Analysis
We first integrated the tumor tissues samples of TCGA database and normal tissues samples of GTEx database for further analysis. Principal component analysis (PCA) was used to reduce dimensionality between the tumor and normal samples followed by normalization with “sva” package in R. Thereafter, the differential expression analysis was used to identify DEGs with |Log2FC| ≥ 1, adjusted P-value ≤0.05 using Limma R package. Subsequently, DEGs identified from TCGA and GTEx databases were combined with 210 GTs-related genes to get the co-differentially expressed GTs-related genes.
Construction and Validation of a Prognostic Model of GTs-Related Genes
Here, we selected 370 of the 371 TCGA-ovarian cancer samples containing complete survival information as the basis for this part of the study. Univariate Cox analysis was applied to identify GTs-related genes associated with the prognosis of ovarian cancer. Then, 15 GTs-related genes were found with LASSO Cox regression analysis using glmnet Package in the R. A better optimal model was obtained after lasso Cox regression, including MGAT3, ALG13, FUT8, GAL, ALG8, GALNT6, B3GNT3, GALT, GBGT1, GCNT4, B4GALT5, ST6GALNAC2, ST6GALNAC6, DPM3, UGT8. We constructed an interaction network for the 15 candidate factors in ovarian cancer prognosis using STRING database (https://string-db.org/). Correlation analysis between the 15 GTs-related genes associated with the prognosis of ovarian cancer were conducted (* P < 0.05, ** P < 0.01, *** P < 0.001). We constructed a prognostic model by 15 candidate factors. The risk score of each sample in ovarian cancer was calculated as follows: score = esum (each gene’s expression levels × corresponding coefficient)/ esum (each gene’s mean expression levels × corresponding coefficient). The patients in TCGA (n = 370) database were classified by high-risk and low-risk groups according to the median of the risk score. Survival analysis of ovarian cancer patients was performed using Kaplan–Meier (K-M) curve, and the time-dependent ROC curve was constructed to evaluate the accuracy of prognostic model using “survivalROC” R package.
Functional Enrichment Analysis and ssGSEA
Gene Ontology (GO) and Kyoto Encyclopedia of Genes and Genomes (KEGG) enrichment analysis was performed on the identified prognostic genes by R package clusterProfiler20 and false discovery rate (FDR) <0.05 was set as the significance threshold. Gene Set Enrichment Analysis (GSEA) was used to further investigate the biological functions of GO and KEGG pathways based on the DEGs between high-risk and low-risk patients with ovarian cancer. P-values less than 0.05 was considered as significant enrichment.
ssGSEA and ESTIMATE
The single-sample gene set enrichment analysis (ssGSEA) enables the classification of gene sets with common biological functions.21 In this study, ssGSEA was applied to explore the different infiltration levels of 28 immune cell types in the expression profiles of the high- and low-risk groups based on TCGA-ovarian cancer, using the R package “GSVA”. The ESTIMATE algorithm aims to calculate scores that reflect the level of immune and stromal cell infiltration in the tumor microenvironment, and it is implemented based on specific gene expression levels of immune and stromal cells.22 In this study, the immune score, stromal score, and ESTIMATE score of ovarian cancer samples in the high- (n = 185) and low- (n = 185) risk groups in the TCGA database were calculated using the RNA-seq-based expression level ESTIMATE algorithm via the R package “ESTIMATE”. The ESTIMATE score represents the combination of the stromal and immune scores. The difference between the three scores in the two risk groups was assessed by the Wilcoxon test. In addition, the R package “ggpubr” was used to present violin plots of ESTIMATE scores, immune scores, and stromal scores in the two risk groups.
Statistical Analysis
The “limma” packages in R and one-way ANOVA were applied to compare the gene expression between tumor samples and normal samples. The Chi-squared test was used to compare the differences in proportions. The overall survival between groups was performed using Kaplan–Meier analysis with long rank test. All the analyses of present study were performed using R software. Generally, a P-value less than 0.05 above was considered as significant unless specified in our analysis.
Results
Identification of Co-Differentially Expressed GTs-Related Genes in Ovarian Cancer
To clearly distinguish the significant difference between tumor and normal tissues samples of TCGA and GTEx databases, we performed PCA to reduce the dimension and assess the independence of these tissues. As shown in Figure 1A, normal tissues vs tumor tissue samples in TCGA and GTEx databases displayed an obvious difference, indicating the independent of each group. Subsequently, we used limma package to screen the DEGs after integration of TCGA and GTEx databases. Totally, 6814 DEGs were identified with 3094 of them up-regulated and 3720 down-regulated (Supplementary Table 5). Volcano plots in Figure 1B demonstrates the number of DEGs identified from TCGA and GTEx databases. Here, we also showed the expressions of DEGs between tumor and normal groups in a heatmap (Figure 1C). Moreover, the expressions of top 10 DEGs showed significant differences between tumor group and normal group (Figure 1D). Venn diagram showed the intersections of genes between the data of DEGs and glycosyltransferase genes, and 61 co-differentially expressed GTs-related genes were found in ovarian cancer (Figure 1E).
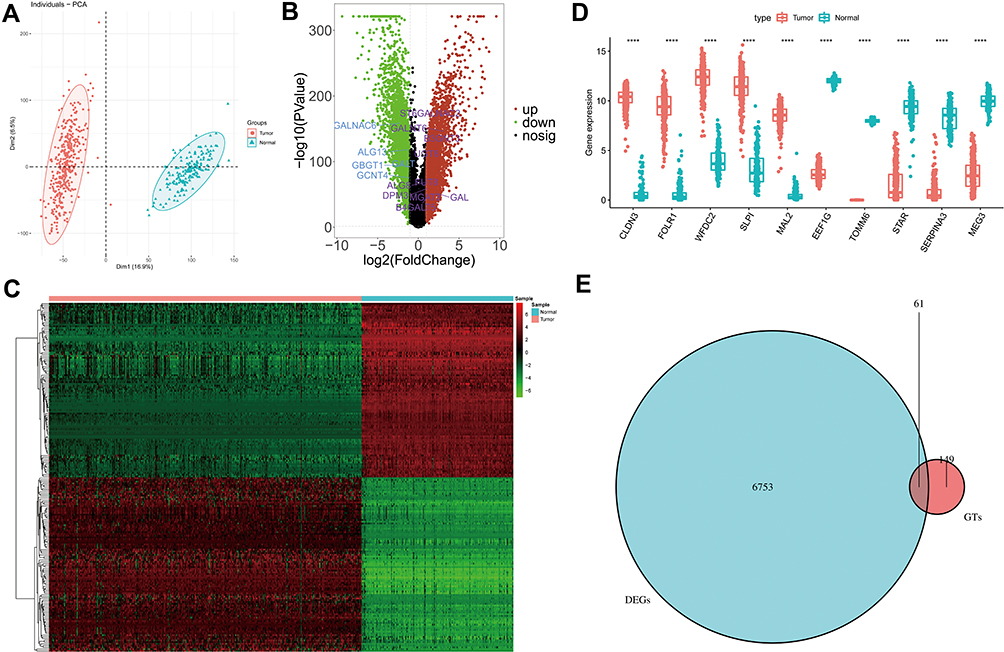 |
Figure 1 GTs-related genes in ovarian cancer. (A) Principal component analysis of tumor and normal tissues samples of TCGA and GTEx databases. (B) Volcano plots of DEGs from TCGA and GTEx databases. (C) Heatmap of DEGs. (D) Boxplot of expressions of top 10 DEGs. (E) Venn diagram of intersection of glycosyltransferase gene and DEGs. In (D), asterisk indicator in each grid represents the significance p value of the correlation of the corresponding genes, ****Means P <0.0001. |
Identification of GTs-Related Genes Associated with Prognosis in Ovarian Cancer
To address which GTs can be useful in ovarian cancer, we sought to identify the potential prognostic factors. Based on the above mentioned 61 co-differentially expressed GTs-related genes, we performed univariate Cox regression analysis in the TCGA-ovarian cancer database (n = 370). The results indicated that 18 of 61 genes (P ≤ 0.2)23 may be associated with OS in ovarian cancer patients. Specifically, GBGT1, ST6GALNAC6, MGAT3, GAL, B3GNT3, and B4GALT5 were likely oncogenes (all HR > 1), whereas HR < 1 for ALG8, DPM3, ALG13, GCNT4, GALT, FUT8, PIGM, GALNT6, ALG3, UGT8 ST6GALNAC2, and ST6GALNAC1, in contrast, might be protective genes for ovarian cancer patients (Figure 2A). A better optimal model was constructed after LASSO Cox regression analysis, which contained 15 candidate genes, such as MGAT3, ALG13, FUT8, GAL, ALG8, GALNT6, B3GNT3, GALT, GBGT1, GCNT4, B4GALT5, ST6GALNAC2, ST6GALNAC6, DPM3, UGT8 (Figure 2B and C). The PPI network indicated the interaction among these 15 candidate genes (Figure 2D). Specifically, excluding B4GALT5, GAL, GALT, and UGT8, which were not interacting with any other prognostic signature genes, there were 15 interactions between the remaining 11 genes. ST6GALNAC2 interacted with a total of 5 genes (FUT8, GALNT6, GBGT1, GCNT4, and MGAT3). ST6GALNAC6 interacted with FUT8, GALNT6, GBGT1, and MGAT3. GALNT6, GBGT1, and ST6GALNAC2; GBGT1, ST6GALNAC2, and FUT8; ST6GALNAC6, FUT8, and MGAT3; ALG13, DPM3, and ALG8 could complete a closed-loop circle of relationship. Besides, B3GNT3 showed reciprocal relationship with GCNT4 only. In addition, a Pearson correlation analysis and P-value between these candidate genes were presented in Figure 2E and F. Detailed, there was a significantly powerful positive correlation between ST6GALNAC6 and GBGT1 (r = 0.74, P < 0.001); followed by ST6GALNAC6 and GALT (r = 0.73, P < 0.001), ST6GALNAC6 and ALG13 (r = 0.71, P < 0.001), GALT and ALG13 (r = 0.7, P < 0.001). Meanwhile, ST6GALNAC6 was moderately negatively correlated with FUT8 (r = −0.49, P < 0.001), GALNT6 (r = −0.49, P < 0.001), DPM3 (r = −0.46, P < 0.001), UGT8 (r = −0.45, P < 0.001), ST6GALNAC2 (r = −0.44, P < 0.001), and B3GNT3 (r = −0.41, P < 0.001). GBGT1 was moderately negatively correlated with DPM3 (r = −0.46, P < 0.001), UGT8 (r = −0.46, P < 0.001), GALNT6 (r = −0.44, P < 0.001), and FUT8 (r = −0.42, P < 0.001). Moreover, GALNT6 also showed a moderately negative correlation with ALG13 (r = −0.44, P < 0.001) and GALT (r = −0.41, P < 0.001).
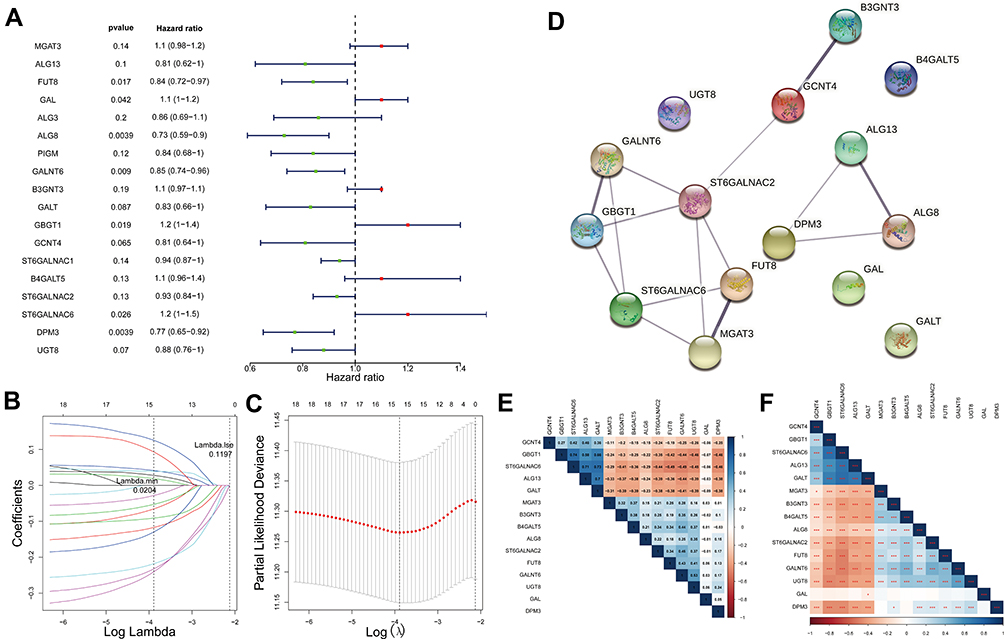 |
Figure 2 GTs-related genes associated with prognosis in ovarian cancer. (A) Forest plot with P-value <0.2 in univariate Cox analysis. (B) A model was constructed after LASSO cox regression analysis. (C) LASSO deviance diagram. (D) protein–protein interaction of 15 candidate genes. (E) Person correlation analysis between 15 candidate genes. (F) P-value of Pearson correlation analysis. In E and F, the color of each square indicates the correlation between genes on the corresponding X and Y axes. Blue represents positive correlation, red represents negative correlation, and the darker the color, the stronger the correlation. In E, the number in each grid represents the Pearson correlation coefficient between the corresponding genes. In F, asterisk indicator in each grid represents the significance p value of the correlation of the corresponding genes, *Represents P < 0.05, **Represents P < 0.01, and***Means P < 0.001. |
Prognostic Value of These Candidate Factors in Ovarian Cancer
Having shown that GTs-related genes may play an important role in the development of ovarian cancer, so we focused on the prognostic value of these candidate factors. The risk score was firstly calculated, and the patients were divided into high-risk group and low-risk group on the basis of median cut-off value of risk score. Moreover, patients in high-risk group showed a higher death rate compared with those in low-risk group (Figure 3A). To further understand the role of these candidate factors in ovarian cancer, K-M analysis was performed both in the GTEx database and TCGA database in which samples were classified by high- or low-risk score. Consistently, K-M curve revealed that the high-risk patients had an obvious worse OS compared with those low-risk patients (Figure 3B, P < 0.0001). Thereafter, the ROC curve at 3-, 5-, 7-, and 10-year for the risk score of OS was performed, and the AUC reached 0.688 at 3 years, 0.708 at 5 years, 0.719 at 7 years, and 0.761 at 10 years (Figure 3C). A nomogram and corresponding calibration plot were constructed based upon these results (Figure 3D and E).
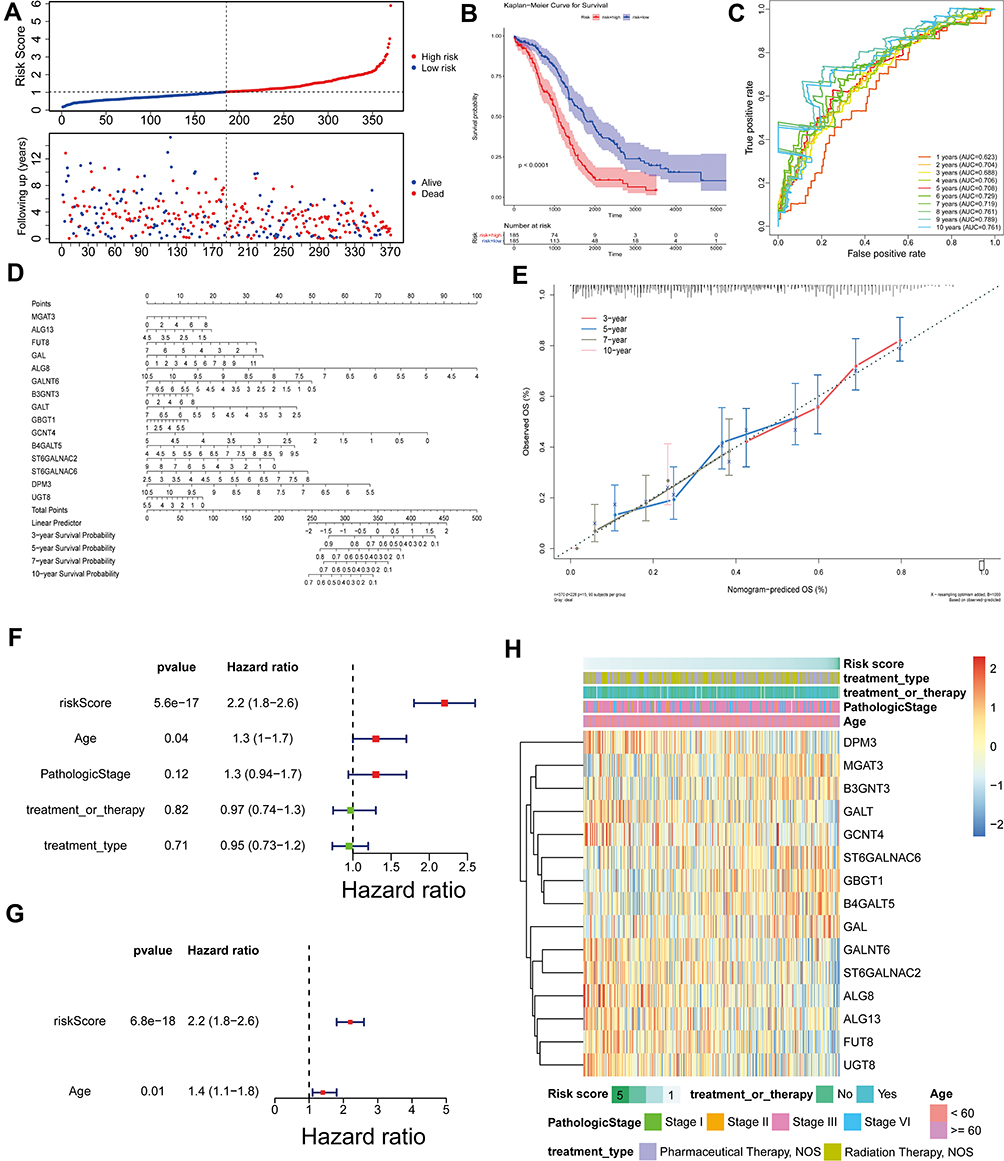 |
Figure 3 Prognostic value of these candidate factors. (A) Survival state diagram of ovarian cancer patients. The abscissa of the survival state diagram expressed the patient, the ordinate meant the survival time (year). The red represented the dead patient, and the blue represented the living patient. (B) Survival curve of high and low risk patients. The abscissa meant the survival time, and the unit was day. The ordinate represented the survival rate. Red expressed high-risk and blue indicated low-risk in patients. (C) Roc curve for the risk score of OS. The abscissa represented the false-positive rate, and the ordinate meant the true positive rate. (D and E) Nomogram of survival rate in 3,5,7,10-year. (F) Forest plot with clinical factors in univariate Cox analysis. (G) Forest plot with ages of patients in multivariate Cox analysis. (H) Heatmap of 15 candidate factors and clinicopathological features. |
Additionally, the clinical factors were added into our analysis to observe the effect on OS of patients. We found that age of patients in ovarian cancer were risk factors, and the previous multivariate Cox analysis model was still significant in the presence of age (Figure 3F and G), indicating that risk score was an independent factor for the OS of ovarian cancer patients. The expression profiles of these 15 candidate factors and clinicopathological features of ovarian cancer in low- and high-risk groups were displayed in a heatmap (Figure 3H). We found that DPM3, GALT, GCNT4, GALNT6, ST6GALNAC2, ALG8, ALG13, FUT8, and UGT8 were all highly expressed in the low-risk group with long OS, suggesting that these genes may be protective genes for patients with ovarian cancer; while MGAT3, B3GNT3, ST6GALNAC6, GBGT1, B4GALT5, and GAL were all overexpressed in the high-risk group with poor prognosis, indicating that these genes may be pro-oncogenes. This was consistent with previous inferences based on HR values calculated from univariate Cox analysis. However, the risk score based on 15 characteristic genes appeared to be independent of the clinical characteristics of ovarian cancer patients, implying that our risk score model may be able to bypass the impact of pathological characteristics on patient OS. From the analyses above, the 15 candidate factors had obvious prognostic value for the OS of ovarian cancer patients.
Validation of the Prognostic Model Constructed by 15 Candidate Factors in ICGC Dataset
To further investigate prognostic model constructed in the previous study, the patients in the ICGC dataset were also classified by high- or low-risk groups based on the risk score. In accordance with the results above, patients in the low-risk group exhibited longer OS and good prognosis compared to patients in the high-risk group (Figure 4A). In addition, there was significant difference on the OS between the two risk groups (Figure 4B, P = 0.042). Besides, the AUC of the candidate factors was 0.572 at 3 years, 0.663 at 5 years, 0.666 at 7 years, 0.785 at 10 years (Figure 4C), which further indicated that the prognostic model constructed by 15 candidate factors was effective in ICGC database. All the data revealed that the 15 candidate factors were associated with ovarian cancer prognosis.
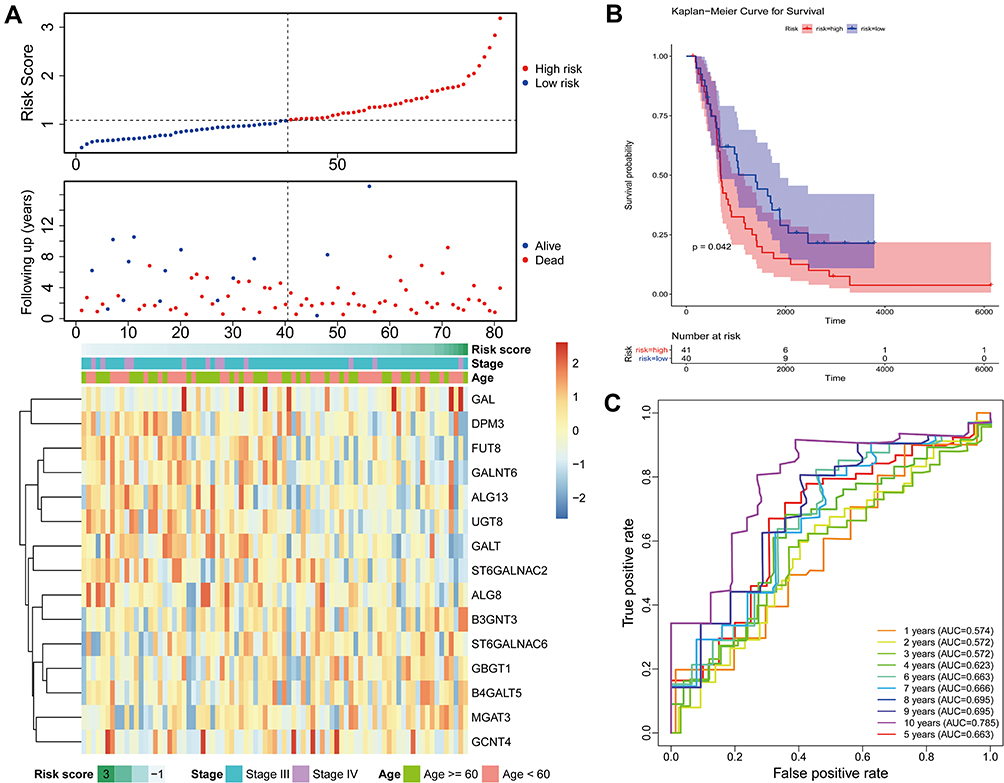 |
Figure 4 External validation of the prognostic gene signature. (A) Relationship between the survival status/risk score rank and survival time (days)/risk score rank (up). The heatmap of mRNA expression of the fifteen-gene signature in the ICGC cohort. (B) Kaplan–Meier curves of OS of the low- and high-risk groups. (C) Time‐dependent ROC curve analysis of survival prediction by the prognostic model. Abbreviations: ICGC, International Cancer Genome Consortium; OS, overall survival; ROC, receiver operating characteristic. |
Functional Analyses in TCGA Database of Ovarian Cancer
Further, we performed functional enrichment analysis on 15 prognostic genes. In GO analysis, these genes were enriched to a total of 36 BP terms, 2 CC terms, and 3 MF terms (all FDR < 0.05; Supplementary Table 6). The top 10 of GO-BP and all GO-CC and -MF terms are displayed in Figure 5A. We focused on the GO-BP category and found that these genes were significantly associated with “glycosylation” and its related processes (“protein glycosylation”, “macromolecule glycosylation”, ‘oligosaccharide biosynthetic process’, ‘poly-N-acetyllactosamine biosynthetic process’, etc.); also, protein localization-related terms (“protein localization to axon”, “protein localization to early endosome”, “regulation of protein catabolic process in the vacuole”, and “positive regulation of protein localization to endosome”) were notably enriched; moreover, the GO system showed that these genes served the molecular functions of “transferase activity, transferring glycosyl groups”, “catalytic activity, acting on a glycoprotein”, and “neuropeptide hormone activity” in “Golgi cisterna membrane” and “Golgi cisterna”. KEGG enrichment analysis indicated that these genes were involved in the N-glycan biosynthetic pathway (Figure 5B; Supplementary Table 7). Furthermore, we constructed network of the prognostic gene-glycosylation-related BP term (Figure 5C) and the prognostic gene-glycosylation-related KEGG pathway (Figure 5D).
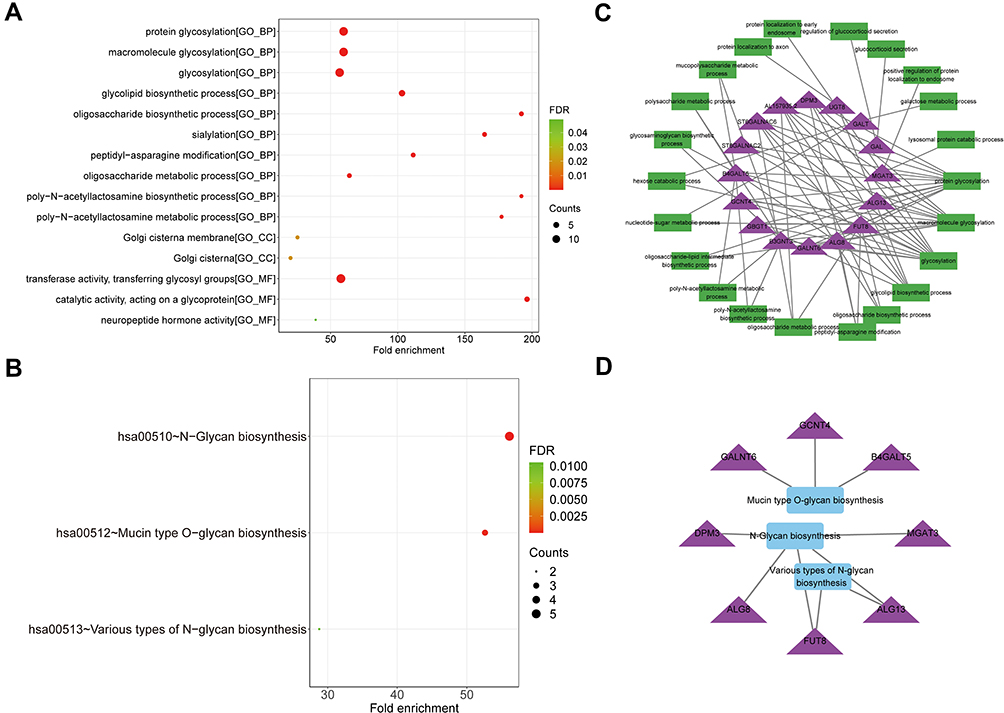 |
Figure 5 Functional analysis of 15 prognostic genes. (A) The dotplot of top 10 BP and all CC and MF terms by GO analysis. (B) The dotplot of KEGG pathway. (C) The network diagram between glycosylation-related BP terms and prognostic genes. (D) The network diagram between KEGG pathways and prognostic genes. The larger the circle, the more genes it contained; conversely, the smaller the circle, the fewer genes it contained. The color of the circle is correlated with the FDR-value. The smaller the FDR-value is, the closer it is to the red value. The larger the FDR-value is, the closer it is to the blue green. Abbreviations: GO, Gene Ontology; BP, biological processes; CC, cell component; MF, molecular function; KEGG, Kyoto Encyclopedia of Genes and Genomes; FDR, false discovery rate. |
To explore the potential biological functions strongly correlated with the risk score, we first performed a differential analysis between high-risk and low-risk groups. As a result, a total of 211 DEGs were screened in the TCGA database, of which 109 were up-regulated and 102 were down-regulated compared with low-risk group (Figure 6A). Moreover, these DEGs identified in TCGA database of ovarian cancer were visualized by a heatmap, revealing the expressions of DEGs between tumor tissues and normal tissue samples (Figure 6B). Furthermore, GSEA was performed to elucidate GO enrichment of DEGs. As expected, these DEGs were mainly involved in several important biological processes, such as immune effector process (Figure 6C), positive regulation of immune system process (Figure 6D), regulation of immune response (Figure 6E), immune system development (Figure 6F), innate immune response (Figure 6G), and leukocyte activation involved in immune response (Figure 6H) (all P-value <0.05). Thus, we suspected that glycosyltransferase genes might play a key role in the prognosis of ovarian cancer via some important immune-related biological processes.
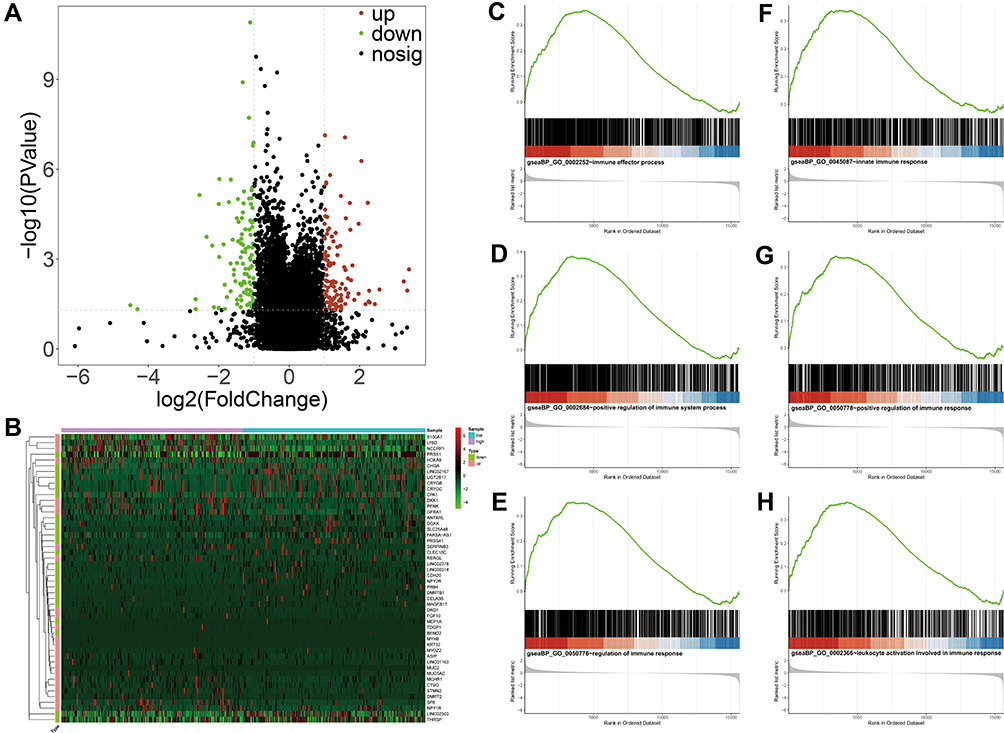 |
Figure 6 Functional analyses of DEGs between high- and low-risk groups by GSEA. (A) The DEGs between high- and low-risk groups from TCGA database. The red and green dots represent significantly upregulated and downregulated DEGs, respectively. The black dots represent genes that are not differentially expressed high- and low-risk groups samples. (B) Heatmap of the expression levels of the top 25 up- and down-regulated DEGs in high- and low-risk groups. Red upregulation; Green downregulation. The value of expression intensity is based on the gene expression level analysis by R software. (C) Enrichment plot: immune effector process. (D) Enrichment plot: positive regulation of immune system process. (E) Enrichment plot: regulation of immune response. (F) Enrichment plot: immune system development. (G) Enrichment plot: innate immune response. (H) Enrichment plot: leukocyte activation involved in immune response. Abbreviations: DEGs, differentially expressed genes; GSEA, gene set enrichment analysis. |
Investigation of the Relationship Between Risk Score and Immune Landscape in Ovarian Cancer
In order to investigate our suspect, we characterized the relationship between the risk score and immune in ovarian cancer using ssGSEA to quantify the enrichment scores of various immune cells. Interestingly, the scores of these immune cells, mainly including Central memory CD4 T cell, Central memory CD8 T cell, Neutrophil, Memory B cell, and T follicular helper cell, were statistically significant between the high-risk and low-risk groups in TCGA database of ovarian cancer (Figure 7A). The stromal scores and ESTIMATE scores based on the ESTIMATE algorithm were significantly different between the two risk patients with ovarian cancer (Figure 7B and C). In particular, the immune scores had no statistical significance in TCGA database (Figure 7D).
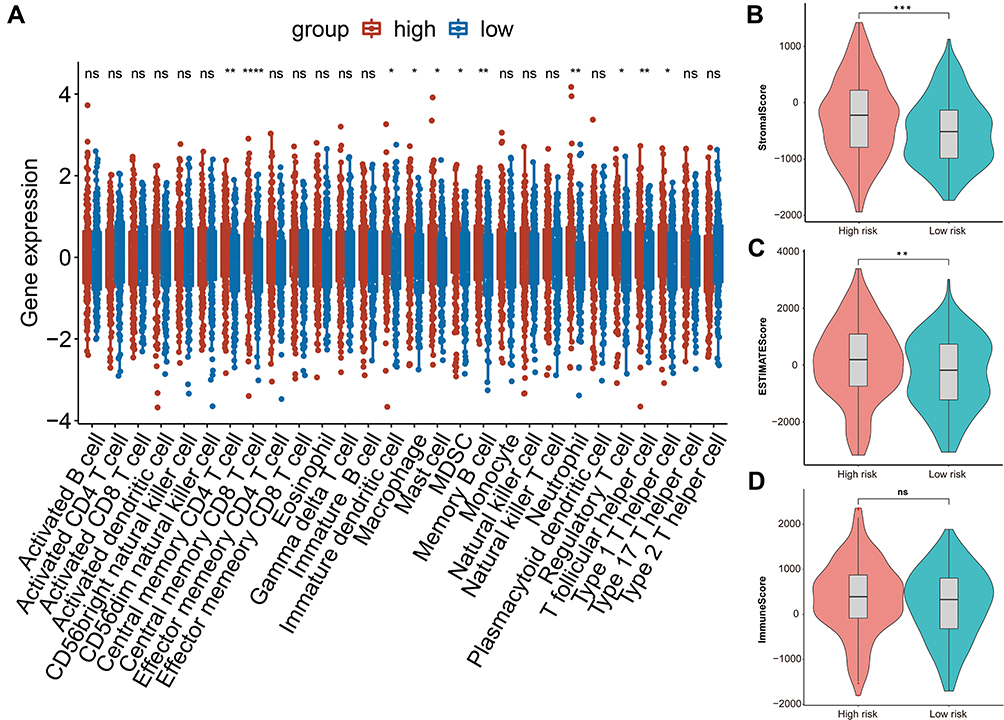 |
Figure 7 The relationship between risk score and immune infiltration. (A) Boxplot of the difference of infiltration of immune cells in high and low risk groups. (B) Violin plot of difference of stromal scores in two risk patients. (C) Violin plot of difference of ESTINATE scores in two risk groups. (D) Violin plot of difference of immune scores in two risk groups. In Figure 7, asterisk indicator in each grid represents the significance p value of the correlation of the corresponding genes, *Represents P < 0.05, **Represents P < 0.01, * * *Means P < 0.001, and****Means P <0.0001. |
Discussion
Glycosylation is one of the most important post-translational modifications of proteins, which widely exists in various cells, tissues and organs.24 Abnormal glycosylation of proteins is associated with the occurrence of important diseases, such as tumors, cardiovascular diseases, infectious diseases, immune diseases, neurodegenerative diseases and metabolic diseases. Additionally, abnormal glycosylation regulates the malignant behavior of tumor cells and becomes a target of clinical diagnosis and treatment.25
As mentioned above, glycosyltransferase played an important role in the occurrence, development, metastasis and prognosis of ovarian cancer. However, as a prognostic factor of ovarian cancer, single glycosyltransferase had poor sensitivity and specificity. In our study, we used TCGA and GTEx databases to screen the differential GT genes of ovarian cancer and established a 15-gene prognostic model. The model had a good predictive ability and was further validated through the external of ICGC database.
GnT-III is a key enzyme in the N-acetylglucosamine transferase family. It is encoded by the MGAT3 gene and catalyzes the connection of N-acetylglucosamine to the core mannose of complex or mixed N-glycans in the form of β1,4 to form a bisecting GlcNAc branch structure. Research by Heba et al showed that high expression of glycosyltransferase GnT-III could activate Notch signal and promoted the growth and progression of ovarian cancer.26 Zhang et al found that abnormal expression of bisecting GlcNAc and mgat3 could inhibited the metastasis of ovarian cancer cells.27 Fucosyltransferase 8 (FUT8) is the only enzyme that catalyzes α 1.6-fucosylation in mammals, which is expressed in many cancers, such as liver cancer,28 ovarian cancer,29 thyroid cancer30 and colorectal cancer.31 It had been found that the core fucosylation catalyzed by FUT8 is involved in the progression of epithelial ovarian cancer (EOC). Fucosylation of copper transporter 1 (CTR1) played an important role in cell-mediated cisplatin (cDDP) uptake,32 which provided a new strategy for improving the efficacy of cDDP-based EOC chemotherapy. The polypeptide N-acetylgalactosamine transferase-6 (GALNT6), a member of the N-acetyl-D-galactosamine transferase family, is an enzyme that mediates the initiation step of mucus O-glycosylation.33 As biomarkers of endometrial cancer,34 breast cancer,35–37 pancreatic cancer,38 and colorectal cancer,39 GALNT6 regulated glycosylation and played an important role in the occurrence and development of cancers. Previous study has shown that the expression of GALNT6 in ovarian cancer was significantly increased compared with control tissues, suggesting that the expression of GALNT6 was related to the poor prognosis of ovarian cancer. Moreover, GALNT6 enhanced the invasive behavior of ovarian cancer cells by regulating the activity of EGFR.40 GBGT1 is a candidate gene for malignant transformation of ovarian EMS.41 The expression of GBGT1 in ovarian cancer is epigenetically silenced by hypermethylation of the promoter.42
Among these 15 genes, as mentioned above, MGAT3, FUT8, GALNT6 and GBGT1 were associated with the prognosis of ovarian cancer. B3GNT3, GCNT4, ST6GALNAC6, DPM3, B4GALT5, ST6GALNAC2 and UGT8 were rarely reported in ovarian cancer, but they correlated with the prognosis of other types of tumors.
Over expression of B3GNT3 is related to the poor prognosis of patients with non-small cell lung cancer.43 High expression of B3GNT3 in early cervical cancer is associated with pelvic lymph node metastasis, leading to a poor prognosis.44 GCNT4 protein expression is an independent prognostic factor for overall survival (OS) in patients with gastric cancer. Studies have demonstrated that GCNT4 regulated the cell cycle of gastric cancer, and overexpression of GCNT4 could prevent the proliferation of gastric cancer cells.45 In the early stage of colorectal cancer, the silencing of ST6GALNAC6 can lead to the production of inflammatory mediators that promote cancer.46 Manos et al reported that DPM3 could inhibit the progression of prostate cancer.47 B4GALT5 regulates breast cancer stem cells through glycosylation modification. Over-expression of B4GALT5 lead to significant tumor growth in vivo, which is highly associated with breast cancer stem cell markers.48 In addition, B4GALT5 may be a target gene involved in the poor prognosis of HCC patients.49 Sialyltransferase ST6GALNAC2 is a novel metastasis suppressor of breast cancer,50 which could be used as a predictive biomarker and potential therapeutic target for colorectal cancer.51 Studies have shown that urinary galactosyl diphosphate ceramide galactosyltransferase (UGT8) is highly expressed in breast cancer patients and related to poor prognosis, which is a potential prognostic indicator and drug target for breast cancer.52 Other studies have indicated that high expression of UGT8-galactose is associated with a significantly increased risk of lung metastasis in breast cancer patients. UGT8 is an important index of breast cancer invasiveness and a potential indicator for evaluating the prognosis of lung metastasis of breast cancer.53
However, ALG13, GAL, ALG8 and GALT genes have not been reported in tumors. ALG13, GAL, ALG8 and GALT genes are all protein encoding genes. Abnormal glycosylation of ALG13 (asparagine linked glycosylation 13 homologue) is thought to be associated with epilepsy and mental retardation.54 GAL gene is correlated with diseases, such as epilepsy and acute endometritis.55 ALG8 gene was related to congenital glycosylation disorders56 and polycystic liver disease with or without renal cysts.57 GALT gene is involved in galactose metabolism and associated with galactosemia.58 More importantly, galactosemia caused by GALT-deficiency is more likely to result in premature ovarian insufficiency (POI).
In this project, we took glycosyltransferase genes as the target gene set, and found the differential genes in TCGA OV and GTEx databases. Subsequently, we established the prognostic model based on these differential glycosyltransferase genes of ovarian cancer. The 3-year AUC value reached 0.688, and the 10-year AUC value was 0.761. The model was subsequently verified in the ICGC dataset. The AUC value of 3 years was 0.572 and that of 10 years was 0.785, indicating that the model was better. Then, ovarian cancer patients were divided into the high- and low-risk groups, and analyzed differential genes between them to explore possible mechanism. We found that differential genes between the two risk groups were enriched in immunity-related pathways. Thus, we compared the differences of immune infiltration and immune cell gene sets between high- and low-risk groups. It was found that there were statistical differences in central memory CD4 and CD8 T cells between high- and low-risk groups, of which CD8 has the most significant difference. Compared with the low-risk group, the number of central memory T cells in the high-risk group was significantly higher. This may be due to the fact that central memory T cells have super anti-tumor ability.59 Interestingly, TCM and its derived clonal T cells are highly effective anti-tumor immune T cells.60 The risk of tumors was higher in the high-risk group, so correspondingly more central memory T cells may accumulate in the high-risk group, which further proved that the model we constructed had good specificity and sensitivity from the aspect of immune cells.
At the same time, there were some deficiencies in the present study. This article only used the existing public database to analyze, without further experimental verification. To our knowledge, we firstly reported the prognostic value of B3GNT3, GCNT4, ST6GALNAC6, DPM3, B4GALT5, ST6GALNAC2, UGT8, ALG13, GAL, ALG8 and GALT in ovarian cancer. Next, we will further verify the expression of these glycosyltransferases and their related genes in ovarian cancer and their relationship with prognosis.
Conclusion
In summary, we had constructed a prognostic model of ovarian cancer with GT-related genes, which had a good prediction ability. The high- and low-risk groups in the prognostic model may reflect the prognosis of patients through immune mechanisms. This provided a new idea and method for the prognosis of ovarian cancer.
Abbreviations
LASSO, Least absolute shrinkage and selection operator; GTEx, Genotype-Tissue Expression; TCGA, The Cancer Genome Atlas; GEO, Gene Expression Omnibus; DEGs, Differentially expressed genes; OS, Overall survival; ROC, Receiver operating characteristic; FDR, False discovery rate; GO, Gene Ontology; KEGG, Kyoto Encyclopedia of Genes and Genomes; ssGSEA, Single-sample gene set enrichment analysis; PCA, Principal component analysis; AUC, Area under the curve; GSEA, Gene set enrichment analysis; KM, Kaplan-Meier.
Data Sharing Statement
The datasets supporting the conclusions of this article are available in TCGA (https://portal.gdc.cancer.gov/), GTEx (https://www.gtexportal.org/home/) and ICGC (https://dcc.icgc.org/) database.
Statement of Ethics
All data utilized in our study were obtained through the TCGA, GTEx and ICGC database, which are freely accessible for research purposes. According to the ethics guidelines, informed consent and ethical approval are not required for using the public and anonymized clinical data. Therefore, the medical ethics committee of the Tianjin NanKai Hospital exempted the ethical approval.
Disclosure
The author reports no competing interests.
References
1. Siegel RL, Miller KD, Jemal A. Cancer statistics, 2021. CA Cancer J Clin. 2021;71:7–33. doi:10.3322/caac.21654
2. Wright JD, Shah M, Mathew L, et al. Fertility preservation in young women with epithelial ovarian cancer. Cancer. 2009;115:4118–4126. doi:10.1002/cncr.24461
3. Feng H, Gu Z-Y, Li Q, Liu QH, Yang XY, Zhang JJ. Identification of significant genes with poor prognosis in ovarian cancer via bioinformatical analysis. J Ovarian Res. 2019;12(1):35. doi:10.1186/s13048-019-0508-2
4. Zheng MJ, Li X, Hu YX, et al. Identification of molecular marker associated with ovarian cancer prognosis using bioinformatics analysis and experiments. J Cell Physiol. 2019;234:11023–11036. doi:10.1002/jcp.27926
5. Ohtsubo K, Marth JD. Glycosylation in cellular mechanisms of health and disease. Cell. 2006;126:855–867. doi:10.1016/j.cell.2006.08.019
6. Champattanachai V, Netsirisawan P, Chaiyawat P, et al. Proteomic analysis and abrogated expression of O-GlcNAcylated proteins associated with primary breast cancer. Proteomics. 2013;13:2088–2099. doi:10.1002/pmic.201200126
7. Lynch TP, Reginato MJ. O-GlcNAc transferase: a sweet new cancer target. Cell Cycle. 2011;10:1712–1713. doi:10.4161/cc.10.11.15561
8. Slawson C, Hart GW. O-GlcNAc signalling: implications for cancer cell biology. Nat Rev Cancer. 2011;11:678–684. doi:10.1038/nrc3114
9. Gu Y, Mi W, Ge Y, et al. GlcNAcylation plays an essential role in breast cancer metastasis. Cancer Res. 2010;70:6344–6351. doi:10.1158/0008-5472.CAN-09-1887
10. Krześlak A, Forma E, Bernaciak M, Romanowicz H, Bryś M. Gene expression of O-GlcNAc cycling enzymes in human breast cancers. Clin Exp Med. 2012;12:61–65. doi:10.1007/s10238-011-0138-5
11. Phueaouan T, Chaiyawat P, Netsirisawan P, et al. Aberrant O-GlcNAc-modified proteins expressed in primary colorectal cancer. Oncol Rep. 2013;30:2929–2936. doi:10.3892/or.2013.2794
12. Ruan HB, Ma Y, Torres S, et al. Calcium-dependent O-GlcNAc signaling drives liver autophagy in adaptation to starvation. Genes Dev. 2017;31:1655–1665. doi:10.1101/gad.305441.117
13. Skorobogatko YV, Deuso J, Adolf-Bryfogle J, et al. Human Alzheimer’s disease synaptic O-GlcNAc site mapping and iTRAQ expression proteomics with ion trap mass spectrometry. Amino Acids. 2011;40:765–779. doi:10.1007/s00726-010-0645-9
14. Smet-Nocca C, Broncel M, Wieruszeski JM, et al. Identification of O-GlcNAc sites within peptides of the Tau protein and their impact on phosphorylation. Mol Biosyst. 2011;7:1420–1429. doi:10.1039/c0mb00337a
15. DeBerardinis RJ, Thompson CB. Cellular metabolism and disease: what do metabolic outliers teach us? Cell. 2012;148:1132–1144. doi:10.1016/j.cell.2012.02.032
16. Galhardo M, Sinkkonen L, Berninger P, Lin J, Sauter T, Heinäniemi M. Integrated analysis of transcript-level regulation of metabolism reveals disease-relevant nodes of the human metabolic network. Nucleic Acids Res. 2014;42:1474–1496. doi:10.1093/nar/gkt989
17. Chou CH, Huang MJ, Liao YY, Chen CH, Huang MC. C1GALT1 seems to promote in vitro disease progression in ovarian cancer. Int j Gynecol Cancer. 2017;27:863–871. doi:10.1097/IGC.0000000000000965
18. Schultz MJ, Holdbrooks AT, Chakraborty A, et al. The tumor-associated glycosyltransferase ST6Gal-I regulates stem cell transcription factors and confers a cancer stem cell phenotype. Cancer Res. 2016;76:3978–3988. doi:10.1158/0008-5472.CAN-15-2834
19. Ashkani J, Naidoo KJ. Glycosyltransferase gene expression profiles classify cancer types and propose prognostic subtypes. Sci Rep. 2016;6:26451. doi:10.1038/srep26451
20. Yu G, Wang LG, Han Y, He QY. clusterProfiler: an R package for comparing biological themes among gene clusters. Omics. 2012;16:284–287. doi:10.1089/omi.2011.0118
21. Aravind SB, Pablo T, Vamsi KM, et al. Gene set enrichment analysis: a knowledge-based approach for interpreting genome-wide expression profiles. Proc Natl Acad Sci USA. 2005;102(43):15545–15550. doi:10.1073/pnas.0506580102
22. Yoshihara K, Shahmoradgoli M, Martínez E, et al. Inferring tumour purity and stromal and immune cell admixture from expression data. Nat Commun. 2013;4:1–11. doi:10.1038/ncomms3612
23. Kang SJ, Cho YR, Park GM, et al. Predictors for functionally significant in-stent restenosis: an integrated analysis using coronary angiography, IVUS, and myocardial perfusion imaging. JACC Cardiovasc Imaging. 2013;6:1183–1190. doi:10.1016/j.jcmg.2013.09.006
24. Varki A, Cummings RD, Esko JD; Essentials of Glycobiology, et al. Cold Spring Harbor Laboratory Press Copyright © 2009, the Consortium of Glycobiology Editors. La Jolla, California.: Cold Spring Harbor (NY);2009.
25. Stowell SR, Ju T, Cummings RD. Protein glycosylation in cancer. Annu Rev Pathol. 2015;10:473–510. doi:10.1146/annurev-pathol-012414-040438
26. Allam H, Johnson BP, Zhang M, Lu Z, Cannon MJ, Abbott KL. The glycosyltransferase GnT-III activates Notch signaling and drives stem cell expansion to promote the growth and invasion of ovarian cancer. J Biol Chem. 2017;292:16351–16359. doi:10.1074/jbc.M117.783936
27. Zhang X, Wang Y, Qian Y, et al. Discovery of specific metastasis-related N-glycan alterations in epithelial ovarian cancer based on quantitative glycomics. PLoS One. 2014;9:e87978. doi:10.1371/journal.pone.0087978
28. Noda K, Miyoshi E, Uozumi N, et al. Gene expression of alpha1-6 fucosyltransferase in human hepatoma tissues: a possible implication for increased fucosylation of alpha-fetoprotein. Hepatology. 1998;28:944–952. doi:10.1002/hep.510280408
29. Abbott KL, Nairn AV, Hall EM, et al. Focused glycomic analysis of the N-linked glycan biosynthetic pathway in ovarian cancer. Proteomics. 2008;8:3210–3220. doi:10.1002/pmic.200800157
30. Ito Y, Miyauchi A, Yoshida H, et al. Expression of alpha1,6-fucosyltransferase (FUT8) in papillary carcinoma of the thyroid: its linkage to biological aggressiveness and anaplastic transformation. Cancer Lett. 2003;200:167–172. doi:10.1016/S0304-3835(03)00383-5
31. Muinelo-Romay L, Vázquez-Martín C, Villar-Portela S, Cuevas E, Gil-Martín E, Fernández-Briera A. Expression and enzyme activity of alpha(1,6)fucosyltransferase in human colorectal cancer. Int j Cancer. 2008;123:641–646. doi:10.1002/ijc.23521
32. Ishida S, Lee J, Thiele DJ, Herskowitz I. Uptake of the anticancer drug cisplatin mediated by the copper transporter Ctr1 in yeast and mammals. Proc Natl Acad Sci U S A. 2002;99:14298–14302. doi:10.1073/pnas.162491399
33. Van den Steen P, Rudd PM, Dwek RA, Opdenakker G. Concepts and principles of O-linked glycosylation. Crit Rev Biochem Mol Biol. 1998;33:151–208. doi:10.1080/10409239891204198
34. Nguyen TT, Kurita T, Koi C, et al. GalNAc-T6 in the relationship with invasion ability of endometrial carcinomas and prognostic significance. Am J Cancer Res. 2017;7:1188–1197.
35. Freire T, Berois N, Sóñora C, Varangot M, Barrios E, Osinaga E. UDP-N-acetyl-D-galactosamine:polypeptideN-acetylgalactosaminyltransferase 6 (ppGalNAc-T6) mRNA as a potential new marker for detection of bone marrow-disseminated breast cancer cells. Int j Cancer. 2006;119:1383–1388. doi:10.1002/ijc.21959
36. Berois N, Mazal D, Ubillos L, et al. UDP-N-acetyl-D-galactosamine: polypeptide N-acetylgalactosaminyltransferase-6 as a new immunohistochemical breast cancer marker. j Histochem Cytochemistry. 2006;54:317–328. doi:10.1369/jhc.5A6783.2005
37. Yang R, Zhang H, Ma Y, et al. The role of ppGalNAc-T family in breast cancer development and progression. Indian J Cancer. 2015;52(Suppl 3):E144–147. doi:10.4103/0019-509X.186556
38. Tarhan YE, Kato T, Jang M, et al. Morphological changes, cadherin switching, and growth suppression in pancreatic cancer by GALNT6 knockdown. Neoplasia. 2016;18:265–272. doi:10.1016/j.neo.2016.03.005
39. Duan J, Chen L, Gao H, et al. GALNT6 suppresses progression of colorectal cancer. Am J Cancer Res. 2018;8:2419–2435.
40. Lin TC, Chen ST, Huang MC, et al. GALNT6 expression enhances aggressive phenotypes of ovarian cancer cells by regulating EGFR activity. Oncotarget. 2017;8:42588–42601. doi:10.18632/oncotarget.16585
41. Ren F, Wang DB, Li T, Chen YH, Li Y. Identification of differentially methylated genes in the malignant transformation of ovarian endometriosis. J Ovarian Res. 2014;7:73. doi:10.1186/1757-2215-7-73
42. Jacob F, Hitchins MP, Fedier A, et al. Expression of GBGT1 is epigenetically regulated by DNA methylation in ovarian cancer cells. BMC Mol Biol. 2014;15:24. doi:10.1186/1471-2199-15-24
43. Gao L, Zhang H, Zhang B, Zhu J, Chen C, Liu W. B3GNT3 overexpression is associated with unfavourable survival in non-small cell lung cancer. J Clin Pathol. 2018;71:642–647. doi:10.1136/jclinpath-2017-204860
44. Zhang W, Hou T, Niu C, Song L, Zhang Y. B3GNT3 Expression Is a Novel Marker Correlated with Pelvic Lymph Node Metastasis and Poor Clinical Outcome in Early-Stage Cervical Cancer. PLoS One. 2015;10:e0144360. doi:10.1371/journal.pone.0144360
45. Sun H, Chang J, Ye M, et al. GCNT4 is Associated with Prognosis and Suppress Cell Proliferation in Gastric Cancer. Onco Targets Ther. 2020;13:8601–8613. doi:10.2147/OTT.S248997
46. Huang HC, Chao CC, Wu PH, et al. Epigenetic silencing of the synthesis of immunosuppressive Siglec ligand glycans by NF-κB/EZH2/YY1 axis in early-stage colon cancers. Gene Regulatory Mechanisms. 2019;1862:173–183. doi:10.1016/j.bbagrm.2019.01.002
47. Manos EJ, Kim ML, Kassis J, Chang PY, Wells A, Jones DA. Dolichol-phosphate-mannose-3 (DPM3)/prostin-1 is a novel phospholipase C-gamma regulated gene negatively associated with prostate tumor invasion. Oncogene. 2001;20:2781–2790. doi:10.1038/sj.onc.1204379
48. Tang W, Li M, Qi X, Li J. β1,4-Galactosyltransferase V Modulates Breast Cancer Stem Cells through Wnt/β-catenin Signaling Pathway. Cancer Res Treatment. 2020;52:1084–1102.
49. Wang D, Zhu ZZ, Jiang H, et al. Multiple genes identified as targets for 20q13.12-13.33 gain contributing to unfavorable clinical outcomes in patients with hepatocellular carcinoma. Hepatol Int. 2015;9:438–446. doi:10.1007/s12072-015-9642-0
50. Murugaesu N, Iravani M, van Weverwijk A, et al. An in vivo functional screen identifies ST6GalNAc2 sialyltransferase as a breast cancer metastasis suppressor. Cancer Discov. 2014;4:304–317. doi:10.1158/2159-8290.CD-13-0287
51. Jia L, Luo S, Ren X, et al. miR-182 and miR-135b Mediate the Tumorigenesis and Invasiveness of Colorectal Cancer Cells via Targeting ST6GALNAC2 and PI3K/AKT Pathway. Dig Dis Sci. 2017;62:3447–3459. doi:10.1007/s10620-017-4755-z
52. Cao Q, Chen X, Wu X, et al. Inhibition of UGT8 suppresses basal-like breast cancer progression by attenuating sulfatide-αVβ5 axis. J Exp Med. 2018;215:1679–1692. doi:10.1084/jem.20172048
53. Dzięgiel P, Owczarek T, Plazuk E, et al. Ceramide galactosyltransferase (UGT8) is a molecular marker of breast cancer malignancy and lung metastases. Br J Cancer. 2010;103:524–531. doi:10.1038/sj.bjc.6605750
54. Gao P, Wang F, Huo J, et al. ALG13 Deficiency Associated with Increased Seizure Susceptibility and Severity. Neuroscience. 2019;409:204–221. doi:10.1016/j.neuroscience.2019.03.009
55. Bulc M, Całka J, Meller K, Jana B. Endometritis affects chemical coding of the dorsal root ganglia neurons supplying uterus in the sexually mature gilts. Res Vet Sci. 2019;124:417–425. doi:10.1016/j.rvsc.2019.05.003
56. Hennet T, Cabalzar J. Congenital disorders of glycosylation: a concise chart of glycocalyx dysfunction. Trends Biochem Sci. 2015;40:377–384. doi:10.1016/j.tibs.2015.03.002
57. Besse W, Dong K, Choi J, et al. Isolated polycystic liver disease genes define effectors of polycystin-1 function. J Clin Invest. 2017;127:1772–1785. doi:10.1172/JCI90129
58. Anderson S. GALT Deficiency Galactosemia. MCN. Am j Maternal Child Nursing. 2018;43:44–51. doi:10.1097/NMC.0000000000000388
59. Klebanoff CA, Gattinoni L, Restifo NP. Sorting through subsets: which T-cell populations mediate highly effective adoptive immunotherapy? J Immunother. 2012;35:651–660. doi:10.1097/CJI.0b013e31827806e6
60. Klebanoff CA, Gattinoni L, Torabi-Parizi P, et al. Central memory self/tumor-reactive CD8+ T cells confer superior antitumor immunity compared with effector memory T cells. Proc Natl Acad Sci U S A. 2005;102:9571–9576. doi:10.1073/pnas.0503726102
 © 2021 The Author(s). This work is published and licensed by Dove Medical Press Limited. The full terms of this license are available at https://www.dovepress.com/terms.php and incorporate the Creative Commons Attribution - Non Commercial (unported, v3.0) License.
By accessing the work you hereby accept the Terms. Non-commercial uses of the work are permitted without any further permission from Dove Medical Press Limited, provided the work is properly attributed. For permission for commercial use of this work, please see paragraphs 4.2 and 5 of our Terms.
© 2021 The Author(s). This work is published and licensed by Dove Medical Press Limited. The full terms of this license are available at https://www.dovepress.com/terms.php and incorporate the Creative Commons Attribution - Non Commercial (unported, v3.0) License.
By accessing the work you hereby accept the Terms. Non-commercial uses of the work are permitted without any further permission from Dove Medical Press Limited, provided the work is properly attributed. For permission for commercial use of this work, please see paragraphs 4.2 and 5 of our Terms.