")
Back to Journals » International Journal of General Medicine » Volume 15
A Novel Glycolysis and Hypoxia Combined Gene Signature Predicts the Prognosis and Affects Immune Infiltration of Patients with Colon Cancer
Authors Mao G, Wu J , Cui H, Dai LY , Ma L, Zhou Z, Liang B, Zhang S, Lin S
Received 14 December 2021
Accepted for publication 21 January 2022
Published 11 February 2022 Volume 2022:15 Pages 1413—1427
DOI https://doi.org/10.2147/IJGM.S351831
Checked for plagiarism Yes
Review by Single anonymous peer review
Peer reviewer comments 3
Editor who approved publication: Dr Scott Fraser
Guochao Mao,* Jianhua Wu,* Hanxiao Cui, Luyao Dai, Li Ma, Zhangjian Zhou, Baobao Liang, Shuqun Zhang, Shuai Lin
Department of Oncology, The Second Affiliated Hospital of Xi’an Jiaotong University, Xi’an, People’s Republic of China
*These authors contributed equally to this work
Correspondence: Shuai Lin; Shuqun Zhang, Department of Oncology, The Second Affiliated Hospital of Xi’an Jiaotong University, 157 Xiwu Road, Xi’an, Shaanxi, 710004, People’s Republic of China, Email [email protected]; [email protected]
Purpose: We aimed to characterize the expression patterns of glycolysis and hypoxia genes in colon cancers as well as their value in prognosis and immune microenvironment.
Methods: The expression profiles were acquired from the Cancer Genome Atlas database. Enrichment of hypoxia and glycolysis gene sets in colon cancer was identified by gene set enrichment analysis. Then, a prognostic signature was built up after Cox regression analyses, and overall survival analysis validated the predictive ability. Immune status and infiltration in cancer tissues were explored using the single sample gene set enrichment analysis and CIBERSORT algorithm. A nomogram model integrating clinical variables and the gene signature was established and assessed.
Results: Altogether, 378 cancer and 39 control cases were enrolled. Three glycolysis gene sets and two hypoxia gene sets were enriched in colon cancer (P < 0.05). Five independent genes (ENO3, GPC1, P4HA1, SPAG4, and STC2) were significantly correlated with prognosis of colon cancer patients. Patients with higher risks had significantly better prognosis than those with lower risks (P = 0.002 and AUC = 0.750), which was also observed in the elderly, female and stage I–II subgroups (P < 0.05). In high-risk cases, proportion of NK cells resting increased (P < 0.05) while that of dendritic cells activated (P < 0.05), dendritic cells resting (P < 0.01) and monocytes (P < 0.01) decreased. Besides, expressions of 22 checkpoint genes were found abnormal in groups with different risks (P < 0.05). The predictive nomogram presented satisfactory performance with C-index of 0.771 (0.712– 0.830). The area under ROC curve was 0.796 and 0.803 for 3- and 5-year survival prediction, respectively.
Conclusion: A glycolysis and hypoxia combined gene signature was a promising method to evaluate the prognosis and immune infiltration of colon cancer patients, which may provide a new tool for cancer management.
Keywords: colon cancer, gene signature, glycolysis, hypoxia, prognosis
Introduction
The prevalence of colon cancer ranks the third worldwide.1 Compared with patients diagnosed at stage I or II, the 5-year survival rate of those at stage IV declines to 12%, with a decrease of 86.8% and 85.4%, respectively.2 The prognosis of colon cancer patients varies at different stages. More efforts are needed to find a reliable and accurate prognostic model or staging system to assess the prognosis and specify treatment strategies of patients with colon cancer.
Emerging evidence indicated that colon cancer should be considered primarily as a metabolic disease involving rewiring of cellular metabolism, a characteristic of most cancer types.3 Cancer cells exhibit metabolic profile, including extensive consumption of glucose and glutamine and extensive glycolysis4 and the glycolysis was a preferential choice for energy generation instead of oxidative phosphorylation in tumors, which is known as the “Warburg effect”.5 Many more metabolic pathways observed in cancer cells often include glucose, glutamine and lipid metabolism.6 Furthermore, hypoxia is a significant cellular metabolic process in neoplasia related to the Warburg effect and the clinical prognosis of cancer patients.7,8 As a hallmark of tumor microenvironment, hypoxia changes expression profile and affects immune response, which has been noticed to impact immunotherapy and seen as potential targets in cancer treatment.9,10 Besides, oncogenes and tumor suppressors have been discovered in these reprogrammed energy metabolisms, and these cancer-associated metabolic changes provide cancer cells with energy for initiation, progression and spreading.11
Here, a glycolysis and hypoxia combined gene signature was built up for a more accurate prediction of the prognosis and evaluation of immune infiltration in colon cancer patients. Furthermore, a nomogram was established combining this gene signature with clinicopathological factors for more comprehensive and accurate prognosis prediction.
Materials and Methods
Collection of Clinical Parameters and Gene Expression
The Genomic Data Commons Data Portal (https://portal.gdc.cancer.gov/) is a powerful data-driven platform that provides researchers and bioinformaticians with access to search and download cancer data for analysis. We sought and obtained the clinical parameters and RNA expression profiles from The Cancer Genome Atlas (TCGA) database on this platform. The main clinical parameters include gender, age at diagnosis, tumor stage, follow-up time and survival status. Finally, we included 417 samples (378 colon cancer and 39 normal tissues) for our analysis. The general clinicopathological information is detailed in Table 1. The procedure of the analyses in this study is shown in Supplementary Figure 1.
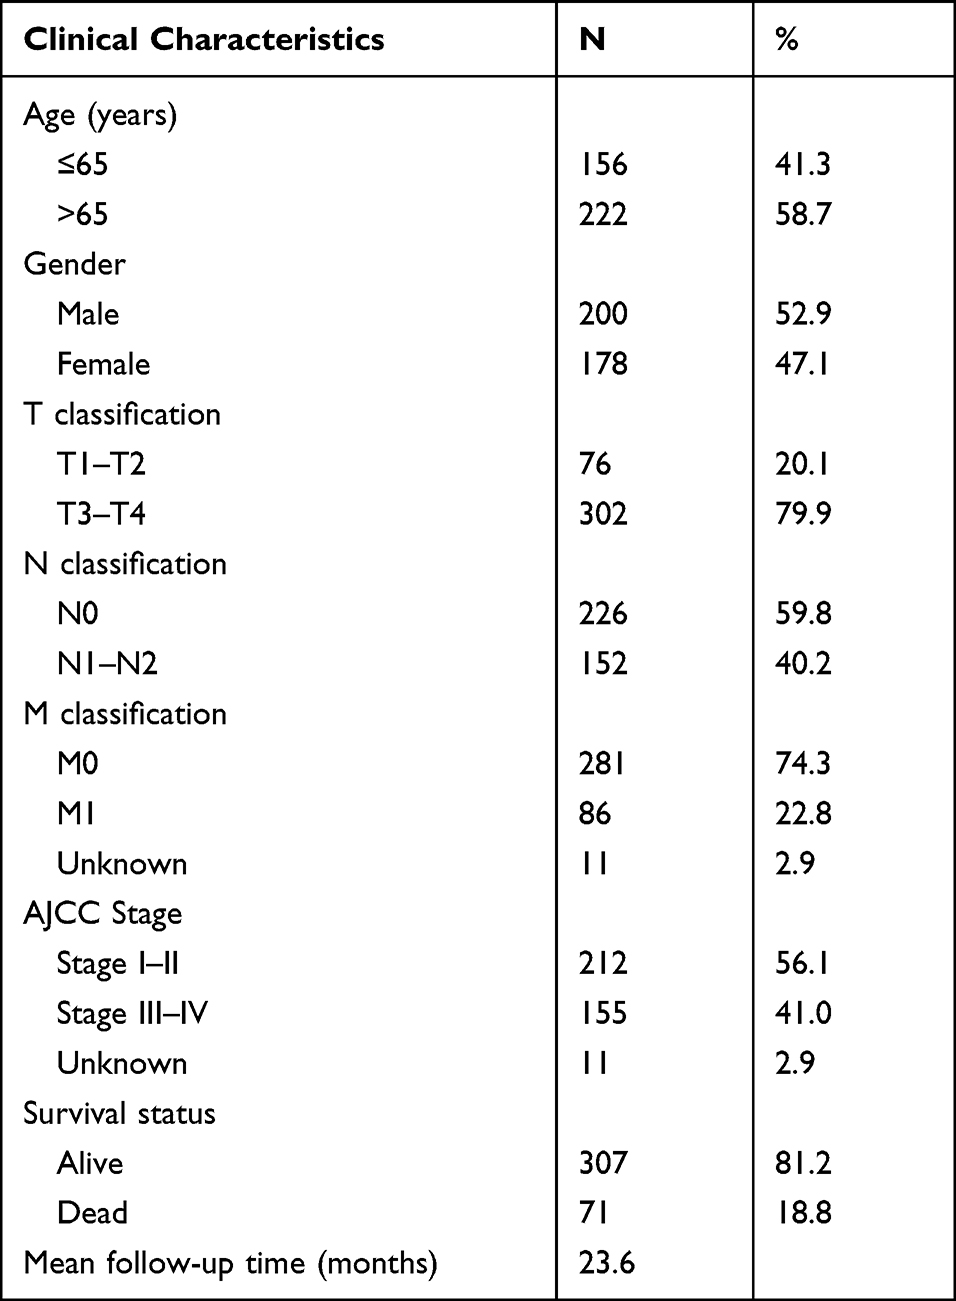 |
Table 1 Summary of Baseline Clinicopathological Features of Patients with Colon Cancer in This Research |
Gene Set Enrichment Analysis (GSEA)
Genes that possess similar chromosomal localization, functions, pathways or other features can be collected into one gene set. GSEA was performed to select glycolysis and hypoxia gene sets enriched among cases of colon cancer patients by GSEA software.12 Before GSEA analysis, we searched the Molecular Signatures Database (https://www.gsea-msigdb.org/gsea/msigdb) and obtained five predefined glycolysis-related gene sets (BioCarta glycolysis, hallmark glycolysis, GO glycolytic, reactome glycolysis gene sets and KEGG glycolysis) and six hypoxia-related gene sets (Buffa hypoxia, Harris hypoxia, Mizukami hypoxia up, Mizukami hypoxia down, reactome cellular response to hypoxia, and Winter hypoxia gene sets). For each analysis, gene set files, gene expression, and phenotype labels files were loaded in GSEA software. To reach normalized enrichment score (NES), we conducted the gene set permutations were for 1000 times. The minimum and maximum criteria for gene sets selection were 15 and 500 genes, respectively. Finally, the gene sets with |NES| > 1.6, P < 0.05 and false discovery rate (FDR) <0.1 were proceeded for further subsequent analysis.
Construction of Glycolysis and Hypoxia Gene Signature
To sort out the survival-related glycolysis and hypoxia genes, univariate Cox regression analysis was firstly initiated among the identified gene sets followed by the multivariate Cox regression analysis when P value <0.1 observed in the univariate Cox analysis. Then, using a linear combination of gene expression levels, a novel gene signature associated with glycolysis and hypoxia was established to predict prognosis. The risk score is defined as f (s, Z) = f0(s) × exp (expression of gene1 × α1 + expression of gene2 × α2 + ⋯ + expression of genen × αn). Z represents gene expression of each case in the formula and f0(s) is a constant, which was confirmed in the multivariate Cox regression analysis. Besides, number n refers to the number of genes with independent prognostic value and αn represents the corresponding regression coefficient. Exp () denotes an exponential function with the base e. Risks of all patients were calculated, after which they were divided into two risk categories with the median risk value.
Comparisons of Immune Cell Infiltration and Checkpoint Genes Expression Between Two Groups
Immune responses and immunocytes’ infiltration were analyzed within high- and low-risk groups by the single sample gene set enrichment analysis (ssGSEA) with the “GSVA” R package.13,14 General immune status of each patient was assessed by ESTIMATE score, stromal score, immune score and tumor purity score. Additionally, in each colon cancer sample, we utilized CIBERSORT algorithm and depicted the profile of 22 immunocyte subtypes.15 Furthermore, expressions of checkpoint genes were compared, such as CD276 and CTLA4, between the high- and low-risk groups to explore the potential significance of this multiple genes combined model in immunotherapy response evaluation.
Establishment and Assessment of the Nomogram
Incorporating clinicopathological factors with the gene signature, a comprehensive nomogram was constructed using the “rms” package of R software to predict the prognosis of colon cancer patients. Harrell’s C-index was then calculated to estimate the overall survival discrimination ability of the nomogram model. A higher Harrell’s C-index demonstrates a better discrimination ability. Besides, the precision of the nomogram model was evaluated through ROC curves and calibration plots.
Statistical Analysis
The prognostic genes were sorted by univariate and multivariate Cox analyses, which were further evaluated by Kaplan–Meier analysis and Log rank test. Student’s t-test was used for comparison of continuous variables in this study. R software was utilized to construct the heatmaps, forest plots, nomogram plot, ROC curves, and calibration plots. A P-value of less than 0.05 is statistically significant. All statistical analyses were conducted by R software (v.4.0.2) and Excel software (Microsoft).
Results
Identification of Gene Sets Enriched in Colon Cancer by GSEA
In colon cancer cases, three glycolysis and two hypoxia gene sets were enriched significantly through GSEA, including GO glycolytic process (NES = 1.91, P = 0.001, FDR = 0.002), hallmark glycolysis (NES = 1.71, P = 0.005, FDR = 0.01), reactome glycolysis (NES = 2.00, P < 0.001, FDR < 0.001), Buffa hypoxia (NES = 1.86, P = 0.004, FDR = 0.008) and reactome cellular response to hypoxia gene sets (NES = 1.71, P = 0.026, FDR = 0.05) (Figure 1).
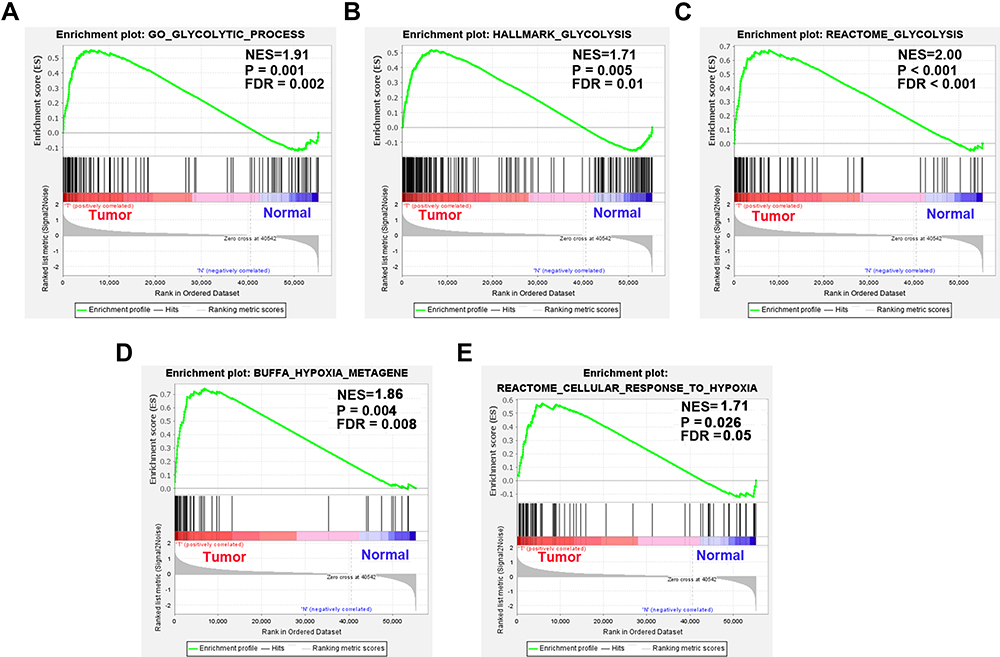 |
Figure 1 Enrichment plots of five gene sets between colon cancer and normal tissues performed by GSEA. (A) GO glycolytic process, (B) hallmark glycolysis, (C) reactome glycolysis, (D) Buffa hypoxia and (E) reactome cellular response to hypoxia gene sets. |
Identification of Prognostic Glycolysis and Hypoxia Genes in Colon Cancer Patients
Based on gene expression analysis, we found that expressions of 95 genes were downregulated and that of 225 genes were upregulated in colon cancer cases when compared to normal ones (Supplementary Figure 2). Through univariate and multivariate Cox regression analysis, ENO3, STC2, SPAG4, GPC1, and P4HA1 genes were identified as independent indicators associated with the prognosis of colon cancers (Figure 2; Table 2). The risk of each patient was calculated by a signature model composed of the glycolysis and hypoxia genes obtained previously. Based on the median risk value, the whole cohort was stratified into high- or low-risk groups for further validation of the five-gene signature. Then, a heatmap exhibited the expression of the five genes between the two groups (Figure 3). As shown in Figure 4A and B, the distribution of survival status and risk scores of colon cancer patients indicated poorer prognosis of patients with higher risks. And the area under the ROC curve was 0.750 which indicated a good accuracy for prognosis prediction (Figure 4C). It was further confirmed by Log rank test and Kaplan–Meier survival analysis that patients with higher risks were likely to have significantly poorer prognoses (P = 0.002, Figure 4D).
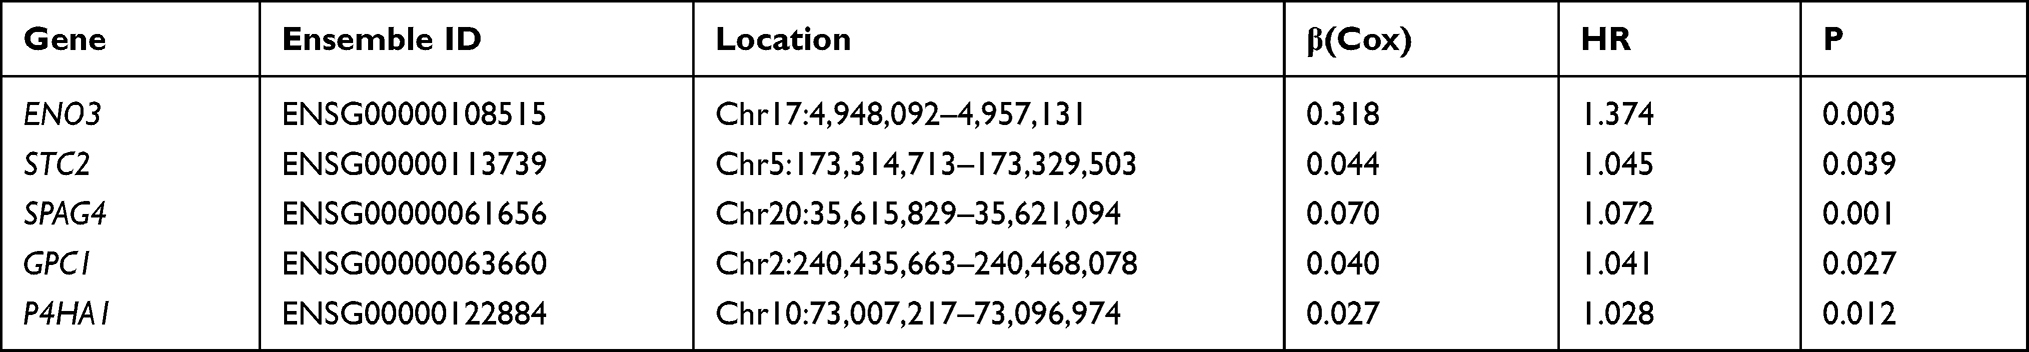 |
Table 2 The Information of Five Prognostic Glycolysis Genes Associated with Overall Survival in Patients with Colon Cancer |
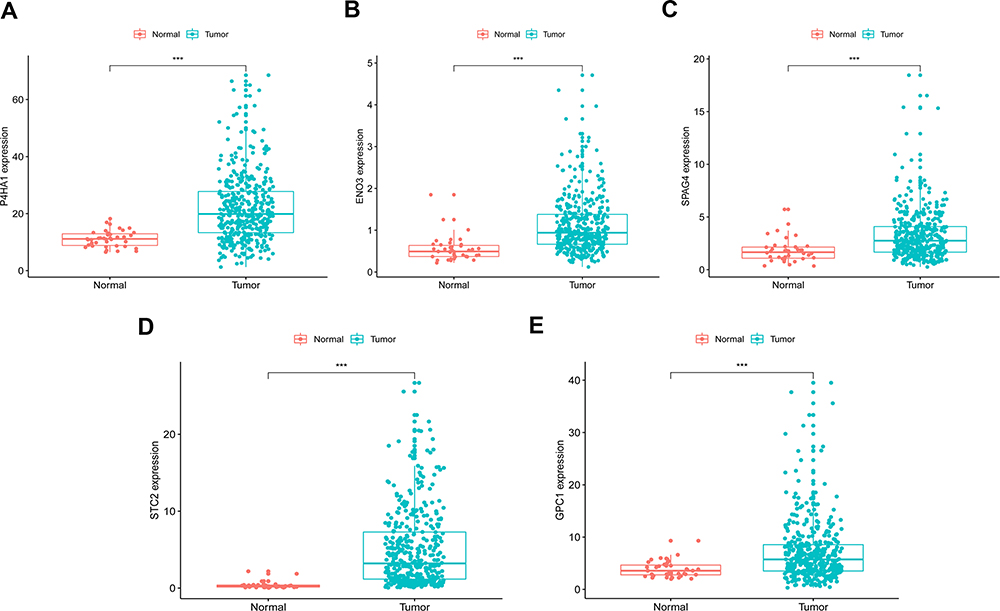 |
Figure 2 Five identified gene expression profiles between colon cancer and normal tissues. (A) P4HA1, (B) ENO3, (C) SPAG4, (D) STC2 and (E) GPC1. *** Indicates P-value <0.001. |
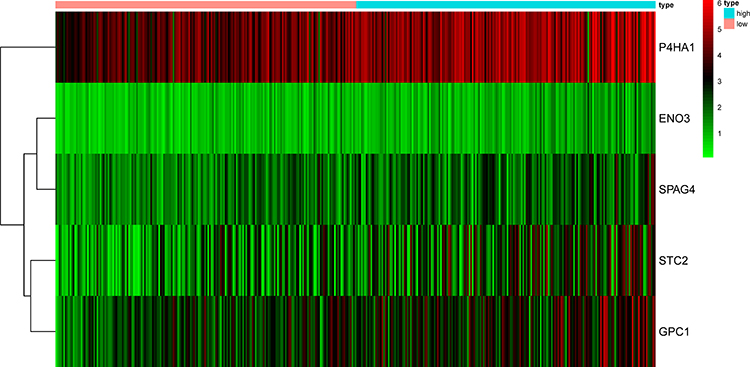 |
Figure 3 Heat map of the five genes that were used to construct the risk score model. |
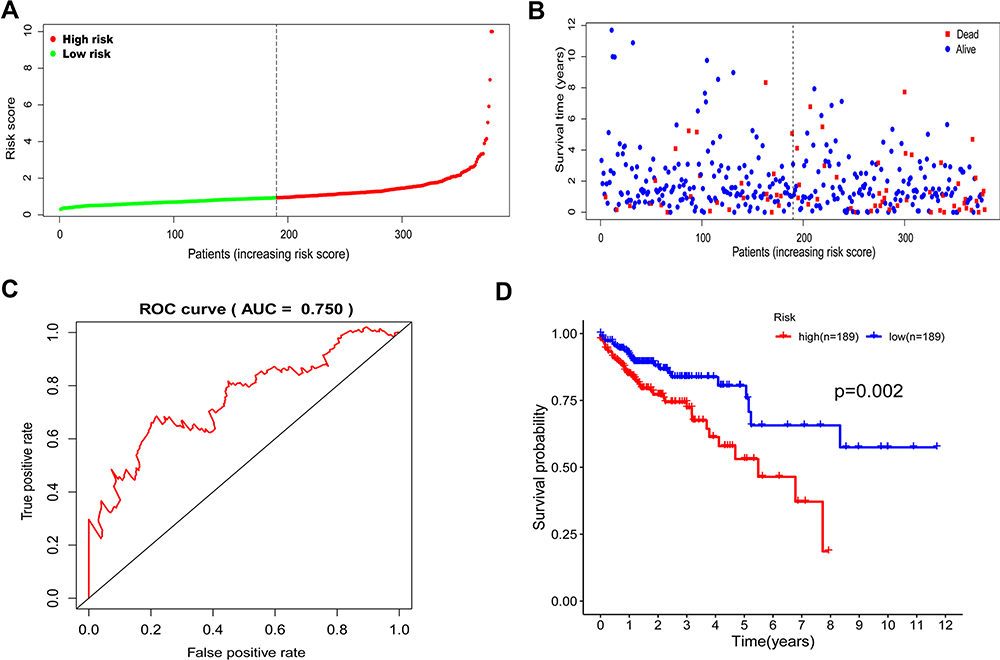 |
Figure 4 The glycolysis gene signature related to risk score predicts the overall survival of colon cancer patients. (A and B) Patient risk score distribution and survival status. (C) The prognostic power of the gene signature was evaluated using the AUC value of the ROC curve. (D) Kaplan–Meier curves of overall survival in high- or low- risk groups. |
Performance of the Prognostic Gene Signature in Subgroups by Age, Gender and AJCC Stage
Furthermore, prognostic factors were selected by univariate and multivariate Cox analyses in colon cancer patients. The univariate Cox analysis concluded that risk score (P < 0.001, HR = 1.280, 95% confidence interval (CI): 1.178–1.391), age (P = 0.018, HR = 1.030, 95% CI: 1.005–1.055), and AJCC stage (P < 0.001, HR = 2.502, 95% CI: 1.851–3.382) were significantly associated with the overall survival of colon cancer (Figure 5A). Multivariate Cox regression showed that risk score (P < 0.001, HR = 1.263, 95% CI: 1.155–1.382), age (P < 0.001, HR = 1.045, 95% CI: 1.019–1.071), and AJCC stage (P < 0.001, HR = 2.680, 95% CI: 1.952–3.680) were independent risk factors of overall survival (Figure 5B). Through the Log rank tests and Kaplan–Meier survival analyses, we found that patients over 65 years old and at stage III–IV had significantly poorer prognoses than the control groups (Figure 5C–E).
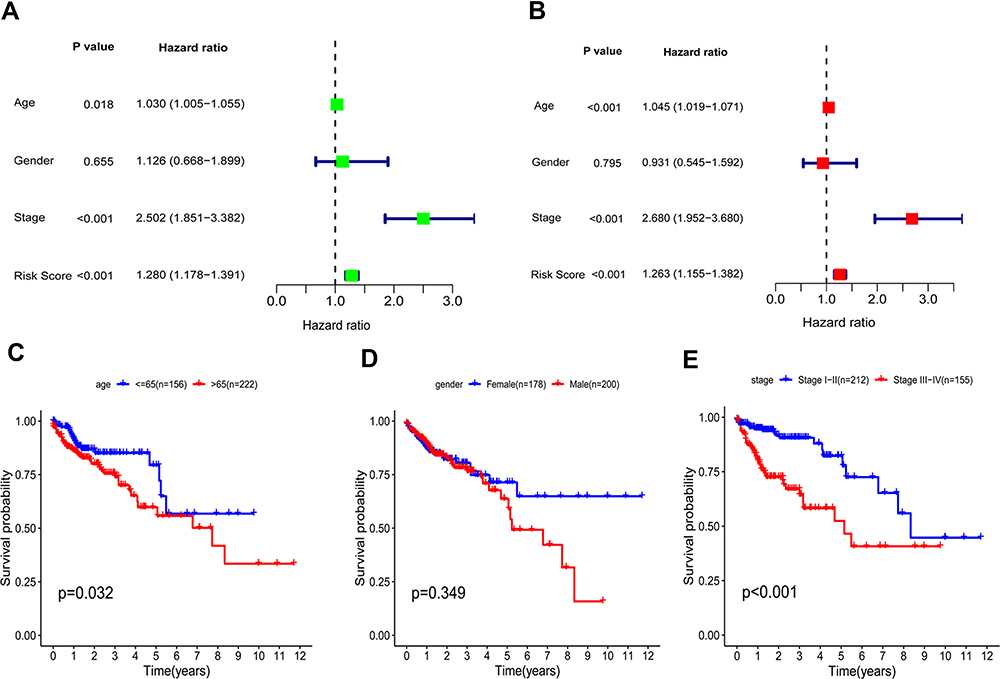 |
Figure 5 Risk score based on the gene signature acts as an independent prognostic marker. (A and B) Univariable and multivariable analysis of risk score and various clinical factors. (C–E) Kaplan–Meier curves survival analysis in different groups classified by age, gender, and AJCC stage. |
Then, we classified all patients into different categories according to age (≤65 versus >65 years), gender (female versus male), and AJCC stage (stage I–II versus stage III–IV), and by the median risk value, they were then classified into high- or low-risk groups. High scores indicated worse prognosis in the elderly (>65 years old) subgroup (P = 0.003; Figure 6B), female subgroup (P = 0.007; Figure 6C), and stage I–II subgroup (P = 0.037; Figure 6E), but no striking difference in prognosis was discovered between high and low-risk group in the young (≤65 years old) (P = 0.297; Figure 6A), male (P = 0.168; Figure 6D) and stage III–IV (P = 0.077; Figure 6F) subgroups.
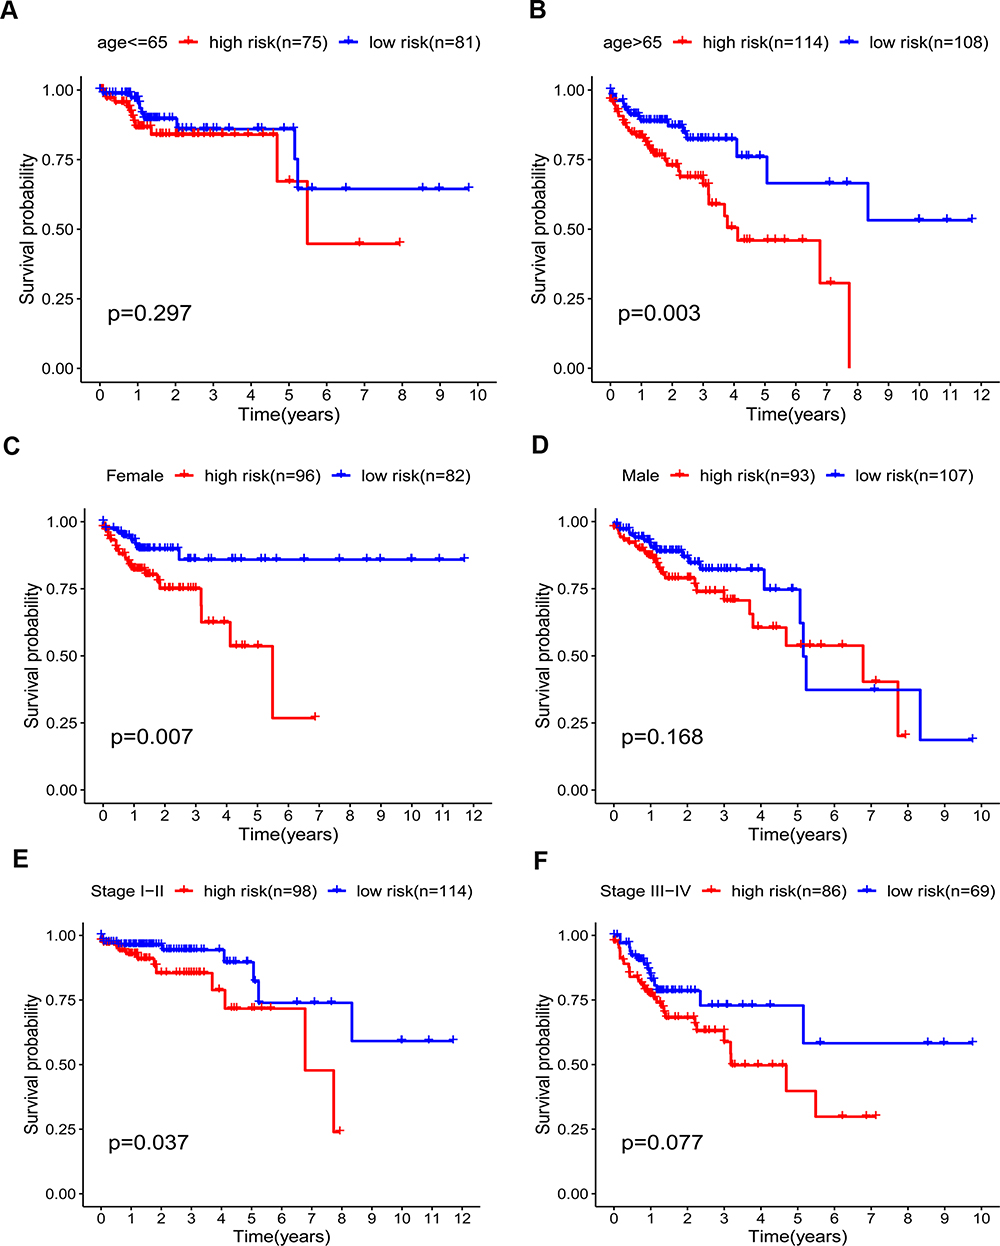 |
Figure 6 Kaplan–Meier curves for the prognostic value of risk-score signature for the patients with colon cancer stratified by various clinical features in the TCGA dataset. (A and B) Age. (C and D) Gender. (E and F) AJCC stage. |
Status of Immune Infiltration and Checkpoint Genes Between High- and Low-Risk Groups
From the results of ssGSEA, immune responses, pathways and immunocytes infiltration were analyzed between the two risk groups and presented in a heat map (Figure 7A). Besides, to assess the general immune status of each case, we calculated the ESTIMATE score, stromal score, immune score and tumor purity score with the “estimate” package by R software, which was also shown in the heatmap. Furthermore, weighed by respectively specific expression profile, 22 immunocyte subtypes in colon cancers were speculated by the CIBERSORT algorithm (Figure 7B). In high-risk group, the proportion of NK cells resting significantly increased (P < 0.05) while that of monocytes (P < 0.01), dendritic cells resting (P < 0.01) and dendritic cells activated (P < 0.05) significantly decreased compared to low-risk group.
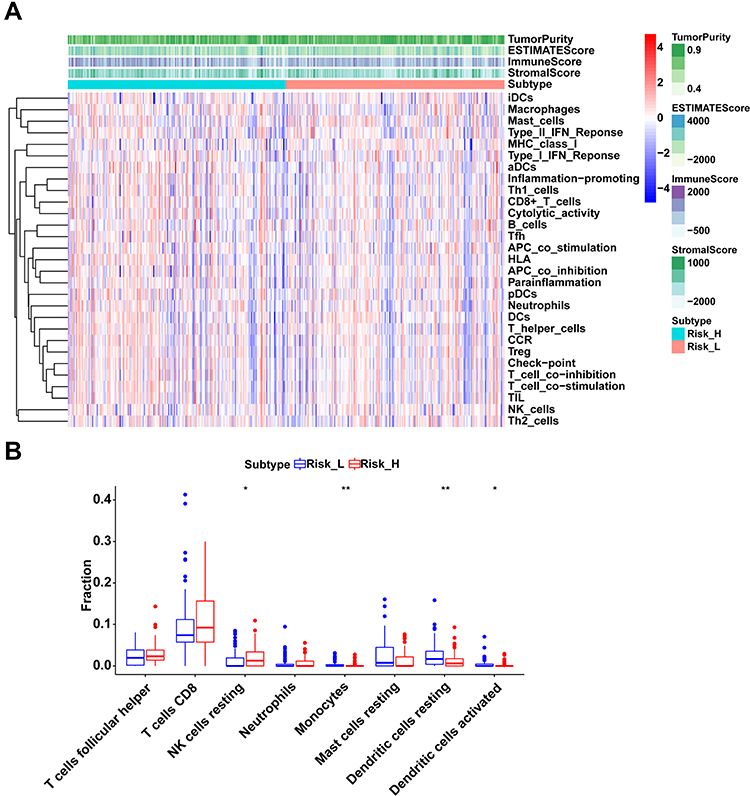 |
Figure 7 Immune status and immunocyte subtypes in high- and low-risk groups. (A) Immune responses, pathways and general immune status in all cases of colon cancer. (B) Immunocyte subtypes differences between high- and low-risk groups. *indicates P-value < 0.05, ** indicates P-value < 0.01. |
Additionally, expression profiles of acknowledged immune checkpoint genes were compared between the two groups and altogether 22 differentially expressed checkpoint genes were observed (P < 0.05; Figure 8A). Most of them tended to overexpress in the high-risk group. Then, we explored the relationship between the prognostic gene signature and checkpoint genes, and the expression of most checkpoint genes were positively correlated with estimated risk scores (P < 0.05). We depicted part of the conclusion in scatter plots (Figure 8B) and the rest of them were shown in Supplementary Figure 3.
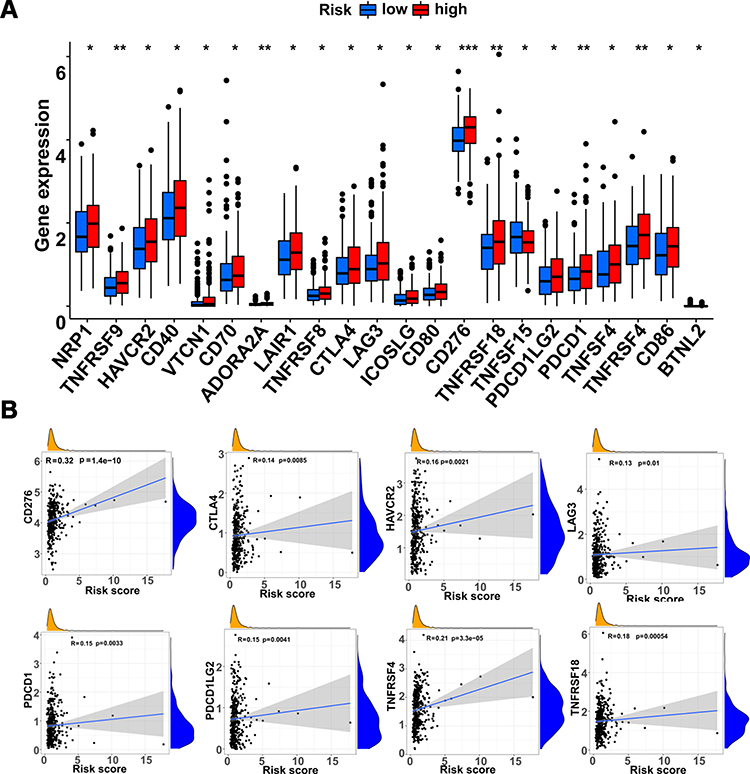 |
Figure 8 Relationship between immune checkpoint genes and the gene signature. (A) Differential expression of checkpoint genes between high- and low-risk groups. (B) Scatter plots of the checkpoint genes and signature-based risk scores. *indicates P-value < 0.05, ** indicates P-value < 0.01. *** indicates P-value < 0.001. |
Construction of the Nomogram Model Based on Glycolysis and Hypoxia Gene Signature and Other Clinicopathological Parameters
Based on the gene signature and independent prognostic parameters, an integrative nomogram was built to provide a new tool to predict the survival probability for colon cancer patients (Figure 9A). The survival probability of each individual can be simply calculated and intuitively presented through the cumulative score of all identified values (Supplementary Table 1). Patients were assigned a nomogram risk score and separated into high and low-risk groups. Patients at higher risks were validated to have significantly worse prognoses (Figure 9B). The area under the ROC curves of 3- and 5-year survival probability prediction were 0.796 and 0.803, respectively, showing the good performance of the nomogram in prognosis prediction of colon cancer (Figure 9C and D). Besides, by calculating the Harrell C-index, the predictive accuracy of the nomogram model was measured and the C-index is 0.771 (95% CI: 0.712–0.830) in the internal verification of the nomogram, which indicates good discrimination ability. Calibration plots of 3- or 5-year survival probability prediction also showed the good performance of the nomogram in prognosis prediction of colon cancer patients (Figure 9E and F).
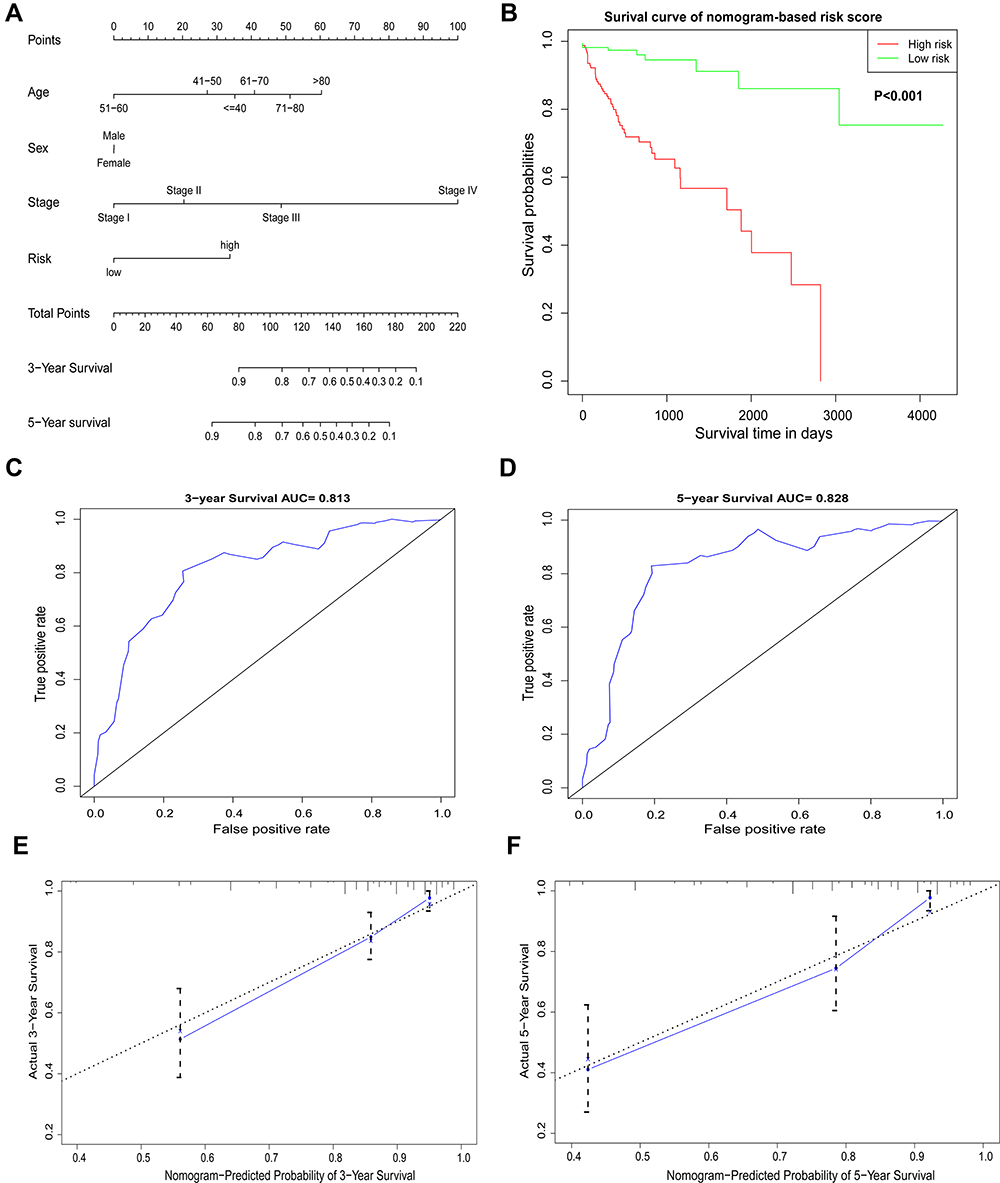 |
Figure 9 The nomogram for 3- and 5-year overall survival (OS) prediction. (A) Nomogram combining the gene signature and clinical features to predict the 3- and 5-year OS of colon cancer patients. (B) Kaplan–Meier curve of OS in high- or low-risk groups. (C) ROC curve for 3-year OS prediction. (D) ROC curve for 5-year OS prediction. (E) Calibration curve of the nomogram for the prediction of 3-year OS. (F) Calibration curve of the nomogram for the prediction of 5-year OS. |
Discussion
It is a distinguishing characteristic in cancer cells that they exhibit remarkably increased metabolic requirements in comparison to normal cells. To maintain their rapid proliferation, cancer cells behaved more glucose consumption and lactic acid production rather than catabolizing glucose via the tricarboxylic acid cycle.16,17 Along with the aggressive growth, oxygen levels drop down to hypoxic levels in the microenvironment and more cells in return change the metabolic pathway towards glycolysis for essential energy supply.9,18 Glycolytic intermediates under hypoxia provide continuous energy and nutrients to support uncontrolled proliferation, tumor invasion, and metastasis, and eventually contribute to tumor growth and survival.19,20 Besides, glycolytic and hypoxic pathway metabolites are widely acknowledged to promote immune cell activation and inflammatory infiltration in tumors.21 Thus, it is the glycolysis and hypoxia status that may serve as emerging hallmarks in cancer proliferation, infiltration and metastasis and a potential biomarker for prognosis prediction of cancers. Importantly, identifying glycolysis and hypoxia-related genes may have prognostic value for patients with colon cancer.
Increasing evidence shows that more information is needed to accurately predict prognosis, not just traditional clinicopathological factors. Thus, tumor markers that can accurately predict the oncological outcomes when incorporated with clinicopathological features are essential for predicting the outcomes of colon cancers.22–24 More and more evidences show that glycolysis and hypoxia-related genes have good performance in predicting the clinical prognosis of various kinds of solid tumors. For example, a four-gene signature derived from the REACTOME glycolysis gene set had a significant correlation with metastasis and survival of bladder cancer patients.25 High glycolysis scores integrating 10 glycolytic genes profiles predicted poor prognosis and poor chemotherapy response, closely associated with IDH1 mutation in glioblastoma.26 Another four-gene signature based on hypoxia and immune status performed promising prognostic assessing ability in gastric cancer27 and similar hypoxia-immune prognostic signature was developed and validated in head and neck cancer.28 Here, we provide evidence that glycolysis and hypoxia gene signature is an independently effective method for prognostic assessment strategy for colon cancer patients.
In this research, we established a five-gene signature (ENO3, STC2, SPAG4, GPC, and P4HA1) using data from the TCGA database to predict prognosis of colon cancer. Risk of each patient was calculated and survival analysis revealed that patients with higher predicted risk had worse clinical outcome. In further subgroup analysis, the gene signature could classify patients with different prognosis in elderly (>65 years old), female and stage I-II subgroups. However, in the other subgroups, low-risk patients showed the tendency of better overall survival without statistical significance, which might result from insufficient patient cohort and limited follow-up time. Besides, patients under 65 years old or at stage III-IV were more likely to have similar good or bad survival rates that this risk model had difficulty in distinguishing them. As for the survival similarity between the two subgroups in male patients, more investigation is needed. Anyway, the five-gene signature is more suitable for survival prediction of the whole patient cohort. Immune responses, infiltration and checkpoint genes were explored in patients with different risk scores, revealing the impact of glycolysis and hypoxia signature on immune status and indicating more potential targets for immunotherapy. Additionally, a nomogram was built up by integrating the gene signature with clinicopathological parameters (age, gender, and AJCC stage) to efficiently predict the clinical outcome in patients with colon cancer.
ENO is one of the key enzymes in glycolysis.29,30 It can catalyze the conversion of 2-phosphoglycerate to the high-energy compound phosphoenolpyruvate, which is present in almost all adult tissues.31 ENO3, also known as γ-enolase, is acknowledged to be upregulated in multiple cancer cases in humans, such as gastric cancer, glioma, breast cancer, head and neck cancer, lung cancer, endometrial cancer, pancreatic adenocarcinoma, and non-Hodgkin’s lymphoma.32 The studies showed that glucose metabolism significantly decreased after knocking down ENO3 and it was validated strongly that in lung cancer cells, loss-of-function mutation of the gene STK11 directly stimulated the overexpression of ENO3.30 Functional annotation also revealed that ENO3 was enriched in the hypoxia-inducible factor 1 pathway.33 It was known that ENO3 is prognostic and high expression is unfavorable in colorectal cancer. In accordance, it was also noticed that high expression of ENO3 had a close correlation with tumor metastasis, indicating that patients with colon cancer have a poor prognosis.
STC2, a secreted glycoprotein hormone of as yet unknown functions, is thought to be involved in an autocrine or a paracrine pattern.34 Its expression was demonstrated to be induced by estrogen, retinoic acid, progesterone, hypoxia, and/or unfolded protein responses and repressed by anti-estrogen in many human cancer cell lines.35,36 Under hypoxic conditions, the proliferation and expansion of cells in breast and ovarian cancers were stimulated by the overexpression of gene STC2, showing that STC2 was likely a HIF-1 target gene.37 However, underlying crosstalk and mechanism of STC2 under hypoxic conditions in colorectal cancer has not been fully understood. In our study, we found that higher expression of STC2 was significantly related to a worse prognosis of colon cancer patients, addressing its close relationship with colon cancer cells.
SPAG4, a member of the SUN (Sad-1, UNC-84) protein family, was originally noticed to be a testicular specific gene, participating in sperm tail development, nuclear membrane integrity maintenance and nuclear remodeling.38 Additionally, recent researches had also illustrated that SPAG4 could act as a new tumor marker, which affects the biological behavior of tumors.39,40 It was found that SPAG4 expression was upregulated in various cancers in humans, including lung cancer,39 renal cell carcinoma41 and glioblastoma.42 So far, studies had hardly reported the SPAG4 expression and its effect on prognosis in colon cancer. The underlying molecular mechanisms played by SPAG4 in tumors are still poorly understood. Given the current evidence, it may appear to include the following actions. Ji et al confirmed that SPAG4 and Nesprin3 interaction have fundamental pathological functions in the process of lung carcinoma cell migration.39 The results of the study in glioblastoma indicated that by repressing the MEK/ERK signaling pathway activation, SPAG4 knockout remarkably suppressed the growth of brain tumor cells including proliferation and migration.42 Our research unraveled the independent prognostic significance of gene SPAG4 in colon cancer. Combined with these studies, we further confirmed that glycolysis and hypoxia-related SPAG4 gene risk score model can be accurate in predicting prognosis.
GPC1 was overexpressed in various cancers in humans, including breast cancer,43 pancreatic cancer,44,45 and glioma.46 GPC1 participates in tumor growth and angiogenesis by activating FGF-FGFR signaling.47–49 Li J et al found that GPC1 overexpression significantly suppressed E-cadherin and increased vimentin protein expression in colorectal cancer cells, GPC1 gene overexpression significantly upregulated Snail protein expression in colorectal cancer cell lines.50 Furthermore, overexpression of the GPC1 gene promoted cell invasion, migration, and epithelial-mesenchymal transition. In contrast, silencing of GPC1 gene expression had the opposite effect. Consistently, our data also showed a high GPC1 expression significantly related to a poorer prognosis in patients with colon cancer.
P4HA1 is involved in the formation of proline 4-hydroxylase, maintains the stability of collagen, causes changes in the cancer microenvironment, which therefore participates in the occurrence and metastasis of tumors. In recent decades, the correlation between P4HA1 and different tumors has attracted people’s attention. It was found that hypoxia-inducible factor 1 was widely involved in ECM remodeling by regulating P4HA1 and P4HA2, thereby regulating the occurrence and development of tumors.51 A new study indicated that miR-122 inhibits the epithelial-mesenchymal transformation process by targeting P4HA1, thereby regulating the invasion and abdominal metastasis of ovarian cancer.52 Higher P4HA1 expression was found in some tumor tissues compared with nontumor tissues. Subgroup analyses proved that in normal tissue group, expression of gene P4HA1 was lower than those with stage I in all three types of tumors,53 suggesting that P4HA1 could be an appropriate biomarker for early diagnosis of these cancers. Combined with our findings, P4HA1 could function as a key indicator in monitoring prognosis of patients with colon cancer.
Conclusion
This research constructed a five-gene (ENO3, STC2, SPAG4, GPC1, and P4HA1) signature and a comprehensive nomogram model integrating clinical prognostic features (age, gender and AJCC stage) and this gene signature to predict overall survival and the immune microenvironment of colon cancer. These findings could provide an innovative method in predicting the prognosis of colon cancer patients and specifying treatment strategies.
Data Sharing Statement
The datasets analyzed for this study can be found in the TCGA (https://portal.gdc.cancer.gov/), Molecular Signatures Database (https://www.gsea-msigdb.org/gsea/msigdb), and cBioportal (http://www.cbioportal.org/). The data are also available from the corresponding author upon request.
Ethics Approval and Informed Consent
After reviewing and studying the related materials, the medical ethics committee of Second Affiliated Hospital of Xi’an Jiaotong University thinks the content of the project is in accordance with the requirements of medical ethics and agree the article to be published
Consent for Publication
All authors have approved the final manuscript and agreed to publish.
Acknowledgments
We thank all contributors of R software packages and TCGA data used in this study.
Author Contributions
SL and SQZ conceived and designed the research. GCM and JHW performed the data collection, bioinformatics analysis, and wrote the initial manuscript. HXC, LYD and LM analyzed the data and generated the figures and tables. ZJZ and BBL conceptualized and revised the manuscript.
All authors made a significant contribution to the work reported, whether that is in the conception, study design, execution, acquisition of data, analysis and interpretation, or in all these areas; took part in drafting, revising or critically reviewing the article; gave final approval of the version to be published; have agreed on the journal to which the article has been submitted; and agree to be accountable for all aspects of the work.
Funding
This study was supported by the National Natural Science Foundation of China (No. 82103129), Basic Research Program of Natural Science Foundation of Shaanxi Province (No. 2021JQ-422), Funds for Prior Science and Technology Programs for Overseas Chinese Talents of Shaanxi Province (No. 2020-015) and International Science and Technology Cooperation Program Project of Shaanxi Province (2018KW-058).
Disclosure
The authors report no conflicts of interest in this work.
References
1. Siegel RL, Miller KD, Jemal A. Cancer statistics, 2019. CA Cancer J Clin. 2019;69(1):7–34. doi:10.3322/caac.21551
2. Miller KD, Nogueira L, Mariotto AB, et al. Cancer treatment and survivorship statistics, 2019. CA Cancer J Clin. 2019;69(5):363–385. doi:10.3322/caac.21565
3. Hanahan D, Weinberg RA. Hallmarks of cancer: the next generation. Cell. 2011;144(5):646–674. doi:10.1016/j.cell.2011.02.013
4. Coller HA. Is cancer a metabolic disease? Am J Pathol. 2014;184(1):4–17. doi:10.1016/j.ajpath.2013.07.035
5. Warburg O. On the origin of cancer cells. Science. 1956;123(3191):309–314. doi:10.1126/science.123.3191.309
6. Pavlova NN, Thompson CB. The emerging hallmarks of cancer metabolism. Cell Metab. 2016;23(1):27–47. doi:10.1016/j.cmet.2015.12.006
7. La Vecchia S, Sebastián C. Metabolic pathways regulating colorectal cancer initiation and progression. Semin Cell Dev Biol. 2020;98:63–70. doi:10.1016/j.semcdb.2019.05.018
8. Zhang D, Tang Z, Huang H, et al. Metabolic regulation of gene expression by histone lactylation. Nature. 2019;574(7779):575–580. doi:10.1038/s41586-019-1678-1
9. Jing X, Yang F, Shao C, et al. Role of hypoxia in cancer therapy by regulating the tumor microenvironment. Mol Cancer. 2019;18(1):157. doi:10.1186/s12943-019-1089-9
10. Riera-Domingo C, Audigé A, Granja S, et al. Immunity, hypoxia, and metabolism-the ménage à trois of cancer: implications for immunotherapy. Physiol Rev. 2020;100(1):1–102. doi:10.1152/physrev.00018.2019
11. Vander Heiden MG, DeBerardinis RJ. Understanding the intersections between metabolism and cancer biology. Cell. 2017;168(4):657–669. doi:10.1016/j.cell.2016.12.039
12. Subramanian A, Tamayo P, Mootha VK, et al. Gene set enrichment analysis: a knowledge-based approach for interpreting genome-wide expression profiles. Proc Natl Acad Sci USA. 2005;102(43):15545–15550. doi:10.1073/pnas.0506580102
13. Hänzelmann S, Castelo R, Guinney J. GSVA: gene set variation analysis for microarray and RNA-seq data. BMC Bioinform. 2013;14(1):7. doi:10.1186/1471-2105-14-7
14. Zhou Z, Xie X, Wang X, et al. Correlations between tumor mutation burden and immunocyte infiltration and their prognostic value in colon cancer. Front Genet. 2021;12:623424. doi:10.3389/fgene.2021.623424
15. Newman AM, Liu CL, Green MR, et al. Robust enumeration of cell subsets from tissue expression profiles. Nat Methods. 2015;12(5):453–457. doi:10.1038/nmeth.3337
16. Hong X, Zhong L, Xie Y, et al. Matrine reverses the Warburg effect and suppresses colon cancer cell growth via negatively regulating HIF-1alpha. Front Pharmacol. 2019;10:1437. doi:10.3389/fphar.2019.01437
17. Lu J. The Warburg metabolism fuels tumor metastasis. Cancer Metastasis Rev. 2019;38(1–2):157–164. doi:10.1007/s10555-019-09794-5
18. Kierans SJ, Taylor CT. Regulation of glycolysis by the hypoxia-inducible factor (HIF): implications for cellular physiology. J Physiol. 2021;599(1):23–37. doi:10.1113/jp280572
19. Peppicelli S, Bianchini F, Calorini L. Extracellular acidity, a “reappreciated” trait of tumor environment driving malignancy: perspectives in diagnosis and therapy. Cancer Metastasis Rev. 2014;33(2–3):823–832. doi:10.1007/s10555-014-9506-4
20. Huang R, Zong X. Aberrant cancer metabolism in epithelial-mesenchymal transition and cancer metastasis: mechanisms in cancer progression. Crit Rev Oncol Hematol. 2017;115:13–22. doi:10.1016/j.critrevonc.2017.04.005
21. Ivashkiv LB. The hypoxia-lactate axis tempers inflammation. Nat Rev Immunol. 2020;20(2):85–86. doi:10.1038/s41577-019-0259-8
22. Sun AJ, Gao HB, Liu G, Ge HF, Ke ZP, Li S. Identification of MSX1 and DCLK1 as mRNA biomarkers for colorectal cancer detection through DNA methylation information. J Cell Physiol. 2017;232(7):1879–1884. doi:10.1002/jcp.25733
23. Song G, Xu S, Zhang H, et al. TIMP1 is a prognostic marker for the progression and metastasis of colon cancer through FAK-PI3K/AKT and MAPK pathway. J Exp Clin Cancer Res. 2016;35(1):148. doi:10.1186/s13046-016-0427-7
24. Li X, Zhang Q, Zhao L, et al. A combined four-mRNA signature associated with lymphatic metastasis for prognosis of colorectal cancer. J Cancer. 2020;11(8):2139–2149. doi:10.7150/jca.38796
25. Zhang C, Gou X, He W, Yang H, Yin H. A glycolysis-based 4-mRNA signature correlates with the prognosis and cell cycle process in patients with bladder cancer. Cancer Cell Int. 2020;20(1):177. doi:10.1186/s12935-020-01255-2
26. Chen C, Shi Y, Li Y, et al. A glycolysis-based ten-gene signature correlates with the clinical outcome, molecular subtype and IDH1 mutation in glioblastoma. J Genet Genomics. 2017;44(11):519–530. doi:10.1016/j.jgg.2017.05.007
27. Liu Y, Wu J, Huang W, et al. Development and validation of a hypoxia-immune-based microenvironment gene signature for risk stratification in gastric cancer. J Transl Med. 2020;18(1):201. doi:10.1186/s12967-020-02366-0
28. Brooks JM, Menezes AN, Ibrahim M, et al. Development and validation of a combined hypoxia and immune prognostic classifier for head and neck cancer. Clin Cancer Res. 2019;25(17):5315–5328. doi:10.1158/1078-0432.Ccr-18-3314
29. J-aA H, Chang H-C, Neng-Yao S, et al. Diagnostic detection of human lung cancer-associated antigen using a gold nanoparticle-based electrochemical immunosensor. Anal Chem. 2010;82(14):5944–5950. doi:10.1021/ac1001959
30. Park C, Lee Y, Je S, et al. Overexpression and selective anticancer efficacy of ENO3 in STK11 mutant lung cancers. (0219-1032 (Electronic)). Mol Cells. 2019;42(11):804. doi:10.14348/molcells.2019.0099
31. Isgrò MA, Bottoni P, Scatena R. Neuron-specific enolase as a biomarker: biochemical and clinical aspects. (0065-2598 (Print)). Adv Cancer Biomark. 2015;125–143. doi:10.1007/978-94-017-7215-0_9
32. Xie X, Zhao J, Xie L, et al. Identification of differentially expressed proteins in the injured lung from zinc chloride smoke inhalation based on proteomics analysis. Respir Res. 2019;20(1):36. doi:10.1186/s12931-019-0995-0
33. Zhang B, Chamba Y, Shang P, et al. Comparative transcriptomic and proteomic analyses provide insights into the key genes involved in high-altitude adaptation in the Tibetan pig. Sci Rep. 2017;7(1):3654. doi:10.1038/s41598-017-03976-3
34. Yeung BH, Law Ay Fau - Wong CKC, Wong CK. Evolution and roles of stanniocalcin. (1872-8057 (Electronic)). Mol Cell Endocrinol. 2012;349(2):272–280. doi:10.1016/j.mce.2011.11.007
35. Alice YS Law, Keng P Lai, Carman KM Ip, Alice ST Wong, Graham F Wagner, Chris KC Wong. Epigenetic and HIF-1 regulation of stanniocalcin-2 expression in human cancer cells. (0014-4827 (Print)). Exp Cell Res. 2008;314(8):1823–1830. doi:10.1016/j.yexcr.2008.03.001
36. Chen F, Zhang Z, Pu F. Role of stanniocalcin-1 in breast cancer. Oncol Lett. 2019;18(4):3946–3953. doi:10.3892/ol.2019.10777
37. Law AY, Wong CK. Stanniocalcin-2 is a HIF-1 target gene that promotes cell proliferation in hypoxia. (1090-2422 (Electronic)). Exp Cell Res. 2010;316(3):466–476. doi:10.1016/j.yexcr.2009.09.018
38. Calvi A, Wong ASW, Wright G, et al. SUN4 is essential for nuclear remodeling during mammalian spermiogenesis. Dev Biol. 2015;407(2):321–330. doi:10.1016/j.ydbio.2015.09.010
39. Ji Y, Jiang J, Huang L, et al. Sperm‑associated antigen 4 (SPAG4) as a new cancer marker interacts with Nesprin3 to regulate cell migration in lung carcinoma. Oncol Rep. 2018. doi:10.3892/or.2018.6473
40. Kennedy C, Sebire K, de Kretser DM, O’Bryan MK. Human sperm associated antigen 4 (SPAG4) is a potential cancer marker. Cell Tissue Res. 2004;315(2):279–283. doi:10.1007/s00441-003-0821-2
41. Wang Y, Wang Y, Liu F. A 44-gene set constructed for predicting the prognosis of clear cell renal cell carcinoma. Int J Mol Med. 2018;42(6):3105–3114. doi:10.3892/ijmm.2018.3899
42. Zhao J, Liu B, Yang JA, Tang D, Wang X, Chen Q. Human sperm-associated antigen 4 as a potential biomarker of glioblastoma progression and prognosis. (1473-558X (Electronic)). Neuroreport. 2019;30(6):446–451. doi:10.1097/WNR.0000000000001226
43. Okolicsanyi RK, van Wijnen AJ, Cool SM, Stein GS, Griffiths LR, Haupt LM. Heparan sulfate proteoglycans and human breast cancer epithelial cell tumorigenicity. J Cell Biochem. 2014;115(5):967–976. doi:10.1002/jcb.24746
44. Frampton AE, Prado MM, López-Jiménez E, et al. Glypican-1 is enriched in circulating-exosomes in pancreatic cancer and correlates with tumor burden. Oncotarget. 2018;9(27):19006–19013. doi:10.18632/oncotarget.24873
45. Lucien F, Lac V, Billadeau DD, Borgida A, Gallinger S, Leong HS. Glypican-1 and glycoprotein 2 bearing extracellular vesicles do not discern pancreatic cancer from benign pancreatic diseases. Oncotarget. 2019;10(10):1045–1055. doi:10.18632/oncotarget.26620
46. Saito T, Sugiyama K, Hama S, et al. High expression of glypican-1 predicts dissemination and poor prognosis in glioblastomas. World Neurosurg. 2017;105:282–288. doi:10.1016/j.wneu.2017.05.165
47. Zhang Z, Coomans C, David G. Membrane heparan sulfate proteoglycan-supported FGF2-FGFR1 signaling: evidence in support of the “cooperative end structures” model. J Biol Chem. 2001;276(45):41921–41929. doi:10.1074/jbc.M106608200
48. Li C, Du X, Tai S, et al. GPC1 regulated by miR-96-5p, rather than miR-182-5p, in inhibition of pancreatic carcinoma cell proliferation. Int J Mol Sci. 2014;15(4):6314–6327. doi:10.3390/ijms15046314
49. Chamorro-Jorganes A, Araldi E, Rotllan N, Cirera-Salinas D, Suárez Y. Autoregulation of glypican-1 by intronic microRNA-149 fine tunes the angiogenic response to FGF2 in human endothelial cells. J Cell Sci. 2014;127(Pt 6)):1169–1178. doi:10.1242/jcs.130518
50. Li J, Li B, Ren C, et al. The clinical significance of circulating GPC1 positive exosomes and its regulative miRNAs in colon cancer patients. Oncotarget. 2017;8(60):101189–101202. doi:10.18632/oncotarget.20516
51. Gilkes DM, Bajpai S, Chaturvedi P, Wirtz D, Semenza GL. Hypoxia-inducible factor 1 (HIF-1) promotes extracellular matrix remodeling under hypoxic conditions by inducing P4HA1, P4HA2, and PLOD2 expression in fibroblasts. J Biol Chem. 2013;288(15):10819–10829. doi:10.1074/jbc.M112.442939
52. Duan Y, Dong Y, Dang R, et al. MiR-122 inhibits epithelial mesenchymal transition by regulating P4HA1 in ovarian cancer cells. Cell Biol Int. 2018;42(11):1564–1574. doi:10.1002/cbin.11052
53. Li M, Wu F, Zheng Q, Wu Y, Wu Y. Identification of potential diagnostic and prognostic values of P4HA1 expression in lung cancer, breast cancer, and head and neck cancer. DNA Cell Biol. 2020;39(5):909–917. doi:10.1089/dna.2019.5170
 © 2022 The Author(s). This work is published and licensed by Dove Medical Press Limited. The full terms of this license are available at https://www.dovepress.com/terms.php and incorporate the Creative Commons Attribution - Non Commercial (unported, v3.0) License.
By accessing the work you hereby accept the Terms. Non-commercial uses of the work are permitted without any further permission from Dove Medical Press Limited, provided the work is properly attributed. For permission for commercial use of this work, please see paragraphs 4.2 and 5 of our Terms.
© 2022 The Author(s). This work is published and licensed by Dove Medical Press Limited. The full terms of this license are available at https://www.dovepress.com/terms.php and incorporate the Creative Commons Attribution - Non Commercial (unported, v3.0) License.
By accessing the work you hereby accept the Terms. Non-commercial uses of the work are permitted without any further permission from Dove Medical Press Limited, provided the work is properly attributed. For permission for commercial use of this work, please see paragraphs 4.2 and 5 of our Terms.