")
Back to Journals » International Journal of General Medicine » Volume 15
A Novel Glutamine Metabolism-Related Gene Signature in Prognostic Prediction of Osteosarcoma
Authors Wan L, Zhang W, Liu Z, Yang Z, Tu C, Li Z
Received 14 December 2021
Accepted for publication 21 January 2022
Published 1 February 2022 Volume 2022:15 Pages 997—1011
DOI https://doi.org/10.2147/IJGM.S352859
Checked for plagiarism Yes
Review by Single anonymous peer review
Peer reviewer comments 3
Editor who approved publication: Dr Scott Fraser
Lu Wan,1,2 Wenchao Zhang,1,2 Zhongyue Liu,1,2 Zhimin Yang,1,2 Chao Tu,1,2 Zhihong Li1,2
1Key Laboratory of Tumor Models and Individualized Medicine, The Second Xiangya Hospital of Central South University, Changsha, Hunan, People’s Republic of China; 2Department of Orthopedics, The Second Xiangya Hospital of Central South University, Changsha, Hunan, People’s Republic of China
Correspondence: Chao Tu; Zhihong Li, Tel +86 15974290117
; +86 13975112458
, Email [email protected]; [email protected]
Purpose: Metabolic reprogramming, as one of the hallmarks of cancer, shows promising translational potential for cancer diagnosis, treatment and prognostic prediction. This study aims to construct and validate a prognostic prediction model for osteosarcoma based on glutamine metabolism-related genes.
Materials and Methods: A group of glutamine metabolism-related genes was identified from a public database and intersected with a list of osteosarcoma survival-related genes, and a risk score model based on sixteen glutamine metabolism-related genes was developed by using LASSO penalized Cox regression analysis.
Results: The prognosis of patients in the high-risk group was significantly worse than that of patients in the low-risk group in the training dataset (high- vs low-risk, 5-year overall survival: 11% vs 88%, p < 0.0001) and in two other external validation cohorts (high- vs low-risk, 5-year overall survival: 39% vs 81%, p = 0.015; 50% vs 94%, p = 0.011).In addition, a novel nomogram was constructed by integrating the risk score and clinical characteristics, including age, sex, metastasis status and chemotherapy response. This nomogram had superior predictive power compared with a nomogram composed of only conventional factors. Gene set enrichment analysis indicated that several well-known malignancy-associated gene sets, including MYC targets V1, DNA repair, and unfolded protein response, were enriched in the high-risk subgroup.
Conclusion: A novel glutamine metabolism-related prognostic prediction model and nomogram for osteosarcoma was developed and validated in the present study, which could predict the survival of patients with osteosarcoma and may facilitate individualized clinical decision-making for patients.
Keywords: bone tumor, survivorship, amino acid metabolism, nomogram
Introduction
Osteosarcoma is a rare but highly malignant tumour arising most commonly in children and young adolescents.1 Advances in clinical treatments for this disease have almost completely halted in the four decades (since the 1980s),2 thus making a precise prognostic prediction model valuable for clinical counselling and guiding patient management to potentially improve the survival of patients with osteosarcoma. Due to the complexity and heterogeneity of the mechanisms of tumorigenesis and tumour development in osteosarcoma, traditional prognostic predictive factors, such as age, sex, response to chemotherapy, and Enneking stage, are not highly efficient in predicting the survival of patients with osteosarcoma. Thus, investigating a novel effective tool for robustly predicting the prognosis of patients with osteosarcoma is of high importance.
Metabolic reprogramming, as one of the crucial hallmarks of cancer, plays a critical role in cancer survival and growth.3 In the 1920s, Warburg et al revealed that tumour tissues consumed much more glucose than surrounding normal tissues4 and that tumour cells were characterized by excessive activation of anaerobic glycolysis as well as impaired aerobic respiration,5 which were also found in osteosarcoma.6,7 In addition to glucose, recent research has suggested that glutamine is also an essential fuel for cancer, and relevant studies have promising translational value in the war against cancer.8,9
In recent years, bioinformatic analysis combined with artificial intelligence has emerged as a powerful combination in helping clinicians make precise diagnoses and prognostic predictions for patients with cancer.10–12 Interestingly, we found that several prognostic prediction models constructed with metabolism-related genes have achieved excellent predictive effects in glioma and gastric cancer.13,14 To date, however, no research has used glutamine metabolism-related genes to assist in predicting the prognosis of patients with cancer. Given the essential role of glutamine in cancer cell survival, we hypothesized that a model constructed with glutamine metabolism-related genes would be a valuable tool for predicting the prognosis of cancer patients. Therefore, in the current study, we aimed to identify a group of glutamine metabolism-related genes to construct a novel and practical predictive model for facilitating the clinical management of patients with osteosarcoma.
Materials and Methods
Data Collection
The workflow chart of the current study was plotted in Figure 1.
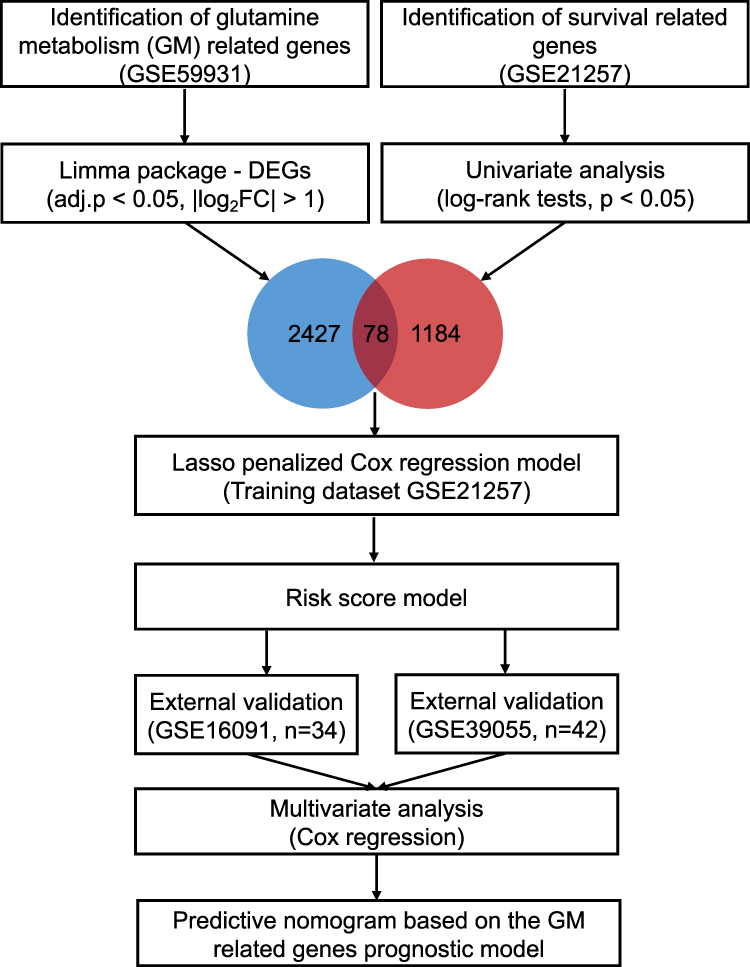 |
Figure 1 The workflow chart of the current study. DEG, differentially expressed gene; Lasso, least absolute shrinkage and selection operator. |
To identify glutamine metabolism-related genes in osteosarcoma, we downloaded the GSE59931 datasets, which profile the gene expression changes in the U2OS cell line (a human osteosarcoma cell line) under glutamine deprivation, from the Gene Expression Omnibus (GEO) database (https://www.ncbi.nlm.nih.gov/geo/).
To construct the prognosis prediction model, we searched for the gene expression profiling of clinical osteosarcoma samples from the GEO database. The inclusion criteria including 1) Datasets containing human sample of osteosarcoma; 2) Datasets including clear follow-up information. The exclusion criteria including 1) Datasets derived not from gene expression profiling. A total of three datasets (GSE21257, GSE39055, and GSE16091) were finally included in current study. The demographic data of the included GEO datasets was presented in Table 1.
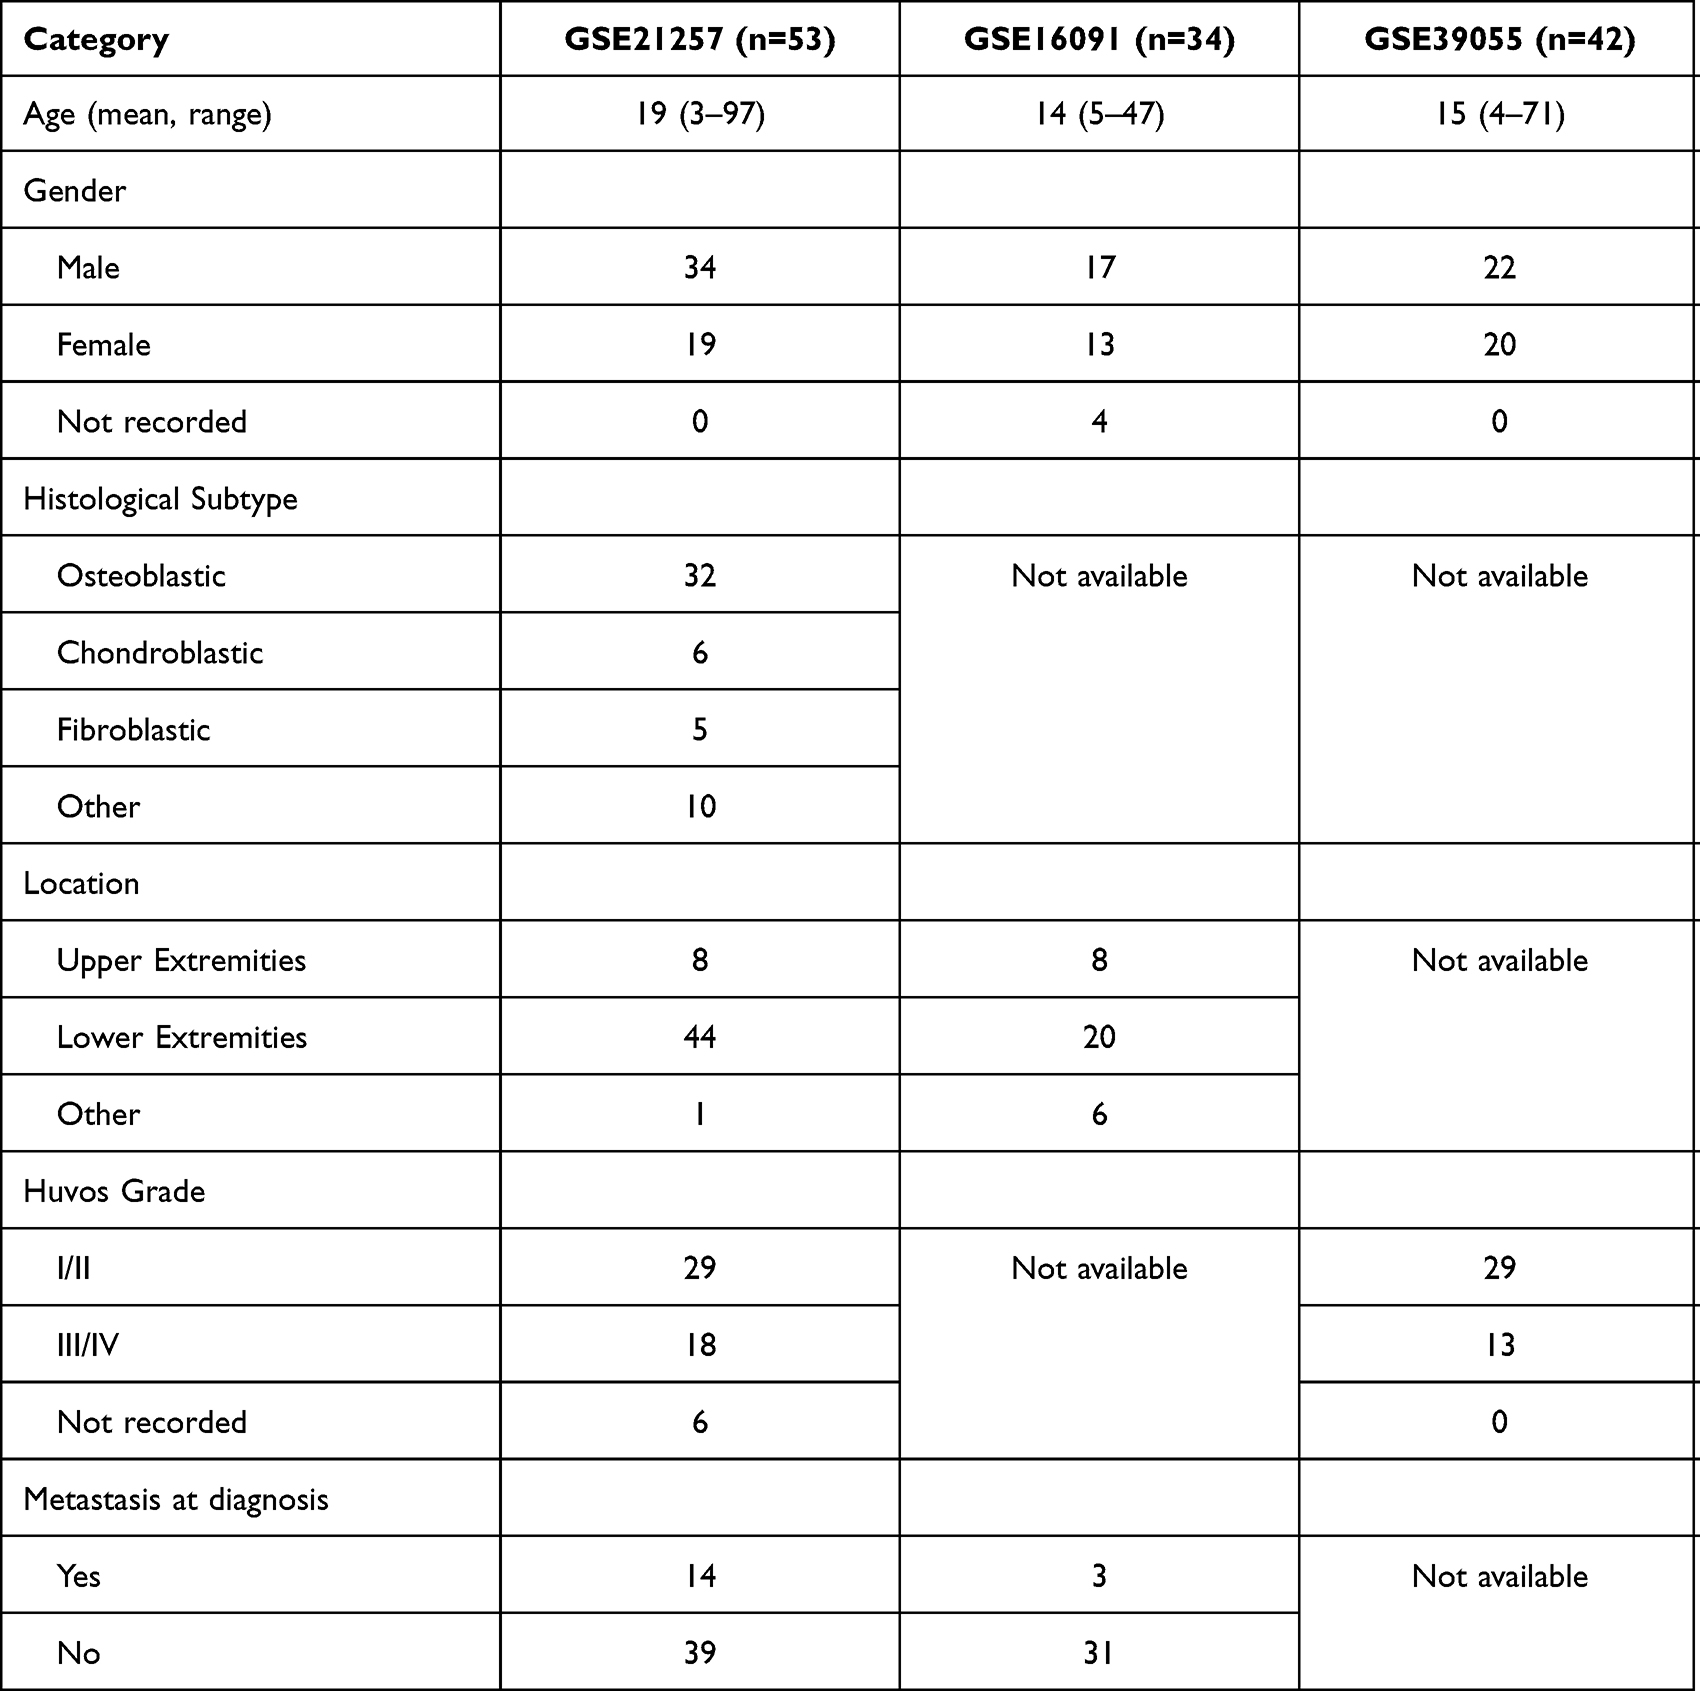 |
Table 1 Demographic Features of the Included GEO Datasets |
Data Cleaning
All of the above four datasets contained microarray data. The expression values of each gene were log2 transformed (if not in raw data files). The probe identifications were then converted to gene symbols according to the annotation file of each corresponding platform, and the average value was used as the final expression value if multiple probes corresponded to the same gene symbol.
Identification of Glutamine Metabolism-Related Genes in Osteosarcoma
By using the Limma Package in R software, glutamine metabolism-related genes in osteosarcoma were identified as the differentially expressed genes (DEGs) between U2OS cells growing in glutamine-containing or glutamine-depleted medium. The threshold criteria for DEGs were set as |fold change| > 2 and adjusted p-value < 0.05.
Construction and Validation of the Glutamine Metabolism-Related Gene Signature
To obtain the best fit for prognostic prediction, we chose the GSE21257 dataset as the training cohort because it had the largest sample size (n=53). First, all of the genes were divided into the high and low expression groups based on the median expression values, survival-related genes were then extracted by using the univariate analysis (Log rank test, p < 0.05, “survival” package in R), and they were further intersected with glutamine metabolism-related genes. The intersecting genes were then considered the candidate covariates in the final prognostic model. The least absolute shrinkage and selection operator (LASSO) algorithm, which can provide good predictive accuracy by removing and shrinking coefficients and eliminating irrelevant variables, was used to select the most important genes for predicting the overall survival of patients with osteosarcoma (“glmnet” package in R).
Ten-fold cross-validation was applied to select the shrinkage penalty parameter lambda (λ). Two λ values (λ-min and λ-1se) are highlighted by the vertical lines on the plot of λ versus the partial likelihood deviance. The genes selected by LASSO regression were then used to develop a formula comprising the gene expression value (expv) multiplied by the corresponding coefficient:

Patients in the training dataset were then divided into high- and low-risk groups by the median value of the risk score. The optimal λ value was chosen by comparing the 5-year OS status through the Wilcoxon test. The genes under the optimal λ value were then used to establish the glutamine metabolism-related signature.
Next, we applied this glutamine metabolism-related risk score model to the training cohort and two external validation cohorts to assess its credibility by using time-dependent receiver operating characteristic (ROC) curve (“ROCR” package) analysis. Finally, multivariate Cox regression analysis was performed to determine whether the risk score is an independent prognostic factor for osteosarcoma. The proportional hazards (PH) assumption of the Cox regression model was also tested.
Prognostic Prediction Nomogram for Osteosarcoma
To reinforce the predictive ability of the model, a nomogram was constructed by integrating the clinical characteristics and the risk score derived from the novel glutamine metabolism-related gene signature to predict the three- and five-year OS probabilities of patients with osteosarcoma. Next, calibration curves and the C-index values obtained by bootstrap analysis with one thousand replicates were applied to assess the discriminative ability of the nomogram. The interactive nomogram was then plotted using the R package “regplot”.
GSEA and Immune Cell Infiltration Analysis
To obtain better insight into the molecular features of the high- and low-risk groups, we used the hallmark gene set (h.all.v7.3.entrez.gmt) as the gene set database and performed Gene set enrichment analysis (GSEA) to investigate the enrichment of the featured gene set in the high- and low-risk subgroups (“clusterProfiler” package in R). In addition, the immune cell infiltration patterns and immune status of the high- and low-risk groups were assessed by using the CIBERSORT, TIMER and xCELL algorithms.
Statistical Analysis
All statistical analyses were performed in R (version 4.0.4, http://www.r-project.org). The correlation between the risk signature and immune cell infiltration was assessed by Spearman correlation analysis. Statistical significance was defined as a p value < 0.05 by a 2-sided test. All graphs were generated using the “ggplot2” package in R.
Results
Construction of the Glutamine Metabolism-Related Gene Signature
A total of 2427 DEGs related to glutamine metabolism were identified in the GSE59931 dataset, and 1184 genes were associated with survival in the GSE21257 dataset. After intersecting these two gene groups, 78 genes were selected for further LASSO penalized Cox regression analysis.
First, by using the ten-fold cross-validation method, two optional λ values (λ-min: 0.0876, λ-1se: 0.2802) were calculated from the vertical lines while minimizing the partial likelihood deviance (Figure 2A and B). Risk score models were then constructed according to the gene lists selected by LASSO regression with the two optional λ values, and the survival status was further predicted based on the risk score groups. As shown in Figure 2C, the sixteen-gene risk score model based on the λ-min value (Wilcoxon test, p = 5e−09) could effectively distinguish the survival status of patients within the five-year follow-up period. However, with the model constructed with the λ-1se value (Figure 2D), no statistically significant difference was observed (Wilcoxon test, p > 0.05), suggesting that the sixteen-gene risk score model constructed with λ-min was suitable for further external validation.
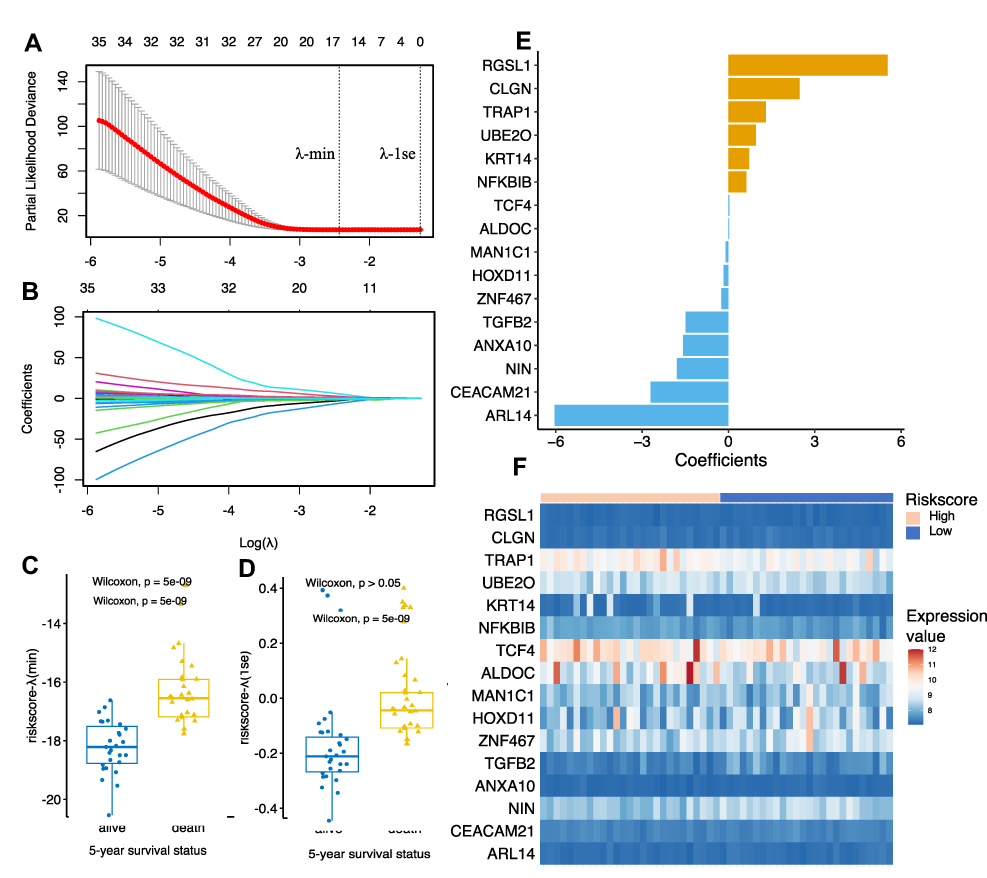 |
Figure 2 Establishment of the glutamine metabolism-related gene prognostic model by Lasso regression analysis. (A and B) Lasso coefficient profiles of the 78 candidate genes. Two optimal lambda (λ) values (λ-min and λ-1se) were estimated according to the vertical lines with a minimizing partial likelihood deviance. The vertical axis represents the partial likelihood deviance, while the horizontal axis represents the value of log(λ). (C and D) The scatter plot of the 5-year survival status of patients with osteosarcoma based on the selected model based on λ-min (left, p = 5e-09, Wilcoxon test) and λ-1se (right, p > 0.05, Wilcoxon test). (E) Coefficients of the final selected sixteen genes. (F) Expression profiles of the sixteen genes in GSE21257 dataset. |
The coefficient and expression pattern of each gene included in the sixteen-gene risk score model are plotted in Figure 2E and F. The relationships between the expression levels of these 16 genes and the survival status are shown in Figure 3. The final formula to calculate the risk score were as follows:
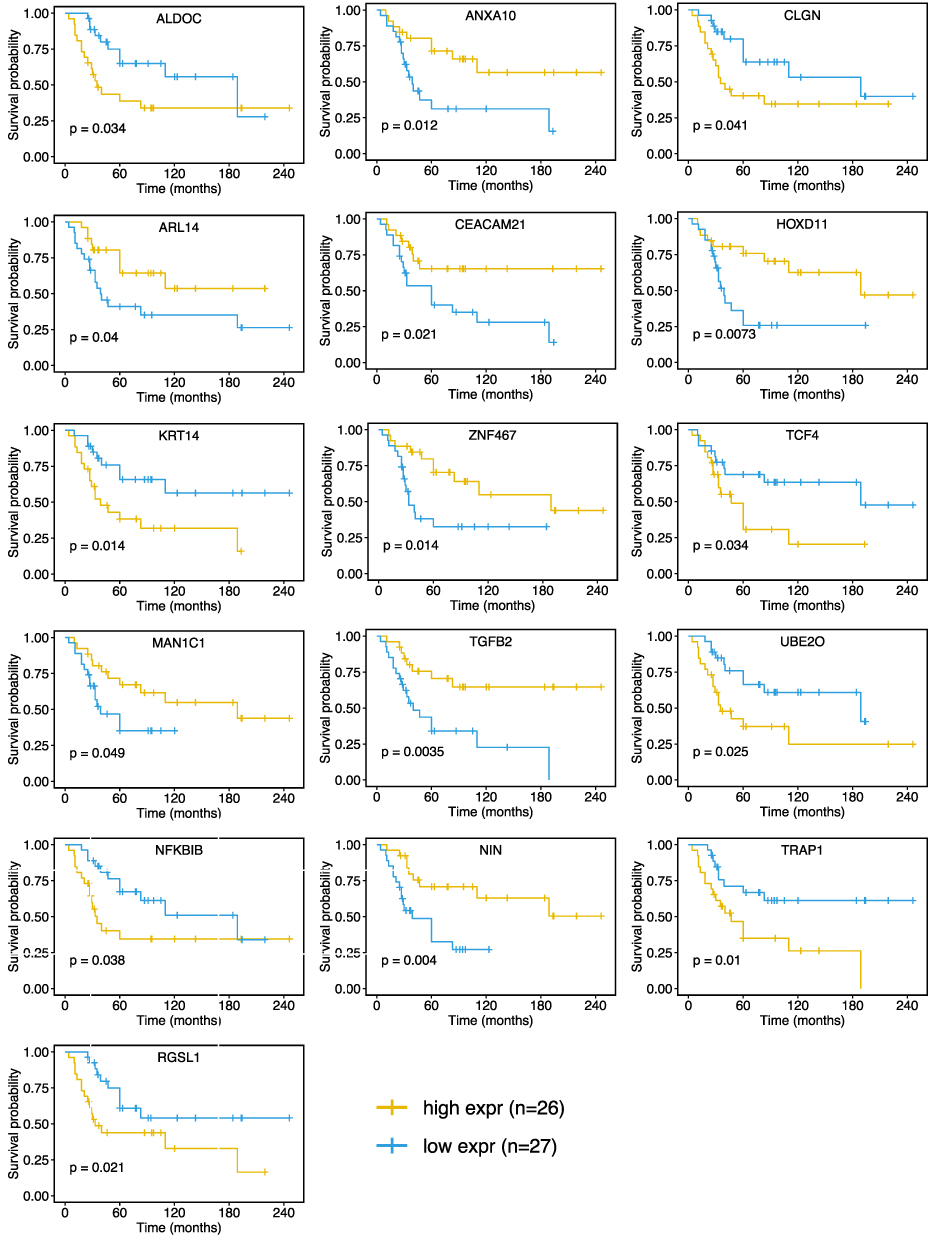 |
Figure 3 Kaplan-Meier curves showing that patients with different expression level (divided by the median expression value) of the sixteen-glutamine metabolism-related gene had significant different overall survival. Abbreviation: expr, expression level. |
Risk score = ARL14*(−6.04) + CEACAM21*(−2.71) + NIN*(−1.79) + ANXA10*(−1.57) + TGFB2(−1.48) + ZNF467*(−0.25) + HOXD11*(−0.17) + MAN1C1*(−0.09) + ALDOC*(0.02) + TCF4*(0.03) + NFKBIB*(0.62) + KRT14*(0.72) + UBE20*(0.96) + TRAP1*(1.30) + CLGN*(2.47) + RGSL1*(5.53)
External Validation of the Glutamine Metabolism-Related Gene Risk Score Model
Based on the risk score formula, a risk score was calculated for each patient. The median value of the risk score was then set as the cut-off value to stratify the patients in the datasets into the high- and low-risk groups. In the subsequent Kaplan-Meier survival analysis, the prognosis of patients in the high-risk group was significantly worse than that of patients in the low-risk group (GSE21257, 5-year OS: 11% vs 88%, p < 0.0001, Figure 4A). Similarly, we divided the patients in the other two external validation cohorts (GSE16091 and GSE39055) into high- and low-risk groups based on the corresponding median risk scores and found that patients in the high-risk group also exhibited significantly worse survival than those in the low-risk group (5-year OS: 39% vs 81%, p = 0.015, Figure 4B; 5-year OS: 50% vs 94%, p = 0.011, Figure 4C).
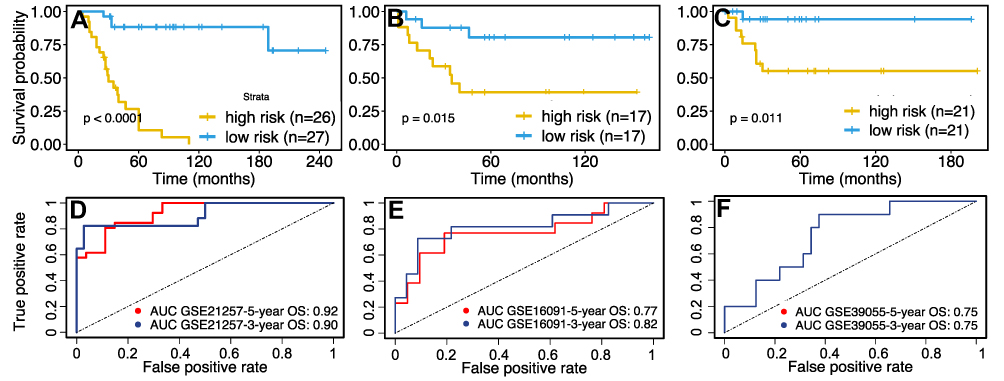 |
Figure 4 Validation of the sixteen-glutamine metabolism-related gene-based risk score model. Patients were divided into high- or low-risk groups according to the median risk score. K–M survival curves showing the difference in OS between high- and low-risk patients in the (A) GSE21257 dataset (Log rank test, p < 0.0001), (B) GSE16091 dataset (Log rank test, p = 0.015), and (C) GSE39055 dataset (Log rank test, p = 0.011). Time-dependent ROC curve analysis for the prediction of survival in (D) GSE21257, (E) GSE16091 and (F) GSE39055 datasets using the sixteen-gene prognosis model. The AUCs of 3-, and 5-year OS are shown in the figure. Abbreviations: OS, overall survive; ROC, receiver operating characteristic; AUC, area under the curve. |
To further validate the prognostic value of the risk score, multivariate Cox regression analysis was conducted, and the results suggested that the risk score group remained an independent prognostic factor in the training cohort (GSE21257, HR = 13.0, 95% CI: 3.5–48.7, p < 0.001; Table 2) and the external validation cohorts (GSE16091, hazard ratio (HR) = 5.6, 95% CI: 1.1–27.1, p = 0.034; GSE39055, HR = 12.6, 95% CI: 1.1–139.8, p = 0.039; Table 2) after adjusting for age, sex, Huvos grade, and metastasis status at diagnosis. All of the above Cox regression models met the proportional hazards assumption (Supplementary Table 1).
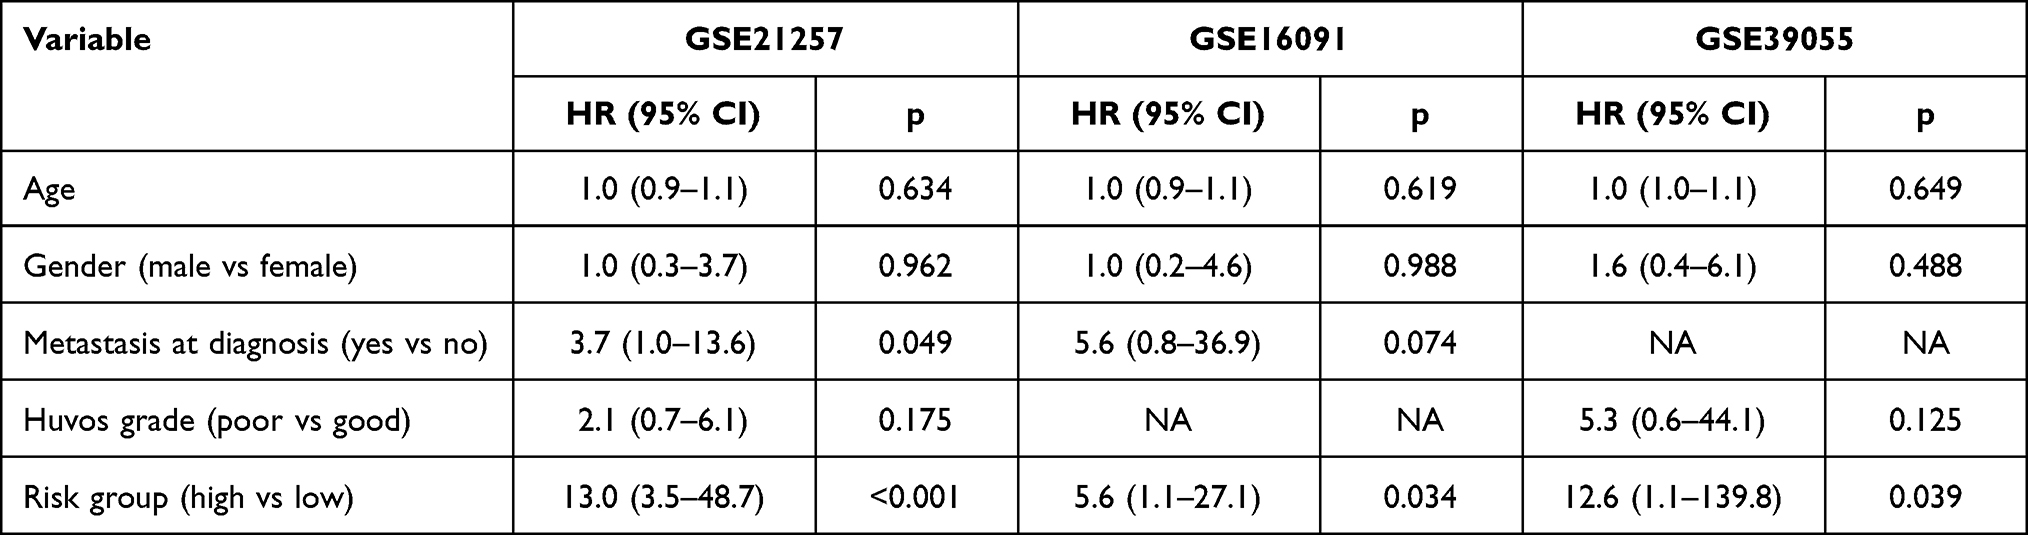 |
Table 2 Multivariate Cox Regression Analyses of the Overall Survival in the Training and External Validation Cohort |
Subsequently, the predictive efficiency of the risk score model for three- and five-year OS was estimated by ROC curve analysis. As shown in Figure 4D, the area under the ROC curve (AUC) in the training cohort was greater than 0.9. Moreover, the AUC in both of the two external validation cohorts was greater than 0.75 (Figure 4E and F), indicating that the sixteen-gene-based risk model had high sensitivity and specificity and thus could serve as a useful tool for predicting the prognosis of patients with osteosarcoma.
Construction and Evaluation of a Novel Predictive Nomogram
To reinforce the predictive power of the prediction model, a nomogram was constructed to predict the three- and five-year OS probabilities by integrating all of the available clinical characteristics in the training cohort (Figure 5A). The calibration plot shown in Figure 5B and C indicates the good performance of the nomogram in predicting the OS status. Furthermore, we applied the nomogram to a randomly selected patient (GSM531287) in the GSE21257 dataset (Figure 5D and E). In the latest follow-up of patient GSM531287, he was still alive 45 months after initial diagnosis. According to the nomogram including the risk group as a predictive factor, the probability of patient GSM531287 dying within 36 months of diagnosis was 11.1%, markedly lower than the probability of death predicted by the nomogram without the risk group (38.4%). These findings indicated that using the risk group as a covariate significantly enhanced the credibility of the predictive model.
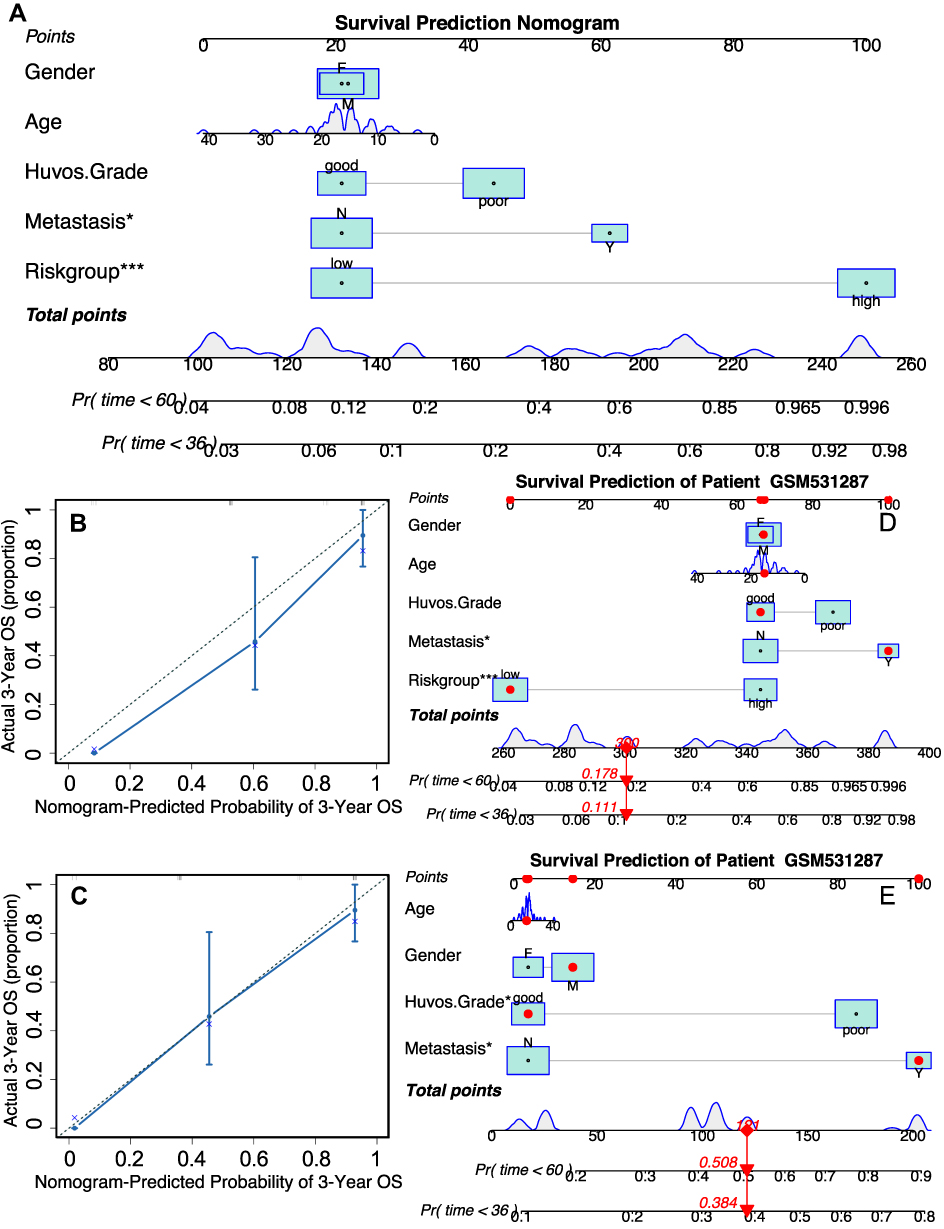 |
Figure 5 Construction and validation of the prognosis prediction nomogram. (A) The nomogram that integrated the risk score and age, gender, metastasis at diagnosis and Huvos grade (poor indicates tumor necrosis > 90% after chemotherapy). (B and C) The calibration curves for three and five-year overall survival. (D and E) The predicted survival chance in three and five years of patient GSM531287 in GSE21257 dataset by the nomogram integrating risk score or not. *p<0.05, ***p<0.001. |
GSEA and Immune Infiltration Analysis
To investigate the potential heterogeneity of biological processes and pathways between the low-risk and high-risk subgroups, we applied GSEA to the external training cohort GSE16091 and set adjusted p < 0.05, FDR q < 0.25, and |NES|≥1 as the threshold criteria for significantly enriched gene sets (Figure 6A). The results revealed that several well-known signaling pathways and processes that promote tumorigenesis, such as the Myc pathway, DNA repair, and unfolded protein response, were enriched and activated in the high-risk group (Figure 6B–D). In contrast, several biological processes and functions that can suppress tumour growth, including apoptosis and the interferon-γ response, were inhibited in the high-risk group (Figure 6E–G). Similar results were found in GSEA of the GSE21257 and GSE39055 datasets (Supplementary Figure 1A and B), in which the Myc pathway-, oxidative phosphorylation-, and DNA repair (G2M checkpoint)-related genes were enriched in the high-risk group. These findings might reflect the biological reasons for the different prognosis in the high- and low-risk groups.
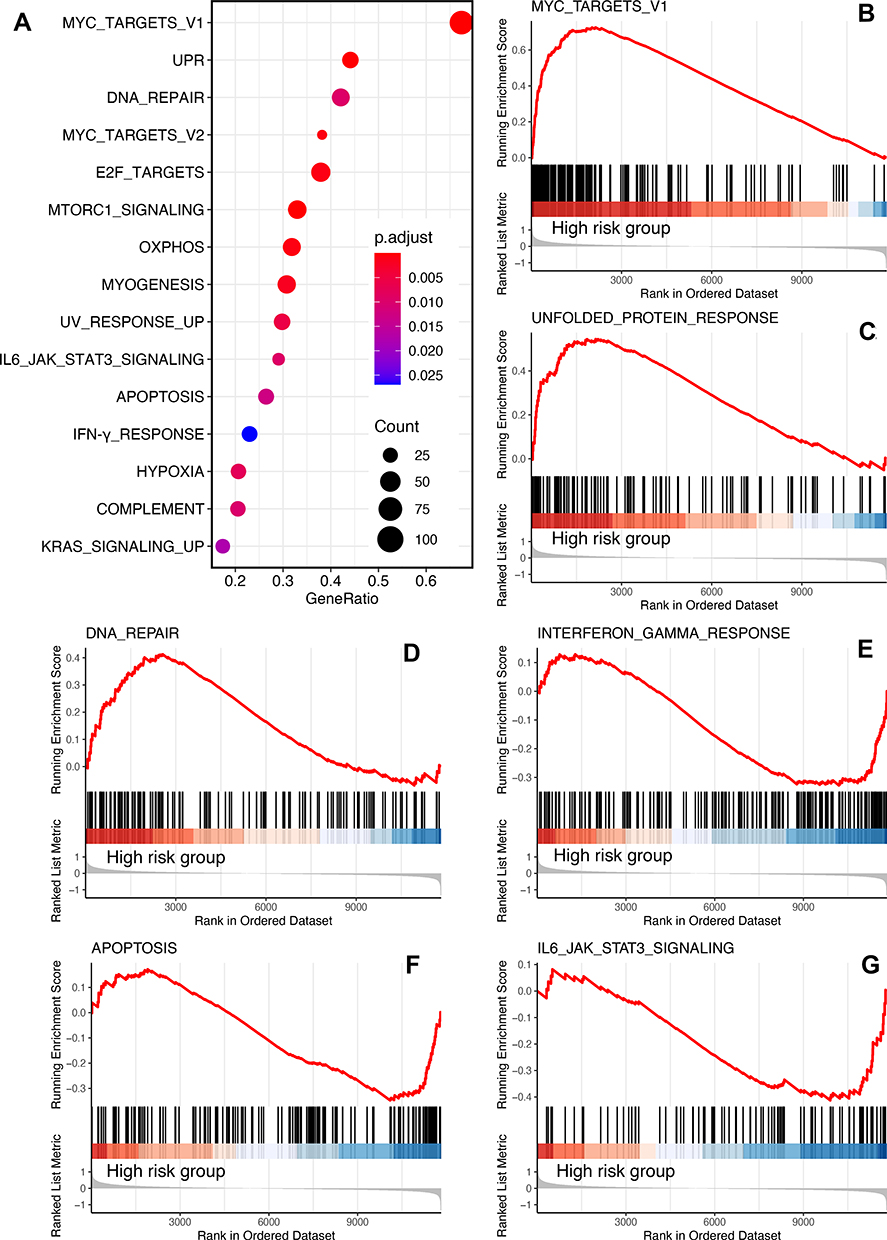 |
Figure 6 GSEA of the GSE16091 dataset. (A) Bubble plot of the enriched terms (adjust p < 0.05, FDR q < 0.25, |NES|≥1, category = 10). Ridge plot of the top three enriched terms in high-risk group (B–D) and low-risk group (E–G). |
Finally, to understand how the risk score reflects the immune environment of osteosarcoma, we uploaded the gene expression matrices of the GSE21257 and GSE16091 datasets to the CIBERSORT and xCELL databases, which returned the proportions of 22 subtypes of immune cells and the immune scores of the tumour samples, respectively. Interestingly, there was no significant difference in either the immune cell composition or immune score between the high- and low-risk groups, except for M1 macrophages, which were more abundant in the high-risk group in the GSE21257 dataset (Figure 7A) but not in the GSE16091 dataset (Figure 7B). Similar results were also found in the correlation analysis of the risk score and immune cell infiltration. No type of immune cell was correlated with the risk score in the GSE16091 dataset, while only B cells (r = −0.328, 0.016) and macrophages (r = −0.408, 0.003) were inversely correlated with the risk score in the GSE21257 dataset (Supplementary Figure 2). These results suggested that the immune status was almost the same within the tumor microenvironment in patients in the high- and low-risk groups.
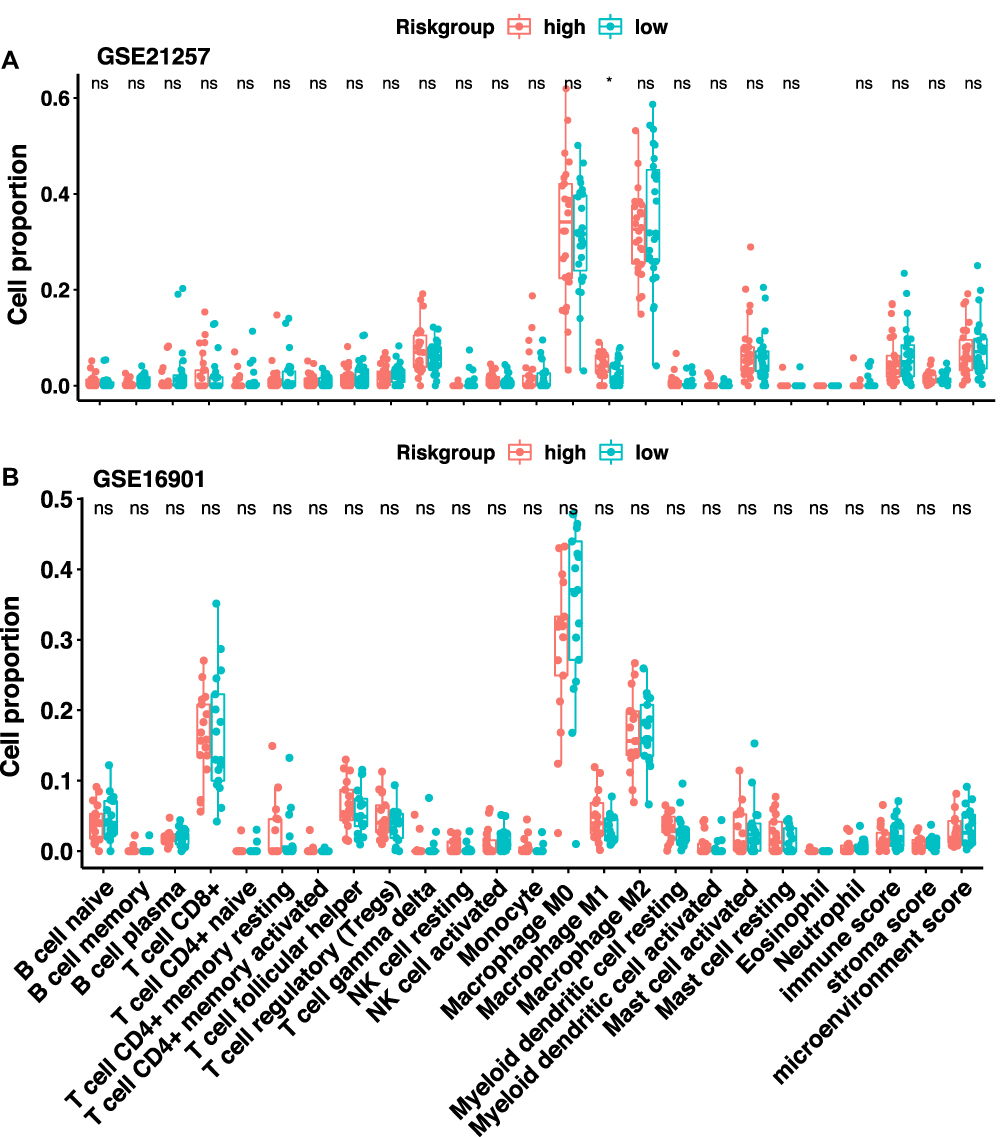 |
Figure 7 Immune infiltration analysis. The immune score and immune cells proportion in the tumor microenvironment of patients in the (A) GSE21257 dataset and (B) GSE16091 dataset. |
Discussion
No significant improvement in the treatment of osteosarcoma has been achieved in the past five decades.15 However, recently, within the popularity of bioinformatics tools, prognostic models based on radiomic data or gene signatures combined with clinical features have emerged as powerful tools for precisely grouping patients with different prognoses and biological phenotypes;10–12 these tools could be used to optimize the clinical management of patients and may therefore improve their outcomes.
Glutamine metabolism is essential for tumour growth,8,9 and several prognostic models based on metabolism-related genes have shown excellent predictive effects in glioma and gastric cancer,13,14 Therefore, we hypothesized that a glutamine metabolism-related gene signature could be used to predict the prognosis of patients with osteosarcoma.
Although no specific gene sets were marked as glutamine metabolism-related genes, we found that the GSE59931 dataset was appropriate for identifying glutamine metabolism-related genes in osteosarcoma, as it was designed for comparing gene expression changes after glutamine deprivation in U2OS cells,16 a commonly used human osteosarcoma cell line. Based on the identified glutamine metabolism-related genes in osteosarcoma, a sixteen-gene signature was discovered by LASSO regression analysis. Unlike studies of previously reported prognostic models for osteosarcoma, such as models using autophagy-related genes,17 super enhancer-related genes,18 and immune-related genes,19,20 our study was the first to use two external validation datasets rather than only one validation cohort to evaluate the model’s predictive accuracy, which is expected to substantially improve the model’s reproducibility and generalizability to new and different patients. Most importantly, the risk score calculated from the sixteen-gene signature had excellent performance in predicting the three- and five-year OS probabilities for all of the available osteosarcoma datasets in the GEO database. Multivariate Cox regression analysis also showed that the risk score was an independent risk factor for OS. Moreover, the nomogram integrating the clinical features and risk group had higher predictive accuracy than the nomogram lacking the risk group. These results suggested that the prognostic model based on the sixteen-glutamine metabolism-related genes had robust credibility.
Among the sixteen-glutamine metabolism-related genes, several have been found to be associated with glucose or glutamine metabolism in other cancer types. UBE2O deletion in breast and prostate cancer models can switch off metabolic reprogramming in tumour cells by activating AMPKα2a,21 In lung cancer cells, inhibition of TRAP1 increases glutamine synthetase activity,22 consistent with the downregulation of TRAP1 expression when U2OS cells were deprived of glutamine. A recent study also demonstrated that TRAP1 disruption in a panel of cell lines dysregulates OXPHOS by inducing the anaplerotic utilization of glutamine metabolism to replenish TCA cycle intermediates,23 Considering that these genes were associated with the survival rate of osteosarcoma patients, it would be interesting to further research how these genes affect the progression of osteosarcoma.
After establishing the prognostic prediction model, the biological heterogeneity of the high- and low-risk groups was analyzed by GSEA. Not surprisingly, several important tumorigenesis pathways and processes, including Myc gene targets, DNA repair, and the unfolded protein response, were enriched in the high-risk group, while apoptosis and interferon-γ response were suppressed. This finding was in line with previous reports that glutamine metabolism had a close relationship with the above-mentioned pathways or biological processes. Oncogenic Myc can upregulate glutamine synthetase through DNA demethylation24 and protect endocrine-resistant breast cancer cells from the effects of glucose deprivation by regulating the unfolded protein response and glutamine uptake.25 Moreover, a recent study revealed that increased glutamine anabolism promoted radioresistance by facilitating nucleotide metabolism and subsequent DNA damage repair.24 This result was also consistent with previously published researches in osteosarcoma. Chen et al found that MYC was significantly upregulated in metastatic osteosarcoma samples and that high MYC expression indicated shorter survival times in osteosarcoma patients; targeting MYC-regulated genes, including CDK6 and TGFB2, which were included in the sixteen-gene signature, could effectively suppress the malignant behaviour of osteosarcoma cells.26 A recent finding also suggested that the c-Myc/TXNIP axis can induce the Warburg effect and then fuel osteosarcoma growth.27 DNA repair occurs continuously within regions of DNA damage induced by endogenous and exogenous sources and is important for removing genetic aberrations and suppressing oncogenesis.28 However, once a tumour has developed, enhanced DNA repair activity reduces the cytotoxicity of several commonly used chemotherapeutic agents, including cisplatin and doxorubicin,29–31 both of which are classical agents used in osteosarcoma,32 and thus might facilitate the growth of osteosarcoma. The unfolded protein response (UPR) is also a pro-survival mechanism in cancer induced by disruption of protein homoeostasis that causes endoplasmic reticulum (ER) stress.33,34 Activation of the UPR pathway was confirmed in four pairs of clinical osteosarcoma samples by proteomic analysis.35 In addition, the UPR can protect tumour cells against cisplatin-induced apoptosis.36 These studies suggested that the risk group identified by the sixteen-gene signature could well reflect the heterogeneity in the molecular biological features of patients. Therefore, differentiating and treating patients according to the grouping of this model may improve the prognosis of patients with osteosarcoma.
Another interesting finding was that the immune status was almost the same in the high- and low-risk groups, suggesting that the risk score was not correlated with the immune status. This seems contrary to recent findings that glutamine metabolism inhibition in tumor cells and myeloid-derived suppressor cells (MDSCs) enhance antitumor immune response in preclinical breast cancer models.37,38 However, in the context of osteosarcoma, limited clinical effects have been seen in osteosarcoma patients treated with immune checkpoint inhibitors (ICIs).39–41 The immune-genomic landscape of osteosarcoma also indicates that the median immune infiltrate level is lower in osteosarcoma than in other tumour types where ICI therapy is effective,42 suggesting that there is an insufficient amount of immune infiltrate to elicit a meaningful response in osteosarcoma cells; thus, it not surprising that the immune status did not differ between the high- and low-risk groups, although the risk scores is based on glutamine metabolism related genes. However, we must note that the assessment of immune infiltration was conducted with in silico algorithms and biopsy samples, which might not be enough to obtain a reliable evaluation of the immune microenvironment in osteosarcoma.
The limitation of this study is that the sample size of the included dataset is relatively small, therefore, if conditions permit, it is best to validate the prognostic prediction model established in this study with a large sample of data, and perform wet experiment to gain a deep understanding of the molecular mechanism behind the gene signature.
Conclusion
This was the first study that used a LASSO model to identify prognostic factors from the profile of glutamine metabolism-related genes. We used all of the available osteosarcoma datasets containing follow-up information in the GEO database to construct and validate our model. Therefore, the sixteen-gene-based signature as well as the nomogram constructed from it may be used as novel clinical tools for grouping patients and designing specific treatment strategies, thus improving the outcomes of patients via personalized therapy.
Data Sharing Statement
The datasets used and/or analyzed during the current study are available in the GEO repository, (GSE59931, www.ncbi.nlm.nih.gov/geo/query/acc.cgi?acc=GSE59931; GSE21257, www.ncbi.nlm.nih.gov/geo/query/acc.cgi?acc=GSE21257; GSE16091, www.ncbi.nlm.nih.gov/geo/query/acc.cgi?acc=GSE16091; GSE39055, www.ncbi.nlm.nih.gov/geo/query/acc.cgi?acc=GSE39055).
Ethics Approval
All data utilized in our study were obtained through the GEO database, which is freely accessible for research purposes. According to the ethics guidelines, informed consent and ethical approval are not required for using the public and anonymized clinical data. Therefore, the medical committee of the Second Xiangya Hospital of Central South University exempted the ethical approval.
Acknowledgments
We thank for the contributors to the GEO database for use of their data.
Author Contributions
All authors made a significant contribution to the work reported, whether that is in the conception, study design, execution, acquisition of data, analysis and interpretation, or in all these areas; took part in drafting, revising or critically reviewing the article; gave final approval of the version to be published; have agreed on the journal to which the article has been submitted; and agree to be accountable for all aspects of the work.
Funding
This work was supported by funding from the National Natural Science Foundation of China (NSFC; No. 81372180), and Hunan Provincial Research and Development Program in Key Areas (2019WK2071).
Disclosure
The authors declare that they have no competing interests.
References
1. Anderson ME. Update on survival in osteosarcoma. Orthop Clin North Am. 2016;47(1):283–292. doi:10.1016/j.ocl.2015.08.022
2. Gaspar N, Marques da Costa ME, Fromigue O, Droit R, Berlanga P, Marchais A. Recent advances in understanding osteosarcoma and emerging therapies. Fac Rev. 2020;9:18. doi:10.12703/r/9-18
3. Cantor JR, Sabatini DM. Cancer cell metabolism: one hallmark, many faces. Cancer Discov. 2012;2(10):881–898. doi:10.1158/2159-8290.CD-12-0345
4. Warburg O, Wind F, Negelein E. The metabolism of tumors in the body. J Gen Physiol. 1927;8(6):519–530. doi:10.1085/jgp.8.6.519
5. Warburg O. On respiratory impairment in cancer cells. Science. 1956;124(3215):269–270. doi:10.1126/science.124.3215.269
6. Bonuccelli G, Avnet S, Grisendi G, et al. Role of mesenchymal stem cells in osteosarcoma and metabolic reprogramming of tumor cells. Oncotarget. 2014;5(17):7575–7588. doi:10.18632/oncotarget.2243
7. Shen Y, Xu J, Pan X, et al. LncRNA KCNQ1OT1 sponges miR-34c-5p to promote osteosarcoma growth via ALDOA enhanced aerobic glycolysis. Cell Death Dis. 2020;11(4):278. doi:10.1038/s41419-020-2485-1
8. Zhang J, Pavlova NN, Thompson CB. Cancer cell metabolism: the essential role of the nonessential amino acid, glutamine. EMBO J. 2017;36(10):1302–1315. doi:10.15252/embj.201696151
9. Choi YK, Park KG. Targeting glutamine metabolism for cancer treatment. Biomol Ther. 2018;26(1):19–28. doi:10.4062/biomolther.2017.178
10. Vallières M, Kay-Rivest E, Perrin LJ, et al. Radiomics strategies for risk assessment of tumour failure in head-and-neck cancer. Sci Rep. 2017;7(1):10117. doi:10.1038/s41598-017-10371-5
11. Xiao Y, Wu J, Lin Z, Zhao X. A deep learning-based multi-model ensemble method for cancer prediction. Comput Methods Programs Biomed. 2018;153:1–9. doi:10.1016/j.cmpb.2017.09.005
12. George JT, Jolly MK, Xu S, Somarelli JA, Levine H. Survival outcomes in cancer patients predicted by a partial EMT gene expression scoring metric. Cancer Res. 2017;77(22):6415–6428. doi:10.1158/0008-5472.CAN-16-3521
13. Zhao S, Cai J, Li J, et al. Bioinformatic profiling identifies a glucose-related risk signature for the malignancy of glioma and the survival of patients. Mol Neurobiol. 2017;54(10):8203–8210. doi:10.1007/s12035-016-0314-4
14. Luo T, Li Y, Nie R, et al. Development and validation of metabolism-related gene signature in prognostic prediction of gastric cancer. Comput Struct Biotechnol J. 2020;18:3217–3229. doi:10.1016/j.csbj.2020.09.037
15. Bianchi G, Gaiero L, Casales N, Silveri C, Belzarena AC. Osteosarcoma. In: Bone Tumors-Recent Advances and Modern Management. IntechOpen; 2021.
16. Shanware NP, Bray K, Eng CH, et al. Glutamine deprivation stimulates mTOR-JNK-dependent chemokine secretion. Nat Commun. 2014;5:4900. doi:10.1038/ncomms5900
17. Qian H, Lei T, Lei P, Hu Y. Construction and validation of an autophagy-related prognostic model for osteosarcoma patients. J Oncol. 2021;2021:9943465. doi:10.1155/2021/9943465
18. Ouyang Z, Li G, Zhu H, et al. Construction of a five-super-enhancer-associated-genes prognostic model for osteosarcoma patients. Front Cell Dev Biol. 2020;8:598660. doi:10.3389/fcell.2020.598660
19. Li LQ, Zhang LH, Zhang Y, et al. Construction of immune-related gene pairs signature to predict the overall survival of osteosarcoma patients. Aging. 2020;12(22):22906–22926. doi:10.18632/aging.104017
20. Xiao B, Liu L, Li A, et al. Identification and verification of immune-related gene prognostic signature based on ssGSEA for osteosarcoma. Front Oncol. 2020;10:607622. doi:10.3389/fonc.2020.607622
21. Vila IK, Yao Y, Kim G, et al. A UBE2O-AMPKα2 axis that promotes tumor initiation and progression offers opportunities for therapy. Cancer Cell. 2017;31(2):208–224. doi:10.1016/j.ccell.2017.01.003
22. Vo VTA, Choi JW, Phan ANH, et al. TRAP1 inhibition increases glutamine synthetase activity in glutamine auxotrophic non-small cell lung cancer cells. Anticancer Res. 2018;38(4):2187–2193. doi:10.21873/anticanres.12460
23. Joshi A, Dai L, Liu Y, et al. The mitochondrial HSP90 paralog TRAP1 forms an OXPHOS-regulated tetramer and is involved in mitochondrial metabolic homeostasis. BMC Biol. 2020;18(1):10. doi:10.1186/s12915-020-0740-7
24. Bott AJ, Peng IC, Fan Y, et al. Oncogenic Myc induces expression of glutamine synthetase through promoter demethylation. Cell Metab. 2015;22(6):1068–1077. doi:10.1016/j.cmet.2015.09.025
25. Shajahan-Haq AN, Cook KL, Schwartz-Roberts JL, et al. MYC regulates the unfolded protein response and glucose and glutamine uptake in endocrine resistant breast cancer. Mol Cancer. 2014;13:239. doi:10.1186/1476-4598-13-239
26. Chen D, Zhao Z, Huang Z, et al. Super enhancer inhibitors suppress MYC driven transcriptional amplification and tumor progression in osteosarcoma. Bone Res. 2018;6:11. doi:10.1038/s41413-018-0009-8
27. Shen S, Yao T, Xu Y, Zhang D, Fan S, Ma J. CircECE1 activates energy metabolism in osteosarcoma by stabilizing c-Myc. Mol Cancer. 2020;19(1):151. doi:10.1186/s12943-020-01269-4
28. Torgovnick A, Schumacher B. DNA repair mechanisms in cancer development and therapy. Front Genet. 2015;6:157. doi:10.3389/fgene.2015.00157
29. Zamble DB, Lippard SJ. Cisplatin and DNA repair in cancer chemotherapy. Trends Biochem Sci. 1995;20(10):435–439. doi:10.1016/S0968-0004(00)89095-7
30. Stefanski CD, Keffler K, McClintock S, Milac L, Prosperi JR. APC loss affects DNA damage repair causing doxorubicin resistance in breast cancer cells. Neoplasia. 2019;21(12):1143–1150. doi:10.1016/j.neo.2019.09.002
31. Herath NI, Devun F, Herbette A, et al. Potentiation of doxorubicin efficacy in hepatocellular carcinoma by the DNA repair inhibitor DT01 in preclinical models. Eur Radiol. 2017;27(10):4435–4444. doi:10.1007/s00330-017-4792-1
32. Ferrari S, Serra M. An update on chemotherapy for osteosarcoma. Expert Opin Pharmacother. 2015;16(18):2727–2736. doi:10.1517/14656566.2015.1102226
33. Wang M, Kaufman RJ. The impact of the endoplasmic reticulum protein-folding environment on cancer development. Nat Rev Cancer. 2014;14(9):581–597. doi:10.1038/nrc3800
34. Madden E, Logue SE, Healy SJ, Manie S, Samali A. The role of the unfolded protein response in cancer progression: from oncogenesis to chemoresistance. Biol Cell. 2019;111(1):1–17. doi:10.1111/boc.201800050
35. Chaiyawat P, Sungngam P, Teeyakasem P, et al. Protein profiling of osteosarcoma tissue and soft callus unveils activation of the unfolded protein response pathway. Int J Oncol. 2019;54(5):1704–1718. doi:10.3892/ijo.2019.4737
36. Yan M, Ni J, Song D, Ding M, Huang J. Activation of unfolded protein response protects osteosarcoma cells from cisplatin-induced apoptosis through NF-κB pathway. Int J Clin Exp Pathol. 2015;8(9):10204–10215.
37. Edwards DN, Ngwa VM, Raybuck AL, et al. Selective glutamine metabolism inhibition in tumor cells improves antitumor T lymphocyte activity in triple-negative breast cancer. J Clin Invest. 2021;131(4). doi:10.1172/JCI140100
38. Tyagi A, Sharma S, Wu K, et al. Nicotine promotes breast cancer metastasis by stimulating N2 neutrophils and generating pre-metastatic niche in lung. Nat Commun. 2021;12(1):474. doi:10.1038/s41467-020-20733-9
39. Tawbi HA, Burgess M, Bolejack V, et al. Pembrolizumab in advanced soft-tissue sarcoma and bone sarcoma (SARC028): a multicentre, two-cohort, single-arm, open-label, phase 2 trial. Lancet Oncol. 2017;18(11):1493–1501. doi:10.1016/S1470-2045(17)30624-1
40. Boye K, Longhi A, Guren T, et al. Pembrolizumab in advanced osteosarcoma: results of a single-arm, open-label, phase 2 trial. Cancer Immunol Immunother. 2021;70(9):2617–2624. doi:10.1007/s00262-021-02876-w
41. Le Cesne A, Marec-Berard P, Blay JY, et al. Programmed cell death 1 (PD-1) targeting in patients with advanced osteosarcomas: results from the PEMBROSARC study. Eur J Cancer. 2019;119:151–157. doi:10.1016/j.ejca.2019.07.018
42. Wu CC, Beird HC, Andrew Livingston J, et al. Immuno-genomic landscape of osteosarcoma. Nat Commun. 2020;11(1):1008. doi:10.1038/s41467-020-14646-w
 © 2022 The Author(s). This work is published and licensed by Dove Medical Press Limited. The full terms of this license are available at https://www.dovepress.com/terms.php and incorporate the Creative Commons Attribution - Non Commercial (unported, v3.0) License.
By accessing the work you hereby accept the Terms. Non-commercial uses of the work are permitted without any further permission from Dove Medical Press Limited, provided the work is properly attributed. For permission for commercial use of this work, please see paragraphs 4.2 and 5 of our Terms.
© 2022 The Author(s). This work is published and licensed by Dove Medical Press Limited. The full terms of this license are available at https://www.dovepress.com/terms.php and incorporate the Creative Commons Attribution - Non Commercial (unported, v3.0) License.
By accessing the work you hereby accept the Terms. Non-commercial uses of the work are permitted without any further permission from Dove Medical Press Limited, provided the work is properly attributed. For permission for commercial use of this work, please see paragraphs 4.2 and 5 of our Terms.