")
Back to Journals » International Journal of General Medicine » Volume 15
A Novel Angiogenesis-Related Prognostic Signature Associated with the Hepatocellular Carcinoma Immune Microenvironment and Survival Outcome
Authors Jiang X, Xu Y, Chen D, Wang M, Qiu M, Xiong L, Zhang L, Yu H, Xiong Z
Received 2 December 2021
Accepted for publication 23 December 2021
Published 7 January 2022 Volume 2022:15 Pages 311—323
DOI https://doi.org/10.2147/IJGM.S349210
Checked for plagiarism Yes
Review by Single anonymous peer review
Peer reviewer comments 2
Editor who approved publication: Dr Scott Fraser
Xin Jiang, Yushuang Xu, Di Chen, Mengmeng Wang, Mengjun Qiu, Lina Xiong, Li Zhang, Honglu Yu, Zhifan Xiong
Department of Gastroenterology, Liyuan Hospital, Tongji Medical College, Huazhong University of Science and Technology, Wuhan, People’s Republic of China
Correspondence: Zhifan Xiong
Department of Gastroenterology, Liyuan Hospital, Tongji Medical College, Huazhong University of Science and Technology, Wuhan, People’s Republic of China
Tel +86 13517281937
Email [email protected]
Purpose: Hepatocellular carcinoma (HCC) is a highly vascularized solid tumor characterized by neovascularization and vascular invasion. Angiogenesis plays an essential role in the occurrence and development of liver cancer. Our study aimed to investigate the prognostic value of angiogenesis-related genes in liver cancer.
Patients and Methods: The transcriptome data and corresponding clinical information of patients with liver cancer were downloaded from The Cancer Genome Atlas (TCGA) and the International Cancer Genome Consortium (ICGC) databases. In the TCGA cohort, differential expression and prognostic analyses were used to screen angiogenesis-related candidate prognostic genes. We then used least absolute shrinkage and selection operator regression analysis to construct a prognostic signature using 10 angiogenesis-related prognostic genes. The reliability of the prognostic signature was assessed in the TCGA and ICGC cohorts. In addition, we comprehensively analyzed the correlation of the prognostic signature with the tumor microenvironment, chemotherapy drugs, and specific genes.
Results: We identified 37 angiogenesis-related differentially expressed genes that were remarkably associated with prognosis. Ten of these genes were used to establish a survival and prognostic signature. This signature can distinguish between high-risk and low-risk groups and performs well in overall survival prediction, as demonstrated by internal and external validations. In addition, we observed that the high-risk group was remarkably associated with immune infiltration in the tumor microenvironment and had a different sensitivity to chemotherapeutic agents compared with the low-risk group. Moreover, the high-risk population was positively correlated with the expression of several special genes, such as immune checkpoint-related genes.
Conclusion: Our results demonstrated that prognostic signatures based on angiogenesis-related genes are involved in the development of HCC and may provide new insights into accurate clinical decision-making and therapeutic evaluation of patients with HCC.
Keywords: hepatocellular carcinoma, angiogenesis-related gene, signature, tumor microenvironment, immune infiltration, prognosis
Introduction
Liver cancer is one of the most common malignancies in the world. This condition has various histological types, among which hepatocellular carcinoma (HCC) accounts for 83%.1 HCC is a highly complex type of cancer driven by multiple factors, such as hepatitis virus infection, metabolic abnormalities, and liver fibrosis.2 Liver cancer treatment involves various methods, including chemotherapy, targeted therapy, surgical resection, and liver transplantation.3 However, only a small number of patients benefit from each method, and the 5-year survival rate of patients with liver cancer is still low.4 Therefore, understanding the molecular mechanism of HCC development and identifying new biomarkers to predict clinical outcomes and therapeutic targets in patients with HCC are crucial.
HCC, as a kind of hypervascular tumor, is the fifth-largest cancer in the world.5 Angiogenesis plays an essential role in the development of liver cancer. Tumor blood vessels are the main pathways for nutrient exchange and metabolic waste removal in tumors.6 Angiogenesis plays an essential role in the development of liver cancer. Tumor blood vessels are the main pathways for nutrient exchange and metabolic waste removal in tumors.7–9 Anti-angiogenic therapy has consistently been the focus of HCC research, and most therapies for advanced HCC target the angiogenic pathway. Sorafenib, a multi-kinase inhibitor that targets vascular endothelial growth factor receptor, remarkably improves the overall survival (OS) of patients with HCC.10,11 However, most research has focused on the influence of individual genes on prognosis. The construction of multiple angiogenesis-related gene models seems to provide effective risk identification and potential targets for HCC clinical treatment.
The emergence of various public databases based on the development of high-throughput technology has provided researchers with great opportunities for statistical analysis.12,13 The present study used transcriptome and corresponding clinical data from 377 patients with HCC downloaded from The Cancer Genome Atlas (TCGA) to develop a predictive model of angiogenesis-related genes. Then, the model was further verified using a cohort from the International Cancer Genome Consortium (ICGC) database. Additionally, we revealed the role and relevance of this prognostic signature in the immune and tumor microenvironments of liver cancer.
Materials and Methods
Data Download
Transcriptome data and corresponding clinical information for HCC were downloaded from the TCGA database, including 377 HCC samples and 50 paracancerous normal samples. Missing data and samples with less than 30 days of clinical follow-up were removed to exclude the possible effects of acute onset and other accidental deaths. The external validation data of the LIRI-JP cohort, which contained 260 HCC samples, were downloaded from the ICGC website. Supplementary Table 1 shows the details of the two sets of data. All data used were obtained from public databases. Thus, no ethical approval was required. Angiogenesis-related genes were downloaded from the GeneCards website (https://www.genecards.org/) using “angiogenesis” as the main search term. The correlation score indicated the strength of correlation between genes and angiogenesis. We obtained 378 angiogenesis-related genes for subsequent studies based on correlation scores ≥ 5.
Identification of Prognostic Angiogenesis-Related Genes
The “Limma” package of R software was used to identify the angiogenesis-related differentially expressed genes (DEGs) between tumor and normal samples (false discovery rate<0.05, LogFc>1). Later, we combined the OS data to perform univariate Cox analysis to screen the prognostic genes using R “survival” package at P<0.01. In addition, we used the R “Venn” package to obtain the intersection between angiogenesis-related DEGs and prognostic genes. The candidate genes were used for the construction of the prognostic signature.
Construction of Prognostic Angiogenesis-Related Gene Signature
We further performed least absolute shrinkage and selection operator (LASSO) regression analysis for the intersection genes using the “survival” and “glmnet” packages of R languages. Based on the optimal lambda value and the corresponding coefficient, the prognostic signature was established to prevent the over-fitting effect of the model. Finally, we screened ten angiogenesis-related genes to construct a prognostic signature. Then, we calculated each patient’s risk score based on the gene correlation coefficient and their respective expression level. The detailed calculation formula is as follows:  , where n is the number of screened genes, Coef is the gene correlation coefficient, and Exp is the gene expression level.
Validation of the Prognostic Angiogenesis-Related Gene Signature
We divided the HCC samples into high-risk and low-risk groups based on the median risk score determined using the prognosis-related gene signature. Then, survival analysis was performed using the R language “survival” package. We also used the “timeROC” and “survival” packages to perform time-dependent receiver operating characteristic (ROC) curve analysis and a comparison of ROC curve analysis combined with other clinical features. In addition, univariate and multivariate Cox regression analyses were performed by combining multiple clinical features to further evaluate whether our signature is an independent prognostic factor for patients with HCC. The “survminer” and “pheatmap” packages were used for visual drawing.
Correlation Analysis Between the Prognostic Signature and Tumor Immunity
Tumor stem cell characterization was performed on TCGA tumor samples to measure tumor stem cell-like features. We then used Spearman correlation analysis to test the correlation between risk score and tumor stemness. Immune and stromal scores reflect the degrees of infiltration of immune and stromal cells in the tumor tissue, respectively. These scores were calculated using the R “estimate” software package. Then, we analyzed the differences between the scores in the high-risk and low-risk groups using the “Limma” and “ggpubr” packages. Later, the “GSVA” software package was used to calculate the infiltration scores of different immune cells and the activities of immune-related pathways between high-risk and low-risk populations by single-sample gene set enrichment analysis (ssGSEA).
Clinical Performance of the Prognostic Signature
We evaluated the performance of this prognostic signature in a variety of clinical settings. First, we used chi-square test to investigate the relationship between the prognostic signature and conventional clinicopathological features. Second, Wilcoxon signed-rank test was used to calculate the differences in risk scores between groups with different clinicopathological features. The R language packages “survival,” “pheatmap,” and “ggupbr” were used for the analysis and the creation of bar and scatter plots. P values were labeled as follows: P>0.05=ns, P<0.001=***P<0.01=**and P<0.05=*. Principal component analysis (PCA) was then performed using the “Scatterplot3D” software package to assess the performance of prognostic signatures in differentiating patients with high and low risks of HCC.
Clinical Treatment Performance and Potential Function of the Prognostic Signature in HCC
We used Wilcoxon signed-rank test in the TCGA cohort to compare the half-maximal inhibitory concentrations (IC50) of widely used chemotherapeutic drugs (in TCGA) in the high-risk and the low-risk groups. The “pRophetic” and “ggplot2” software packages were used for drawing. In addition, we studied the relationship of the signature with immune checkpoint genes, m6A genes, methylation genes, and mismatch repair genes. P<0.05 was considered statistically significant.
Results
Identification of Prognostic Angiogenesis-Related DEGs in the TCGA Cohort
Figure 1 shows the flowchart of our study. We obtained 378 angiogenesis-related genes from GeneCards, 377 HCC samples from TCGA as the training cohort, and 260 HCC samples from ICGC as the corresponding validation cohort. Supplementary Table 1 shows the clinical baseline characteristics of all patients. We extracted the mRNA data of angiogenic genes from the TCGA cohort and subsequently confirmed 123 angiogenesis-related DEGs through differential expression analysis. The volcano map in Figure 2A shows the angiogenesis-related DEGs in the tumor tissue. We identified 37 genes that were remarkably associated with OS in the univariate Cox analysis combined with clinical prognostic information (Figure 2B). The forest map in Figure 2C shows the results of the univariate Cox regression analysis of the 37 angiogenesis-related DEGs. Most of the genes serve as risk factors for patients with HCC (hazard ratio (HR)>1), and only ESR1 plays a protective role in patients with HCC (HR<1). The heatmap in Figure 2D shows the differential expression patterns of these DEGs. The protein interaction network in Figure 2E shows that the 37 candidate genes closely interacted with each other. Among these genes, ANXA5, EGF, CASP8, and ESR1 were used as hub genes. The correlation network diagram of all prognostic angiogenesis-related DEGs is shown in Figure 2F, where different colors represent various correlation coefficients.
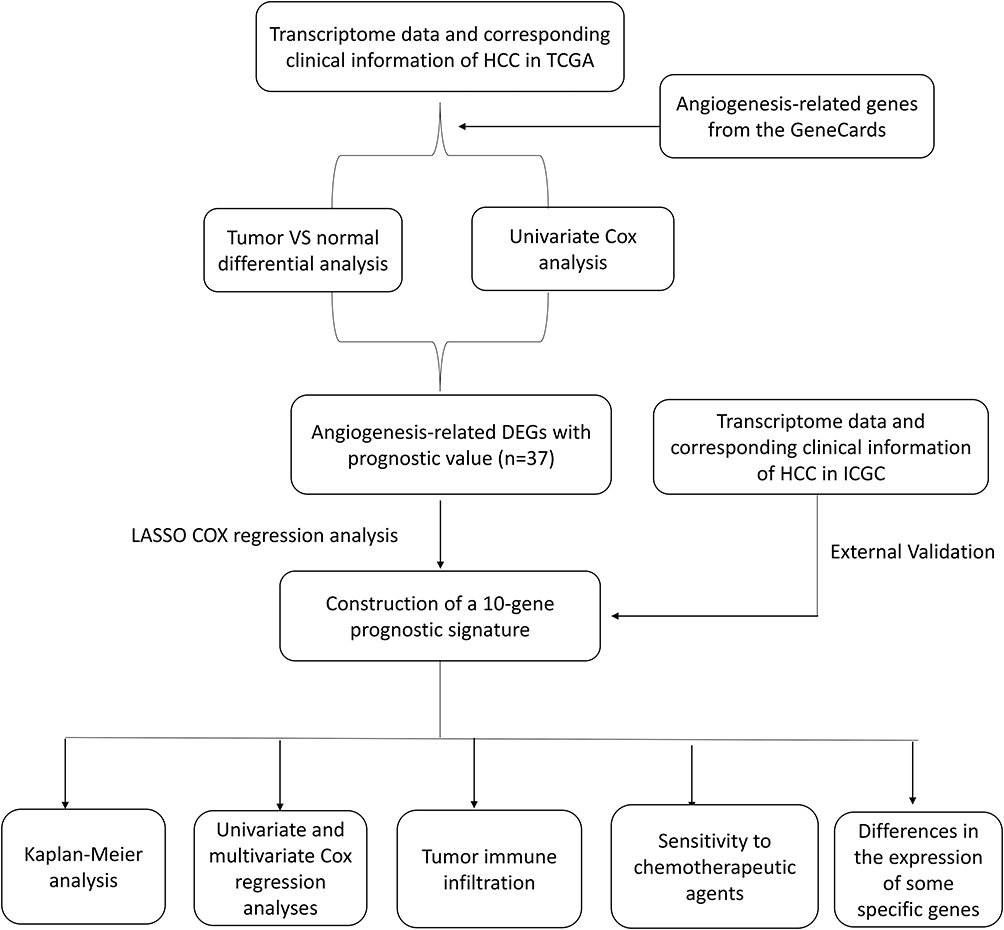 |
Figure 1 The flowchart of this study. |
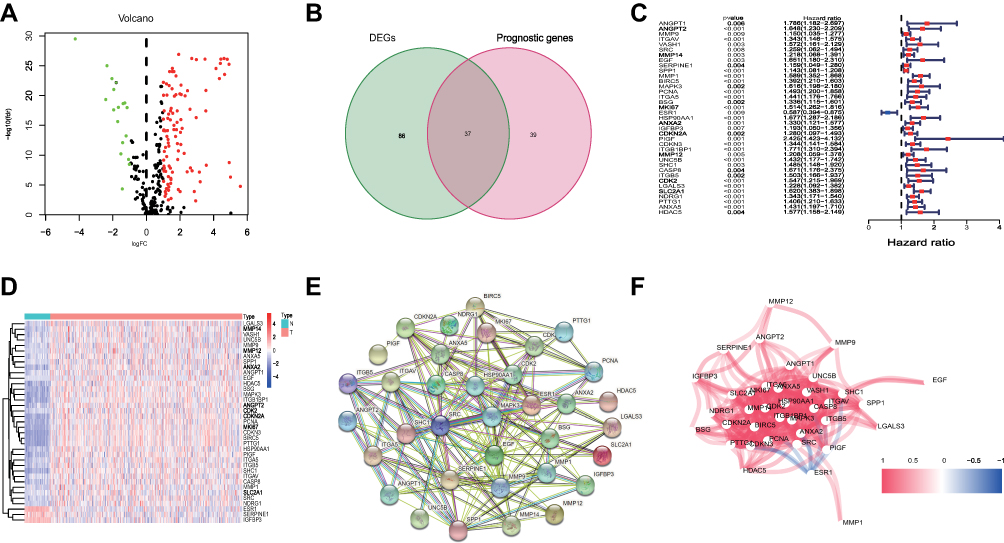 |
Figure 2 Differentially expressed angiogenesis-related genes (DEGs) in HCC. (A) Volcano plot of DEGs in TCGA database. (B) Venn diagram was used to identify overlapping genes. (C) The forest map showed univariate Cox regression analysis results between gene expression and overall survival; HR>1 are risk factors for HCC, while HR<1 are protective factors for HCC. (D) The heatmap of 37 prognostic DEGs in tumor and normal tissue. (E) The PPI network provided interactive information among the 37 prognostic DEGs. (F) The correlation network diagram of prognostic DEGs, with different colors representing different degrees of the correlation coefficient. |
Construction of Angiogenesis-Related Prognostic Signature in the TCGA Cohort
LASSO regression analysis was performed on the 37 candidate DEGs to establish optimized prognostic characteristics. We constructed a prognostic signature from 10 genes, namely, ANGPT2, SERPINE1, SPP1, MMP1, BIRC5, BSG, HSP90AA1, PIGF, LGALS3, and SLC2A1. We calculated the risk score of each patient using the following risk scoring formula: risk score=[Exp(ANGPT2)×0.037]+[Exp(SERPINE1)×0.015]+[Exp(SPP1)×0.034]+[Exp(MMP1)×0.139]+[Exp(BIRC5)×0.090]+[Exp(BSG)×0.037]+[Exp(HSP90AA1)×0.147]+[Exp(PIGF)×0.040]+[Exp(LGALS3)×0.017]+[Exp(SLC2A1)×0.138]. Later, we divided the patients with HCC in the TCGA cohort into high-risk (n=171) and low-risk groups (n=172) based on the median risk score (Figure 3A). The scatter plot in Figure 3B shows that patient survival became shorter as the risk score increased. The Kaplan–Meier curve verifies that the OS of patients with HCC in the high-risk group was significantly poorer than that of patients with HCC in the low-risk group (P=6.76e−10, Figure 3C). Further, we evaluated the predictive effect of this prognostic signature on the OS of patients with HCC through time-dependent ROC curves. As shown in Figure 3D, the area under the curve (AUC) was 0.811 in the first year, 0.726 in the second year, and 0.708 in the third year (Figure 3D). Moreover, Figure 3E shows that the prognostic signature is superior to conventional clinicopathologic features in predicting prognosis (AUC=0.811).
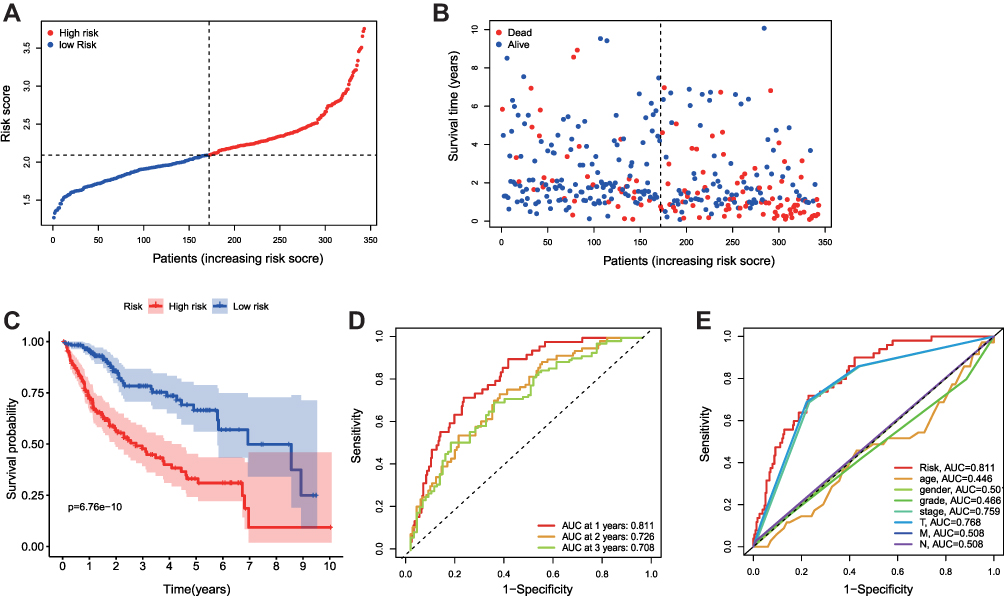 |
Figure 3 Angiogenesis-Related Prognostic Signature in TCGA Cohort. (A) Signature-based risk scores were used to classify patients as high risk or low risk. (B) The scatter plot of survival status of HCC patients. (C) Kaplan-Meier survival analysis for patients between high-risk group and low-risk group. (D) The area under the time-dependent ROC curves was used to validate the prognostic performance of the risk score. (E) The multi-indicator receiver operating characteristic curves validated the predictive performance of the risk score for overall survival. |
Validation of the Angiogenesis-Related Prognostic Signature in the ICGC Cohort
We used HCC samples in ICGC for external validation to verify the applicability and stability of the model constructed by the TCGA cohort. The risk scores of patients in the ICGC cohort were calculated using the same risk scoring formula, and all patients were divided into high-risk and low-risk groups based on the median risk score (Figure 4A). In the ICGC cohort, the number of deaths increased as the patient risk score increased (Figure 4B). The survival curve shows that the prognosis of patients with HCC in the high-risk group was poorer, and the difference was statistically significant (P=6.004E-03, Figure 4C). Meanwhile, the time-dependent ROC curve showed that the AUC was 0.714 in the first year, 0.703 in the second year, and 0.719 in the third year (Figure 4D). These results are similar to those for the TCGA cohort.
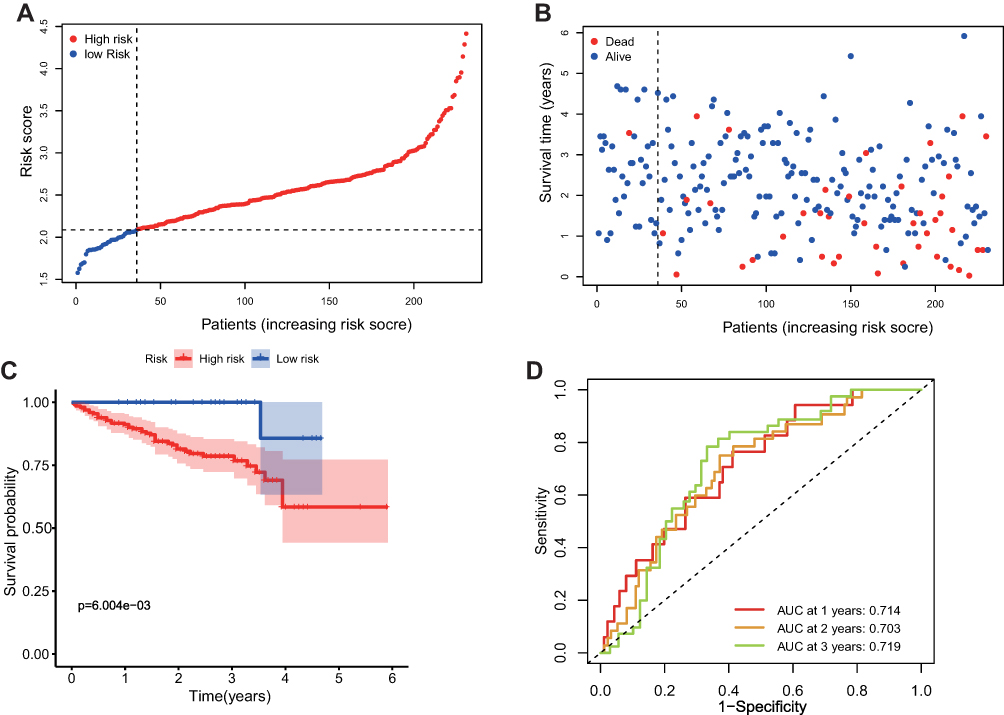 |
Figure 4 Angiogenesis-Related Prognostic Signature in ICGC Cohort. (A) Signature-based risk scores were used to classify patients as high risk or low risk. (B) The scatter plot of survival status of HCC patients. (C) Kaplan-Meier survival analysis for patients between high-risk group and low-risk group. (D) The area under the time-dependent ROC curves was used to validate the prognostic performance of the risk score. |
Independent Prognostic Value of the Angiogenesis-Related Prognostic Signature
We examined whether risk score is an independent predictor of OS in patients with HCC. Univariate and multivariate Cox regression analyses were performed by combining conventional clinical variables from TCGA and ICGC. The univariate Cox analysis results in Figure 5A show that the risk score can be a predictor of OS in the TCGA cohort (HR=4.271, P<0.001). Similarly, the risk score was an independent predictor in the ICGC cohort (HR=2.797, P<0.001, Figure 5C). The multivariate Cox regression analysis results in Figure 5B and D further demonstrate that risk score can be an independent predictor of OS in the TCGA (HR=3.617, P<0.001) and ICGC cohorts in the multivariate Cox analysis (HR=2.124, P=0.003).
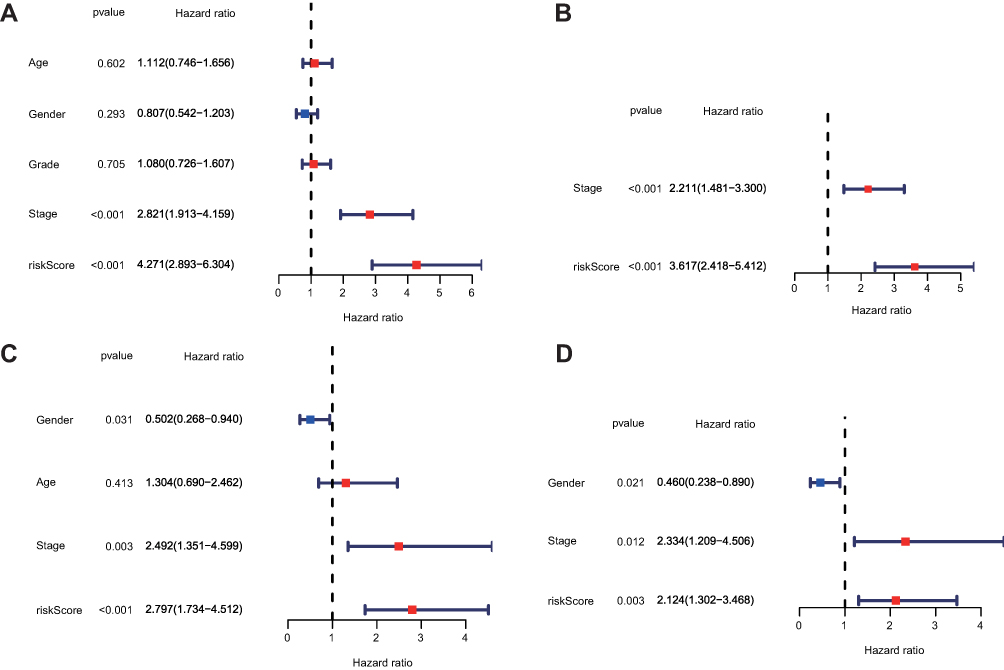 |
Figure 5 Independent prognostic value of the signature in HCC. (A) The univariate Cox regression analysis of the signature-based risk scores and clinicopathologic parameters in the TCGA Cohort. (B) The multivariate Cox regression analysis of the signature-based risk scores and clinicopathologic parameters in the TCGA Cohort. (C) The univariate Cox regression analysis of the signature-based risk scores and clinicopathologic parameters in the ICGC Cohort. (D) The multivariate Cox regression analysis of the signature-based risk scores and clinicopathologic parameters in the ICGC Cohort. |
Clinical Value of the Angiogenesis-Related Prognostic Signature
We also analyzed the value of prognostic signatures in clinical applications. The results of clinical correlation analysis revealed that clinical grade, tumor stage, and T stage were remarkably associated with risk score (Figure 6A). The scatter plot in Figure 6B–H further details the correlation between each clinical feature and risk score. In addition, the PCA results showed that the 10 angiogenesis-related genes were more effective in differentiating high-risk groups than TCGA full gene expression profiles and the 375 angiogenesis-related coding genes (Figure 6I–K).
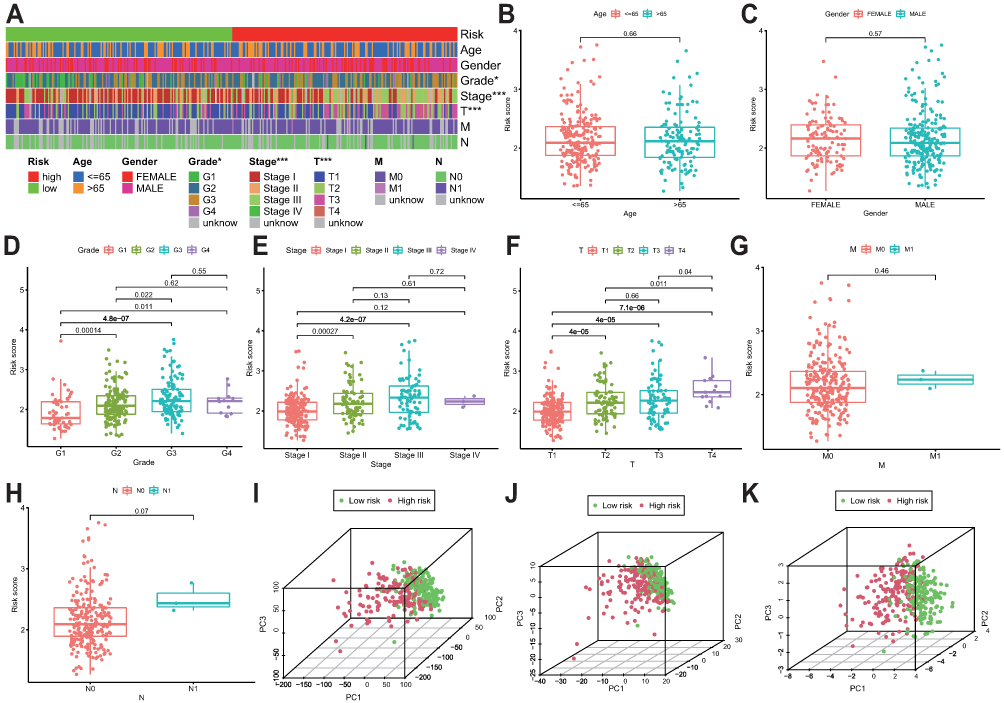 |
Figure 6 Clinical correlation analysis of prognostic signature. The strip chart (A) and scatter plots showed associations between risk scores and clinical pathologic features, including age (B), gender (C), grade (D), stage (E), T stage (F), M stage (G), and N stage (H). Principal component analysis between low-risk and high-risk groups based on the whole-genome (I), angiogenesis-related genes (J), and the prognostic signature of the 10 angiogenesis-related genes signature (K). Notes: *p < 0.05; **p < 0.01; ***p < 0.001. |
Association Value of Immune and Tumor Microenvironments with the Prognostic Signature
The loss of differentiated phenotype and the acquisition of progenitor and stem cell-like characteristics are the main features of the malignant progression of tumor cells.14 However, tumor stem cell-like characteristics are the primary cause of the infinite proliferation and recurrence of malignant tumor cells. These characteristics can be measured by RNA stemness score (RNAss), which is based on mRNA expression, and DNA stemness score (DNAss), which is based on DNA methylation pattern.15 In addition, the tumor microenvironment, including immune cells and stromal cells, is believed to play an essential role in tumor development, metastasis, recurrence, and drug resistance.16 We combined the tumor stemness score, stromal cell score, and immune cell score of HCC patients to analyze the association of these scores with the risk score. The results showed that risk score was significantly correlated with RNAss (R=0.15, P=0.0065, Figure 7B) and immunity score (P= 0.00053, Figure 7D). These findings also indicated that the role of immunization in high-risk groups cannot be ignored.
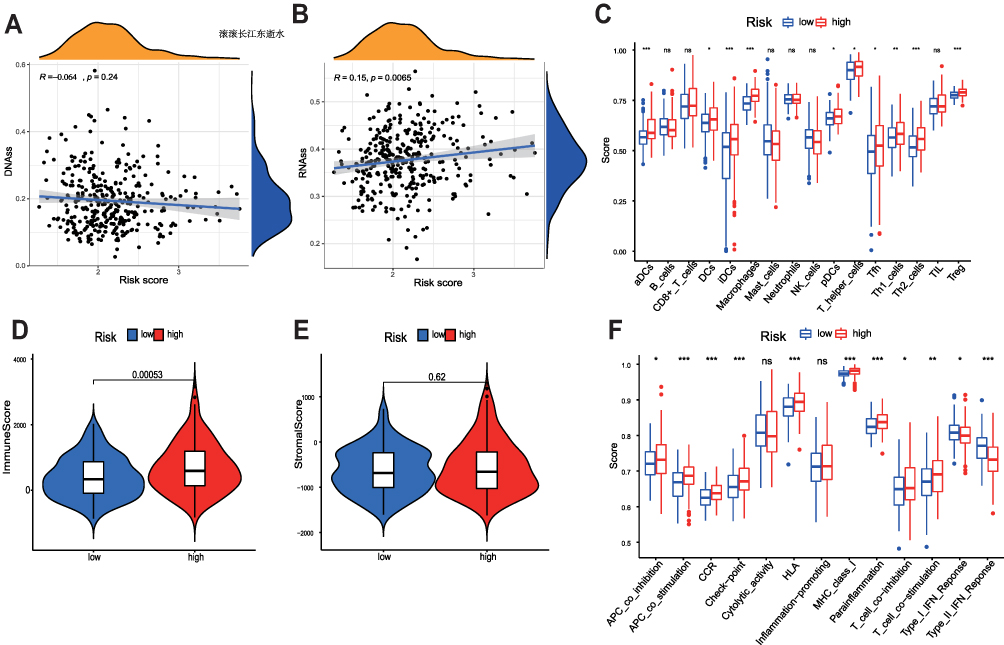 |
Figure 7 Correlation analysis of prognostic signature and tumor microenvironment. The relationship between risk score and DNAss (A), RNAss (B), Immune Score (D), and Stromal Score (E). Boxplots showed the scores of 16 immune cells (C) and 13 immune-related roles (F) in high and low risk group by “ssGSEA”. Abbreviation: ns, not significant. Notes: *p < 0.05; **p < 0.01; ***p < 0.001. |
Furthermore, we used ssGSEA to calculate different immune cell subsets and related function enrichment scores in high-risk and low-risk populations. The results showed that the proportions of Tfh, T helper, Th1, Th2, and Treg cells, T cell co-stimulation, and T cell co-inhibition were all high in the high-risk group, which suggest that the high-risk and low-risk groups had differences in T-cell regulation (P<0.05, Figure 7C and F). On the contrary, Types I and II interferon responses were enriched in the low-risk group (P<0.05).
Correlation Between the Prognostic Signature and Specific Genes
Considering that immune checkpoints are closely related to immunotherapy, we further explored the differences in the expression of immune checkpoints between the high-risk and low-risk groups. The results showed substantial differences in the expression of multiple immune checkpoints, such as CD274 (PD-L1), PDCD1 (PD-L1), and CTLA4, between the two groups (P<0.05, Figure 8A). In addition, we discovered considerable differences in the expression of m6A-related, mismatch repair-related, and DNA methylation-related mRNAs between the high-risk and low-risk groups (P<0.05, Figure 8B–D).
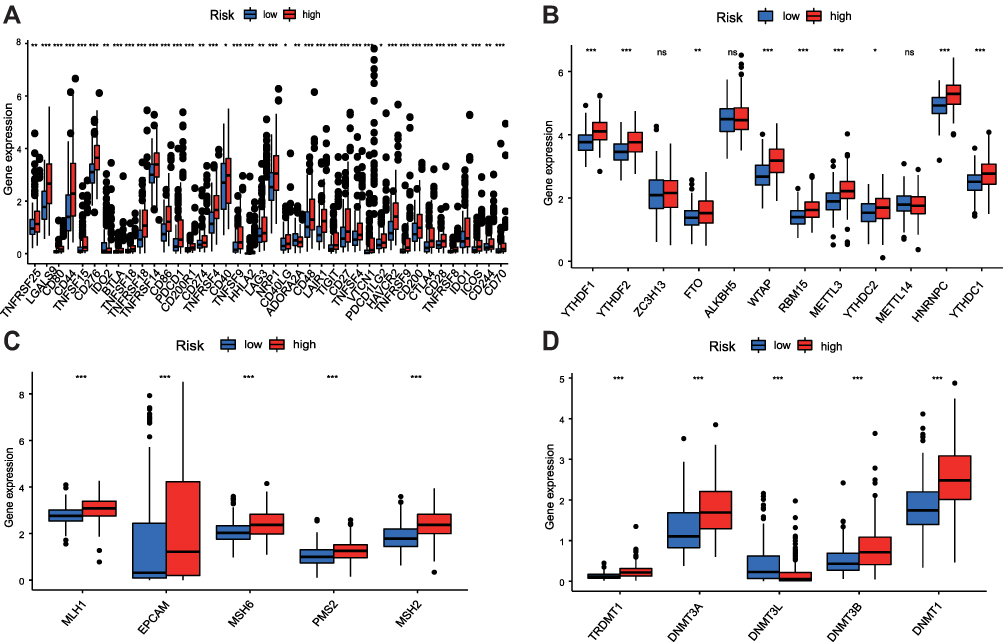 |
Figure 8 Differential expression analysis of immune-related genes (A), m6A-related genes (B), mismatch repair-related genes (C), and methylation-related genes (D) among different risk groups. Abbreviation: ns, not significant. Notes: *p < 0.05; **p < 0.01; ***p < 0.001. |
Associations Between Prognostic Signatures and Common Chemotherapeutic Drugs
The American Joint Committee on Cancer guidelines recommend chemotherapeutic drugs, such as cisplatin, doxorubicin, mitomycin, sorafenib, and vincristine, for the treatment of HCC. Thus, we evaluated the difference in the response between the high-risk and low-risk groups to these chemotherapeutic agents based on their IC50 values in the TCGA-LIHC dataset. The results showed that the high-risk group was associated with lower IC50 levels of cisplatin (P=0.00022, Figure 9A), doxorubicin (P=9.1e−06, Figure 9B), and mitomycin (P<2.22e−16, Figure 9C) and higher IC50 levels of sorafenib (P=0.027, Figure 9D). These findings also suggest that the model can be used as a potential basis for clinical guidance of chemotherapy drugs.
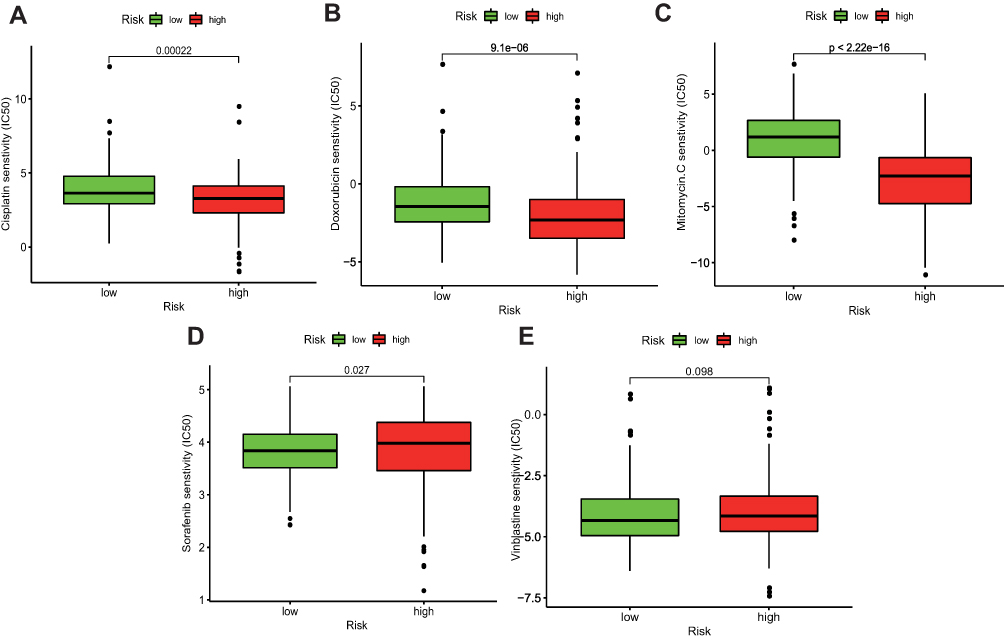 |
Figure 9 Differences in IC50 between common chemotherapeutic agents and different risk groups were assessed based on prognostic signature such as cisplatin (A), doxorubicin (B), mitomycin (C), sorafenib (D), and vincristine (E). |
Discussion
HCC is the second leading cause of cancer-related deaths worldwide, and its high metastatic and recurrent characteristics limit the long-term survival of patients.17 A number of evidence show that vascular invasion and angiogenesis are closely related to the invasion, metastasis, and prognosis of liver cancer.18,19 Tumor blood vessels penetrate the tumor, provide nutrients to cancer cells, and deliver large numbers of tumor cells throughout the host’s body, which causes cancer to spread and metastasize.20,21 Tumor angiogenesis is regulated by the balance of pro-angiogenic and anti-angiogenic factors in the tumor microenvironment. As the switch of angiogenesis, angiogenic factors promote the formation of tumor blood vessels.22–24 Importantly, the role of anti-angiogenic therapy in HCC is widely recognized. Therefore, the role of angiogenesis in liver cancer cannot be ignored. We constructed the prognostic signature of angiogenesis-related genes to provide accurate ways for clinical decision-making through the multi-gene method.
Our study explored the correlation between the expression differences of 375 angiogenesis-related genes and the prognosis of patients with HCC. For the first time, a 10-gene angiogenesis-related prognostic signature was constructed in TCGA internal cohort and verified by an ICGC external cohort. Second, we evaluated the performance of this prognostic signature in various aspects, including OS, common clinicopathological characteristics, tumor immune microenvironment, common chemotherapeutic drugs, and several specific genes. The results showed that the model has a robust clinical guidance function and can be used to distinguish clinical patients with high and low risks.
Our prognostic signature contains 10 angiogenesis-related genes, namely, ANGPT2, BSG, SERPINE1, MMP1, BIRC5, PIGF, SLC2A1, LGALS3, SPP1, and HSP90AA1. ANGPT2, a member of the angiogenic family, is highly expressed in various tumor cells, including liver cancer.25 In addition to the classical ANGPT2/Tie2 pathway, ANGPT2 can induce angiogenesis in liver cancer tissues by secreting exosomes that carry ANGPT2. Blocking ANGPT2 inhibits angiogenesis and epithelial–mesenchymal activation.26 BSG is also known as CD147. Jin et al confirmed that the low phosphorylation of CD147 promotes the invasion and metastasis of HCC cells and is associated with poor prognosis.27 Heike et al observed that CD147 can promote metastatic formation by inducing angiogenesis in a MMP-independent way in melanoma models.28 SERPINE1 promotes tumorigenesis by protecting tumor cells from apoptosis, and its high expression is associated with poor prognosis of HCC and other tumors.29,30 MMP1, BIRC5,31 PIGF,32 SLC2A1,33 LGALS3,34 and SPP135 play important roles in the proliferation, migration, and invasion of HCC cells, and several of them can be used as an indicator of the poor prognosis of HCC.36 These results provide great support for the construction of the prognostic signature.
The tumor microenvironment is an important factor that affects the biological behavior and prognosis of malignant tumors and comprises stromal cells, immune cells, and cytokines.37 Immune cells are related to the malignant biological behavior of tumors and immune checkpoint inhibitor response.38–40 Numerous studies have shown that tumor microenvironment and infiltrating immune cell subsets play an essential role in regulating tumor angiogenesis. Elisabeth et al believed that immune status analysis can provide critical information for the clinical optimization of treatment combinations.39 In our study, we observed a remarkable correlation between immune and patient risk scores in the tumor microenvironment, that is, a high-risk score is substantially associated with the infiltration of dendritic cell (DC) subsets and T cell subsets. DCs are specialized antigen-presenting cell. The activation of cytotoxic T lymphocyte responses by DCs is essential for tumor eradication.41 However, in our study, we did not find an association between high risk score and the proportion of CD8+ T cells. This result may be due to the impaired antigen-presenting function in high-risk populations or the high infiltration of macrophages and Treg cells in the stroma to inhibit T cells, which downregulates the anti-tumor immune response.42,43
Angiogenesis is a complex process. Despite the prominence of anti-angiogenic therapies in hepatocyte therapy, the development of drug resistance is a crucial impediment.44 In our analysis, the sensitivity of the high-risk group to sorafenib was lower than that of the low-risk group, possibly because the high-risk group was more prone to hypervascularization and drug resistance. We believe in the importance of exploring the combination of anti-angiogenic drugs and new immunity-targeting drugs with the discovery and rise of immune checkpoint inhibitors. We only analyzed the association of prognostic signature with immune checkpoint-related genes because of the lack of available data. The results showed that most immune-related genes were expressed differently in different risk groups, which further suggested that this prognostic signature may provide essential guidance for future clinical individualized treatment.
To date, most of the research and application of genes related to angiogenesis have been based on a single gene and cannot fully reflect tumor characteristics. In this study, we first focused on collecting tumor angiogenesis-related genes and constructed a 10-gene prognostic signature. Second, we confirmed that this signature can be used to independently evaluate tumor prognosis and is substantially correlated with tumor grade, stage, cancer stem cell characteristics, and immune status through multiple analyses. Third, we observed that this signature was remarkably associated with specific genes (immune checkpoint, m6A, methylation, and mismatch repair genes). All of these genes are closely related to tumor occurrence and development. More importantly, the risk score based on this signature showed a considerable association with the sensitivity of common chemotherapeutic drugs.
Conclusion
In conclusion, we believe that this study constructed a prognostic signature based on angiogenesis-related genes and provided new insights into the treatment and prognostic evaluation of HCC, which will be helpful for the promotion of individualized drug combination therapy in the future.
Data Sharing Statement
The analysis of the current data set in the TCGA (https://portal.gdc.cancer.Gov/) and ICGC (https://icgc.org/).
Ethical Approval
As the data in the TCGA and ICGC database were public, ethical approval is not required according to the guidelines of the Ethics Committee of Liyuan Hospital, Tongji Medical College, Huazhong University of Science and Technology. We thank the TCGA and ICGC Research Networks for the availability for data in this study.
Author Contributions
All authors made a significant contribution to the work reported, whether that is in the conception, study design, execution, acquisition of data, analysis and interpretation, or in all these areas; took part in drafting, revising or critically reviewing the article; gave final approval of the version to be published; have agreed on the journal to which the article has been submitted; and agree to be accountable for all aspects of the work.
Funding
This study was supported by the National Key Research and Development Program of China (2018YFC2002000).
Disclosure
All the authors have declared that no competing interest exists.
References
1. Farazi PA, DePinho RA. Hepatocellular carcinoma pathogenesis: from genes to environment. Nat Rev Cancer. 2006;6(9):674–687. doi:10.1038/nrc1934
2. Ghouri YA, Mian I, Rowe JH. Review of hepatocellular carcinoma: epidemiology, etiology, and carcinogenesis. J Carcinog. 2017;16:1. doi:10.4103/jcar.JCar_9_16
3. Lin S, Hoffmann K, Schemmer P. Treatment of hepatocellular carcinoma: a systematic review. Liver Cancer. 2012;1(3–4):144–158. doi:10.1159/000343828
4. Siegel RL, Miller KD, Jemal A. Cancer Statistics, 2017. CA Cancer J Clin. 2017;67(1):7–30. doi:10.3322/caac.21387
5. Attwa MH, El-Etreby SA. Guide for diagnosis and treatment of hepatocellular carcinoma. World J Hepatol. 2015;7(12):1632–1651. doi:10.4254/wjh.v7.i12.1632
6. Zhan P, Qian Q, Yu LK. Serum VEGF level is associated with the outcome of patients with hepatocellular carcinoma: a meta-analysis. Hepatobiliary Surg Nutr. 2013;2(4):209–215. doi:10.3978/j.issn.2304-3881.2013.06.07
7. Jiang X, Wang J, Deng X, et al. The role of microenvironment in tumor angiogenesis. J Exp Clin Cancer Res. 2020;39(1):204. doi:10.1186/s13046-020-01709-5
8. Johansson-Percival A, He B, Ganss R. Immunomodulation of tumor vessels: it takes two to tango. Trends Immunol. 2018;39(10):801–814. doi:10.1016/j.it.2018.08.001
9. De Palma M, Biziato D, Petrova TV. Microenvironmental regulation of tumour angiogenesis. Nat Rev Cancer. 2017;17(8):457–474. doi:10.1038/nrc.2017.51
10. Morse MA, Sun W, Kim R, et al. The role of angiogenesis in hepatocellular carcinoma. Clin Cancer Res. 2019;25(3):912–920. doi:10.1158/1078-0432.CCR-18-1254
11. Llovet JM, Ricci S, Mazzaferro V, et al. Sorafenib in advanced hepatocellular carcinoma. N Engl J Med. 2008;359(4):378–390. doi:10.1056/NEJMoa0708857
12. Tomczak K, Czerwinska P, Wiznerowicz M. The Cancer Genome Atlas (TCGA): an immeasurable source of knowledge. Contemp Oncol (Pozn). 2015;19(1A):A68–77. doi:10.5114/wo.2014.47136
13. Zhang J, Baran J, Cros A, et al. International cancer genome consortium data portal–a one-stop shop for cancer genomics data. Database (Oxford). 2011;2011:bar026. doi:10.1093/database/bar026
14. Friedmann-Morvinski D, Verma IM. Dedifferentiation and reprogramming: origins of cancer stem cells. EMBO Rep. 2014;15(3):244–253. doi:10.1002/embr.201338254
15. Malta TM, Sokolov A, Gentles AJ, et al. Machine learning identifies stemness features associated with oncogenic dedifferentiation. Cell. 2018;173(2):338–354 e315. doi:10.1016/j.cell.2018.03.034
16. Lee K, Hwang H, Nam KT. Immune response and the tumor microenvironment: how they communicate to regulate gastric cancer. Gut Liver. 2014;8(2):131–139. doi:10.5009/gnl.2014.8.2.131
17. Hsieh CH, Wei CK, Yin WY, et al. Vascular invasion affects survival in early hepatocellular carcinoma. Mol Clin Oncol. 2015;3(1):252–256. doi:10.3892/mco.2014.420
18. Yang SY, Wang CC, Chen KD, et al. Statin use is associated with a lower risk of recurrence after curative resection in BCLC stage 0-A hepatocellular carcinoma. BMC Cancer. 2021;21(1):70. doi:10.1186/s12885-021-07796-7
19. Iguchi T, Shirabe K, Aishima S, et al. New pathologic stratification of microvascular invasion in hepatocellular carcinoma: predicting prognosis after living-donor liver transplantation. Transplantation. 2015;99(6):1236–1242. doi:10.1097/TP.0000000000000489
20. Hanahan D, Weinberg RA. Hallmarks of cancer: the next generation. Cell. 2011;144(5):646–674. doi:10.1016/j.cell.2011.02.013
21. Lanza GM, Caruthers SD, Winter PM, et al. Angiogenesis imaging with vascular-constrained particles: the why and how. Eur J Nucl Med Mol Imaging. 2010;37(Suppl 1):S114–126. doi:10.1007/s00259-010-1502-5
22. Yancopoulos GD, Davis S, Gale NW, Rudge JS, Wiegand SJ, Holash J. Vascular-specific growth factors and blood vessel formation. Nature. 2000;407(6801):242–248. doi:10.1038/35025215
23. Hanahan D, Folkman J. Patterns and emerging mechanisms of the angiogenic switch during tumorigenesis. Cell. 1996;86(3):353–364. doi:10.1016/S0092-8674(00)80108-7
24. Hida K, Maishi N, Annan DA, Hida Y. Contribution of tumor endothelial cells in cancer progression. Int J Mol Sci. 2018;19(5):1272. doi:10.3390/ijms19051272
25. Villa E, Critelli R, Lei B, et al. Neoangiogenesis-related genes are hallmarks of fast-growing hepatocellular carcinomas and worst survival. Results from a prospective study. Gut. 2016;65(5):861–869. doi:10.1136/gutjnl-2014-308483
26. Xie JY, Wei JX, Lv LH, et al. Angiopoietin-2 induces angiogenesis via exosomes in human hepatocellular carcinoma. Cell Commun Signal. 2020;18(1):46. doi:10.1186/s12964-020-00535-8
27. Jin J, Wang SJ, Cui J, et al. Hypo-phosphorylated CD147 promotes migration and invasion of hepatocellular carcinoma cells and predicts a poor prognosis. Cell Oncol (Dordr). 2019;42(4):537–554. doi:10.1007/s13402-019-00444-0
28. Voigt H, Vetter-Kauczok CS, Schrama D, Hofmann UB, Becker JC, Houben R. CD147 impacts angiogenesis and metastasis formation. Cancer Invest. 2009;27(3):329–333. doi:10.1080/07357900802392675
29. Smebye ML, Haugom L, Davidson B, et al. Bilateral ovarian carcinomas differ in the expression of metastasis-related genes. Oncol Lett. 2017;13(1):184–190. doi:10.3892/ol.2016.5384
30. Jin Y, Liang ZY, Zhou WX, Zhou L. Expression, clinicopathologic and prognostic significance of plasminogen activator inhibitor 1 in hepatocellular carcinoma. Cancer Biomark. 2020;27(3):285–293. doi:10.3233/CBM-190560
31. Jin B, Wang W, Du G, et al. Identifying hub genes and dysregulated pathways in hepatocellular carcinoma. Eur Rev Med Pharmacol Sci. 2015;19(4):592–601.
32. Tan L, Chen S, Wei G, et al. Sublethal heat treatment of hepatocellular carcinoma promotes intrahepatic metastasis and stemness in a VEGFR1-dependent manner. Cancer Lett. 2019;460:29–40. doi:10.1016/j.canlet.2019.05.041
33. Fang X, Liu Y, Xiao W, et al. Prognostic SLC family genes promote cell proliferation, migration, and invasion in hepatocellular carcinoma. Acta Biochim Biophys Sin (Shanghai). 2021;53:1065–1075. doi:10.1093/abbs/gmab076
34. Kong F, Jin M, Cao D, Jia Z, Liu Y, Jiang J. Galectin-3 not Galectin-9 as a candidate prognosis marker for hepatocellular carcinoma. PeerJ. 2020;8:e9949. doi:10.7717/peerj.9949
35. Ye QH, Qin LX, Forgues M, et al. Predicting hepatitis B virus-positive metastatic hepatocellular carcinomas using gene expression profiling and supervised machine learning. Nat Med. 2003;9(4):416–423. doi:10.1038/nm843
36. Chen HL, OuYang HY, Le Y, et al. Aberrant MCT4 and GLUT1 expression is correlated with early recurrence and poor prognosis of hepatocellular carcinoma after hepatectomy. Cancer Med. 2018;7(11):5339–5350. doi:10.1002/cam4.1521
37. Justus CR, Sanderlin EJ, Yang LV. Molecular connections between cancer cell metabolism and the tumor microenvironment. Int J Mol Sci. 2015;16(5):11055–11086. doi:10.3390/ijms160511055
38. Gentles AJ, Newman AM, Liu CL, et al. The prognostic landscape of genes and infiltrating immune cells across human cancers. Nat Med. 2015;21(8):938–945. doi:10.1038/nm.3909
39. Kümpers C, Jokic M, Haase O, et al. Immune cell infiltration of the primary tumor, not PD-L1 status, is associated with improved response to checkpoint inhibition in metastatic melanoma. Front Med. 2019;6:6. doi:10.3389/fmed.2019.00006
40. Tang T, Huang X, Zhang G, Hong Z, Bai X, Liang T. Advantages of targeting the tumor immune microenvironment over blocking immune checkpoint in cancer immunotherapy. Signal Transduct Target Ther. 2021;6(1):72. doi:10.1038/s41392-020-00449-4
41. Hu S, Li B, Shen X, et al. Induction of antigen-specific cytotoxic T-cell response by dendritic cells generated from ecto-mesenchymal stem cells infected with an adenovirus containing the MAGE-D4a gene. Oncol Lett. 2016;11(4):2886–2892. doi:10.3892/ol.2016.4306
42. Liu ZL, Liu X, Peng H, et al. Anti-PD-1 Immunotherapy and Radiotherapy for Stage IV Intrahepatic Cholangiocarcinoma: A Case Report. Front Med (Lausanne). 2020;7:368. doi:10.3389/fmed.2020.00368
43. Behary J, Amorim N, Jiang XT, et al. Gut microbiota impact on the peripheral immune response in non-alcoholic fatty liver disease related hepatocellular carcinoma. Nat Commun. 2021;12(1):187. doi:10.1038/s41467-020-20422-7
44. Liu G, Wang C, He Y. Application effect of apatinib in patients with failure of standard treatment for advanced malignant tumours. BMC Pharmacol Toxicol. 2019;20(1):61. doi:10.1186/s40360-019-0362-2
 © 2022 The Author(s). This work is published and licensed by Dove Medical Press Limited. The full terms of this license are available at https://www.dovepress.com/terms.php and incorporate the Creative Commons Attribution - Non Commercial (unported, v3.0) License.
By accessing the work you hereby accept the Terms. Non-commercial uses of the work are permitted without any further permission from Dove Medical Press Limited, provided the work is properly attributed. For permission for commercial use of this work, please see paragraphs 4.2 and 5 of our Terms.
© 2022 The Author(s). This work is published and licensed by Dove Medical Press Limited. The full terms of this license are available at https://www.dovepress.com/terms.php and incorporate the Creative Commons Attribution - Non Commercial (unported, v3.0) License.
By accessing the work you hereby accept the Terms. Non-commercial uses of the work are permitted without any further permission from Dove Medical Press Limited, provided the work is properly attributed. For permission for commercial use of this work, please see paragraphs 4.2 and 5 of our Terms.