")
Back to Journals » International Journal of Women's Health » Volume 14
A Nomogram Based on SEER Database for Predicting Prognosis in Patients with Mucinous Ovarian Cancer: A Real-World Study
Authors Zhang K, Feng S, Ge Y, Ding B, Shen Y
Received 11 May 2022
Accepted for publication 19 July 2022
Published 26 July 2022 Volume 2022:14 Pages 931—943
DOI https://doi.org/10.2147/IJWH.S372328
Checked for plagiarism Yes
Review by Single anonymous peer review
Peer reviewer comments 2
Editor who approved publication: Professor Elie Al-Chaer
Ke Zhang,* Songwei Feng,* Yu Ge, Bo Ding, Yang Shen
Department of Obstetrics and Gynaecology, Zhongda Hospital, School of Medicine, Southeast University, Nanjing, People’s Republic of China
*These authors contributed equally to this work
Correspondence: Yang Shen, Department of Obstetrics and Gynaecology, Zhongda Hospital, School of Medicine, Southeast University, Nanjing, People’s Republic of China, Email [email protected]
Purpose: Mucinous ovarian cancer (MOC) is a rare histological type of EOC. In order to guide the clinical diagnosis and management of MOC patients, we constructed and verified a nomogram for the estimation of overall survival in patients with MOC.
Patients and Methods: We collected 494 patients with MOC diagnosed from 2010 to 2015 in SEER database, and the following main inclusion criteria were used: (1) patients whose MOC was confirmed by pathology; (2) patients without a history of primary other cancer. Subsequently, we performed randomized grouping (6:4) and Cox hazard regression analysis in the training group. Subsequently, the nomogram was established. A variety of indicators were used to validate the prognosis value of nomogram, including the C-index, area under the receiver operating characteristic curve, calibration curve, and decision curve analysis (DCA). Moreover, Kaplan–Meier analysis was used to compare the survival results among different risk subgroups.
Results: Cox hazard regression analysis revealed that age, grade, FIGO stage and log odds of positive lymph nodes stage were independent risk factors for patients with MOC. In the training group, the C-index of the nomogram was 0.827 (95% CI: 0.791– 0.863) and the areas under the curve (AUC) predicting the 1-, 3- and 5-year survival rate were 0.853 (95% CI: 0.791– 0.915), 0.886 (95% CI: 0.852– 0.920) and 0.815 (95% CI: 0.766– 0.864), respectively. The calibration curve revealed that the nomogram of the 1-, 3- and 5-year survival rate was consistent with the actual fact. Patients with high risk had a poorer prognosis than those with low risk (P < 0.001). DCA revealed that the nomogram had the best clinical value than other classical prognostic markers. Similarly, nomogram had excellent prognostic ability in the testing group.
Conclusion: The nomogram was constructed to predict overall survival in patients with MOC, which had the significance for clinical evaluation.
Keywords: mucinous ovarian cancer, SEER database, nomogram, prognosis, log odds of positive lymph nodes (LODDS) stage
Introduction
The incidence of ovarian cancer ranks second in gynecological malignant tumors; however, the fatality rate of ovarian cancer is the highest, which is extremely detrimental to women’s health.1 The most prevalent histological type of ovarian cancer is epithelial ovarian cancer (EOC), classified as serous, mucinous, endometrioid, clear cell, transitional cell, and serous mucinous tumor. However, they are significantly different in epidemiology, genetic heterogeneity, pathological molecular and treatment response.2,3
Mucinous ovarian cancer (MOC) is a rare histological type of EOC, with a prevalence rate of about 3%.4 Due to the low incidence, there has been no clinical trial specifically for MOC up to the present. Unfortunately, for patients with advanced MOC, the prognosis is seriously poor, which may be due to their poor response to platinum chemotherapy.5,6 Surgery is the primary treatment of patients with MOC at present, especially for the patients with early stage.7 Previous research reported that smoking might be one of the risk factors associated with MOC,5 but the exact cause of MOC is still not clear. Some risk stratification systems have been developed to indicate the prognosis of MOC patients, such as Silverberg, FIGO schemes, and a growth-based grading. In addition, log odds of positive lymph nodes (LODDS) is a new concept about lymph nodes, which is defined as log (positive lymph nodes + 0.5)/(examined lymph nodes – positive lymph nodes + 0.5). In recent studies, LODDS performs excellently in the prediction of most cancers, such as breast cancer,8 cervical cancer9 and colorectal cancer.10 However, the value of LODDS in the survival prognosis of MOC patients has not been reported. Real-world study (RWS) is an important model in clinical research. RWS can be used for diagnosis, prognosis, etiology and other aspects of the clinical researches which covers a wide range.11 RWS can be used to evaluate the effectiveness and safety of clinical studies by analyzing patients’ information collected in the real world.12 For RWS, Chen et al found that for patients with early-stage MOC, lymphadenectomy had no significant prognostic benefit.13 For patients with advanced stage EOC, however, Tatsuyuki Chiyoda et al revealed that the lymphadenectomy was associated with improved OS for patients with advanced stage EOC.14 This indicated that more studies are needed to explore the effect of lymphadenectomy on the prognosis of patients with MOC, especially advanced-stage patients.
The Surveillance, Epidemiology, and End Results (SEER) database, including tremendous clinical information of America, is one of the most extensive publicly available cancer data from the real world, which is open to global researchers for free. In our study, we extracted clinical data from the SEER database to assess the independent prognostic factors for MOC patients and construct a nomogram, which can provide a basis for clinical decision-making of MOC patients.
Materials and Methods
Data Source
Our team has been allowed to access the SEER database and obtain patient clinical information for this research (username: 19,786-Nov 2020). In this study, the data was downloaded by SEER*Stat 8.3.9.2 software (https://seer.cancer.gov/). The ID, survival time, vital status recode, age of diagnosis, race recode, marital status at diagnosis, laterality, grade, AJCC (Asia Joint Conference on Computing) stage group, T stage, N stage, M stage, surgery, chemotherapy recode, regional nodes examined, regional nodes positive, and CA125 were downloaded. We defined overall survival (OS) that we concentrated on as the time from diagnosis to death or the last follow-up. Moreover, the surgical procedures are divided into fertility-sparing surgery (FSS), radical surgery (RS) and other operations. In our study, FSS included unilateral adnexectomy (preservation of uterus and contralateral ovary) and bilateral adnexectomy (preservation of uterus). RS is defined as complete hysterectomy and bilateral appendages. Codes of FSS in SEER database are 17, 27, 36, 51 and 56. Meanwhile, codes of RS in SEER database are 25, 26, 28, 35, 37, 50, 52, 55, 57, 70, 71, 72, 73 and 74.
Inclusion and Exclusion Criteria
The following criteria were used to choose participants for this study: (1) patients were diagnosed as ovarian cancer during from 2010 to 2015; (2) patients whose mucinous ovarian cancer was confirmed by pathology and were defined using the Site recode ICD-O-3/WHO 2008 (International Classification of Diseases for Oncology, 3rd edition); (3) patients’ morphological codes were C56.9 (ovary); (4) patients’ morphological codes were as follows: 8470/3, 8471/3, 8472/3, 8480/3, 8481/3, 8482/3 and 8490/3; (5) patients without history of primary other cancer. The following criteria were used to exclude participants from this study: (1) unknown race (n = 9); (2) unknown marital status (n = 84); (3) unknown grade (n = 486); (4) unknown TNM stage or cannot be converted to FIGO stage (2014) (n = 16); (5) unknown surgery (n = 27); (6) unknown regional nodes examined (n = 430); (7) unknown CA125 (n = 213); (8) unknown survival time (n = 9); (9) patients with bilateral ovarian tumor (n = 41). The flowchart is shown in Figure 1.
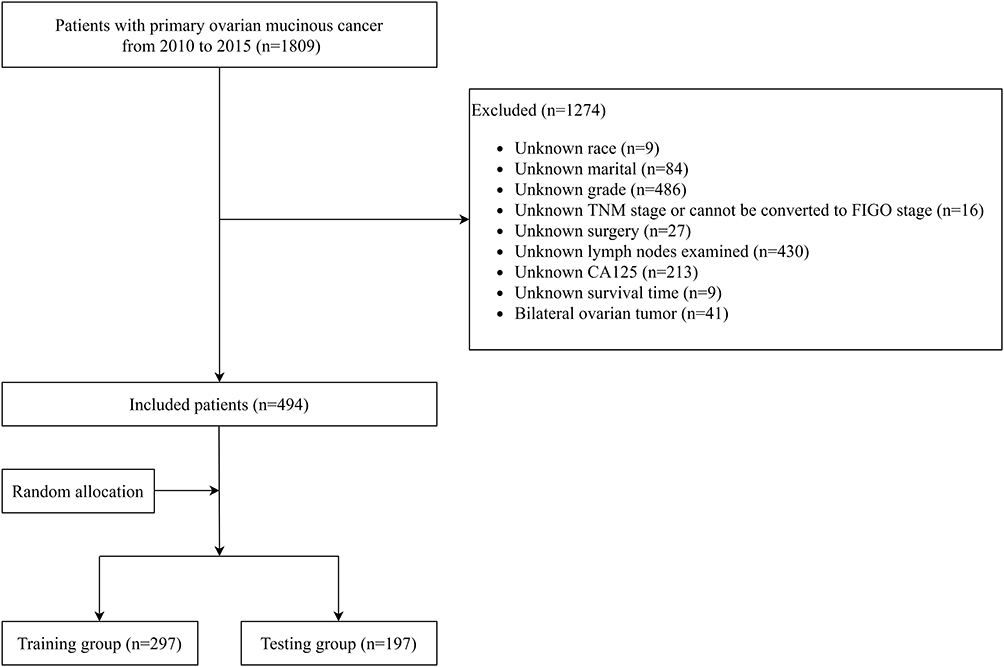 |
Figure 1 Flowchart for screening patients. |
LODDS Staging Systems
Through the formula (LODDS = log (positive lymph nodes + 0.5)/(examined lymph nodes – positive lymph nodes + 0.5)), we determined the LODDS value of each patient. To establish the cut-off value of LODDS, the software X-tile (version 3.6.1; https://medicine.yale.edu/lab/rimm/research/software/) was utilized. Patients with MOC were then separated into three groups based on the best LODDS cut-off value. (LODDS1: LODDS value ≤ −2.30; LODDS2: −2.30 < LODDS value ≤ −1.60; LODDS3: −1.60 < LODDS value).
Statistical Analysis
The chi-square test was used to examine categorical data. To evaluate the risk variables of patients, COX Hazard Regression Analysis was utilized for univariate and multivariate analysis. The stepwise regression method was used in multivariate analysis: forward modeling. The nomogram was established through the findings of the Cox hazard regression analysis. The Kaplan–Meier survival curve was used to compare the survival of different groups, and the log-rank approach was used to analyze the survival of different groups. The correctness of the model was determined by using the concordance index (C-index), calibration curve, receiver operating characteristic curve (ROC curve), and decision curve analysis (DCA). The “regplot”, “survminer”, “timeROC”, “ggDCA” R library were used to construct the nomogram and calculate calibration curve, ROC curve and DCA. Our statistical analyses were executed using software, including the SPSS (version 24.0; IBM Corporation, St. Louis, Missouri, USA) and R software (version.3.6.2; The R Project for Statistical Computing, TX, USA; http://www.r-project.org). P<0.05 indicated that the difference was statistically significant, and the confidence interval was 95%.
Results
Baseline Characteristics of Patients
Four hundred and ninety-four patients were included in this research, and they were randomly assigned to a training or testing group in a 6:4 ratio. The training group consisted of 297 patients, whereas the testing group consisted of 197 individuals. The majority of patients were between the ages of 15 and 65 (85.8%). A great number of patients were white (81.6%) and married (47.6%). Most patients’ ovarian tumors were right side (53.4%), grade II (46.0%), FIGO stage I (84.8%). RS was used to operate on the vast majority of patients (62.3%). Meanwhile, only a few patients actually received chemotherapy (45.1%). For LODDS stage, approximately two-thirds of patients were classified as LODDS 1 (59.5%). More than half of the patients were positive for CA125 (65.2%). Meanwhile, no significant differences were observed in age, race, marital, laterality, grade, FIGO stage, surgery, chemotherapy recode, LODDS stage, CA125 between the training and testing groups (P>0.05, Table 1).
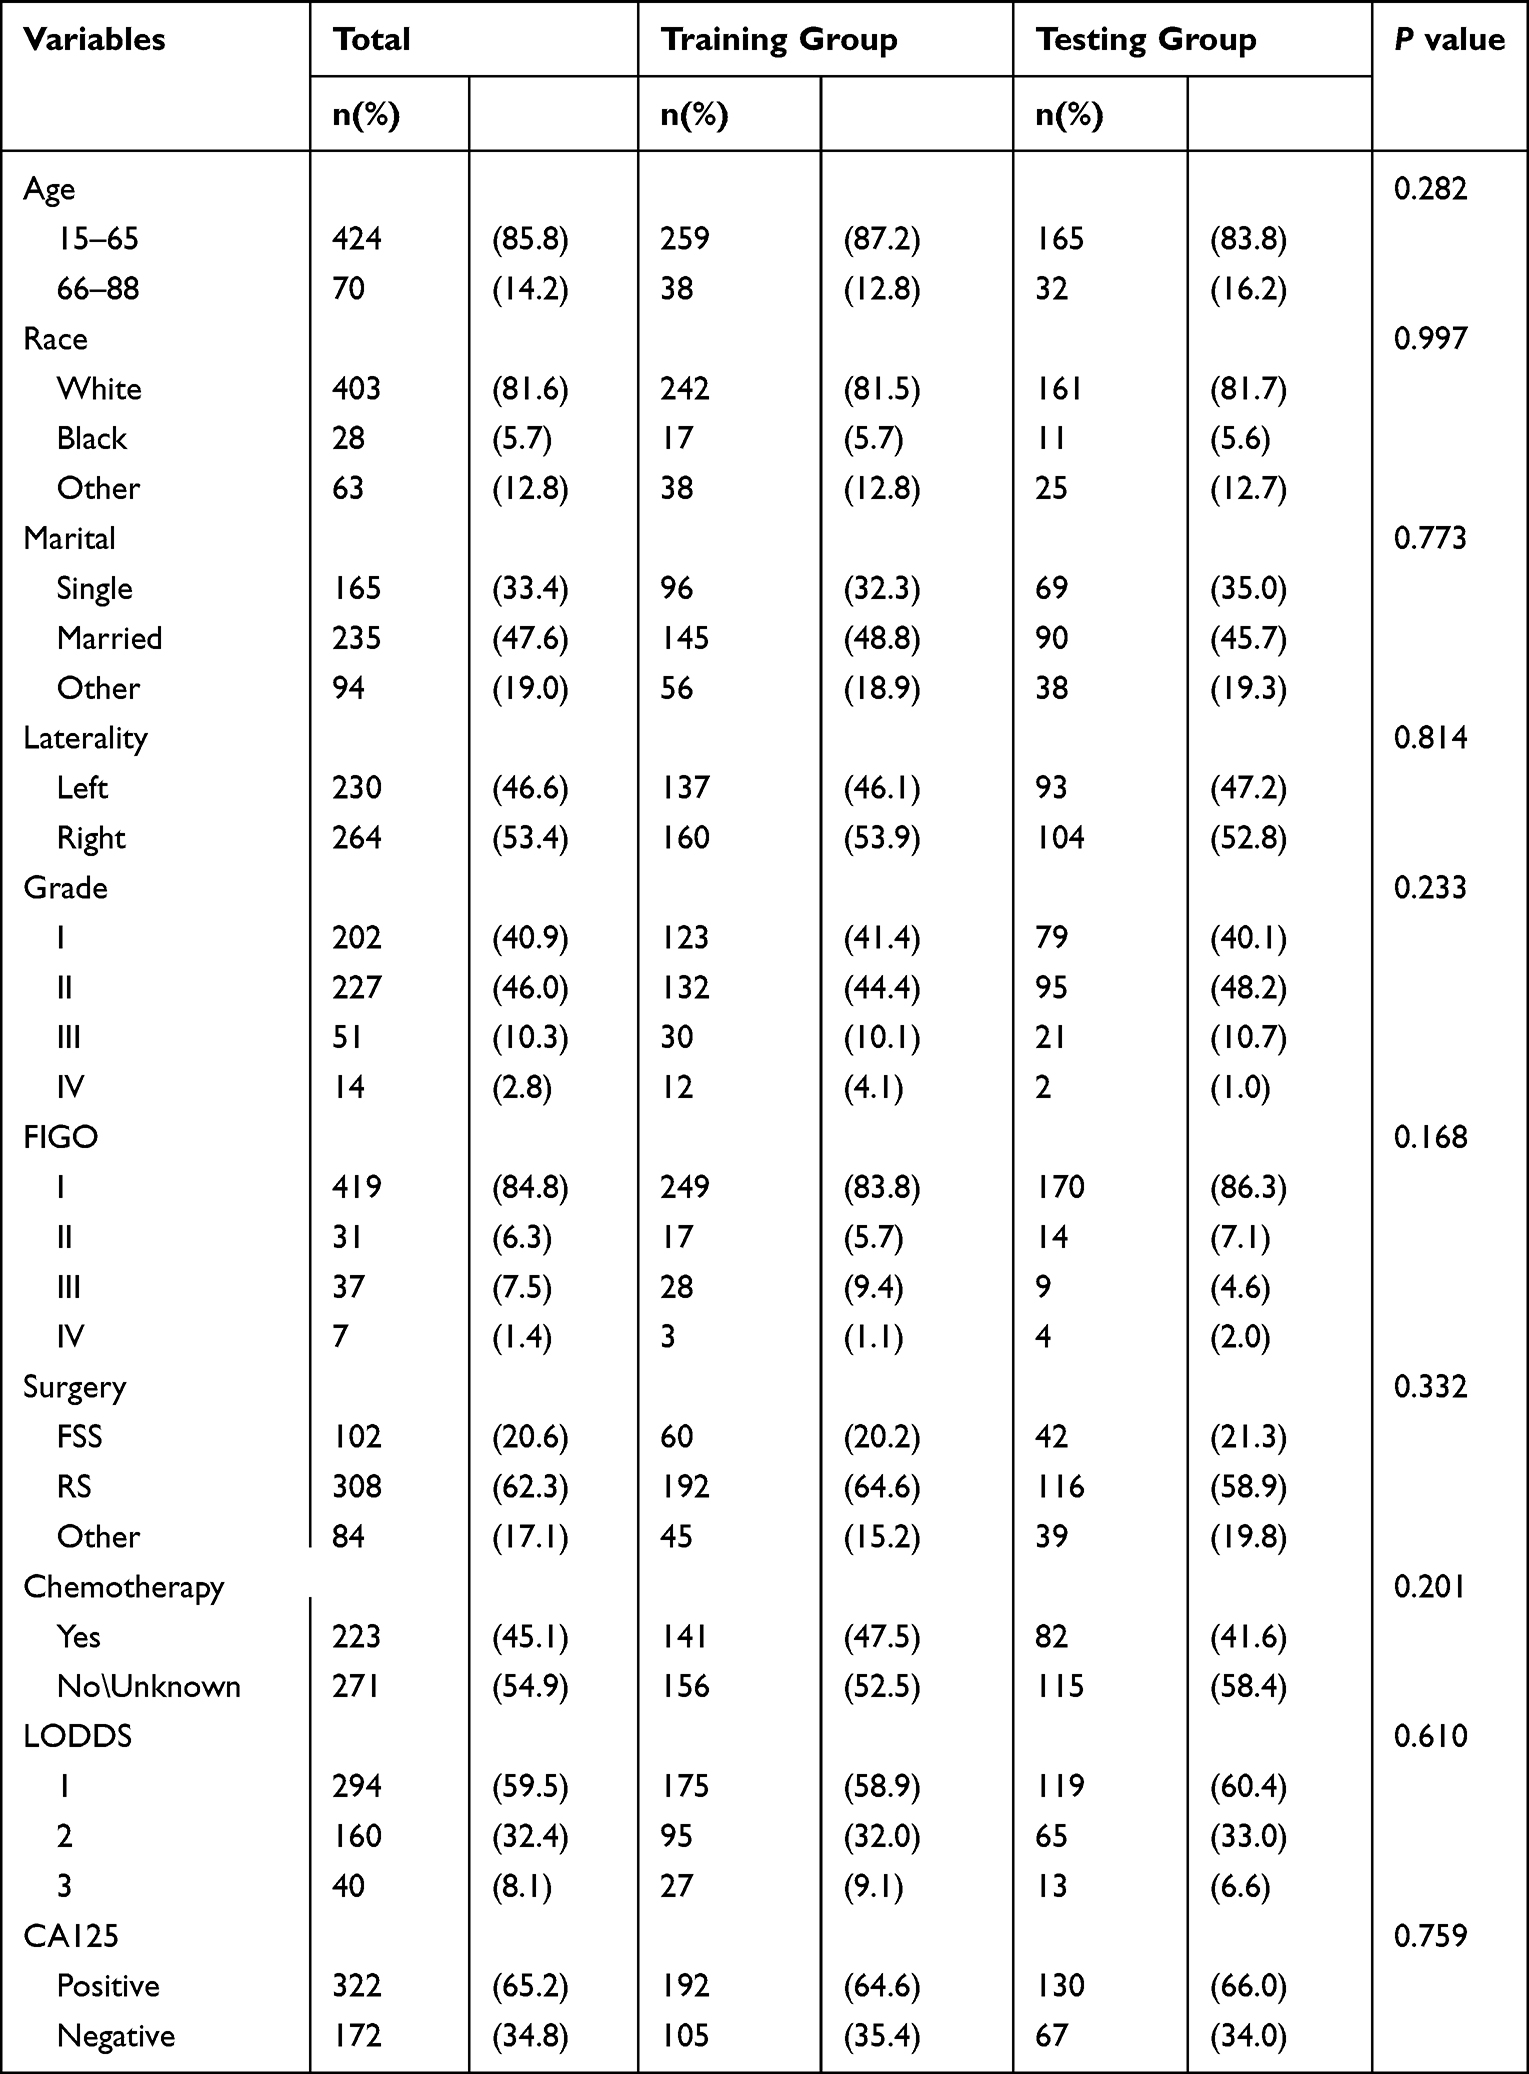 |
Table 1 Demographics and Clinicopathologic Characteristics of the Training and the Testing Groups in Patients of Mucinous Ovarian Cancer |
Survival Analysis
First of all, we performed the univariate Cox hazard regression analysis on the training group, and results from the forest plot (Figure 2) revealed that age, race, grade, FIGO stage, surgery and LODDS stage were risk factors (P<0.05). Then, we further incorporated the above six meaningful factors into multivariate Cox hazard regression analysis by stepwise regression. The results displayed on the forest plot (Figure 2) revealed that age, grade, FIGO stage and LODDS stage were independent risk factors (P<0.05). In addition, we used Kaplan–Meier analysis to assess the effect of 6 factors that were significant in the univariate Cox hazard regression analysis. We found that younger patients had a greater chance of surviving than older individuals (15–65 vs 66–88 years; P=0.0031) (Figure 3A). Among all race groups, the black group fared the worst in terms of survival (white vs black vs other; P = 0.036) (Figure 3B). Among all histological grades, patients with Grade I (well differentiated) experienced the best survival (Grade I vs Grade II vs Grade III vs Grade IV; P = 0.013) (Figure 3C). Similarly, for the FIGO stage, patients with FIGO I had the longest survival time (FIGO I vs FIGO II vs FIGO III vs FIGO IV; P < 0.001) (Figure 3D). For treatment-related characteristics, different treatment choices resulted in varying patient outcomes. Those who had FFS surgery may have experienced more favorable survival than RS and other types of surgery (FFS vs RS vs other; P = 0.098) (Figure 3E). However, the difference was not statistically significant. Patients in LODDS 1 group showed the most significantly superior survival among all LODDS groups (LODDS 1 vs LODDS 2 vs LODDS 3; P < 0.001) (Figure 3F). The results of Kaplan–Meier analysis for the 8 factors in the testing group were shown in Supplement 1.
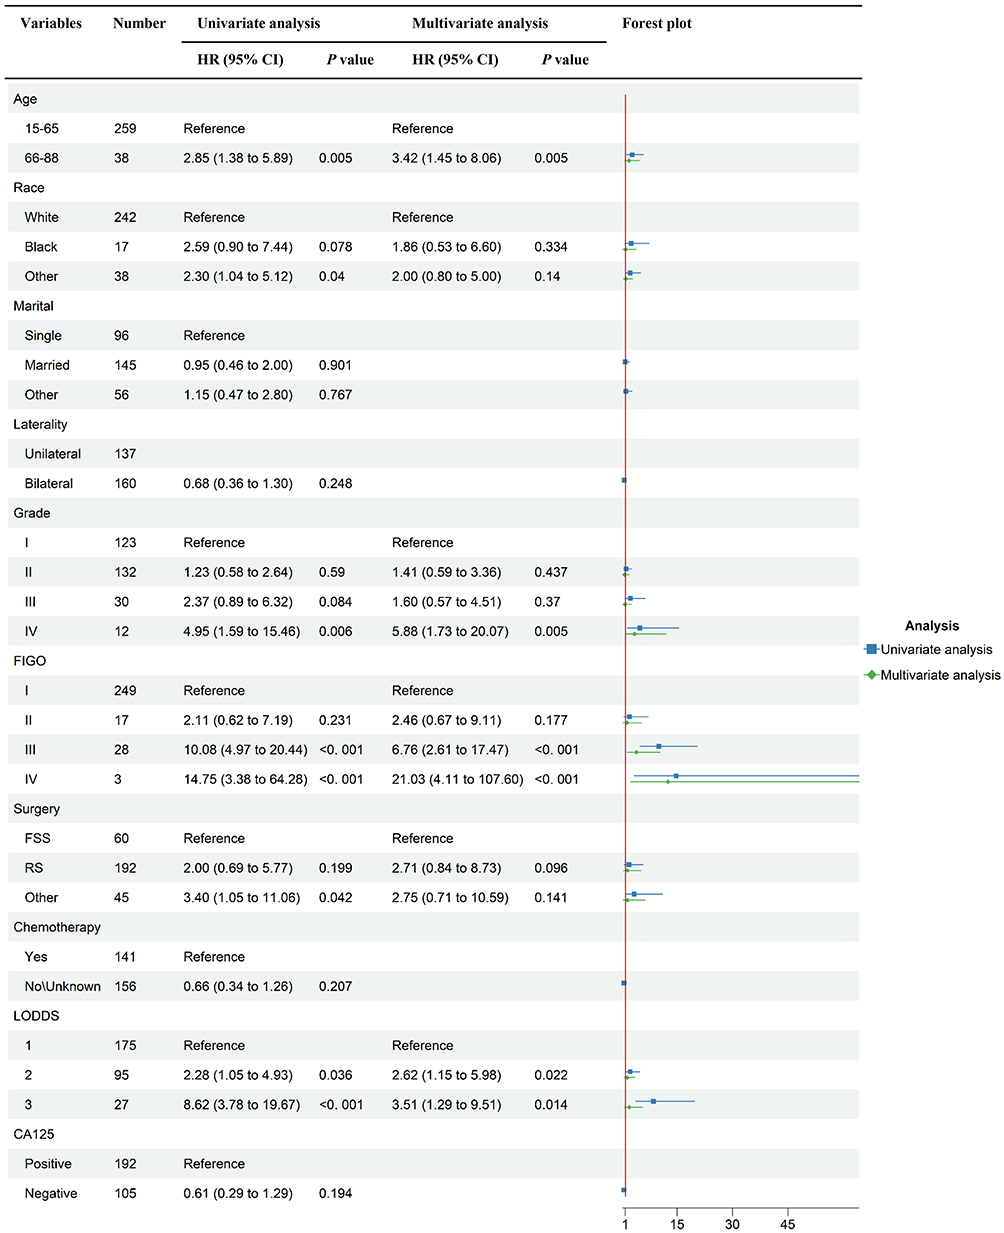 |
Figure 2 Forest plot of univariate and multivariate analysis of overall survival in the training group. |
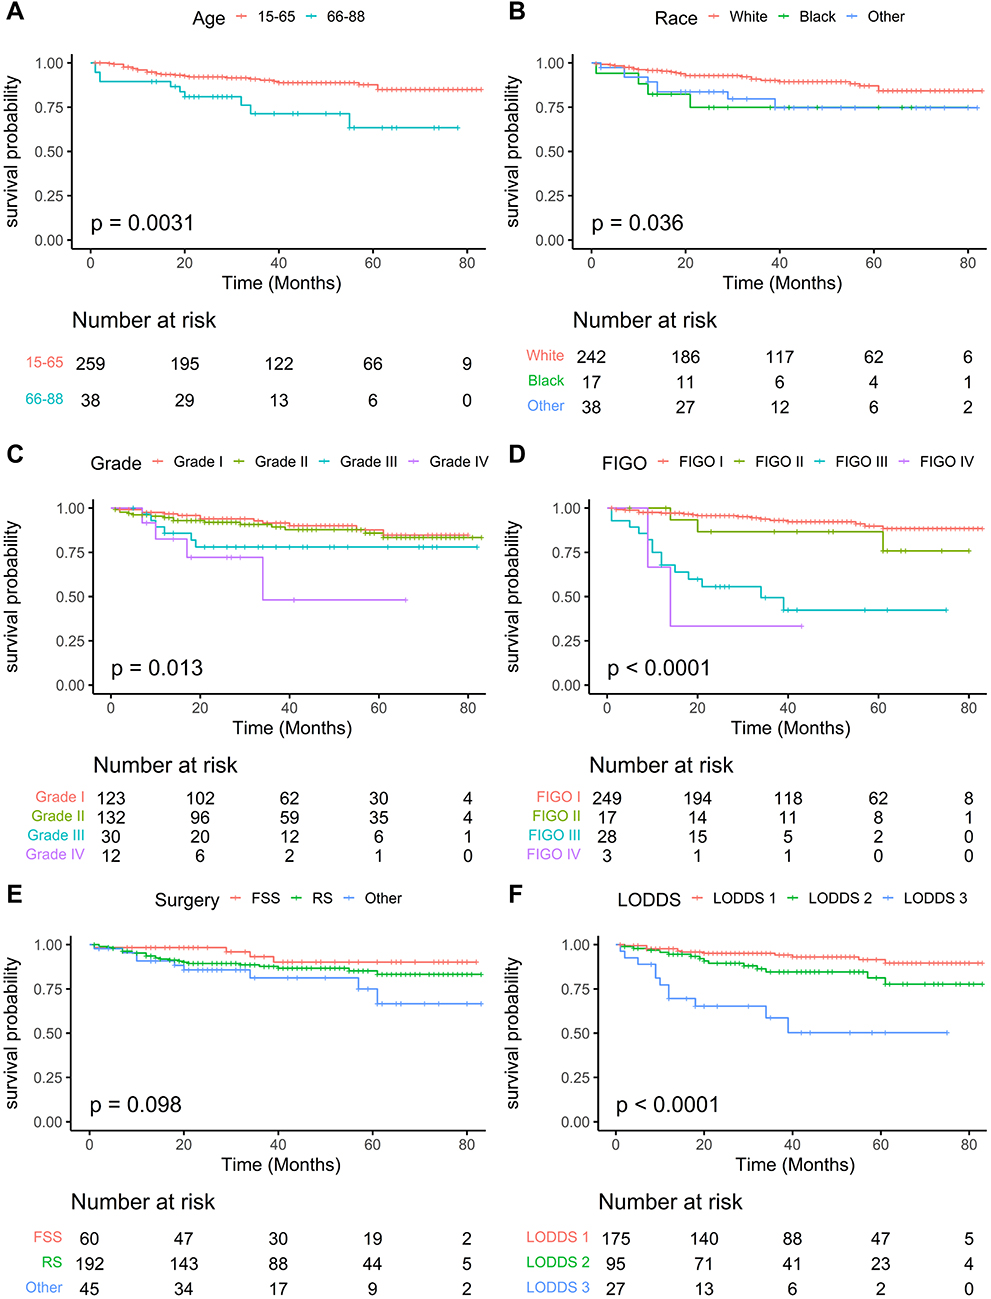 |
Figure 3 Kaplan-Meier survival curves in the training group. (A), Age; (B), Race; (C), Grade; (D), FIGO; (E), Chemotherapy; (F), LODDS. |
Construction of the Nomogram
The complicated Cox regression formula was transformed into a visual graph by the nomogram. Graduated line segments in the nomogram were used to draw each variable in a certain proportion on the same plane so as to express the contribution of each variable in the prediction model to the resulting events.14 The nomogram was established by using the aforementioned independent risk variables of the multivariate Cox hazard regression analysis, such as age, grade, FIGO stage and LODDS stage (Figure 4A). Meanwhile, the 1-, 3-, and 5-year survival rates of patients with MOC were obtained explicitly from the nomogram. The nomogram revealed that scores increased with age and that the people whose races were black scored the highest of all races. As for histological grade, patients with Grade IV (undifferentiated) obtained the top score. Similarly, patients with FIGO IV were assigned higher marks. At the same time, patients in LODDS 1 group were concerned to have the lowest scores. Additionally, the nomogram indicated that FIGO stage was the most significant predictor of OS for patients with MOC. Each patient with MOC was able to get scores by using the nomogram, and the total of the scores could be used to calculate the patient’s predicted survival rate. For example, a 60-year-old female with Grade I, FIGO II and LODDS 2. The total score of the patient was 64, which predicted that her 1-year survival rate was 90~94%, 3-year survival rate was 70~85% and 5-year survival rate was 60~80%.
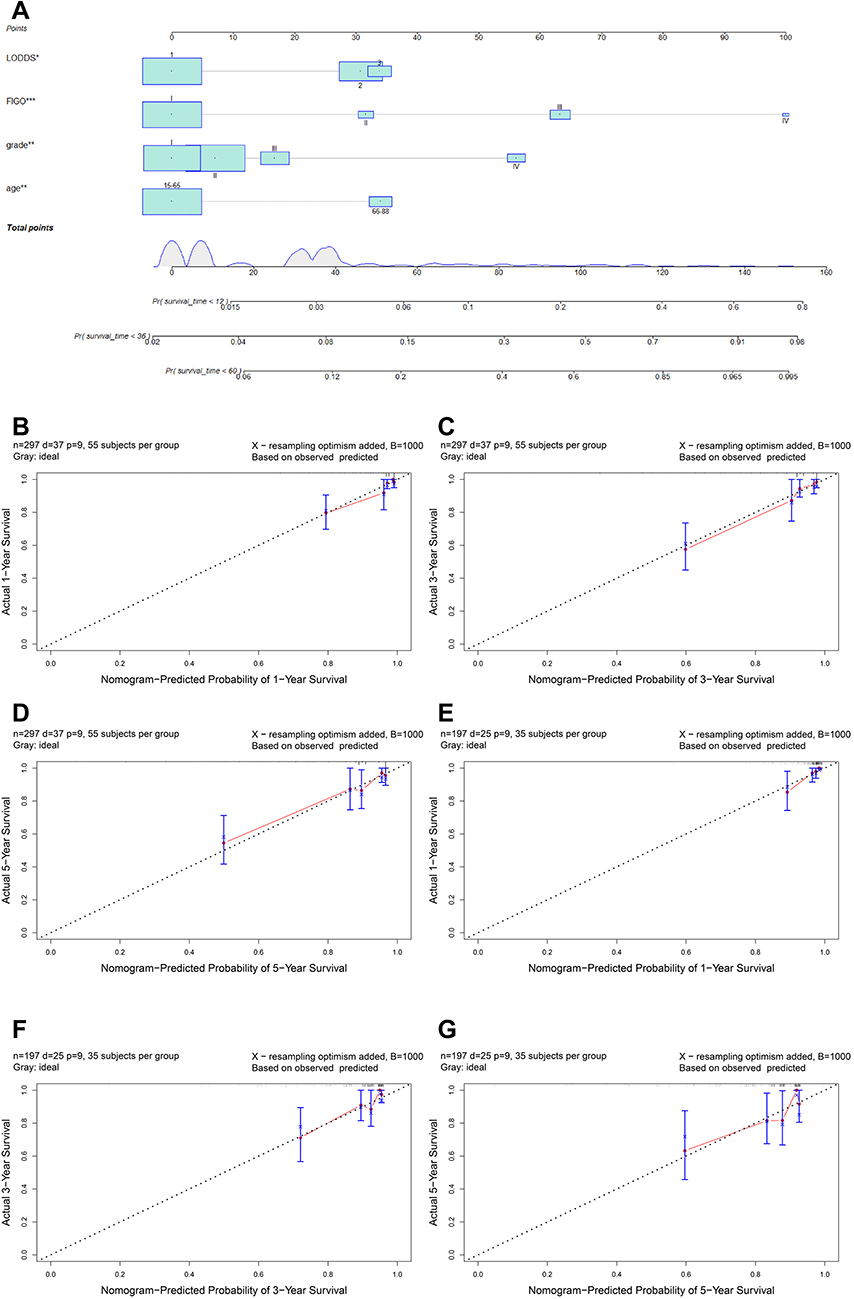 |
Figure 4 The nomogram for predicting 1-, 3-, and 5-year OS in mucinous ovarian cancer. (A) Nomogram. Calibration curves in the training (B-D) and the testing groups (E-G). |
Validation of the Nomogram
The calibration curve was applied to assess the calibration of the nomogram, and the repeated sampling was carried out by Bootstrap (B = 1000). In training and testing groups, calibration curves were used to correct and test the 1-, 3-, and 5-year survival probability. The results indicated that the nomogram was extremely consistent with the training group’s real observation results and the testing group’s actual observation results (Figure 4B-G). The C-index was in the range of 0 to 1, and the closer the value is to 1, the better the patient differentiation of the nomogram. The C-index of the OS nomogram was 0.827 (95% CI: 0.791–0.863) in the training group and 0.743 (95% CI: 0.686–0.800) in the testing group. The AUC spans from 0.5 to 1.0, and the closer the value was to 1, the greater the patient differentiation of the nomogram. In the training group, the AUC for predicting the 1-, 3- and 5-year overall survival rates were 0.853 (95% CI: 0.791–0.915), 0.886 (95% CI: 0.852–0.920) and 0.815 (95% CI: 0.766–0.864), respectively. Meanwhile, the AUC for predicting 1-, 3- and 5-year overall survival rates were 0.863 (95% CI: 0.787–0.939), 0.759 (95% CI: 0.694–0.824) and 0.690 (95% CI: 0.615–0.765) in the verification group, respectively. The results above indicated that the accuracy of the nomogram we established was relatively high. Through the nomogram, our team determined the risk score for each patient. Then, patients were classified as high-risk or low-risk based on the median risk score (2.792). The Kaplan–Meier analysis, as depicted in Figure 5, indicated that the prognosis of the high-risk group was poorer than that of the low-risk group (P<0.05).
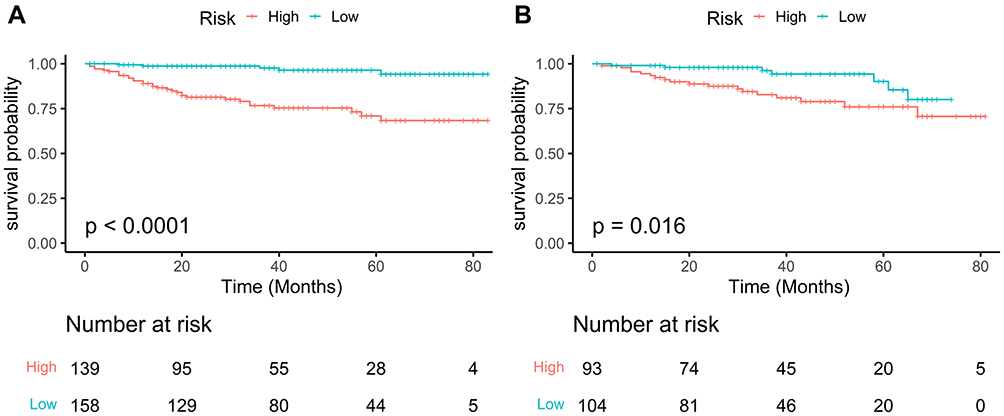 |
Figure 5 Kaplan-Meier survival curves of overall survival. (A) Training group (B) Testing group. |
Comparison of Survival Prediction Ability
We regarded the nomogram as model 1. At the same time, we used age, grade and FIGO stage to establish the prediction model separately which were marked as model 2, model 3 and model 4. As shown in Table 2, we found the differences among the 4 models. The C-index of model 2, model 3, and model 4 in the training group were 0.578 (95% CI: 0.540–0.616), 0.614 (95% CI: 0.567–0.661) and 0.719 (95% CI: 0.676–0.762), from which we observed that model 1 had the highest C-index 0.827 (95% CI: 0.791–0.863). Similarly, we also discovered that model 1 had the best C-index in the testing group. The C-index of the model 2, model 3 and model 4 in the verification group were 0.521 (95% CI: 0.480–0.562), 0.622 (95% CI: 0.565–0.679) and 0.636 (95% CI: 0.580–0.692). As for the time-dependent area under the ROC in MOC patients, as shown in the Figure 6A and B, model 1 consistently had the highest values at 1-, 2-, 3-, 4-, and 5-year follow-ups than the other three models in the survival analysis, both in the training groups and the testing groups, indicating that model 1 was the best model for predicting the prognosis of patients with MOC, which was consistent with the result of C-index. Finally, we constructed the decision curves of the four models. The prediction of 1-, 3- and 5-year prognosis of patients in model 1 was the most reliable both in the training groups and the testing groups (Figure 6C and D).
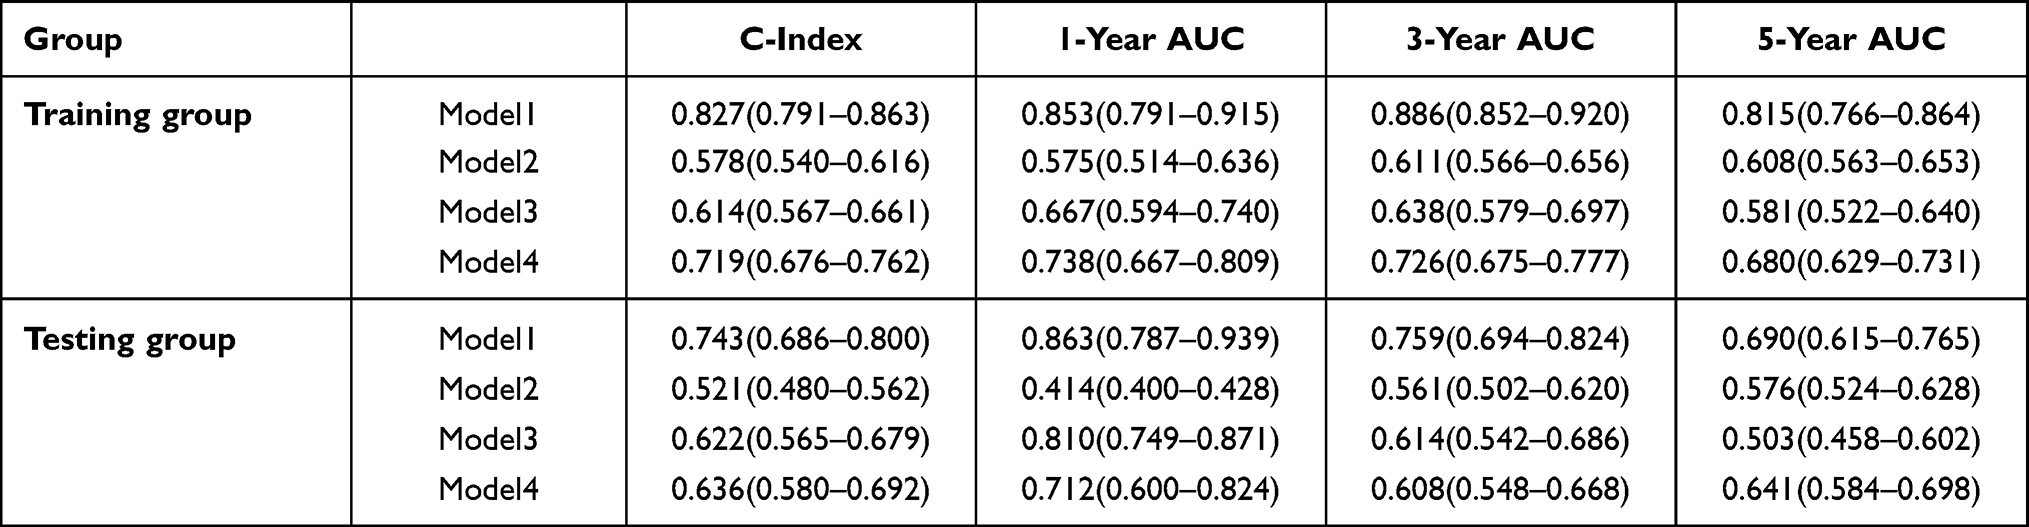 |
Table 2 C-Index and ROC Curves in the Training Groups and in the Testing Groups for 1-, 3-, and 5-Year Overall Survival of Model 1, Model 2, Model 3, Model 4. ROC, Receiver Operating Characteristic; Model 1: the Nomogram, Model 2: Age, Model 3: Grade, Model 4: FIGO Stage |
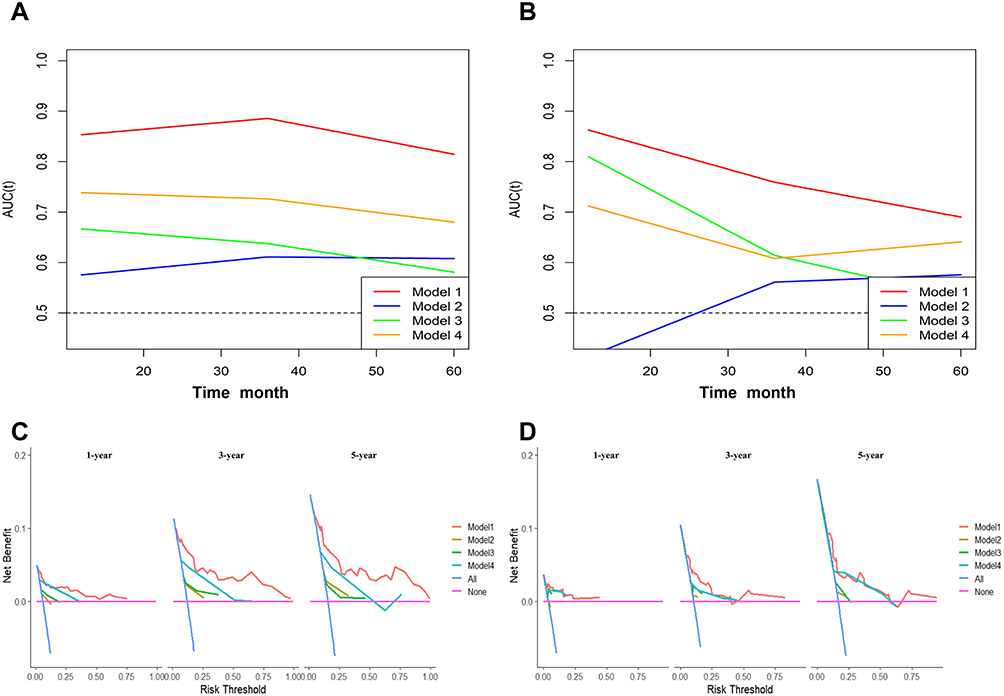 |
Figure 6 Time-dependent area under the receiver operating characteristic curve (AUC) in patients with mucinous ovarian cancer for four models. (A) Training group. (B) Testing group. DCA for 1-, 3-, and 5-year overall survival of four models in the training group (C) and in the testing group (D). DCA, decision curve analysis; Model 1: the nomogram, Model 2: age, Model 3: grade, Model 4: FIGO stage. |
Taken together, model 1 was the best clinical diagnostic model, which revealed that the patients in model 1 benefited from treatment more than other patients under the same circumstances.
Discussion
MOC is a subtype of EOC that is distinguished by its special clinical, pathological, genetic, and biological features from other diseases. In this study, we detailed the clinical features of MOC patients and summarized the factors related to survival. Our team finally determined that age, race, grade, FIGO stage, and LODDS were independent predictors. In the nomogram, the C-index was 0.827 (95% CI: 0.791–0.863) and 0.743 (95% CI: 0.686–0.800) in the training group and the testing group, respectively. Our prediction model had important significant guidance for the clinical diagnosis and management of MOC patients.
Recently, with the development of science and technology, more and more techniques have been used to predict the prognosis of patients with tumors. Recent research has revealed that computed tomography-based radiogenomic biomarkers,15 long non-coding RNAs (lncRNAs)16 and single-sample gene set enrichment analysis algorithm17 have been used to predict overall survival in tumors. Nomogram, as a classic model, is a commonly used model for predicting prognosis, especially in oncology.18 So far, several studies have established nomograms for prognosis of patients with ovarian cancer. In 2020, Hu et al incorporated 193 Chinese patients with EOC to forecast survival and constructed a nomogram including FIGO stage, histological grade, histological type, lymph node metastasis status and serum CA125 level at diagnosis.19 In 2021, Wang et al reviewed 9001 American patients with EOC and constructed a nomogram to predict the 3-and 5-year survival rates of EOC patients based on age, race, grade, AJCC stage, lymph nodes status, primary site surgery and radiotherapy.20 The nomograms constructed in their research can evaluate the prognosis of patients with EOC, which had great significance for the individualized treatment of EOC.19,20 Only one nomogram had been established for predicting the survival of patients with MOC because of the low incidence. Yang et al constructed the nomogram with age, race, T stage, N stage, M stage, grade, CA125, and chemotherapy, which provided 3-year and 5-year OS predictions for patients with MOC.21 However, there was little regret that the influence of lymph nodes on the prognosis of patients with MOC had been ignored. Our research recognized that lymph node status had significance for patients’ prognosis.
Surgery is the main treatment for MOC at present, and most patients have a good prognosis after surgery, especially patients with early stage.7
Heyward et al found that lymph node positive accounted for less than 3% of the 3069 early MOC patients who underwent lymphadenectomy.22 However, the study by Hoogendam et al suggested that any enlarged lymph nodes should be sampled and tested in patients with MOC.23 At present, it is still controversial whether lymph node resection is beneficial to the survival of patients with MOC. However, it is undeniable that lymph node resection and lymph node biopsies are still essential components of surgical treatment for patients with ovarian cancer. Patients with early MOC had a significantly reduced risk of lymph node metastases than those with advanced MOC, which may be related to the pathological nature of MOC. LODDS is a quantitative measure that not only reflects the amount of positive lymph nodes but also reveals the amount of lymph nodes in total, which has been paid more and more attention in recent years as an indicator of lymph node staging. Previous research8–10 had demonstrated that LODDS were extremely effective at predicting prognoses of patients with cancer. Xu et al applied LODDS to construct a nomogram of patients with ovarian cancer, which indicated that the nomogram with LODDS had a better survival prediction function.24 In our study, patients in LODDS 1 group showed the most significantly superior survival among all LODDS groups.
Previous studies had shown that age was a vital factor affecting the prognosis of ovarian cancer.25,26 Similarly, we also found that the old had a worse prognosis, indicating that age was one of the most critical clinical information affecting MOC patients’ survival. The condition may be related to weakened immunity in older people.27 Meanwhile, Hu et al, Wang et al and Yang et al indicated that histological grade was indispensable for the survival prognosis of ovarian cancer patients.19–21 In Cox hazard regression analyses of MOC patients, the histological grade was revealed to be a statistically significant predictor. In addition, 5-year survival rates for FIGO I and FIGO III/FIGO IV patients with ovarian cancer were 92.1% and 25%, which had a significant difference.28 This was consistent with the findings of our research that patients with FIGO IV had a worse survival prognosis than those with other FIGO stages. Rade et al revealed that CA125 was less sensitive in the early detection of OC.29 Hu et al conducted the Kaplan–Meier univariate survival analysis on 195 patients and discovered a statistically significant difference in prognosis between patients with high and low levels of CA12519. Our research found that the CA125 had no clear prognostic significance for participants with MOC (hazard ratio, HR: 0.608, 95% CI: 0.286~1.288, P=0.194). This may be explained by the high proportion of patients with early MOC in our research. Compared to the above classical prognostic markers, we found that our novel nomogram was significantly more accurate, which revealed that the nomogram was proved to be a valuable tool to predict the overall survival of patients with MOC.
Importantly, postoperative adjuvant chemotherapy is a critical therapy for patients with ovarian cancer. However, there is a question whether adjuvant chemotherapy is beneficial to the prognosis of patients with MOC. Nasioudis et al observed 4811 patients with MOC, showing that there was no statistically significant difference in OS between the 1322 individuals who underwent chemotherapy and the 2920 individuals who did not (P = 0.17).30 This was consistent with our findings that patients who received chemotherapy had no indeed prognostic significance for patients with MOC (hazard ratio, HR: 1.73, 95% CI: 0.85~3.52, P=0.130). It is possible that patients with MOC are resistant to platinum-based chemotherapy regimens in the conventional sense.31 GOG241 was a high-profile worldwide multicenter clinical trial that evaluated the efficacy of a variety of chemotherapy regimens in patients with MOC.32 Regrettably, the trial was prematurely terminated due to a low enrolment rate with only 50 participants. As a result, further research is needed to determine the effectiveness of chemotherapy in patients with MOC.
There were some limitations in our study that should be mentioned. First of all, the number of patients was not large, which was a small sample study with only 494 patients. The reason was mainly related to the low incidence of MOC around the world. Moreover, our study was a retrospective study from SEER database, and some clinical information about patients was missing, which led to some inevitable bias in the results. For chemotherapy information, we only knew whether the patient had received chemotherapy, but the specific chemotherapy regimens were not clear. Different medical centers paid different attentions to the lymph node status, which might be related to surgical team in different centers. Finally, some clinical information could not be obtained from the SEER database, such as family history, BRCA1/2 mutation status and targeted therapy.
Conclusion
In summary, age, grade, FIGO stage and LODDS stage were risk factors independently impacting the prognosis of individuals with MOC. Our novel nomogram model had important significant guidance for the clinical diagnosis and management of MOC patients.
Data Sharing Statement
The following information was supplied regarding data availability: Data is available at the SEER database (https://seer.cancer.gov/).
Ethics Statement
We had signed the SEER research data agreement (username: 19786-Nov 2020). The data in this research were obtained from the SEER database following approved guidelines. The information on patients had been studied by the United States Department of Health and Human Services. The data is publicly available and deidentified after permission. Therefore, the research was exempted by the ethics committee of the Zhongda Hospital Southeast University. We confirm that the research was performed in accordance with the principles stated in the Declaration of Helsinki.
Acknowledgments
The authors thank the SEER database.
Author Contributions
All authors made substantial contributions to conception and design, acquisition of data, or analysis and interpretation of data; took part in drafting the article or revising it critically for important intellectual content; agreed to submit to the current journal; gave final approval for the version to be published; and agreed to be accountable for all aspects of the work.
Funding
This study was supported by the National Natural Science Foundation of China (No. 82072078), Jiangsu Province Key Research and Development Project (SBE2020741118), and Postgraduate Research & Practice Innovation Program of Jiangsu Province (SJCX22_0070).
Disclosure
There are no conflicts of interest regarding the publication of this article.
References
1. Siegel RL, Miller KD, Fuchs HE, Jemal A. Cancer Statistics, 2021. CA Cancer J Clin. 2021;71(1):7–33.
2. Kossaï M, Leary A, Scoazec JY, Genestie C. Ovarian Cancer: a Heterogeneous Disease. Pathobiology. 2018;85(1–2):41–49.
3. Prat J, D’Angelo E, Espinosa I. Ovarian carcinomas: at least five different diseases with distinct histological features and molecular genetics. Hum Pathol. 2018;80:11–27.
4. Kelemen LE, Köbel M. Mucinous carcinomas of the ovary and colorectum: different organ, same dilemma. Lancet Oncol. 2011;12(11):1071–1080.
5. Gates MA, Rosner BA, Hecht JL, Tworoger SS. Risk factors for epithelial ovarian cancer by histologic subtype. Am J Epidemiol. 2010;171(1):45–53.
6. Morice P, Gouy S, Leary A. Mucinous Ovarian Carcinoma. N Engl J Med. 2019;380(13):1256–1266.
7. Crane EK, Brown J. Early stage mucinous ovarian cancer: a review. Gynecol Oncol. 2018;149(3):598–604.
8. Wen J, Ye F, He X, et al. Development and validation of a prognostic nomogram based on the log odds of positive lymph nodes (LODDS) for breast cancer. Oncotarget. 2016;7(15):21046–21053.
9. Wang C, Yang C, Wang W, et al. A Prognostic Nomogram for Cervical Cancer after Surgery from SEER Database. J Cancer. 2018;9(21):3923–3928.
10. Ozawa T, Ishihara S, Sunami E, Kitayama J, Watanabe T. Log odds of positive lymph nodes as a prognostic indicator in stage IV colorectal cancer patients undergoing curative resection. J Surg Oncol. 2015;111(4):465–471.
11. Sharpe N. Clinical trials and the real world: selection bias and generalisability of trial results. Cardiovasc Drugs Ther. 2002;16(1):75–77.
12. Grapow MT, von Wattenwyl R, Guller U, Beyersdorf F, Zerkowski HR. Randomized controlled trials do not reflect reality: real-world analyses are critical for treatment guidelines! J Thorac Cardiovasc Surg. 2006;132(1):5–7.
13. Chen J, Yin J, Li Y, et al. Systematic Lymph Node Dissection May Be Abolished in Patients With Apparent Early-Stage Low-Grade Mucinous and Endometrioid Epithelial Ovarian Cancer. Front Oncol. 2021;11:705720.
14. Iasonos A, Schrag D, Raj GV, Panageas KS. How to build and interpret a nomogram for cancer prognosis. J Clin Oncol. 2008;26(8):1364–1370.
15. Feng S, Xia T, Ge Y, et al. Computed Tomography Imaging-Based Radiogenomics Analysis Reveals Hypoxia Patterns and Immunological Characteristics in Ovarian Cancer. Front Immunol. 2022;13:868067.
16. Feng S, Yin H, Zhang K, et al. Integrated clinical characteristics and omics analysis identifies a ferroptosis and iron-metabolism-related lncRNA signature for predicting prognosis and therapeutic responses in ovarian cancer. J Ovarian Res. 2022;15(1):10.
17. Zhu Y, Feng S, Song Z, Wang Z, Chen G. Identification of Immunological Characteristics and Immune Subtypes Based on Single-Sample Gene Set Enrichment Analysis Algorithm in Lower-Grade Glioma. Front Genet. 2022;13:894865.
18. Balachandran VP, Gonen M, Smith JJ, DeMatteo RP. Nomograms in oncology: more than meets the eye. Lancet Oncol. 2015;16(4):e173–180.
19. Hu J, Jiao X, Zhu L, Guo H, Wu Y. Establishment and verification of the nomogram that predicts the 3-year recurrence risk of epithelial ovarian carcinoma. BMC Cancer. 2020;20(1):938.
20. Wang R, Xie G, Shang L, et al. Development and validation of nomograms for epithelial ovarian cancer: a SEER population-based, real-world study. Future Oncol. 2021;17(8):893–906.
21. Yang L, Yu J, Zhang S, et al. A prognostic model of patients with ovarian mucinous adenocarcinoma: a population-based analysis. J Ovarian Res. 2022;15(1):26.
22. Heyward QD, Nasioudis D, Cory L, Haggerty AF, Ko EM, Latif N. Lymphadenectomy for early-stage mucinous ovarian carcinoma. Int J Gynecol Cancer. 2021;31(1):104–109.
23. Hoogendam JP, Vlek CA, Witteveen PO, Verheijen R, Zweemer RP. Surgical lymph node assessment in mucinous ovarian carcinoma staging: a systematic review and meta-analysis. Bjog. 2017;124(3):370–378.
24. Xu XL, Cheng H, Tang MS, et al. A novel nomogram based on LODDS to predict the prognosis of epithelial ovarian cancer. Oncotarget. 2017;8(5):8120–8130.
25. Hanatani M, Yoshikawa N, Yoshida K, et al. Impact of age on clinicopathological features and survival of epithelial ovarian neoplasms in reproductive age. Int J Clin Oncol. 2020;25(1):187–194.
26. Ditto A, Martinelli F, Bogani G, et al. Long-term safety of fertility sparing surgery in early stage ovarian cancer: comparison to standard radical surgical procedures. Gynecol Oncol. 2015;138(1):78–82.
27. Pawelec G. Does patient age influence anti-cancer immunity? Semin Immunopathol. 2019;41(1):125–131.
28. Matulonis UA, Sood AK, Fallowfield L, Howitt BE, Sehouli J, Karlan BY. Ovarian cancer. Nat Rev Dis Primers. 2016;2:16061.
29. Radu MR, Prădatu A, Duică F, et al. Ovarian Cancer: biomarkers and Targeted Therapy. Biomedicines. 2021;9(6):548.
30. Nasioudis D, Haggerty AF, Giuntoli RL, et al. Adjuvant chemotherapy is not associated with a survival benefit for patients with early stage mucinous ovarian carcinoma. Gynecol Oncol. 2019;154(2):302–307.
31. Bamias A, Sotiropoulou M, Zagouri F, et al. Prognostic evaluation of tumour type and other histopathological characteristics in advanced epithelial ovarian cancer, treated with surgery and paclitaxel/carboplatin chemotherapy: cell type is the most useful prognostic factor. Eur J Cancer. 2012;48(10):1476–1483.
32. Gore M, Hackshaw A, Brady WE, et al. An international, Phase III randomized trial in patients with mucinous epithelial ovarian cancer (mEOC/GOG 0241) with long-term follow-up: and experience of conducting a clinical trial in a rare gynecological tumor. Gynecol Oncol. 2019;153(3):541–548.
 © 2022 The Author(s). This work is published and licensed by Dove Medical Press Limited. The full terms of this license are available at https://www.dovepress.com/terms.php and incorporate the Creative Commons Attribution - Non Commercial (unported, v3.0) License.
By accessing the work you hereby accept the Terms. Non-commercial uses of the work are permitted without any further permission from Dove Medical Press Limited, provided the work is properly attributed. For permission for commercial use of this work, please see paragraphs 4.2 and 5 of our Terms.
© 2022 The Author(s). This work is published and licensed by Dove Medical Press Limited. The full terms of this license are available at https://www.dovepress.com/terms.php and incorporate the Creative Commons Attribution - Non Commercial (unported, v3.0) License.
By accessing the work you hereby accept the Terms. Non-commercial uses of the work are permitted without any further permission from Dove Medical Press Limited, provided the work is properly attributed. For permission for commercial use of this work, please see paragraphs 4.2 and 5 of our Terms.