")
Back to Journals » Cancer Management and Research » Volume 12
A Nomogram Based on Preoperative Clinical Bio-Indicators to Predict 5-year Survivals for Patients with Gastric Cancer After Radical Gastrectomy
Authors Yin QH, Liu BZ, Xu MQ, Tao L, Wang K, Li F, Zhang WJ
Received 17 December 2019
Accepted for publication 24 April 2020
Published 27 May 2020 Volume 2020:12 Pages 3995—4007
DOI https://doi.org/10.2147/CMAR.S242772
Checked for plagiarism Yes
Review by Single anonymous peer review
Peer reviewer comments 2
Editor who approved publication: Dr Eileen O'Reilly
Qi Hang Yin,1,2 Bin Zheng Liu,3 Meng Qing Xu,1,4 Lin Tao,1,2 Kui Wang,5 Feng Li,1,6 Wen Jie Zhang1,2
1Department of Pathology, The First Affiliated University Hospital, Shihezi University School of Medicine, Shihezi, Xinjiang, People’s Republic of China; 2The Key Laboratories for Xinjiang Endemic and Ethnic Diseases, Shihezi University School of Medicine, Shihezi, Xinjiang, People’s Republic of China; 3Department of Pathology, The First People’s Hospital, Jiande, Zhejiang, People’s Republic of China; 4Department of Gastroenterology and Hepatology, Suzhou City Hospital, Suzhou, Anhui, People’s Republic of China; 5Department of Preventive Medicine, Shihezi University School of Medicine, Shihezi, Xinjiang, People’s Republic of China; 6Department of Pathology, Beijing Chaoyang Hospital, Capital Medical University, Beijing, People’s Republic of China
Correspondence: Wen Jie Zhang
Department of Pathology, Shihezi University School of Medicine, 59 North 2nd Road, Shihezi, Xinjiang 832002, People’s Republic of China
Tel +86-139-8627-7576
Fax +86-993-205-7136
Email [email protected]
Purpose: This study aimed to improve the prediction of postoperative survival outcomes for patients with gastric cancer (GC) using a nomogram based on preoperative bio-indicators.
Patients and Methods: This retrospective study included 303 GC patients who had undergone radical gastrectomy from 2004 to 2013 at the First Affiliated Hospital, Shihezi University. The patients were followed up for 175 months after surgery and then divided into short-term (n=201) or long-term (n=102) survival groups. We used an expectation-maximization method to fill any missing data from the reviewed patient files. We then employed the Cox proportional hazard regression to identify biochemical markers that could predict 5-year overall survival (OS) as an endpoint among GC patients. Based on the results from the biochemical analysis, we developed a nomogram and assessed its performance and reliability.
Results: The variables significantly associated with OS in a multivariate analysis were age, body mass index (BMI), cell differentiation, high-density lipoprotein cholesterol (HDL-C), as well as serum potassium or serum magnesium. Combining all these predictors allowed us to establish a nomogram (C-index=0.701) whose accuracy of predicting survival was higher than the TNM staging system established by the 8th American Joint Committee on Cancer (C-index=0.666; p=0.016). Furthermore, decision curve of this nomogram was shown to have an ideal net clinical benefit rate.
Conclusion: We have developed an algorithm using preoperative bio-indicators and clinical features to predict prognosis for GC patients. This tool may help clinicians to strategize appropriate treatment options for GC patients prior to surgery.
Keywords: gastric cancer, 5-year overall survival, prognosis, nomogram
Introduction
Gastric cancer (GC) poses an imminent threat to public health in the world, particularly in China. According to the 2018 Global Cancer Statistics, the estimated 456,124 new GC cases and 390,182 new deaths due to GC were reported in China, representing 44.1% and 49.9% of world new GC cases and GC-related deaths, respectively. Besides, out of all malignant tumors, China ranks second in the GC morbidity and mortality in the world.1,2
In recent years, advanced screening methods coupled with improved public health awareness have put the GC morbidity and mortality under control.3 However, the prognosis of advanced gastric cancer (AGC) remains poor.2 Radical gastrectomy remains a mainstay treatment for AGC. Given that TNM clinical staging is not available before gastrectomy,4 choosing appropriate surgical strategies usually depends on patient-specific clinical information and patients’ general health5 making it difficult for clinicians to employ effective surgical options which affect prognosis for GC patients.6 Therefore, a method that could predict patients’ prognosis prior to surgery would be very helpful for physicians to determine surgical options as well as postoperative treatment decisions.
A number of scoring and risk-stratification systems that utilize various demographic information and postoperative clinical parameters have been suggested to be able to predict prognosis for GC patients.7–10 However, there is little research using preoperative clinical information to predict the long-term survival outcomes after radical GC gastrectomy. In this study, we have first investigated the feasibility of using preoperative bio-indicators to predict GC prognosis. Here we report a 5-year survival algorithm by establishing and validating a nomogram employing preoperative clinical bio-indicators.
Patients and Methods
Ethics Statement
This study was approved by the Institutional Ethics Review Board (IERB No. SHZ2010LL03) at the First Affiliated Hospital, Shihezi University School of Medicine. The IERB had waived the requirement for written informed consent due to anonymous analyses of the data. The standard university hospital guidelines were followed, which are in line with the Declaration of Helsinki outlining the ethical principles for medical research that involve human samples.
Patients and Follow-up
We reviewed medical records of 500 patients who underwent radical gastrectomy for GC between January 1, 2004 and June 30, 2013 at the First Affiliated Hospital of the School of Medicine, Shihezi University. Two senior pathologists re-evaluated the GC diagnoses and identified those who had: gastric adenocarcinoma or squamous carcinoma during postoperative pathology, undergone blood chemistry tests before surgery and available records of body weight and height without chemo-radiotherapy before surgery. A total of 180 patients who had preoperative chemoradiotherapy or other treatment that affected blood biochemical levels (n=126); gastric stump cancer (n=31); combined with other malignant tumors (n=15); or incomplete clinicopathological information (n=8) were excluded from the study. Ultimately, 320 patients (237 men and 83 women, mean age 61.7 [range, 27–86] years) were included in the study and were followed up for 175 months (14.6 years) after surgery. The median follow-up time was 104 months. It should be noted that the patients studied here were from a city, Shihezi City in China’s far west, where a vast majority of residents were migrants from all over the country,11 suggesting the heterogeneity of this patient population.
Clinical and Biochemical Features
In the present study, we only included patients who had not received chemo-radiotherapy before surgery, which allowed us to evaluate the effectiveness of the nomogram in predicting 5-year survival for GC patients after radical gastrectomy. We obtained clinical data including age, sex, height, weight, phone number, address, medical history and clinicopathological information from the patients’ medical records. Using the collected clinical data, we calculated the body mass index (BMI; kg/m2). Patients were grouped according to the standards set by the Chinese Working Group on Obesity.12
Blood chemistry tests were performed in the Clinical Biochemistry Laboratories at the First Affiliated Hospital, Shihezi University School of Medicine. Normal reference intervals for the blood biochemical indicators were in accordance with the Health Industry Standards of the People’s Republic of China.13–16
The TNM staging and the degree of cell differentiation were based on post-resection histopathology. The staging was determined based on surgical findings as described by the 8th American Joint Committee on Cancer (AJCC) TNM staging system.4
Statistical Analyses
Descriptive data were presented as a mean ± SD, while categorical data were presented as a percentage. Comparison between the different groups was analyzed using the Student’s t-test or chi-square test/Fisher’s exact test for continuous or categorical variables, respectively. Survival curves were drawn by the Kaplan–Meier method. On the other hand, to identify independent variables, factors that were significant in univariate or multivariable analysis were included in Cox proportional hazard regression analysis. The percentages of missing data in patient files were 12.7%. And missing mechanism was missing at random. Expectation-maximization was a convenient, effective and reasonable imputation method in dealing with missing data.17 Expectation-maximization calculates maximum likelihood estimation or posterior probability distribution through iteration. We used an expectation-maximization method to fill any missing data from the reviewed patient files.
All statistical analyses were carried out using Statistical Product and Service Solutions (SPSS) 22.0 software (SPSS Inc, Chicago, IL, USA), R (version 3.4.3; http://www.R-project.org) and EmpowerStats software (http://www.empowerstats.com). Nomogram discrimination power was evaluated by concordance index (C-index), which is equivalent to the area under the receiver operating characteristic curve. Moreover, for comparison, we calculated the C-index of the 8th AJCC TNM staging system. The area under the curve (AUC) ranges between 0 and 1, where 1 shows perfect concordance, while 0.5 indicates no better concordance than chance. We constructed calibration plots and validated them with 500 bootstrap repetitions to reduce bias. Furthermore, we employed the decision curve analysis (DCA) to evaluate the clinical application value of the nomogram. Whereas a p-value of less than 0.05 is usually considered statistically significant, a p-value of less than 0.15 was considered statistically significant in our Cox proportional hazard regression univariate analysis.
Results
Demographic and Biochemical Data
Of the 500 patients reviewed, 320 patients were eligible for inclusion. However, 17 (5.3%) patients were excluded from the analysis because of a lack of or inconsistent information regarding the biochemical results or follow-up periods. The study reviewed and analyzed data from the remaining 303 patients (Figure S1). By October 2, 2018, 208 (68.6%) patients had died. Overall, 201 patients died within 5 years (short-term survival group) while 102 patients survived longer than 5 years (long-term survival group). The detailed characteristics of the study population are as summarized in Table 1.
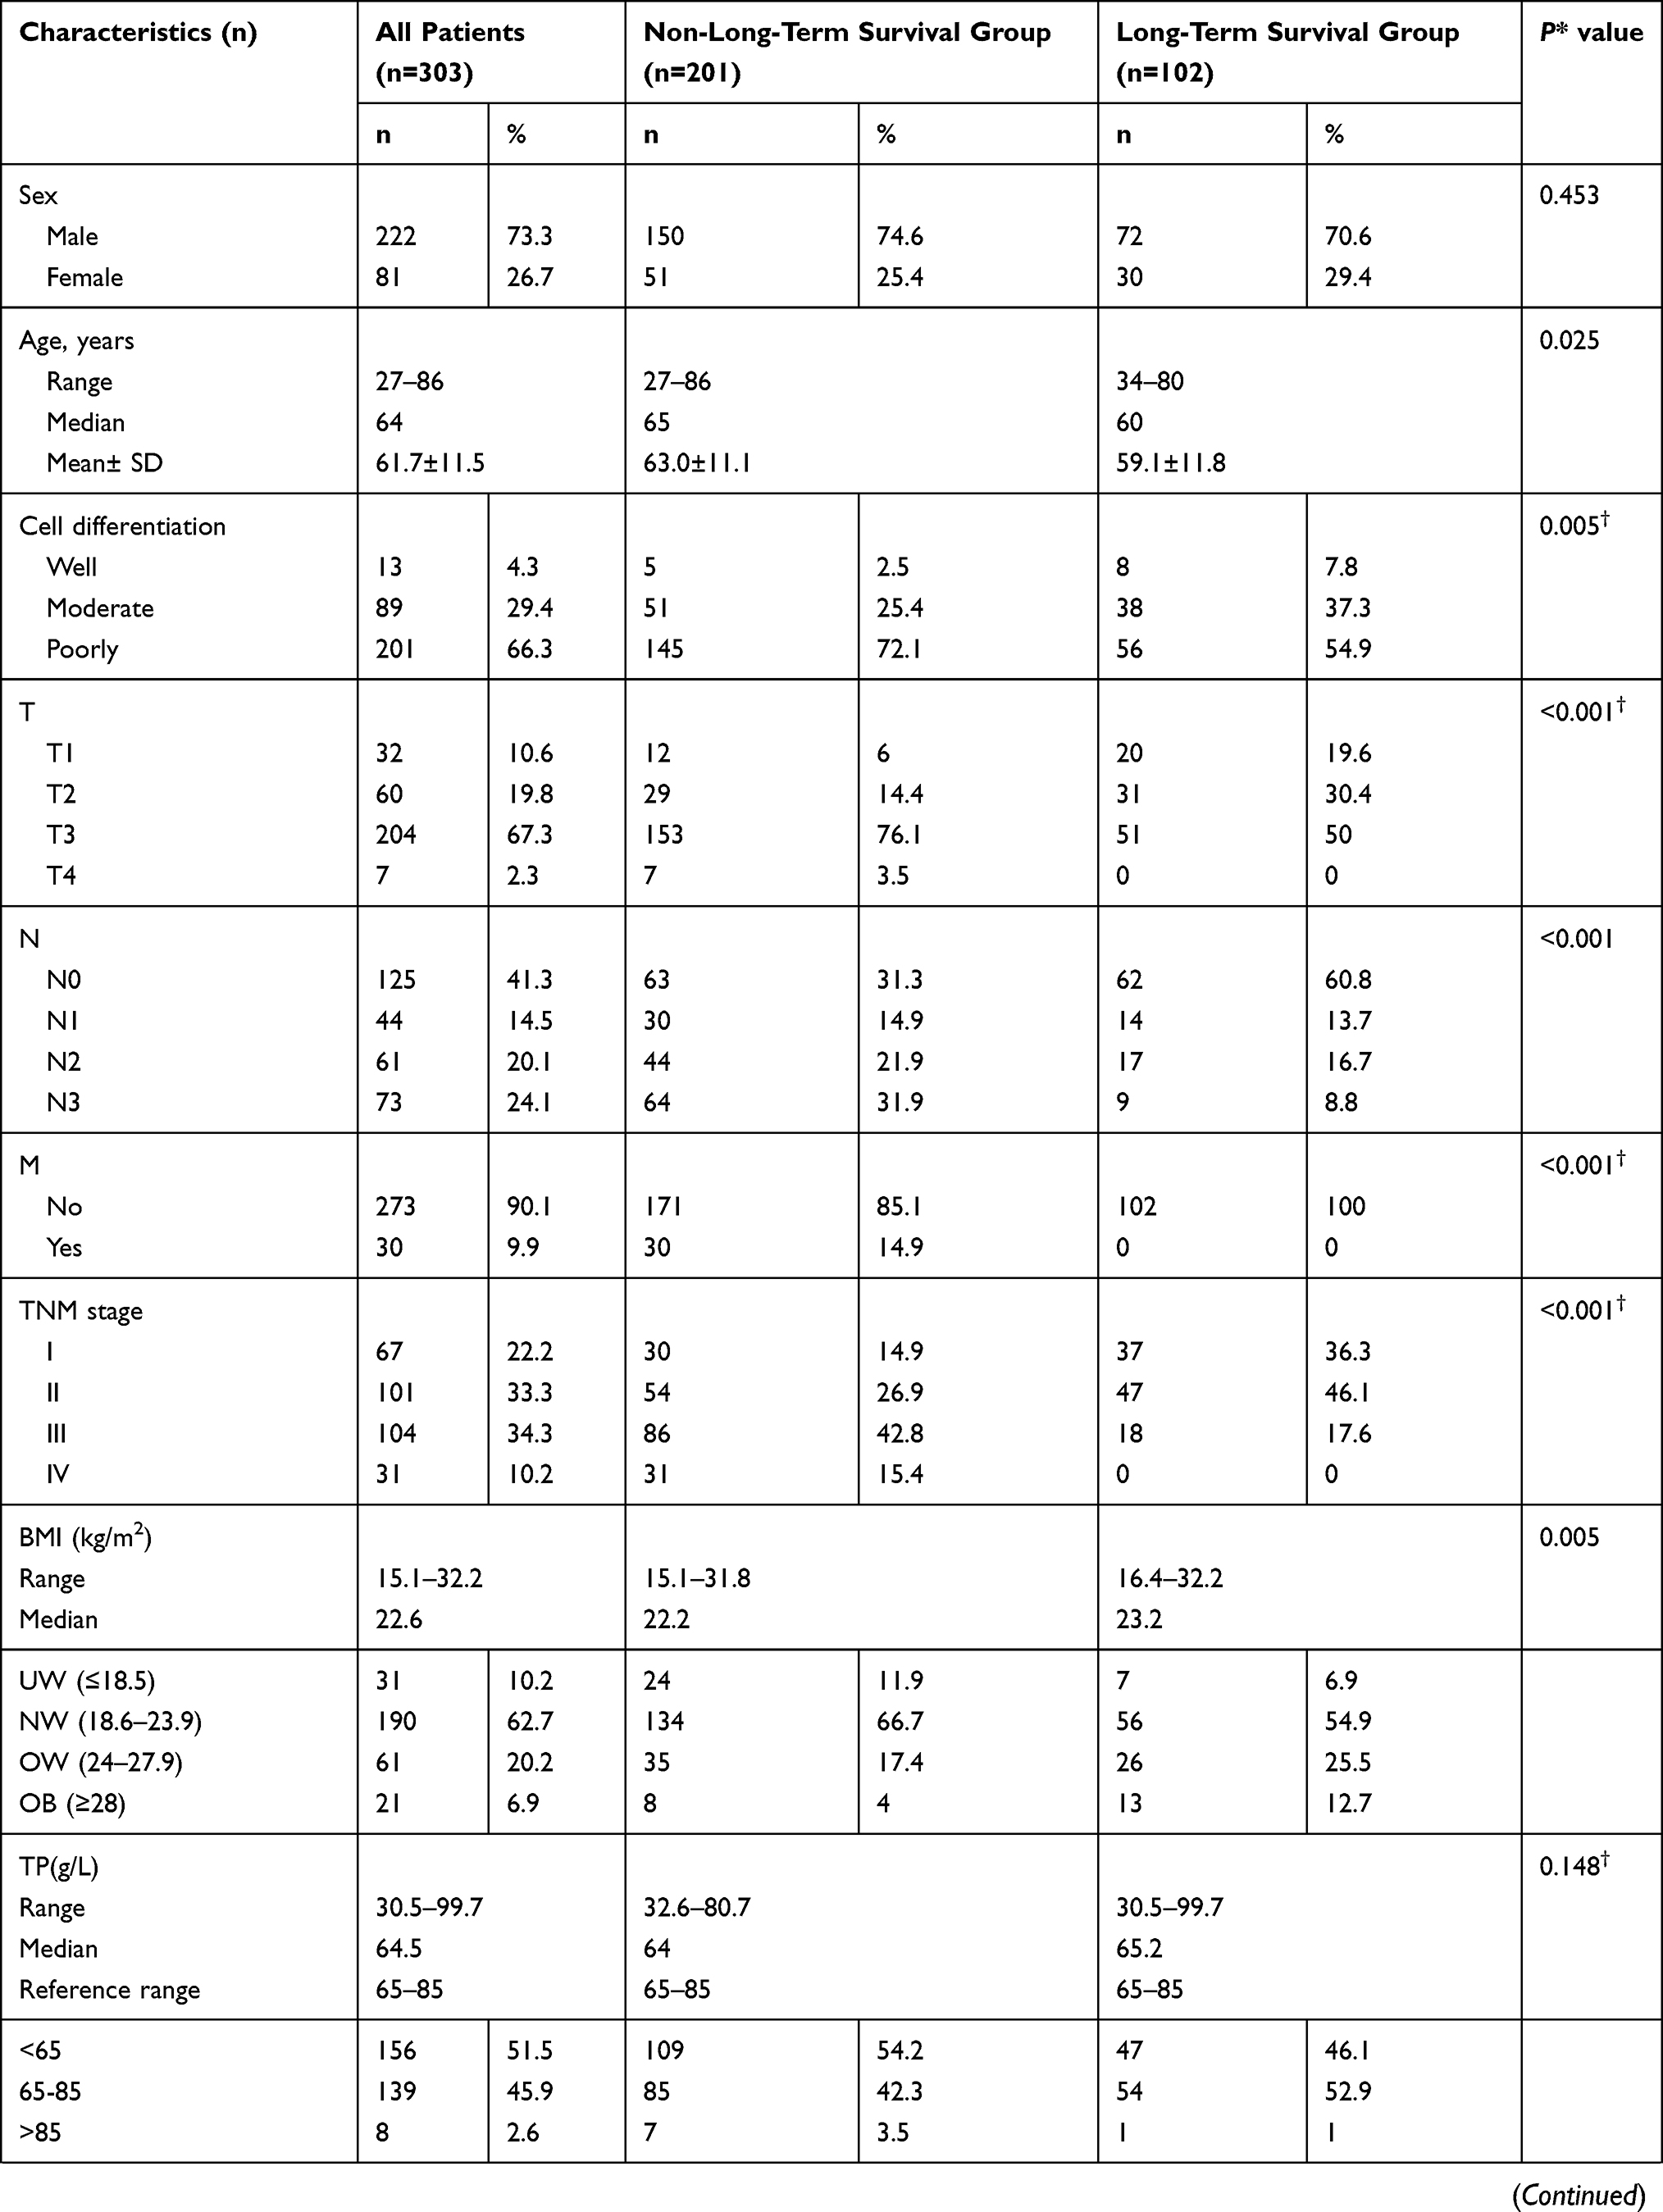 |  |  |  |
Table 1 Preoperative and Postoperative Characteristics of 303 Gastric Cancer Patients |
Patients in the long-term survival group were significantly younger compared to those in the short-term survival group (59.1±11.8 years vs 63.0± 11.1 years, p=0.025). Both the BMI and cell differentiation were better in the long-term survival group (p=0.005). In addition, short-term survival group had more advanced cancer stages compared to the long-term survival group. This phenomenon was true in tumor invasion (T), lymph node metastasis (N), distant metastasis (M) and TNM stage (p<0.001).
There were significant differences in albumin (Alb) levels, the albumin/globulin (A/G) ratio, blood glucose (Glu) levels, total cholesterol (TC), high-density lipoprotein cholesterol (HDL-C), low-density lipoprotein cholesterol (LDL-C) or serum sodium between the long-term and short-term survival groups (p=0.003, p=0.012, p=0.014, p=0.043, p<0.001, p=0.011, p=0.023, respectively).
Prognosis Factors Associated with the Overall Survival in Gastric Cancer
The mean follow-up for the 303 patients was 109.1±3.1 months, while the median follow-up was 140.0±4.8 months. The mean survival time was 71.1±4.1 months while the median survival time was 40.0±6.7 months. In addition, the 3- and 5-year OS rate was 46.9% and 37.4%, respectively (Figure S2).
Pre-surgery factors such as age (p=0.005), cell differentiation (p=0.011), BMI (p=0.011), total protein (TP, p=0.024), A/G (p=0.073), total bilirubin (TBIL, p=0.081), direct bilirubin (DBIL, p=0.115), HDL-C (p<0.001), LDL-C (p=0.045), serum potassium (p=0.105), serum calcium (p=0.147), or serum magnesium (p=0.049) were significantly associated with the GC prognosis in the univariate analysis. On the other hand, post-surgery factors such as T (p=0.008), N (p=0.031), M (p=0.014), or TNM (p=0.052) were shown to be significantly associated with the GC prognosis in the univariate analysis (Table 2). Unlike the univariate data, multivariate analysis showed a slight deviation. Pre-surgery factors such as age (Hazard ratio, [HR]=1.022, p<0.001), poor cell differentiation (HR=1.618, p<0.001), HDL-C levels of more than 1.04 mmol/L (HR=0.430, p<0.001), BMI score of more than 24 kg/m2 (HR=0.241, p<0.001), serum magnesium level at the range of 0.75–1.02 mmol/L (HR=0.651, p=0.021) were independent prognostic indicators. There was no significant difference between serum potassium levels and OS (p=0.282). TNM (HR=2.734, p<0.001) was the only post-surgery independent prognostic factor in the multivariate analysis (Table 2).
 |
Table 2 Univariate and Multivariable Analyses of Risk Factors Associated with the Prognosis of Gastric Cancer |
Although there was no significant association between sex and GC prognosis in the univariate or multivariate analysis, some studies showed that sex affected the prognosis.18 Besides, some studies showed that electrolyte imbalance, especially hypokalemia, is common in patients who received abdominal surgery, affecting the patients’ postoperative recovery.19 Thus, serum potassium and sex were incorporated into the prediction model.
Establishment of a Nomogram for Predicting 5-year OS
For the development of the nomogram (Figure 1), we incorporated clinical features and blood biochemical parameters (age, sex, cell differentiation, BMI, HDL-C, serum potassium, serum magnesium) as defined by the multivariate analysis.
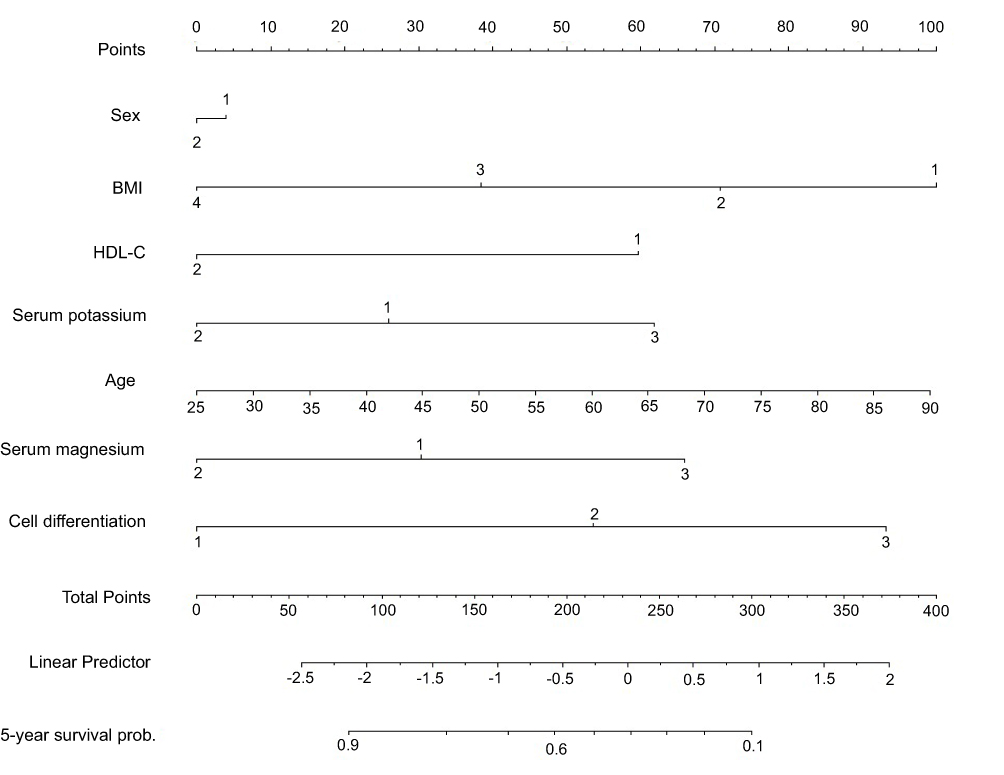 |
Figure 1 Nomogram to predict individual patient-level 5-year overall survival based on preoperative clinical biochemical features. The value of an individual patient is located on each variable axis, and predictor points (“Points” scale; top) correspond to each variable. Sum of all the seven variables is located on the total point axis. Abbreviations: BMI, body mass index; HDL-C, high-density lipoprotein cholesterol; prob, probability. |
Figure 1 shows the nomogram: vertical lines are drawn from the correct status of each prognostic factor to the top axis (points). After the addition of all the points, a vertical line was drawn from the “total points” axis to the bottom axes. This helps in the conversion into a 5-year survival probability.
Figure 2 depicts the Time-dependent AUC. The learned Cox model resulted in AUC ranging from 0.757 to 0.802 for different time points. Additionally, the sensitivity and specificity for predicting 5-year survival rate at different cutoff values are summarized in Table 3. At a cutoff value of >0.70, specificity was 78.95% while sensitivity was 63.46%. Although higher cutoff values result in higher specificity, sensitivity falls rapidly.
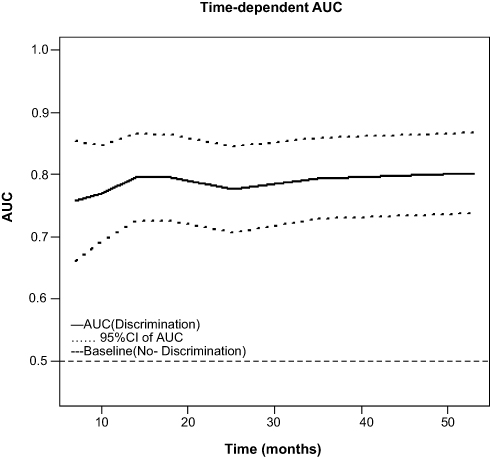 |
Figure 2 Time-dependent AUC. The solid and dashed lines depict the AUC and random chance, respectively. The dotted line shows the 95% CI of AUC. The AUC increases with the number of months. Abbreviation: CI= confidence interval. |
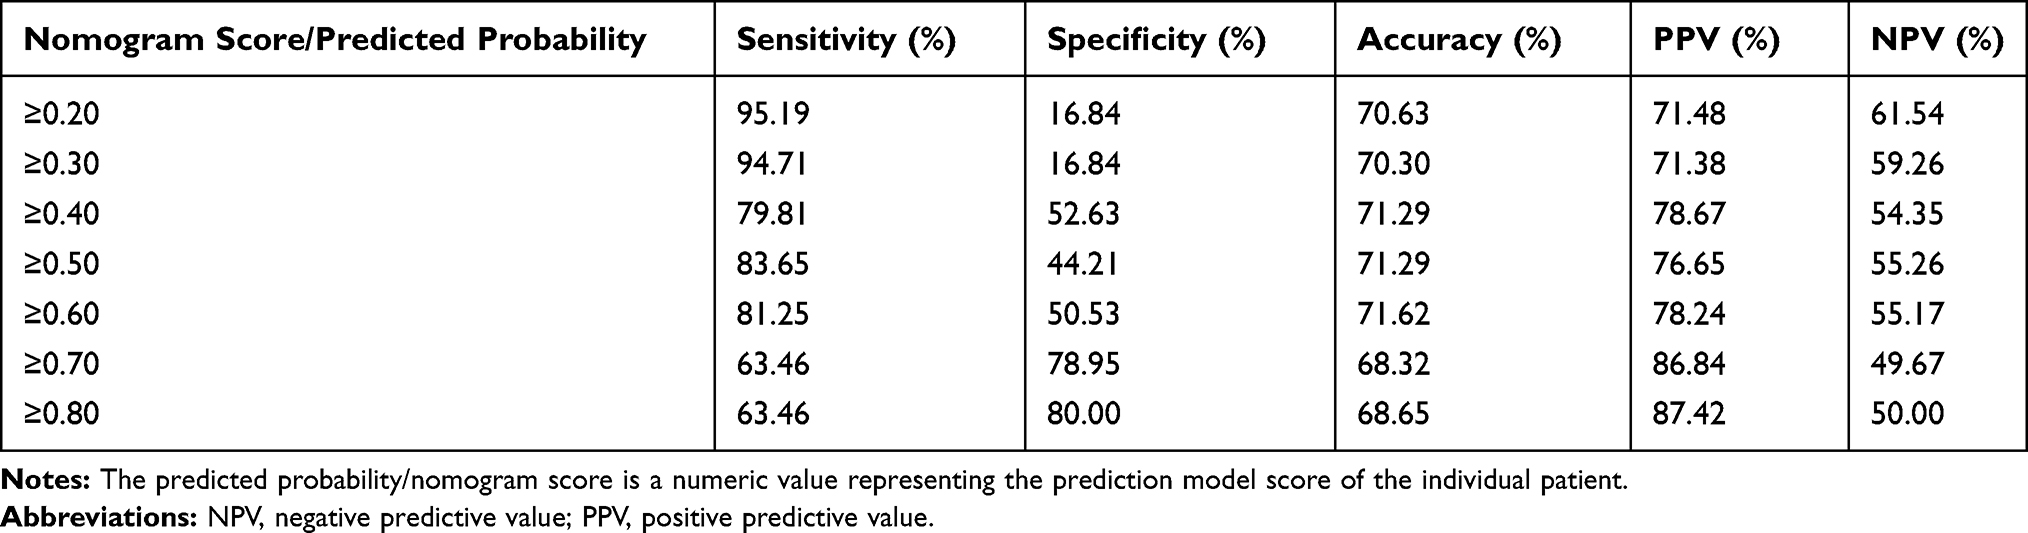 |
Table 3 Values of Sensitivity, Specificity, and Predictive Values of the Nomogram Scores at Different Cutoff Values |
Validation of the Nomogram for the Prediction of a 5-year OS
The 5-year OS predictive accuracy of the nomogram was 0.701 in the internal validation (500 bootstraps). The 5-year OS prediction accuracy was validated by the calibration curve which showed a correlation between the actual observed outcome and the prediction by the nomogram. This correlation data from the calibration curve was observed even when the nomogram prediction probability was less than 20% (Figure 3A).
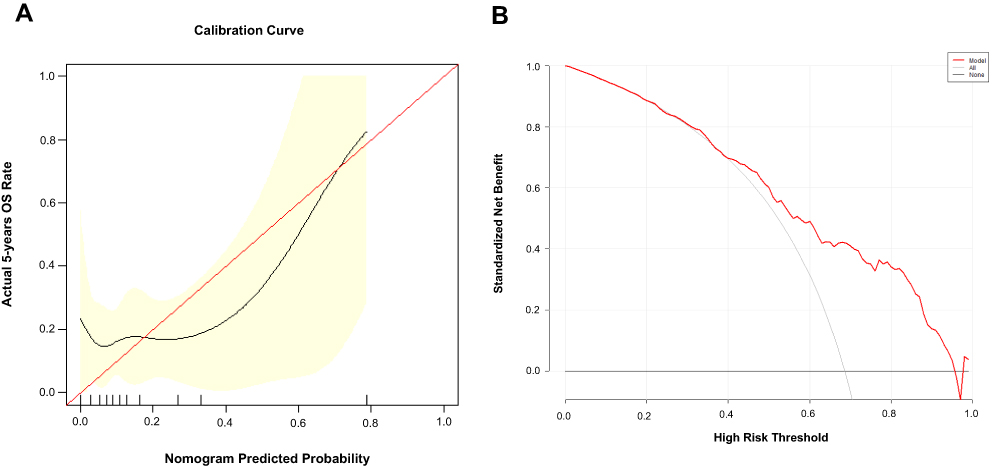 |
Figure 3 (A) The Calibration curves of 5-year overall survival nomogram. The red line is reference line, and the black line is fitting. The yellow area represents the 95% CI. After 500 repetitions of bootstrap, the calibration curves showed a good correlation between the predicted probability and actual probability. (B) Decision curve analysis for the 5-year overall survival nomogram. Solid bold line: the assumption that no patients will experience the event; solid thin line: the assumption that all patients will relapse; red line: net benefit of a strategy of treating patients according to the nomogram predictions. |
Comparison of the Nomogram with TNM Prognostic Indexes
We then compared the model with the 8th AJCC TNM staging system for the 5-year OS after the radical gastrectomy. Our findings showed that the nomogram displayed higher levels of accuracy over the TNM staging (C–index, 0.701, 95% confidence interval [CI], 0.669–0.733 vs 0.666, 95% CI, 0.630–0.702; p=0. 016) (Table S1). Therefore, the nomogram is an accurate tool and can be adopted to predict GC prognosis before surgery. The DCA for the model is as shown in Figure 3B.
Discussion
This study has demonstrated that age, sex, cell differentiation, HDL-C, BMI, serum potassium or serum magnesium are useful bio-indicators in terms of predicting a 5-year OS for GC patients after receiving radical gastrectomy. The combination of all the seven pre-surgery parameters has resulted in a C-index of 0.701, suggesting this combination of bio-indicators may act as an independent factor capable of predicting prognosis for GC patients. Besides predicting disease progression, it may also be used to elaborate surgical strategies and estimate possible postoperative survival prior to surgery. Unlike the nomogram, classic TNM staging is only possible in predicting survival after surgery. We have introduced a nomogram based on patients’ basic clinical features and preoperative biochemical indicators. The nomogram predicts the 5-year OS among GC patients (Figure 1) with a reliable performance (AUC of 0.78). This nomogram may comprehend treatment and follow-up plans for patients with GC. Essentially, our study incorporates the preoperative blood biochemical indicators to predict outcomes of GC patients. Although studies have reported that some molecular markers predict disease prognosis and survival for GC patients, most of these molecular tools require professional testing, are time-consuming and expensive and, therefore, limit their usefulness in clinical settings at large. The blood biochemical indicators used here are readily tested, non-invasive or minimally invasive and inexpensive, thus, may serve as a preferred option in most clinical settings.
Our nomogram analysis has shown that age is an independent and baseline predictor for the OS. Patients with advanced age who underwent radical gastrectomy due to GC have been associated with a low 5-year survival rate, in keeping with previous reports.20 The phenomenon may be attributed to comorbidities, compromised immunity, and malnutrition amongst others in senior patients. In addition, the low survival rate in older patients has been associated with a lack of tumor-related early symptoms as well as routine screening, thus, late-stage diagnosis and delayed treatment.
Previous studies, including ours, have shown that BMI-defined underweight is correlated with poor GC prognosis.21,22 This study has shown that GC patients with higher BMI are correlated with better survival rates, confirming previous findings. It is hypothesized that lower BMI may be associated with difficulties in food intake due to late-stage AGC; thus, rapid weight loss indicates a deterioration of general health in GC patients. Furthermore, a low BMI prior to surgery renders a patient difficulty to meet perioperative nutritional requirements which, in turn, affect postoperative recovery, leading to poor prognosis.
Interestingly, unlike multivariable analysis, our univariate analysis has shown that serum calcium appears to affect the prognosis of GC patients. LIPKIN et al have observed that serum calcium supplementation can reduce the chances of colon or esophagus cancer in experimental animals.23 LIN et al however, have shown that there are no significant differences in serum calcium levels between GC patients and non-GC patients.24 To date, it has not been reported that serum calcium levels are correlated with the prognosis of GC patients. Furthermore, normal levels of serum potassium and magnesium are correlated with better OS in the multivariable analyses, suggesting possible mechanism(s) that may involve a biased postoperative diet, digestive tract malabsorption, or increased renal excretion among others in certain GC patients.25 Because ion metabolisms are important for life, the present findings warrant further investigations into ionic mechanisms that may be involved in cancer progression and prognosis of GC. On a different front, cell differentiation and HDL-C levels of more than 10.4 mmol/L are known predictors of OS26,27 in agreement with our observations reported here.
The nomogram analysis using bio-indicators to predict OS among GC patients has several clinical implications. First, these bio-indicators are clinical routine tests and easily obtainable in any clinical setting. Second, these bio-indicators can be obtained prior to surgery giving clinicians room to elaborate treatment options in terms of quality of life and estimated length of survival for their patients. Third, the nomogram analysis provides a good C-index, an ideal DCA, and a calibration curve in terms of predicting OS which is a reliable endpoint for retrospective studies. Fourth, different from other studies,7–10 our prediction algorithm provides a quantifiable risk score for individual patient counseling before surgery. Finally, it should be mentioned that the patients studied here were from Shihezi City, a city in China’s far west, where a vast majority of residents are migrants from all over the country, suggesting heterogeneity in the nature of our patient population.11 This heterogeneity suggests that the nomogram algorithm developed may be useful in other geographical areas of China. These advantages suggest that the nomogram algorithm is equal to or better than the prediction algorithm of the TNM staging in terms of 5-year overall survival among GC patients after surgery.
The present study has several limitations. First, this is a single-center study whose applicability needs to be validated in the external center(s), including domestic as well as international centers with larger sample sizes, which will be our ongoing collaborative investigations. Second, due to differences in genetic and environmental backgrounds, the results and proposals from this study may have potential applicability in China and perhaps in Eastern countries, but apparently not so in Western countries before validation studies are performed. Third, ECOG PS (Eastern Cooperative Oncology Group performance status) score has not been included in this nomogram model due largely to its unstable predictive ability as demonstrated by a survey from the St. James’s Hospital Cancer Center (Dublin, Ireland).28 Nevertheless, future validation studies considering the abovementioned factors would certainly advance the applicability of this nomogram model for predicting OS among GC patients.
Conclusions
We have developed a nomogram model based on the combination of several preoperatively obtained clinical bio-indicators and patients’ basic features. The nomogram model allows the prediction of 5-year overall survival after radical gastrectomy for gastric cancer patients in a migrant city in the west of China. The novel nomogram provides significantly better clinical benefits than the 8th AJCC TNM staging system. The nomogram also provides an individualized prediction of survival, which may help clinicians to strategize treatment options prior to surgery and follow-up intervals after surgery.
Abbreviations
ECOG PS, Eastern Cooperative Oncology Group performance status; GC,gastric cancer; AGC, advanced gastric cancer; OS, overall survival; CI, confidence interval; AJCC, American Joint Committee on Cancer; ROC, receiver operating characteristic; AUC, area under curve; DCA, decision curve analysis; HR, hazard ratio; NPV, negative predictive value; PPV, positive predictive value; vs, versus; T, tumor invasion; N, lymph node metastasis; M, distant metastasis; BMI, body mass index; UW, underweight; NW, normal weight; OW, overweight; OB, obesity; TP, total protein; Alb, albumin; A/G, albumin and globulin; Glu, blood glucose; TBIL, total bilirubin; DBIL, direct bilirubin; TC, total cholesterol; TG, triglyceride; HDL-C, high-density lipoprotein cholesterol; LDL-C, low-density lipoprotein cholesterol.
Data sharing statement
All the data generated or analyzed during this study are included in this article.
Acknowledgments
We sincerely thank all patients participated in this investigation. We are grateful to the Ministry of Science and Technology of China, the Bureau of Science and Technology of the Xinjiang Corps, and Shihezi University for their generous financial support.
Author contributions
All authors contributed to data analysis, drafting or revising the article, gave final approval of the version to be published, and agree to be accountable for all aspects of the work.
Disclosure
The authors report no conflicts of interest in this work.
References
1. Bray F, Ferlay J, Soerjomataram I, et al. Global cancer statistics 2018: GLOBOCAN estimates of incidence and mortality worldwide for 36 cancers in 185 countries. CA Cancer J Clin. 2018;68:394–424. doi:10.3322/caac.21492
2. Chen W, Zheng R, Baade PD, et al. Cancer statistics in China, 2015. CA Cancer J Clin. 2016;66:115–132. doi:10.3322/caac.21338
3. Song KY, Park YG, Jeon HM, et al. A nomogram for predicting individual survival of patients with gastric cancer who underwent radical surgery with extended lymph node dissection. Gastric Cancer. 2014;17:287–293. doi:10.1007/s10120-013-0270-x
4. Amin MB, Edge S, Greene F, et al. AJCC Cancer Staging Manual [M].
5. Japanese Gastric Cancer Association. Japanese gastric cancer treatment guidelines 2014 (ver. 4). Gastric Cancer. 2017;20(1):1–19. doi:10.1007/s10120-016-0622-4
6. Thrumurthy SG, Chaudry MA, Hochhauser D, et al. The diagnosis and management of gastric cancer. BMJ. 2013;347:f6367–f6367. doi:10.1136/bmj.f6367
7. Kattan MW, Karpeh MS, Mazumdar M, et al. Postoperative nomogram for disease-specific survival after an R0 resection for gastric carcinoma. J Clin Oncol. 2003;21:3647–3650. doi:10.1200/JCO.2003.01.240
8. Marrelli D, De Stefano A, de Manzoni G, et al. Prediction of recurrence after radical surgery for gastric cancer: a scoring system obtained from a prospective multicenter study. Ann Surg. 2005;241:247–255. doi:10.1097/01.sla.0000152019.14741.97
9. Han DS, Suh YS, Kong SH, et al. Nomogram predicting long-term survival after d2 gastrectomy for gastric cancer. J Clin Oncol. 2012;30:3834–3840. doi:10.1200/JCO.2012.41.8343
10. Hirabayashi S, Kosugi S, Isobe Y, et al. Development and external validation of a nomogram for overall survival after curative resection in serosa-negative, locally advanced gastric cancer. Ann Oncol. 2014;25:1179–1184. doi:10.1093/annonc/mdu125
11. Johnson C. Eurasian Corridors of Interconnection [M]. 2013. doi:10.4324/9780203796443
12. Zhou BF. Predictive values of body mass index and waist circumference for risk factors of certain related diseases in Chinese adults: study on optimal cut-off points of body mass index and waist circumference in Chinese adults. Asia Pac J of Clin Nutr. 2003;11(Suppl 8):S685–693. doi:10.1046/j.1440–6047.11.s8.9.x
13. Shang H, Chen WX, Pan BS, et al. Reference intervals for common clinical biochemistry tests Part 2: serum total protein and albumin [M]. WS/T404.2-2012. Chinese. Available from: http://www.nhc.gov.cn/wjw/s9492/wsbz.shtml.
14. Shang H, Zhang J, Chen WX, et al. Reference intervals for common clinical biochemistry tests Part 3: serum potassium, sodium and chloride [M]. WS/T404.3-2012. Chinese. Available from: http://www.nhc.gov.cn/wjw/s9492/wsbz.shtml.
15. Shang H, Pan BS, Chen WX, et al. Reference intervals for common clinical biochemistry tests Part 4: serum total bilirubin and direct bilirubin [M]. WS/T404.4-2018. Chinese. Available from: http://www.nhc.gov.cn/wjw/s9492/wsbz.shtml.
16. Shang H, Hao XK, Pan BS, et al. Reference intervals for common clinical biochemistry tests Part 6: serum calcium, phosphorus, magnesium, iron [M]. WS/T404.6-2015. Chinese. Available from: http://www.nhc.gov.cn/wjw/s9492/wsbz.shtml.
17. Little RJA, Rubin DB. Statistical analysis with missing data. Technometrics. 2002;45(4):364–365. doi:10.1198/tech.2003.s167
18. Yu GZ, Chen Y, Wang JJ, et al. Overexpression of Grb2/HER2 signaling in Chinese gastric cancer: their relationship with clinicopathological parameters and prognostic significance. J Cancer Res Clin. 2009;135:1331–1339. doi:10.1007/s00432-009-0574-8
19. Vanek VW, Seballos RM, Chong D, et al. Serum potassium concentrations in trauma patients. South Med J. 1994;87:41–46. doi:10.1097/00007611-199401000-00010
20. Schlesinger-Raab A, Mihaljevic AJ, Egert S, et al. Outcome of gastric cancer in the elderly: a population-based evaluation of the Munich Cancer Registry. Gastric Cancer. 2016;19:713–722. doi:10.1007/s10120-015-0527-7
21. Chen HN, Chen XZ, Zhang WH, et al. The impact of body mass index on the surgical outcomes of patients with gastric cancer: a 10-year, single-institution cohort study. Medicine. 2015;94:e1769. doi:10.1097/md.0000000000001769
22. Liu BZ, Tao L, Chen YZ, et al. Preoperative body mass index, blood albumin and triglycerides predict survival for patients with gastric cancer. PLoS One. 2016;11:e0157401. doi:10.1371/journal.pone.0157401
23. Lipkin M, Newmark H. Effect of added dietary calcium on colonic epithelial-cell proliferation in subjects at high risk for familial colonic cancer. New Engl J Med. 1985;313:1381–1384. doi:10.1056/NEJM198511283132203
24. Lin Q. The lever of serum vitamin D and calcium iron and the clinic significance in patients with gastric cancer [D]. Jinan: Shandong University; 2010. Chinese. doi: 10.7666/d.y1792812
25. Raghunand N, He X, Van Sluis R, et al. Enhancement of chemotherapy by manipulation of tumor pH. Brit J Cancer. 1999;80(7):1005–1011. doi:10.1038/sj.bjc.6690455
26. Lipham JC, DeMeester TR. Preoperative diagnosis of lymph node metastasis: a dream? Gastric Cancer. 2006;9:70–71. doi:10.1007/s10120-006-0382-7
27. Kitahara CM, BdG A, Freedman ND, et al. Total cholesterol and cancer risk in a large prospective study in Korea. J Clin Oncol. 2011;29:1592–1598. doi:10.1200/JCO.2010.31.5200
28. Broderick JM, Hussey J, Kennedy MJ, et al. Patients over 65 years are assigned lower ECOG PS scores than younger patients, although objectively measured physical activity is no different. J Geriatr Oncol. 2014;5(1):49–56. doi:10.1016/j.jgo.2013.07.010
 © 2020 The Author(s). This work is published and licensed by Dove Medical Press Limited. The full terms of this license are available at https://www.dovepress.com/terms.php and incorporate the Creative Commons Attribution - Non Commercial (unported, v3.0) License.
By accessing the work you hereby accept the Terms. Non-commercial uses of the work are permitted without any further permission from Dove Medical Press Limited, provided the work is properly attributed. For permission for commercial use of this work, please see paragraphs 4.2 and 5 of our Terms.
© 2020 The Author(s). This work is published and licensed by Dove Medical Press Limited. The full terms of this license are available at https://www.dovepress.com/terms.php and incorporate the Creative Commons Attribution - Non Commercial (unported, v3.0) License.
By accessing the work you hereby accept the Terms. Non-commercial uses of the work are permitted without any further permission from Dove Medical Press Limited, provided the work is properly attributed. For permission for commercial use of this work, please see paragraphs 4.2 and 5 of our Terms.