")
Back to Journals » International Journal of Nanomedicine » Volume 11
A new target ligand Ser–Glu for PEPT1-overexpressing cancer imaging
Authors Dai T, Li N, Zhang L, Zhang Y, Liu Q
Received 26 September 2015
Accepted for publication 18 November 2015
Published 11 January 2016 Volume 2016:11 Pages 203—212
DOI https://doi.org/10.2147/IJN.S97207
Checked for plagiarism Yes
Review by Single anonymous peer review
Peer reviewer comments 3
Editor who approved publication: Professor Lei Yang
Tongcheng Dai,1 Na Li,1 Lingzhi Zhang,1 Yuanxing Zhang,1,2 Qin Liu1,2
1State Key Laboratory of Bioreactor Engineering, East China University of Science and Technology, 2Shanghai Collaborative Innovation Center for Biomanufacturing Technology, Shanghai, People’s Republic of China
Abstract: Nanoparticles functionalized with active target ligands have been widely used for tumor-specific diagnosis and therapy. The target ligands include antibodies, peptides, proteins, small molecules, and nucleic acid aptamers. Here, we utilize dipeptide Ser–Glu (DIP) as a new ligand to functionalize polymer-based fluorescent nanoparticles (NPs) for pancreatic cancer target imaging. We demonstrate that in the first step, Ser–Glu-conjugated NPs (NPs-DIP) efficiently bind to AsPC-1 and in the following NPs-DIP are internalized into AsPC-1 in vitro. The peptide transporter 1 inhibition experiment reveals that the targeting effects mainly depend on the specific binding of DIP to peptide transporter 1, which is remarkably upregulated in pancreatic cancer cells compared with varied normal cells. Furthermore, NPs-DIP specifically accumulate in the site of pancreatic tumor xenograft and are further internalized into the tumor cells in vivo after intravenous administration, indicating that DIP successfully enhanced nanoparticles internalization efficacy into tumor cells in vivo. This work establishes Ser–Glu to be a new tumor-targeting ligand and provides a promising tool for future tumor diagnostic or therapeutic applications.
Keywords: imaging, pancreatic cancer, PEPT1 transporter, Ser–Glu, target ligand
Introduction
Nanoparticles (NPs) are an emerging field that offers great prospect for cancer imaging and therapy.1–4 Owing to the enhanced permeability and retention effect, NPs show a higher accumulation in tumor sites than in normal tissues after intravenous injection.5 In recent years, active target moieties have been engineered to improve NPs specificity to tumor.6–8 Although many ligands demonstrate highly specific targeting ability in vitro, only a small number of them practically enhance the tumor accumulation of systemically administered NPs.9–15 This limitation has inspired attempts to develop ligands for tumor-targeted applications with high efficiency.
Peptides are amino acid sequences with less than approximately 50 residues. Because of its simpler structures and smaller molecular sizes, it has enhanced stability and easier conjugation as well as better resistance to environment.16 In peptides functionalized NP fields, RGD (arginine–glycine–aspartic acid) peptide family maybe the most widely applied peptide ligand, which can specifically bind to cancer overexpressed αvβ3 integrin receptors.17,18
Peptide transporter 1 (PEPT1) is a member of peptide transporters.19 Under healthy conditions, PEPT1 restrictedly existed in the epithelial cells of small intestine, kidney and bile duct, and nuclei and lysosomes of pancreas.20,21 Interestingly, PEPT1 was reported to be expressed in some human cancer cell lines such as pancreatic cancer AsPC-1,22 hinting the possibility that PEPT1 is a positive tumor biomarker. In the previous study, PEPT1 was used to target and inhibit cancer.23,24 Recently, a dipeptide Ser–Glu was identified to have high affinity and specificity with PEPT1.25 Further, Ser–Glu with a smaller molecular size may result in little characteristic alteration of NPs after conjugation. Based on these clues, we propose that specific recognition and binding between Ser–Glu and PEPT1 might provide a biological base for designing a new ligand for tumor-targeted applications.
In this work, PEPT1 was tested as a remarkable biomarker in pancreatic cancer cells comparing with normal cells. The dipeptide Ser–Glu (DIP), as a specific PEPT1 ligand, was conjugated with polymer-based fluorescence NPs to form DIP-functionalized nanoparticles (NPs-DIP). NPs-DIP were evaluated in pancreatic cancer target imaging both in vitro and in vivo.
Materials and methods
Materials
Poly[2-methoxy-5-(2-ethylhexyloxy)-1,4-phenylenevinylene] (MEH-PPV; MW: 168,000 Da, 536512), silicon 2,3-naph-thalocyaninebis (trihexylsilyloxide) (NIR775, 389935), dipeptide Ser–Glu and Trp–Gly were purchased from Sigma-Aldrich (St Louis, MO, USA). PS-PEG-COOH (P15019-SEOCOOHcomb) was purchased from Polymer Source (Quebec, Canada). All other chemicals were purchased from Sigma-Aldrich unless otherwise noted.
Synthesis of NPs
Fluorescence NPs were prepared using a nanoscale precipitation technique with some modifications.26 Briefly, a solution of tetrahydrofuran (THF) consisting of 60 μg/mL of PS-PEG-COOH, 40 μg/mL of MEH-PPV, and 0.6 μg/mL of NIR775 dye was initially prepared. Under vigorous sonication, each 2.5 mL of the mixture was then quickly dispersed into 5 mL of millipore water. Extra THF was evaporated under vacuum. The THF-free NPs solution was filtered through a 0.22 μm filter. Bioconjugation was processed with carbodiimide chemistry between the amino groups exposed on Ser–Glu and the carboxyl groups on the NPs. In a typical conjugation reaction, 100 μL of 4-(2-hydroxyethyl)-1-piperazineethanesulfonic acid buffer (1 M) was added to 4.5 mL of NPs liquid (55.6 μg/mL), then N-(3-Dimethylaminopropyl)-N′-ethylcarbodiimide hydrochloride (EDC) (14 mg) and N-Hydroxysuccinimide (NHS) (17 mg) were added. The reaction was processed for 1 hour. Subsequently, 200 μL of Ser–Glu solution (12 mg/mL) was added to the aforementioned mixture and stirred for 1 hour at 28°C. Uncoupled Ser–Glu combined with excess EDC and NHS was removed by several washes using a 100 kDa Amicon Ultra filter-4 (Millipore Corporation) under centrifugation at 3,000 rpm for 15 minutes at 4°C. The final complex was kept at 4°C.
Characterization of nanoparticles
The morphology and size of the NPs were measured by transmission electron microscopy (JEM-1400, JEOL, Japan). The hydrodynamic size of the NPs was tested by dynamic light scattering (DLS) using a Zetasizer NanoZS Instrument (Malvern Instruments, UK). The absorption and fluorescence spectra were analyzed using a SpectraMax (M5, Molecular Devices, Sunnyvale, CA, USA).
Cell culture
Human pancreatic cancer cell line AsPC-1 was obtained from the Cell Bank of the Chinese Academy of Sciences (Shanghai, People’s Republic of China). Human embryonic kidney cell line HEK 293 was maintained in our laboratory. Cells were grown in Dulbecco’s Modified Eagle’s Medium (DMEM) medium supplemented with 10% (vol/vol) fetal bovine serum (FBS, Gibco®, Thermo Fisher Scientific, Waltham, MA, USA). They were kept in culture flasks (Corning) and maintained in incubators at 37°C with 5% (vol/vol) CO2 and 95% relative humidity. This study was approved by the ethics Committee of East China University of Science and Technology.
Isolation and culture of kidney epithelial cells
The kidneys were separated from BALB/c fetal mice at 2-months-old. After several rounds of washes with phosphate-buffered saline (PBS), tissues were dissected into 1 mm3 pieces and transferred to centrifuge tubes containing the cell culture medium. Centrifugation for 5 minutes at 1,000 rpm was performed three times to separate tissue from waste and most of the cell culture media. Then, the tissues were transferred to the digestion solution containing cold trypsin (ten fold volume of tissue) and incubated for 12 hours at 4°C. Then, PBS/10% FBS was added to stop the trypsination followed by pipetting until the clumps were completely dissolved. Centrifugation again to separate cells from tissue pieces and waste. The rest was resuspended in growth medium (DMEM/F12 containing 10% FBS) and transferred into six-well plates. After 30 minutes, the medium containing kidney epithelial cells (KECs) was transferred to other six-well plates. After isolated KECs reached 80% confluency, the cells were passaged two times before the experiments were performed.
Isolation and culture of intestine epithelial cells
The intestine was separated from BALB/c fetal mice at approximately 18 days of age. After washes with PBS, tissues were dissected into 1 mm3 pieces. Centrifugation for 3 minutes at 1,000 rpm was performed to separate tissue from debris and media. Then, the tissues were shifted to the digestion solution containing 5 mL thermolysin (50 μg/mL, Sigma-Aldrich) and incubated for 30 minutes at 37°C. Subsequently, 5 mL PBS/10% FBS was added to stop the trypsination and centrifuged again. The rest was resuspended in the growth medium (DMEM/F12 supplemented with 10% FBS, 0.01 mg/L epidermal growth factor (EGF), 0.65 mg/L glutamine, and 5 mg/L insulin) and placed into six-well plates. After 90 minutes, the medium containing intestine epithelial cells (IECs) was transferred to other six-well plates. After isolated IECs reached 80% confluency, the cells were passaged one or two times before the experiments were carried out.
Cell binding analysis by flow cytometry
Cell binding assays were measured using a FACSCalibur flow cytometer (Becton Dickinson, Franklin Lakes, NJ, USA). Human pancreatic cancer cell line AsPC-1 and human embryonic kidney cell line HEK 293 were seeded at 3×10⁵ cells/well. After incubation for 24 hours, cells were cultured by replacement with fresh medium containing NPs for indicated time and concentrations. To investigate the PEPT1-mediated interaction of NPs-DIP with the cancer cells, NPs-DIP incubation was performed in the presence and absence of Trp-Gly (20 mM), an inhibitor of PEPT1. After incubation for 12 hours, the culture medium was removed, and cells were washed two times with PBS. Then, cells were detached using trypsin and gathered in centrifugal tubes for centrifugation (3 minutes, 1,000 rpm). Subsequently, cells were washed and centrifuged again and re-suspended in PBS. Finally, cell fluorescence signal was tested by flow cytometry (excitation: 488 nm, emission: 780/60 nm).
Nanoparticles localization in cells observed by confocal microscope
AsPC-1 cells were seeded onto sterilized coverslips in 12-well plates at a density of 1.5×10⁵ cells/well, and were incubated for 24 hours. Cells were then washed with PBS and incubated in media containing NPs (6 μg/mL) at 37°C. After indicated time, cells were washed with PBS and fixed with a fixative solution for 10 minutes at room temperature. Subsequently, 4′,6-diamidino-2-phenylindole (DAPI) was used to stain the nuclei. After washing with PBS for two times, the coverslips were mounted onto slides. All the samples were imaged with a confocal laser scanning microscope (A1R, Nikon, Tokyo, Japan) (DAPI, excitation: 405 nm, emission: 450/50 nm; NPs, excitation: 561 nm, emission: 595/50 nm).
Quantitative real-time PCR
To verify PEPT1 gene expression in cancer cells compared with normal cells, real-time reverse transcription PCR (RT-PCR) was performed using the Applied Biosystems ABI Prism 7500 Detection System (Thermo Fisher Scientific) according to the manufacturer’s protocol. The total mRNA from cellular samples was extracted with the TRIzol lysis reagent (Invitrogen, Shanghai, China). First-strand cDNA was synthesized from 1 μg of the total extracted mRNA and was as the template for target genes with related gene primers (Table 1). RT-PCR thermal cycling conditions for all reactions were 95°C for 15 minutes followed by 40 cycles of 95°C for 5 seconds, 60°C for 20 seconds, and 72°C for 20 seconds. All RT-PCR reactions were conducted using three biological replicates. The data for each sample were expressed relative to the expression levels of β-actin using the 2−ΔΔCT calculation method.27
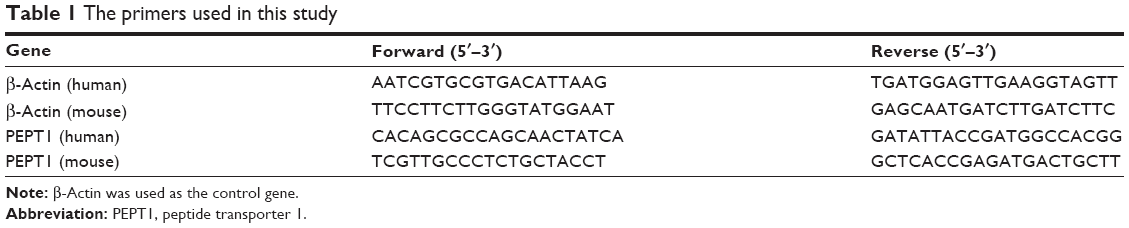 | Table 1 The primers used in this study |
Cytotoxicity assay
Cytotoxicity in the targeted AsPC-1 cancer cells was measured by 3-(4,5-dimethylthiazol-2-yl)-2,5-diphenyltetrazolium bromide (MTT) assay. Cells were seeded in 96-well plates 24 hours prior to the experiment. The medium was replaced by fresh medium containing NPs at varying concentrations, and cells were incubated for another 24 hours. Subsequently, 10 μL MTT (5 mg/mL) was added to the corresponding well of the 96-well plate and incubated for 4 hours. Finally, 100 μL 10% sodium dodecyl sulfate was added to each well and incubated overnight at 37°C. The absorbance at 570 nm was measured using a SpectroMax (M5, Molecular Devices).
Tumor implantation
All animal experiments were approved by the Experimental Animal Management and Ethics Committees of Shanghai Jiaotong University School of Pharmacy. AsPC-1 cells (1.5×10⁶ cells per site) was injected subcutaneously into the right shoulder of 5- to 6-week-old female nude mice. When the tumors reached the size of 0.3–0.6 cm in diameter (approximately 2–3 weeks after implantation), the tumor-bearing mice were intravenously injected with NPs (each at 60 μg) for imaging studies.
In vivo and ex vivo imaging analysis
In vivo fluorescence imaging was investigated with In-Vivo Multispectral System FX (Kodak, Rochester, NY, USA). Images were obtained with an excitation filter of 490 nm and an emission filter of 790 nm. For ex vivo imaging, tumor-bearing mice were euthanized at 32 hours post-injection with NPs. The tumor and main organs including kidney, lung, heart, liver, and spleen were collected. They were imaged as described earlier using the In-Vivo Multispectral System FX (Kodak).
Immunohistochemistry assay
The tumor tissues were collected, washed with PBS, embedded in a tissue OCT-Freeze compound, and frozen using liquid nitrogen. Frozen samples were sectioned by microtome at −25°C into slices of 7 μm thickness, and then fixed in cold acetone for 10 minutes at 4°C. Nonspecific binding sites were blocked for 15 minutes with PBS containing 10% FBS. For α-tubulin staining, the sections were incubated with rabbit anti-α-tubulin antibody (dilution, 1:200) in 100 μL PBS containing 10% FBS for overnight at 4°C, and then 100 μL Alexa Fluor® 488 Goat Anti-Rabbit IgG (H+L) antibody (dilution, 1:1,000) was used to interact with primary antibody for 1 hour. Afterwards, the nuclei were stained with DAPI for 3–5 minutes. After each step, the sections were washed with PBS three or more times. The sections were imaged under a Nikon A1R confocal laser scanning microscope (DAPI, excitation: 405 nm, emission: 450/50 nm; anti-tubulin antibody, excitation: 488 nm, emission: 525/50 nm; NPs, excitation: 561 nm, emission: 595/50 nm).
Statistical analysis
The results were expressed in mean ± standard deviation (sd). Statistical analysis was evaluated by two-tailed Student’s t-test. A difference was considered to be statistically significant when P-value was <0.05.
Results and discussion
Identification of PEPT1 as a cancer biomarker
Although previous report has revealed that PEPT1 is expressed in pancreatic cancer cells,22 there is no evidence that expression of PEPT1 is significantly higher in cancer cells than in normal cells. To compare the expression level of PEPT1 in cancer cells with that in normal cells, AsPC-1 cells were used as the typical pancreatic cancer cell line. Initially, HEK 293 cells were used as the normal cells model. A remarkable upregulation (1,084-fold) of PEPT1 was found in AsPC-1 cells in contrast to HEK 293 cells (Figure 1A). It demonstrated that PEPT1 was a potential biomarker for pancreatic cancer. Furthermore, KECs and IECs were freshly prepared from healthy mice as more reliable normal cells. In all, 4,467- and 2,382-fold upregulation of PEPT1 were found in AsPC-1 compared with KECs and IECs, respectively (Figure 1B and C). These results confirmed that PEPT1 was a positive biomarker for pancreatic cancer, which has the potential as a new tumor target for NP applications.6
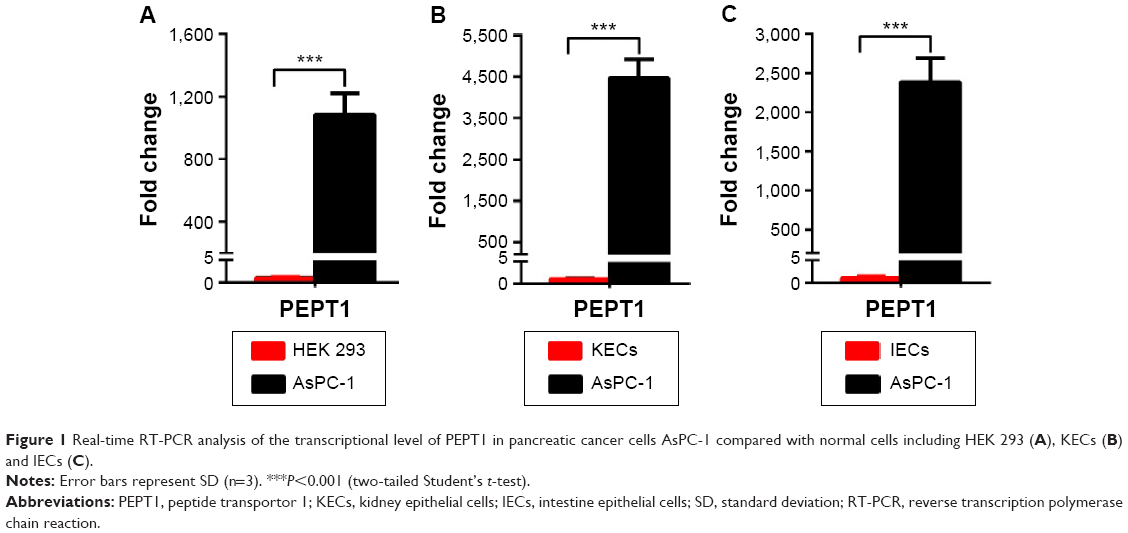 | Figure 1 Real-time RT-PCR analysis of the transcriptional level of PEPT1 in pancreatic cancer cells AsPC-1 compared with normal cells including HEK 293 (A), KECs (B) and IECs (C). |
Synthesis and characterization of NPs
In order to investigate whether Ser–Glu could guide NPs to human pancreatic cancer cells, the polymer-based fluorescent NPs were chosen as the NPs model.26 As outlined in Figure 2, MEH-PPV and near-infrared (NIR) fluorescent dye NIR775 were coated by polystyrene graft ethylene oxide functionalized with carboxyl groups (PS-PEG-COOH) to form NPs via a nanoprecipitation method. Fluorescence resonance energy transfer (FRET) between MEH-PPV and NIR775 could occur, which produced both a MEH-PPV emission peak and a NIR emission peak (Figure 2). Subsequently, Ser–Glu, as a specific PEPT1 ligand, was conjugated to NPs via carbodiimide chemistry (Figure 2).
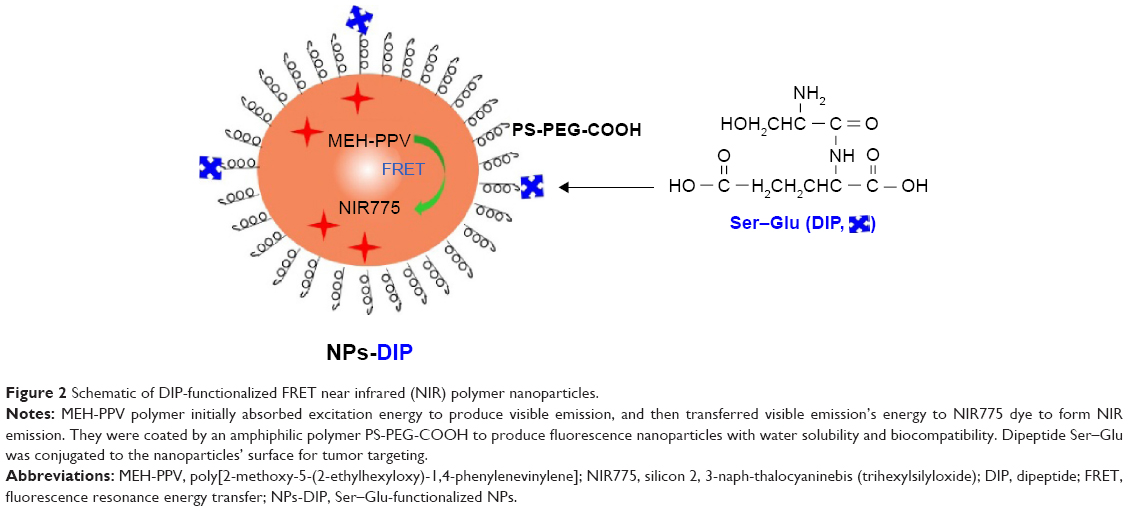 | Figure 2 Schematic of DIP-functionalized FRET near infrared (NIR) polymer nanoparticles. |
Observation of NPs using transmission electron microscopy (TEM) showed that both NPs-DIP and NPs were spherical (Figure 3A). Dynamic light scattering analysis demonstrated that the conjugation of Ser–Glu caused a minor increase in hydrodynamic size from 55.8 nm (NPs) to 59.1 nm (NPs-DIP) (Figure 3B). Besides, NPs-DIP exhibited a broad ultraviolet–visible band with a maximum at 501 nm, which was identical compared to NPs (Figure 3C). Under excitation at 494 nm, NPs-DIP showed a nearly identical emission spectral profile to that of NPs. Both a MEH-PPV emission peak at 595 nm and a NIR emission peak at 779 nm were detectable (Figure 3D). Together, these data confirmed that surface conjugation with the small molecular ligand Ser–Glu still contained the basic characteristics of NPs.
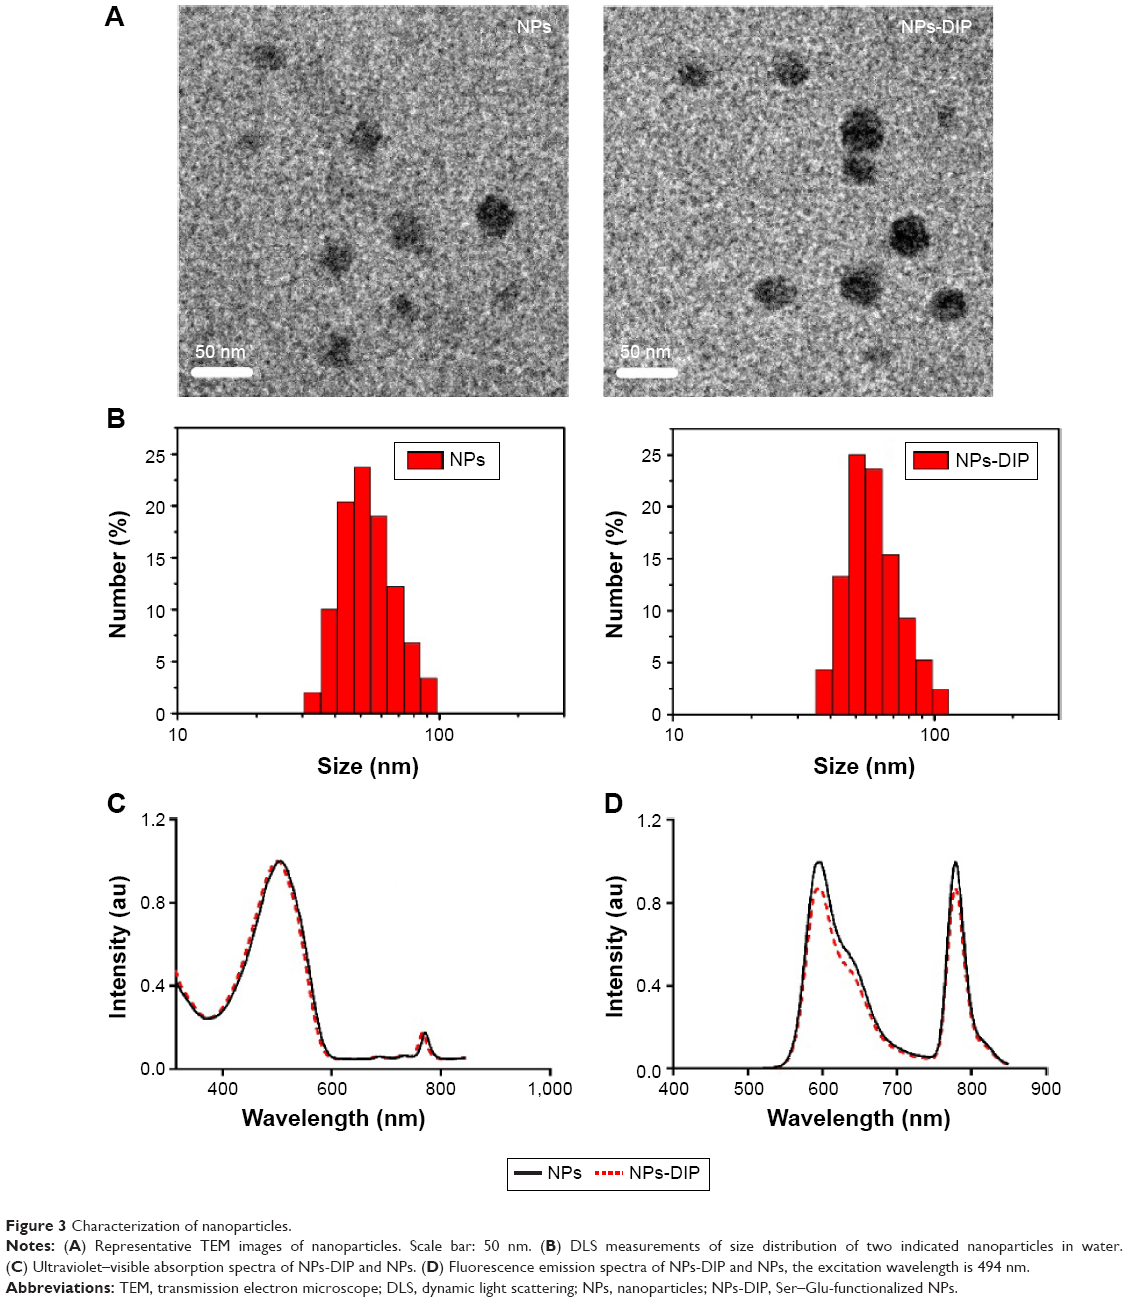 | Figure 3 Characterization of nanoparticles. |
In vitro analysis of AsPC-1 cells incubated with NPs-DIP
To evaluate cell binding behavior of dipeptide-functionalized NPs to pancreatic cancer cells AsPC-1, flow cytometry was adopted to quantify fluorescence signals in cells incubated with NPs. In AsPC-1 cells, a 11.3-fold increase of cell fluorescence intensity was detectable for NPs-DIP in contrast to NPs (Figure 4A). In HEK 293 cells, only a negligible binding increase of NPs-DIP compared with NPs was identified (Figure 4A). These data suggest that a selective binding of NPs to pancreatic cancer cells via guidance of Ser–Glu was indeed feasible. Furthermore, Trp-Gly, a competing inhibitor for PEPT1,28 significantly suppressed the targeting of NPs-DIP to AsPC-1 cells (Figure 4B). This result indicated that PEPT1 was involved in the targeting behavior of NPs-DIP in pancreatic cancer cells.
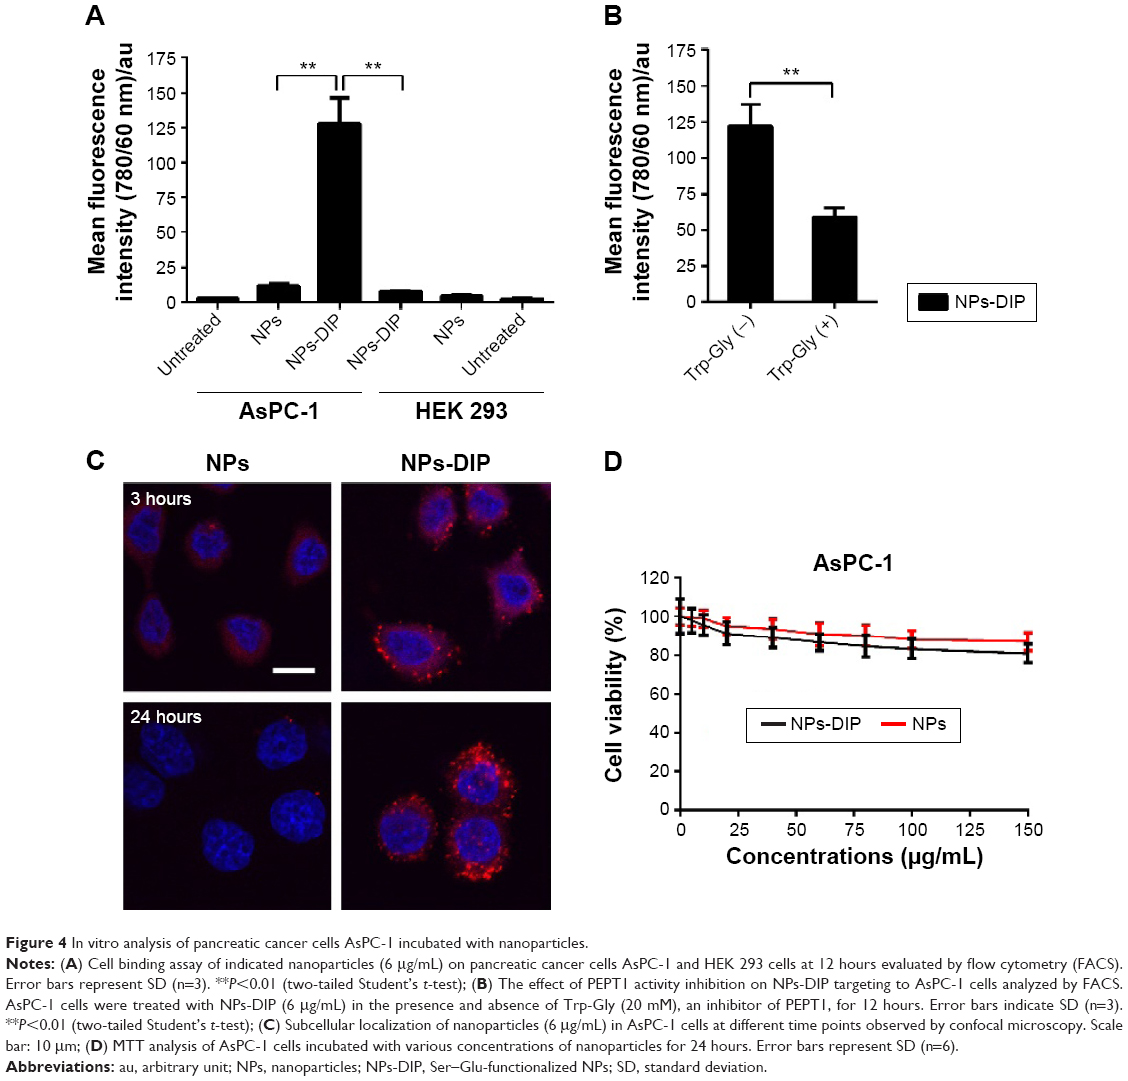 | Figure 4 In vitro analysis of pancreatic cancer cells AsPC-1 incubated with nanoparticles. |
A detailed insight into the interaction of NPs-DIP with AsPC-1 cells was further studied by a confocal laser scanning microscope. At 3 hours postincubation, NPs-DIP showed strong cell-associated fluorescence, which obviously located around the cell membrane. By contrast, non-modified NPs only displayed negligible interaction with AsPC-1 cells under the same conditions (Figure 4C). Upon the extended incubation time, targeted NPs were efficiently internalized into cells after 24 hours incubation, locating throughout the intracellular space except nuclei, while non-modified NPs always exhibited negligible fluorescence signal in AsPC-1 cells (Figure 4C).
Furthermore, to evaluate cytotoxicity of dipeptide modified NPs, cell viability determined by MTT was evaluated (Figure 4D). At a concentration of 0–150 μg/mL, NPs showed high cell viability in AsPC-1 cells, which is consistent with previous reports in U87MG cells.26 NPs-DIP demonstrated slighter reduced cell viability compared to NPs, which may be attributed to the enhanced targeting efficacy of the dipeptide modified NPs.
In summary, the in vitro characterization suggests that PEPT1 was a positive biomarker for pancreatic cancer cells compared with normal cells. Dipeptide Ser–Glu, via binding with PEPT1, could efficiently guide NPs to pancreatic cancer cells. With respect to target efficiency, it was better than LyP-1 peptide, which guided NPs to target to lymphatic tumor cells with a eight fold cellular uptake increase in contrast to non-targeted NPs.29 Ligand Ser–Glu shows the potential to be a new ligand choice for tumor targeting.
In vivo analysis of AsPC-1 tumor xenograft incubated with NPs-DIP
Limitation of a targeting ligand application is its specificity in living biological systems. To investigate whether dipeptide Ser–Glu can selectively guide NPs to pancreatic tumor in vivo, NPs-DIP or control NPs (each with 60 μg NPs) were intravenously injected into nude mice bearing a pancreatic AsPC-1 tumor (tumor size of approximately 0.3 cm in diameter). The targeted NPs were significantly accumulated in the tumors 20 hours post-injection (Figure 5A), and the tumor-to-background ratio was recorded as 4.98 at 20 hours and 2.58 at 32 hours (Figure 5B). In contrast, no significant NIR fluorescence signal was observed in the tumor site of the non-targeted NPs group (Figure 5A), and the tumor-to-background ratio was 1.43 (20 hours) and 1.18 (32 hours) (Figure 5B). These data clearly suggest that dipeptide Ser–Glu remarkably promoted an active targeting for NPs to pancreatic tumor in vivo. Furthermore, ex vivo fluorescence imaging of excised normal organs and tumors from mice euthanized at 32 hours post-injection revealed obvious differences between NPs-DIP and NPs groups in NPs biodistribution (Figure 5C). With the calculation methods reported previously,30 significantly increased NPs accumulation in the tumor site was discovered for NPs-DIP compared with NPs. Meanwhile, varying degrees of decreased accumulation of NPs in normal organs were found in the NPs-DIP group in contrast to the NPs group (Figure 5D). These results clearly confirmed that NPs-DIP successfully targeted to pancreatic tumor xenograft in living nude mice.
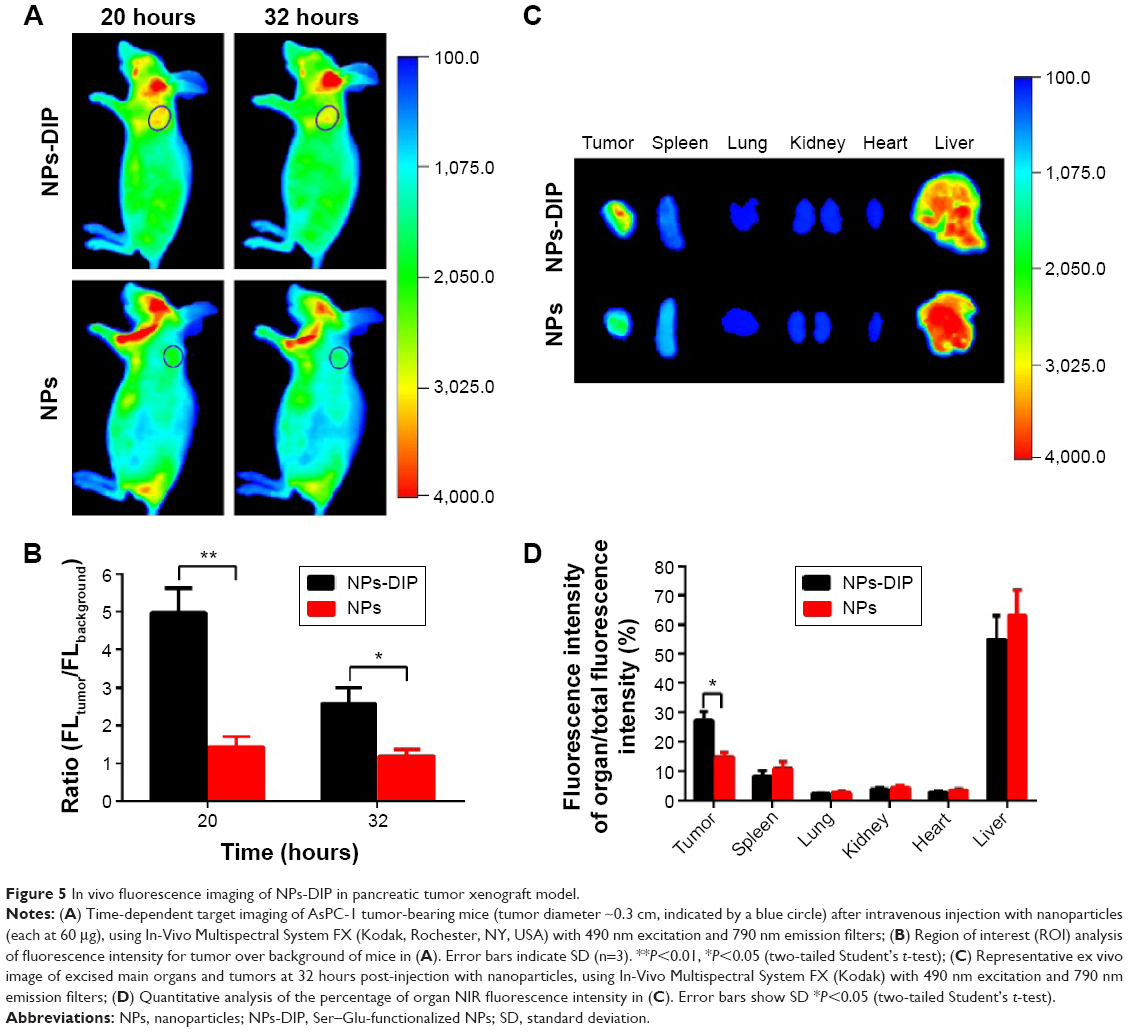 | Figure 5 In vivo fluorescence imaging of NPs-DIP in pancreatic tumor xenograft model. |
To further analyze localization of NPs within the pancreatic tumor xenograft, the tumors from mice euthanized at 32 hours post-injection were collected for immunohistochemical staining. The cytoskeleton protein alpha (α)-tubulin was stained in green fluorescence with Alexa Fluor 488-conjugated anti-α-tubulin antibody (Figure 6III and III′). NPs-DIP were specifically delivered to the tumor site (Figure 6IV) and co-localized with α-tubulin by exhibiting merged yellow signals in the pancreatic tumor cells (Figure 6I, indicated by white arrow), whereas NPs showed low fluorescence signals both in red (Figure 6IV′) and in yellow (Figure 6I′) in the tumor site. These findings clearly suggest that dipeptide Ser–Glu modification promoted internalization of NPs into pancreatic tumor cells in vivo.
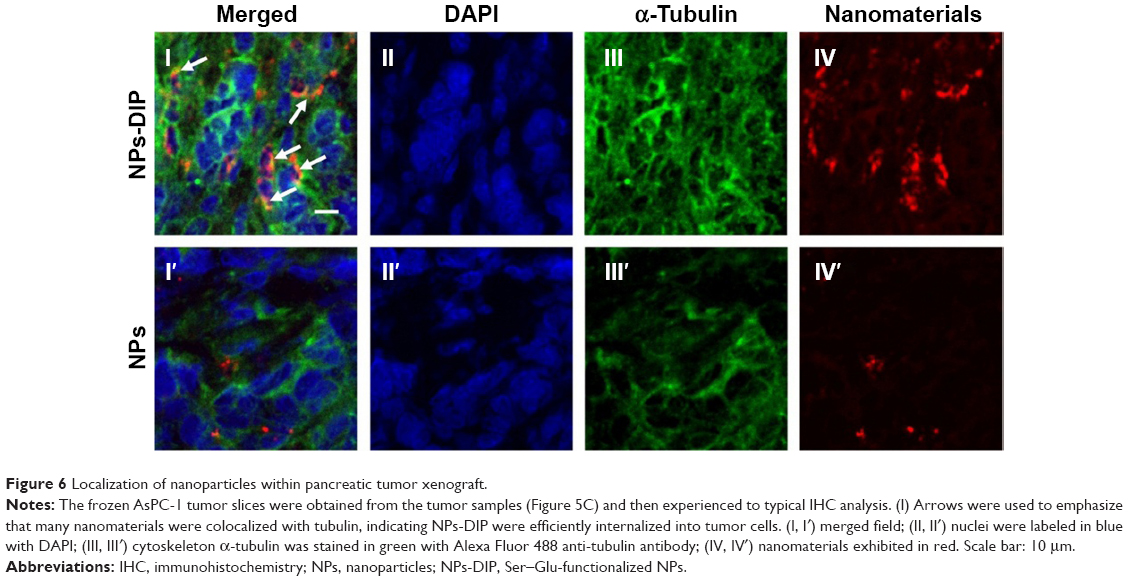 | Figure 6 Localization of nanoparticles within pancreatic tumor xenograft. |
Conclusion
In summary, we have reported that PEPT1 was a remarkable positive biomarker in pancreatic cancer cells compared with varied normal cells. Dipeptide Ser–Glu was developed to be a new small molecule targeting moiety, which could efficiently guide NPs to pancreatic cancer cells AsPC-1. More importantly, Ser–Glu-conjugated NPs exhibited active targeting in pancreatic tumor xenografts in vivo, indicating a future potential preclinical diagnosis or therapy. To our present knowledge, systematic evaluation of dipeptide Ser–Glu as a cancer target ligand for NPs delivery has not been reported before.
Acknowledgment
This work was supported by the National Special Fund for State Key Laboratory of Bioreactor Engineering, Grant No 2060204.
Disclosure
The authors report no conflicts of interest in this work.
References
Wang AZ, Langer R, Farokhzad OC. Nanoparticle delivery of cancer drugs. Annu Rev Med. 2012;63:185–198. | ||
Ferrari M. Cancer nanotechnology: opportunities and challenges. Nat Rev Cancer. 2005;5(3):161–171. | ||
Shao Z, Shao J, Tan B, et al. Targeted lung cancer therapy: preparation and optimization of transferrin-decorated nanostructured lipid carriers as novel nanomedicine for co-delivery of anticancer drugs and DNA. Int J Nanomed. 2015;10:1223. | ||
Prabhu RH, Patravale VB, Joshi MD. Polymeric nanoparticles for targeted treatment in oncology: current insights. Int J Nanomed. 2015;10:1001. | ||
Maeda H. The link between infection and cancer: tumor vasculature, free radicals, and drug delivery to tumors via the EPR effect. Cancer Sci. 2013;104(7):779–789. | ||
Chen H, Zhen Z, Todd T, Chu PK, Xie J. Nanoparticles for improving cancer diagnosis. Mater Sci Eng Reports. 2013;74(3):35–69. | ||
Noble GT, Stefanick JF, Ashley JD, Kiziltepe T, Bilgicer B. Ligand-targeted liposome design: challenges and fundamental considerations. Trends Biotechnol. 2014;32(1):32–45. | ||
Hu M, Zhang K. The application of aptamers in cancer research: an up-to-date review. Future Oncol. 2013;9(3):369–376. | ||
Kirpotin DB, Drummond DC, Shao Y, et al. Antibody targeting of long-circulating lipidic nanoparticles does not increase tumor localization but does increase internalization in animal models. Cancer Res. 2006;66(13):6732–6740. | ||
Choi CHJ, Alabi CA, Webster P, Davis ME. Mechanism of active targeting in solid tumors with transferrin-containing gold nanoparticles. Proc Natl Acad Sci. 2010;107(3):1235–1240. | ||
Xiao Y, Lin ZT, Chen Y, et al. High molecular weight chitosan derivative polymeric micelles encapsulating superparamagnetic iron oxide for tumor-targeted magnetic resonance imaging. Int J Nanomed. 2015;10:1155. | ||
Liu Y-R, Guan Y-Y, Luan X, et al. Delta-like ligand 4-targeted nanomedicine for antiangiogenic cancer therapy. Biomaterials. 2015;42:161–171. | ||
Gianella A, Jarzyna PA, Mani V, et al. Multifunctional nanoemulsion platform for imaging guided therapy evaluated in experimental cancer. ACS Nano. 2011;5(6):4422–4433. | ||
Chattopadhyay N, Fonge H, Cai Z, et al. Role of antibody-mediated tumor targeting and route of administration in nanoparticle tumor accumulation in vivo. Mol Pharm. 2012;9(8):2168–2179. | ||
Prokopiou E, Ryder SA, Walsh J. Tumour vasculature targeting agents in hybrid/conjugate drugs. Angiogenesis. 2013;16(3):503–524. | ||
Bertrand N, Wu J, Xu X, Kamaly N, Farokhzad OC. Cancer nanotechnology: the impact of passive and active targeting in the era of modern cancer biology. Adv Drug Deliv Rev. 2014;66:2–25. | ||
Kamaly N, Xiao Z, Valencia PM, Radovic-Moreno AF, Farokhzad OC. Targeted polymeric therapeutic nanoparticles: design, development and clinical translation. Chemical Soc Rev. 2012;41(7):2971–3010. | ||
Chen Z, Deng J, Zhao Y, Tao T. Cyclic RGD peptide-modified liposomal drug delivery system: enhanced cellular uptake in vitro and improved pharmacokinetics in rats. Int J Nanomed. 2012;7:3803. | ||
Mitsuoka K, Miyoshi S, Kato Y, et al. Cancer detection using a PET tracer, 11C-glycylsarcosine, targeted to H+/peptide transporter. J Nucl Med. 2008;49(4):615–622. | ||
Herrera-Ruiz D, Knipp GT. Current perspectives on established and putative mammalian oligopeptide transporters. J Pharm Sci. 2003;92(4):691–714. | ||
Bockman DE, Ganapathy V, Oblak TG, Leibach FH. Localization of peptide transporter in nuclei and lysosomes of the pancreas. Int J Pancreatol. 1997;22(3):221–225. | ||
Gonzalez DE, Covitz K-MY, Sadée W, Mrsny RJ. An oligopeptide transporter is expressed at high levels in the pancreatic carcinoma cell lines AsPc-1 and Capan-2. Cancer Res. 1998;58(3):519–525. | ||
Mitsuoka K, Kato Y, Miyoshi S, et al. Inhibition of oligopeptide transporter suppress growth of human pancreatic cancer cells. Eur J Pharm Sci. 2010;40(3):202–208. | ||
Landowski CP, Vig BS, Song X, Amidon GL. Targeted delivery to PEPT1-overexpressing cells: acidic, basic, and secondary floxuridine amino acid ester prodrugs. Mol Cancer Therap. 2005;4(4):659–667. | ||
Zhang L, Zhang L, Luo T, Zhou J, Sun L, Xu Y. Synthesis and Evaluation of a Dipeptide–Drug Conjugate Library As Substrates for PEPT1. ACS Combinat Sci. 2012;14(2):108–114. | ||
Xiong L, Shuhendler AJ, Rao J. Self-luminescing BRET-FRET near-infrared dots for in vivo lymph-node mapping and tumour imaging. Nature Commun. 2012;3:1193. | ||
Schmittgen TD, Livak KJ. Analyzing real-time PCR data by the comparative CT method. Nature Protocols. 2008;3(6):1101–1108. | ||
Poirier A, Belli S, Funk C, et al. Role of the intestinal peptide transporter PEPT1 in oseltamivir absorption: in vitro and in vivo studies. Drug Metab Disposit. 2012;40(8):1556–1565. | ||
Luo G, Yu X, Jin C, et al. LyP-1-conjugated nanoparticles for targeting drug delivery to lymphatic metastatic tumors. Int J Pharmaceut. 2010;385(1):150–156. | ||
Namgung R, Lee YM, Kim J, et al. Poly-cyclodextrin and poly-paclitaxel nano-assembly for anticancer therapy. Nature Commun. 2014;5. |
 © 2016 The Author(s). This work is published and licensed by Dove Medical Press Limited. The full terms of this license are available at https://www.dovepress.com/terms.php and incorporate the Creative Commons Attribution - Non Commercial (unported, v3.0) License.
By accessing the work you hereby accept the Terms. Non-commercial uses of the work are permitted without any further permission from Dove Medical Press Limited, provided the work is properly attributed. For permission for commercial use of this work, please see paragraphs 4.2 and 5 of our Terms.
© 2016 The Author(s). This work is published and licensed by Dove Medical Press Limited. The full terms of this license are available at https://www.dovepress.com/terms.php and incorporate the Creative Commons Attribution - Non Commercial (unported, v3.0) License.
By accessing the work you hereby accept the Terms. Non-commercial uses of the work are permitted without any further permission from Dove Medical Press Limited, provided the work is properly attributed. For permission for commercial use of this work, please see paragraphs 4.2 and 5 of our Terms.