")
Back to Journals » International Journal of General Medicine » Volume 14
A National Survey of Attitudes and Practices of Physicians Relating to Therapeutic Drug Monitoring and Clinical Pharmacokinetic Service: Strategies for Enhancing Patient’s Care in Saudi Arabia
Authors Alrabiah Z , Alwhaibi A , Alsanea S , Alanazi FK, Abou-Auda HS
Received 10 December 2020
Accepted for publication 19 February 2021
Published 23 April 2021 Volume 2021:14 Pages 1513—1524
DOI https://doi.org/10.2147/IJGM.S296731
Checked for plagiarism Yes
Review by Single anonymous peer review
Peer reviewer comments 2
Editor who approved publication: Dr Scott Fraser
Ziyad Alrabiah,1,* Abdulrahman Alwhaibi,1,* Sary Alsanea,2 Fars K Alanazi,3 Hisham S Abou-Auda1
1Department of Clinical Pharmacy, College of Pharmacy, King Saud University, Riyadh, 11451, Saudi Arabia; 2Department of Pharmacology and Toxicology, College of Pharmacy, King Saud University, Riyadh, Saudi Arabia; 3Kayyali Chair for Pharmaceutical Industries, Department of Pharmaceutics, College of Pharmacy, King Saud University, Riyadh, Saudi Arabia
*These authors contributed equally to this work
Correspondence: Hisham S Abou-Auda Email [email protected]
Purpose: The aim of the study was to evaluate physicians’ perception of the concept of pharmacokinetics and therapeutic drug monitoring (PK/TDM) and their use in clinical practice.
Methods: A novel, structured, self-administered questionnaire was designed, validated and distributed to physicians in 3 major cities in Saudi Arabia (Riyadh, Jeddah, Dammam) during a 4-month period. Data were collected on demographics, knowledge and practice of PK/TDM. Attitudes toward integrating these skills into daily clinical practice were also investigated.
Results: A total of 724 physicians completed the survey and included in the study. European and North American physicians were found to be more exposed to PK/TDM than other physicians. About 70% of the participants stated that they have applied PK/TDM in their practice, at least, once and most of these were consultants. Only 4.3% of respondents had never checked organ function prior to prescribing narrow therapeutic index drugs. Although the majority (78.4%) perceived PK/TDM as very important to their practice, only 35.3% have tried to calculate drug PK parameters for their patients when necessary.
Conclusion: The result of this study showed that the knowledge of physicians about PK/TDM was inadequate. Moreover, the utilization of competent clinical pharmacists trained in PK/TDM was low. An interdisciplinary educational program between the physicians and pharmacist in PK/TDM will lead to a better health care outcome.
Keywords: physicians, knowledge, therapeutic drug monitoring, pharmacokinetic parameters
Introduction
The simplest definition of therapeutic drug monitoring (TDM) is «the measurement of the drug concentration in biological fluids (eg, blood, plasma, serum or urine) to determine whether a drug level is below or above the therapeutic range in patients for the purpose of optimizing their therapeutic effect while minimizing adverse effects».1–4 TDM is a system of quality assurance of a drug management system, aiming to give the right drug to the right patient in the right dose in order to obtain the right effect.5 It involves tailoring a dosage regimen to an individual patient through maintaining blood or plasma level of the drug within the therapeutic range or window. It is defined in terms of concentrations where concentrations below the minimum effective concentration (MEC) are considered «subtherapeutic» and concentrations higher than the minimum toxic concentration (MTC) will produce side effects.5
Although the majority of drugs do not require TDM, there are certain scenarios where TDM becomes very crucial and must be applied including:5 (a) drugs with narrow therapeutic ranges; (b) drugs that exhibit a wide pharmacokinetic interindividual variability; (c) drugs in which target concentrations are difficult to monitor; (d) for patients who have impaired clearance of a drug with a narrow therapeutic index; (e) drugs whose toxicity is difficult to distinguish from patient’s underlying disease (eg, patients with chronic obstructive pulmonary disease who are taking theophylline); (f) drugs that are difficult to establish their efficacy (eg, phenytoin) due to their nonlinear pharmacokinetics;6 (g) sometimes TDM is indicated to confirm affective dose, to monitor patient’s compliance; (h) to seek causes of therapeutic failure that usually arises from highly variable pharmacokinetics due to satiable elimination, genetic factors (eg, poor metabolizers), the presence of concurrent diseases and/or multiple drug therapies (or interacting drugs), eg, quinidine decreases the clearance of digoxin;7 and (i) when social habits and life style may affect the pharmacokinetics of the drug (eg, smoking, alcohol).
In many situations, for some drugs to be effective and non-toxic, TDM should be instituted to ensure that the patient maintains a concentration of drug in his/her system within therapeutic range.8 This remains the essential underlying value for conducting TDM for both the clinician and the patient alike. It is worth mentioning that the scope of TDM is not limited to determination of blood or plasma concentration of the drug, other factors that may affect the results should be taken into consideration. For example, a concentration of a drug such as digoxin that would be normally therapeutic could be toxic if the patient also has hypokalemia.4,9,10 In addition, the most relevant contribution of TDM to clinical care is the differentiation of drug-induced toxicity from other symptomatology and poor drug response from non-compliance.11 Many educational strategies for physicians regarding the efficient utilization of TDM and clinical pharmacokinetics service have been discussed.12
Nearly 95% of hospitals in the United States have pharmacists routinely monitor serum medication concentration or their surrogate markers.13 In the majority of these hospitals, pharmacists have the authority (by protocol) to order an initial serum medications concentration, and to adjust the dosage of these medications if necessary. In contrast, pharmacokinetic services are provided in only one-third of the Saudi hospitals.14
A systematic search was conducted to identify any existing validated questionnaire that could be used for the purpose of this study. None was found. Accordingly, a 46-item questionnaire was designed using the general principles of survey design.15,16
This study is a national survey that sought to determine the degree to which physicians in the Kingdom of Saudi Arabia (KSA) actually practicing these basic clinical competencies that are needed for patient’s care when prescribing or modifying a dose or dosage regimen. We also surveyed the prescribing-related attitudes of these physicians to help identifying those educational strategies most likely to increase the awareness and attention paid to clinical pharmacokinetic service and therapeutic drug monitoring in the day-to-day medical practice.
Methods
Since no instrument existed to capture data on the variables of interest, a self-administered, six-page questionnaire was designed for distribution to 1000 physicians in 3 major cities in Saudi Arabia (Riyadh, Jeddah and Dammam). Since surveying physicians in all regions of the kingdom was cost prohibitive, the researcher elected to conduct the study in only 3 major cities with the largest proportion of practicing physicians. The front page of the questionnaire was a cover letter signed by the investigator explaining the purpose of the study and containing instructions on how to administer the questions. The questionnaire, in its three sections, consisted of 46 questions of varied format (124 items), including multiple-choice responses, checklists and open and closed-ended questions. A pilot study was conducted on 20 physicians in Riyadh prior to its final implementation to ensure that the final version of the questionnaire was clear, understandable and feasible for use, and refinements were made accordingly before distribution to the intended sample group. The study was conducted during a 4-month period. These were analyzed separately at a later date and it was determined that they would not affect the results. The study was approved by the College of Pharmacy, King Saud University institutional review broad in Riyadh. Data were collected following the basic principles of research ethics. All participation was voluntary and confidential, and respondents were assured anonymity and that only the aggregate data will be reported. Informed consent was obtained from all the participants of this study.
The questionnaire consisted of three parts:
- A demographic section. Respondents were asked to provide their age, sex, nationality, medical degree, country of graduation, specialty, place of work, total years of practice and years of practice in KSA.
- Knowledge of Pharmacokinetics and Therapeutic Drug Monitoring (PK/TDM) services. All respondents were asked whether they had a course in PK/TDM during medical training and if they have ever integrated that in their medical practice. This section contained questions about their knowledge of pharmacokinetic parameters that they rely on when they have to prescribe or modify the dose or dosage regimen for their patients. For this purpose, three checklists were constructed to include pharmacokinetic parameters, actions before prescribing a dose and drug classes that they usually use TDM for.
- Attitude towards the practice of PK/TDM section. This section was designed to reveal physicians’ actual practice and attitudes toward TDM. It contained 8 checklists. Also, two 5-point Likert scale tables were used to determine the degree of agreement with attitudinal statements in which respondents were required to choose one of five alternatives from “strongly agree” to “strongly disagree” for each statement.
Statistical Analysis
Responses to each question were coded individually, and data were analyzed as a single cohort or with stratification by the type of practice, specialty of the physician, age, gender and workplace. The statistical software package SPSS was used for all analyses (IBM Corp. Released 2020. IBM SPSS Statistics for Windows, Version 27.0. Armonk, NY: IBM Corp). Monte Carlo simulation for Parallel Analysis was carried out by a computer utility developed by Marley W. Watkins.17
Results were analyzed and, depending on the type of data, appropriate statistical tests were used for comparisons (eg, an unpaired t-test or one-way ANOVA was used to compare continuous variables such as age). For data that were not normally distributed, either the Wilcoxon rank sum or Mann–Whitney U-test was used. The chi-square and Fisher exact tests were used to assess the differences in case of discrete variables. Agreement among responses of physicians was assessed using the Kendall-tau rank correlation, Spearman rho test and kappa statistic. Additional analyses (eg, analysis of variance and Kruskal–Wallis tests) were used when appropriate. If the question of data normality arose (based on a probability plot, Shapiro–Wilk test and/or Kolmogorov–Smirnov test), log-transformed data were used followed by a parametric test. Otherwise, a nonparametric alternative was used. Homoscedasticity and heteroscedasticity were tested by both plotting the residuals and Breusch-Pagan test. In addition, binary logistic regression was used to explore the effect of independent variables (usually demographics) on the agreement among physicians about their responses to various issues. On the other hand, multivariate logistic regression was used to investigate an ordinal variable, such as those variables involve rating of an item, on one or more explanatory variables. Multilevel logistic regression analysis was further utilized to calculate odds ratios (OR) with 95% confidence intervals (CI). Because of the large number of statistical comparisons, which increases the chance of type I error, the results were considered significant at the p<0.01 level (two-tailed) rather than the customary 0.05 level except where these comparisons are limited.
Questionnaire Validation
For the assessment of reliability of the new survey instrument and its construct validity, exploratory factor analysis (EFA) was initially performed to examine the internal structure of the 3 sections of the questionnaire.18,19 For the factor analysis to be adequate and sound, a sample size of a minimum 1:5 item-to-subject ratio must be maintained to ensure that the emerging factors are reliable. In addition, Bartlett’s test of sphericity should prove to be significant and Kaiser-Meyer-Olkin (KMO) test of sampling adequacy must have a value of 0.6 or more. In the next step, principal component analysis (PCA) and varimax rotation with Kaiser’s normalization were performed to explore the degree of correlation between the factors and variables. The Kaiser’s criterion based on eigenvalues and Scree plot was used for the calculation of number of factors that should be retained and how meaningfully the items loaded on factors.16,20 After all factors with eigenvalues greater than 1 were extracted using the default setting of SPSS, the correct number of factors retained was confirmed by Parallel Analysis (PA) using 100 replications of Monte Carlo simulations with datasets equal in size to our dataset.21 Items with the cut-off point of factor loading of 0.4 were grouped in one factor and domains were constructed.22 The questionnaire internal consistency and homogeneity of the scale was assessed using Cronbach’s reliability coefficient alpha statistic23,24 and item-to-total correlations. Reliability coefficient of 0.7 or more and item-to-total correlation above 0.25 indicate acceptable internal consistency of the survey instrument.16
Results and Discussion
Construct Validity and Reliability
The proposed sample size was 920 physicians to provide a subject-to-item ratio of 20:1, however, a smaller sample size was obtained due to the process of stratification. The total number of respondents who completed the questionnaire and included in the analysis was 724 physicians giving a satisfactory final subject-to-item ratio of 16:1 indicating about 80% accurate solution.25 The data were deemed suitable for factor analysis. A principal-component method-factor analysis with varimax rotation was performed on all attitudinal-item responses, with the use of standard-factor criteria. The Kaiser-Meyer-Olkin (KMO) measure of sampling adequacy was 0.776, above the recommended value of 0.6,26 and Bartlett’s test of sphericity was significant [χ2 (1653) = 7630.22, p < 0.001]. The diagonals of the anti-image correlation matrix were all over 0.5, supporting the inclusion of each item in the factor analysis. In addition, the communalities were all above 0.5, further confirming that each item shared some common variance with other items.
Results showed 10 factors with eigenvalues greater than 1, which accounted for 62.59% of the total variance. This was supported by Scree plot, which demonstrated a change in slope (elbow) from the larger to the smaller eigenvalues between the 10th and the 11th factor, suggesting a 10-factor solution. This finding was further supported by the results of simulation by Monte Carlo PCA for Parallel Analysis. The factor was significant since the associated eigenvalue was bigger than the mean of those obtained from the random uncorrelated data (6.119 vs 1.5962). Two of the resulting ten factors accounted for smaller than 3% of the total variance and only two items loaded greater than 0.5 on each of these factors, so they were dropped. Items with factor loading of 0.5 and above were grouped into one factor and domains were constructed. The items that comprised each of the remaining 8 factors were then analyzed for reliability (internal consistency) by using the Cronbach’s coefficient alpha statistic. The resulting alpha coefficient was 0.733 suggesting an evidence of high reliability and good internal consistency.
Demographic Characteristics
A total of 742 physicians (response rate 74.2%) completed the questionnaire and gave permission to publish their responses. Eighteen questionnaires were excluded from the sample because their responses were incomplete and the remaining 724 questionnaires were included for analysis. The net response rate was 72.4%. Table 1 shows, the age group, gender, workplace, total years of experience and length of employment in the current workplace. The characteristics of the surveyed physicians are presented to highlight the complex stratification design employed in this study.
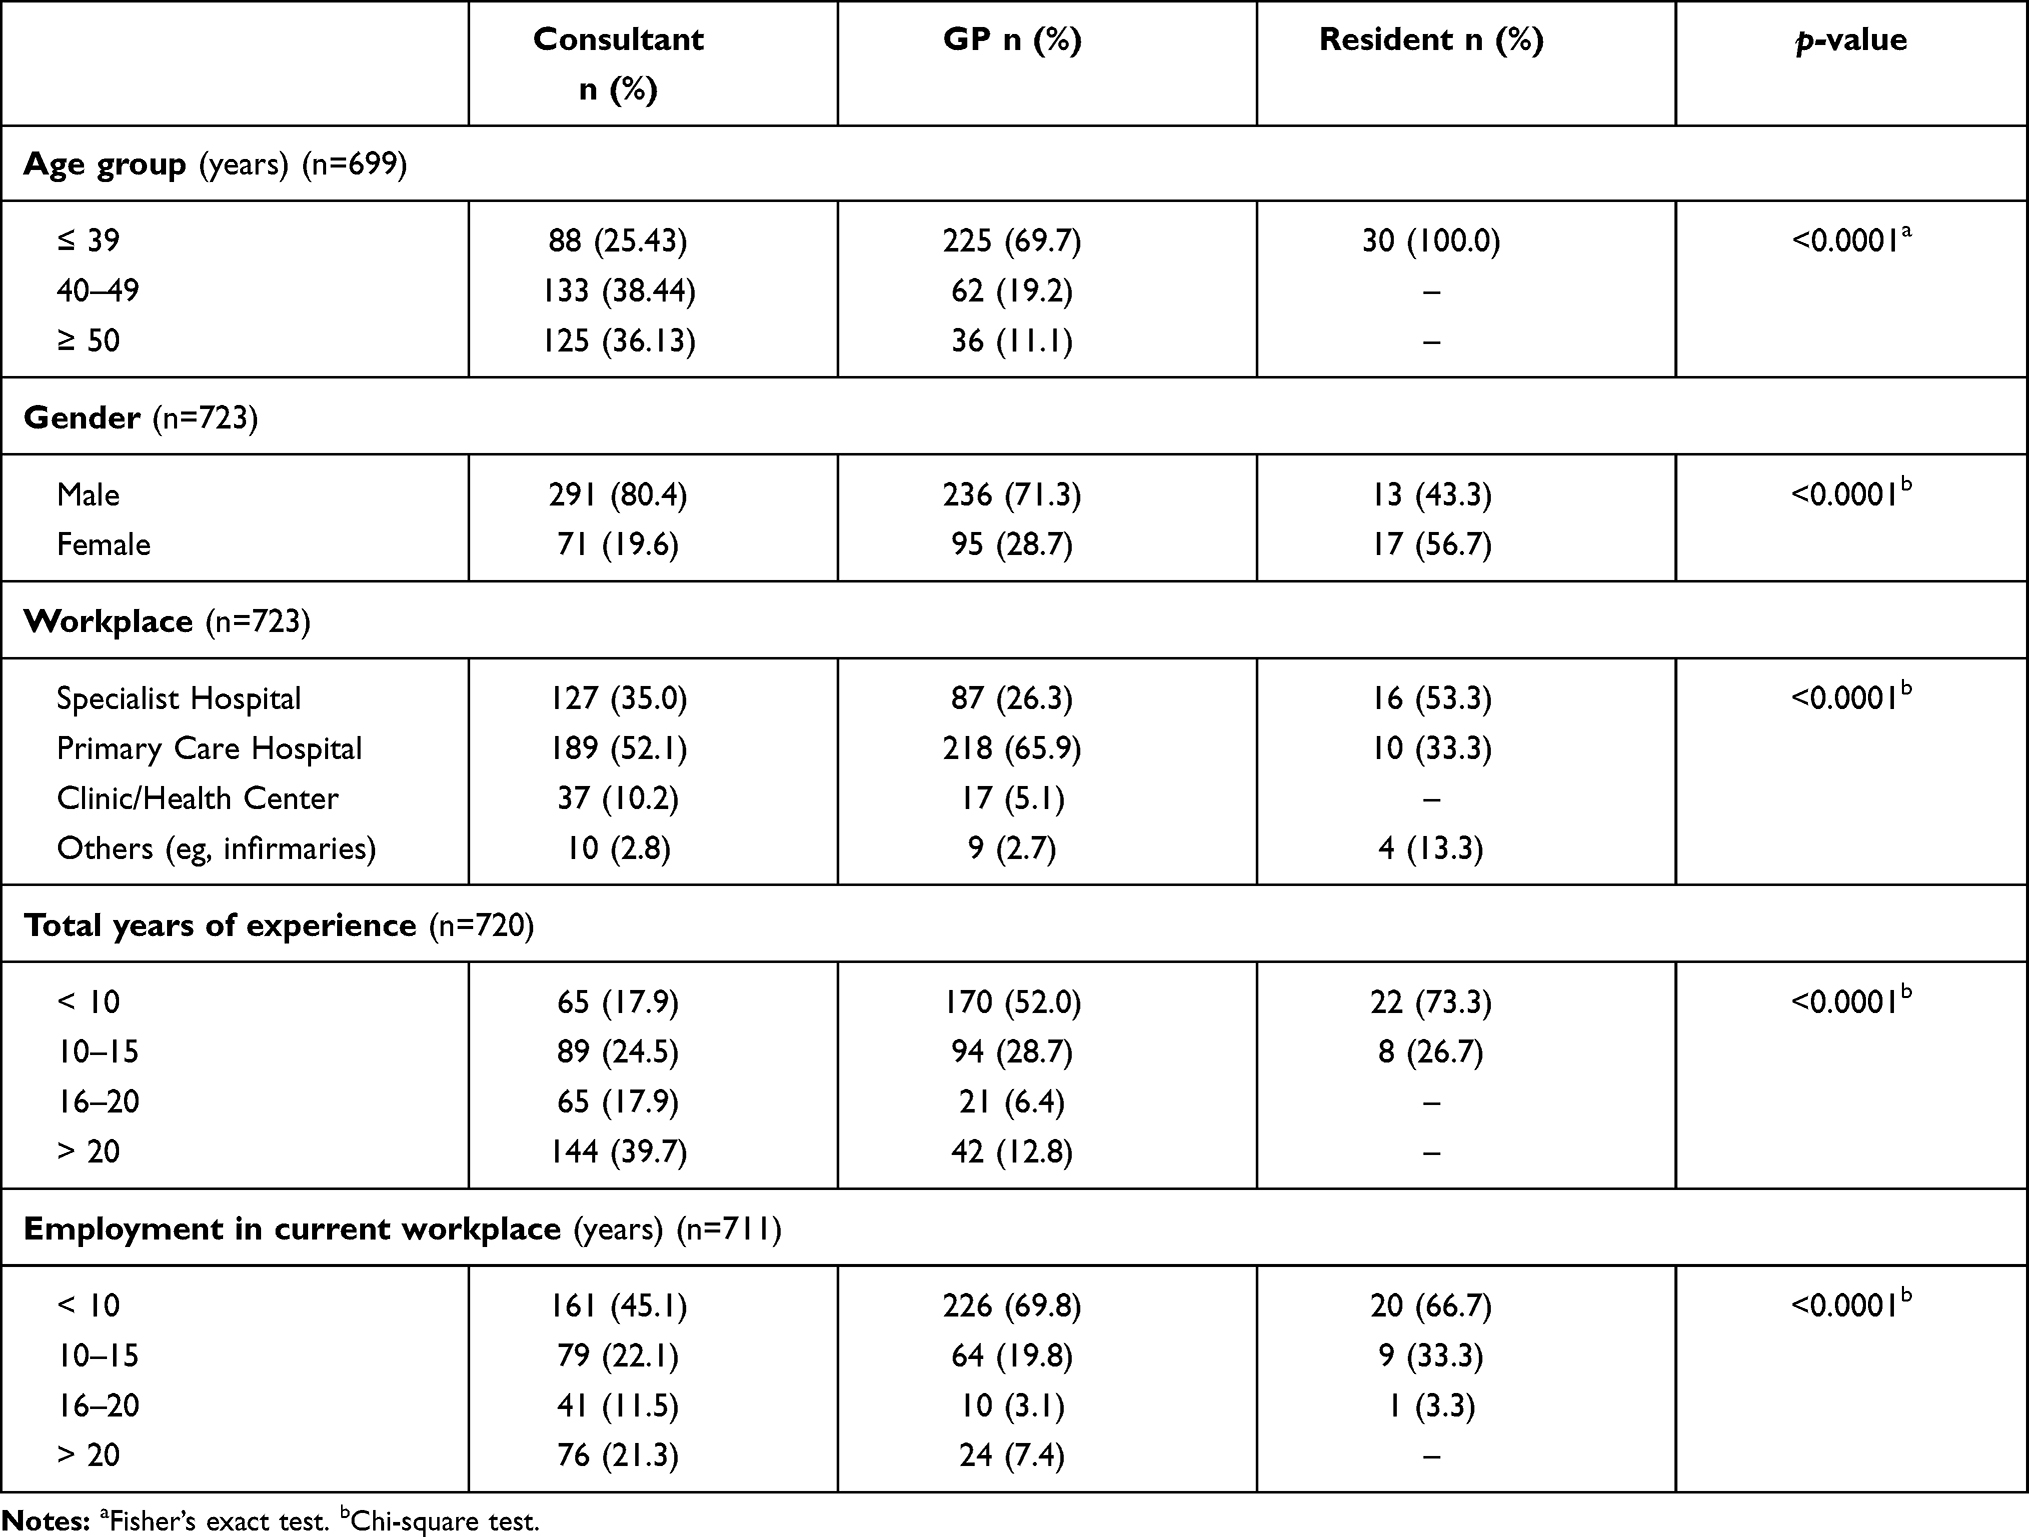 |
Table 1 Demographic Characteristics of the Physicians |
The sample of respondents comprised 363 (50.14%) consultants, 331 (45.72%) general practitioners (GP’s) and 30 (4.14%) residents. The mean (±SD) age of respondents was 45.8 (±8.6), 35.8 (±9.4) and 27.9 (±1.8) years for consultants, GP’s and residents, respectively. There was a statistically significant difference (p<0.01) in age between male and female physicians in all of the three groups. The majority of physicians (87.2%) were Arab nationals (including Saudi nationals), whereas the rest were from foreign countries. There were 66 respondents from Southeast Asia (India, Pakistan and Bangladesh), 13 from North America (9 Americans and 4 Canadians) and 14 from Europe (9 British, 2 Irish, and one each from Russia, Sweden and Germany).
The mean (±SD) total years of experience of physicians was 17.2 (±7.4), 10.7 (±6.9) and 7.1 (±4.2) years for consultants, GP’s and residents, respectively. Overall, the mean total experience was 13.8 (±7.9) years, and on average they had been in their current job for 10.5 (±7.2) years. The experience in the current job was also divided into distinct categories (<10, 10–15, 16–20, >20 years) as was the physicians’ current workplace (Specialist hospital, primary care hospital, clinic/health center, solo practice and others) (Table 1). The total years of experience for consultants, GP’s and residents varied considerably, where approximately 40% of the consultants had a total experience of more than 20 years, and the majority of the physicians (57.6%) are working in primary care hospitals. Table 2 presents the distribution of physicians by type of practice. More than half of the physicians were of the internal medicine specialty, pediatrics and obstetrics/gynecology. We also examined physicians’ responses with respect to demographic characteristics for association with geographic region. No differences were noted between these factors and regions (Riyadh, Jeddah and Dammam), therefore, we decided to exclude such a comparison from the study and pool the data.
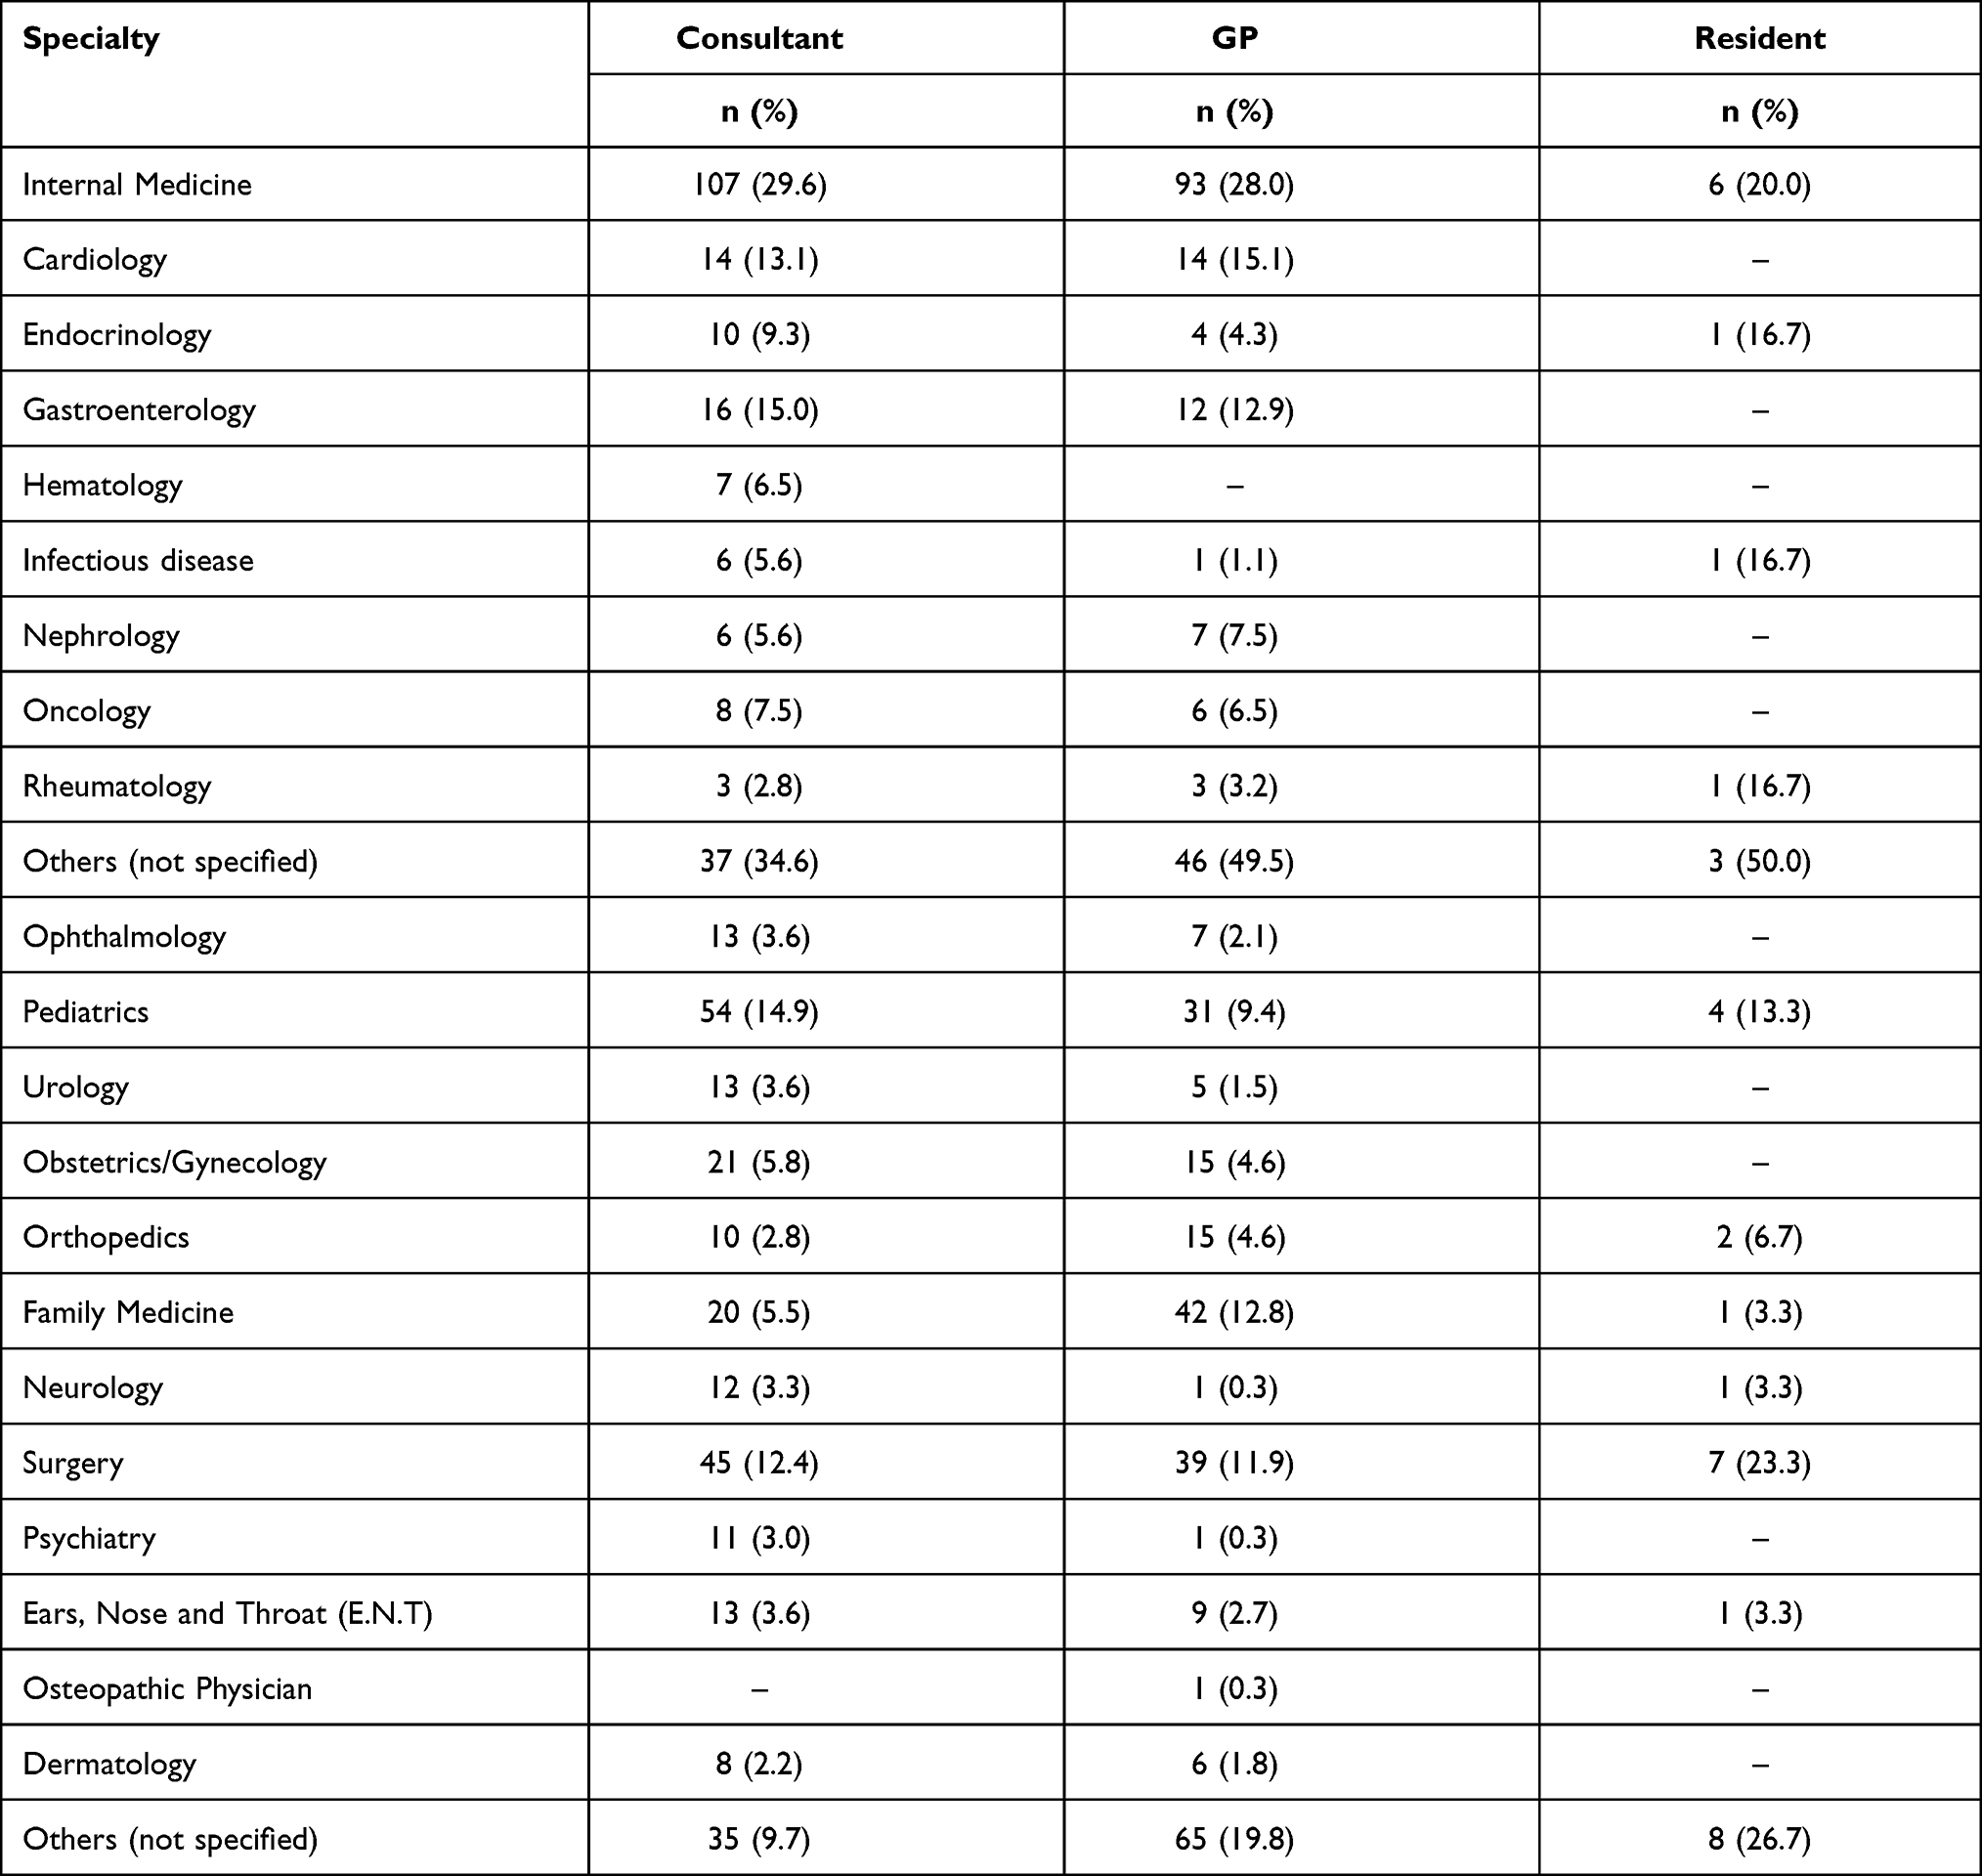 |
Table 2 Physicians’ Specialties |
Education, Knowledge and Skills
The respondent physicians were diverse in expressing whether they had completed a course in PK/TDM in either the undergraduate level, graduate level, continuing education or self-study. More than half of the participants (55.8%) responded that they had previously taken, at least, a course, part of a course or training in PK/TDM. There were statistically significant differences between physicians in this regard with respect to type of practice (63.1%, 47.7% and 56.7% of the consultants, GP’s and residents, respectively. χ2[df=2]=16.55, p<0.003). In this context, there were also statistically significant differences between European and North American physicians compared with Arab and Southeast Asian physicians with respect to exposure to PK/TDM (78.6%, 84.6%, 55% and 53%, respectively. χ2[df=3]=12.27, p<0.006). The odds ratio (OR) that a westerner physician had been exposed to PK/TDM in his/her medical training relative to other physicians combined is 3.629 (95% CI: 1.358–9.691) which indicates a significantly large difference in training between both groups.
In response to the question “Have you ever applied the principles of PK/TDM into your practice for the care of your patients?”, 69.9% of the physicians stated that they have done so. Most of these physicians were consultants (78.2%).
When respondents were asked about the pharmacokinetic parameters they usually monitor, more than half of the physicians elected the half-life of the drug and its level in the plasma (50.6% and 50.7%) as the most likely PK/TDM parameters that they have to check prior to prescribing or modifying a dose of the drug to their patients. Table 3 shows the distribution of PK/TDM parameters as a function of type of practice. Generally, the volume of distribution of the drug and the rate of drug metabolism received little attention from the responding physicians. Chi-square test revealed a statistically significant difference between physicians according to their type of practice with respect to plasma concentration (p<0.001), half-life (p=0.035) and volume of distribution (p=0.004). Surprisingly, residents (86.7%) stated that they monitor the plasma concentration of the drug in patients more than consultants (65.8%) or GP’s (61.0%) (χ2[df=2]=8.466, p=0.015).
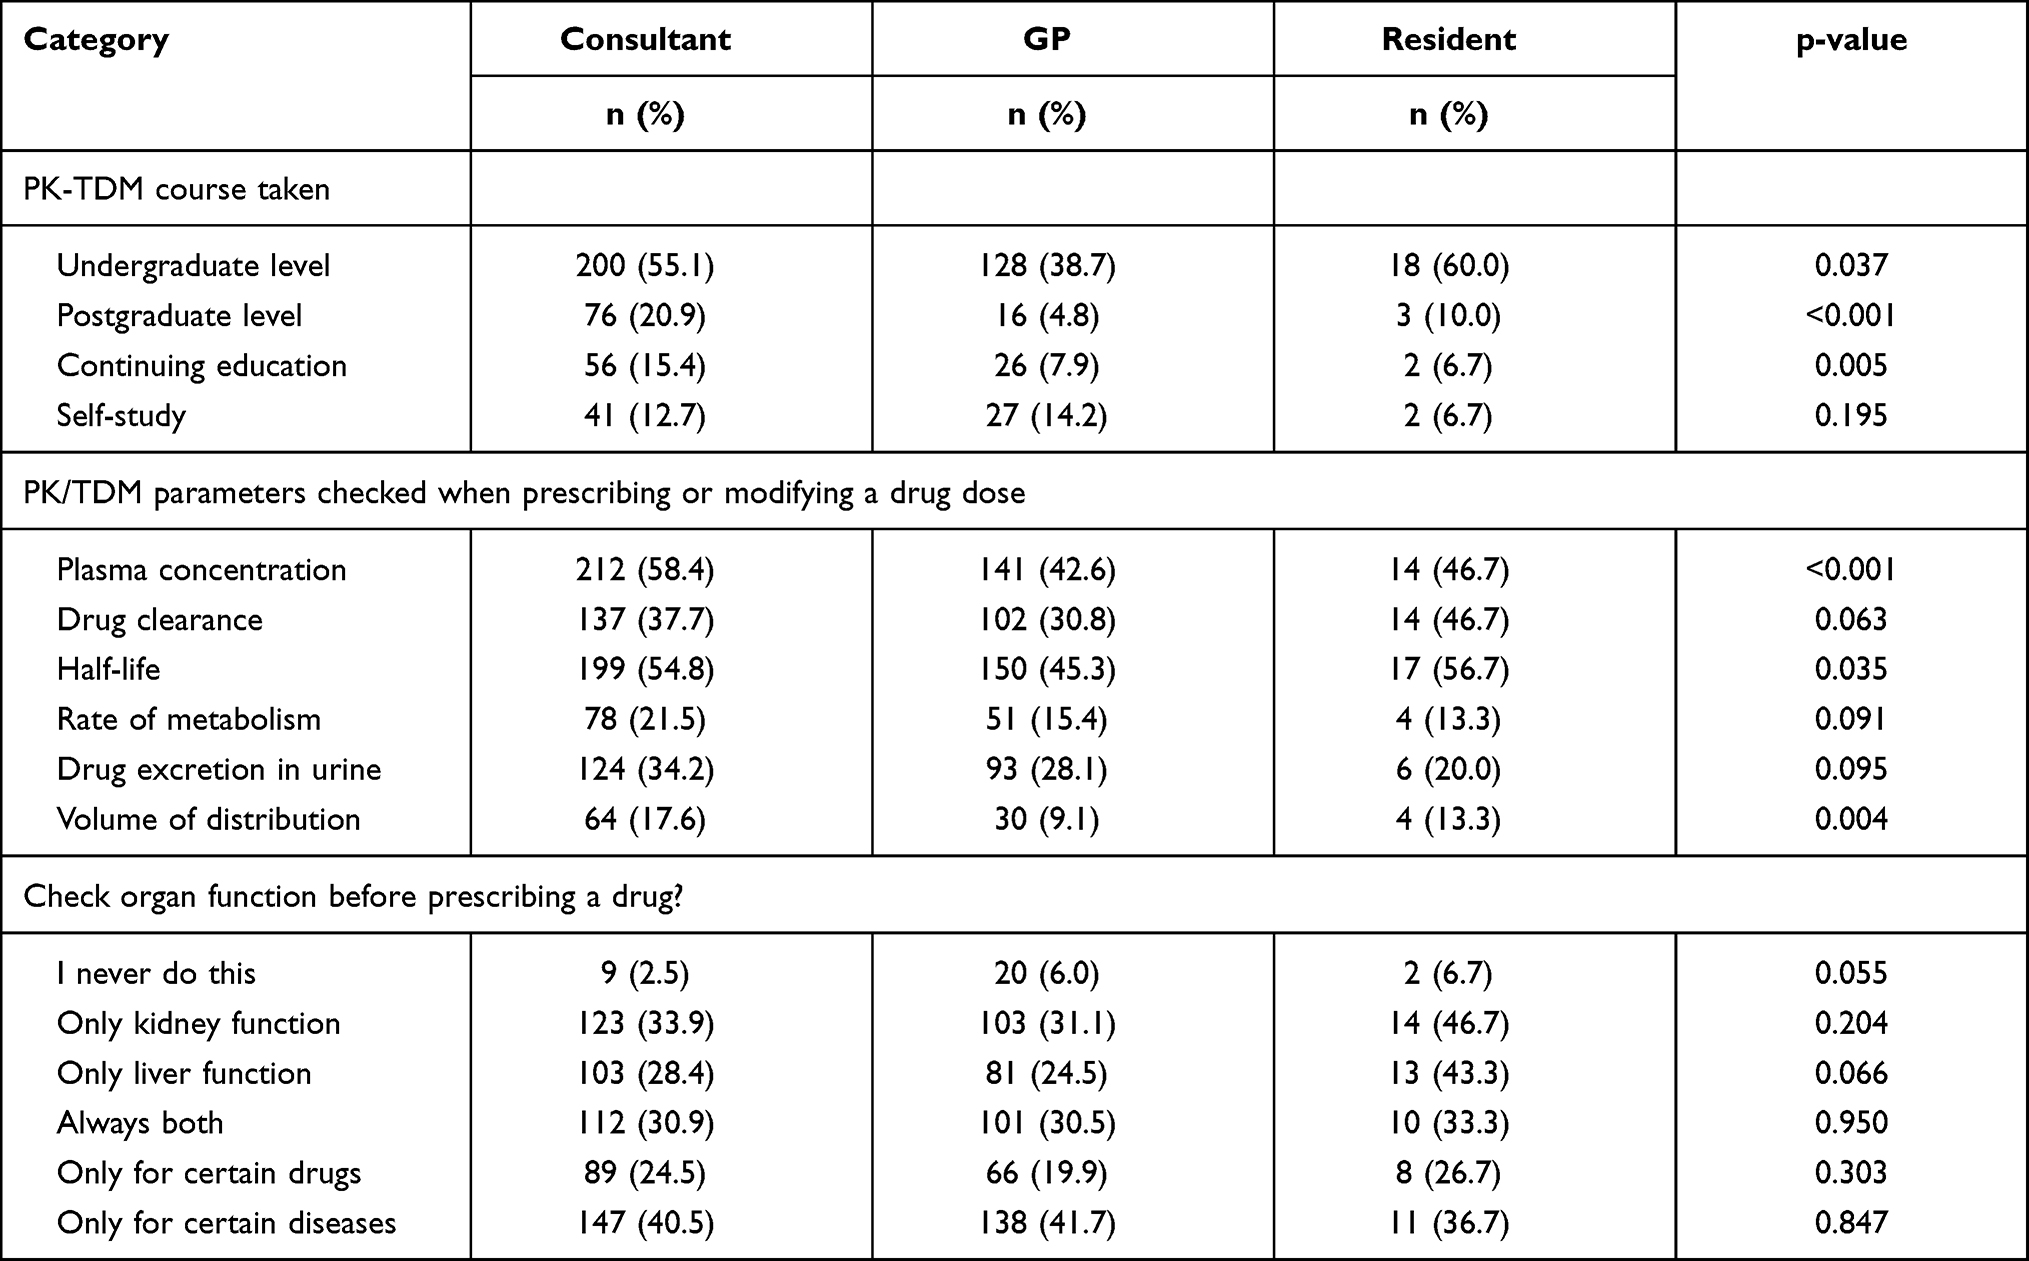 |
Table 3 Prescriber Knowledge About PK/TDM |
Respondents were asked about a variety of steps that might be taken to assist them in their patient care efforts. These include checking the organ function before prescribing or modifying a dose of the drug (Table 3). Of the 6 items in this question, most of the respondents were more likely to check or modify the dose of the drug only for patients with certain disease states and 4.3% of them stated that they do not check the organ function (renal or hepatic) before prescribing a drug, even for narrow therapeutic index drugs such as phenytoin, digoxin or aminoglycosides. There were no statistically significant differences in all items between physicians with respect to any of the grouping variables.
In response to the question: “Have you ever tried to calculate PK parameters to one or more of your patients?”, more than one third (35.3%) of the respondents said that they had never tried to calculate any parameter, whereas 11.8% admitted that they had no idea how to do such calculations. Of those who previously reported taking a course in PK/TDM during their medical training, only 56.7% of them did calculate parameters when necessary. Most of the physicians rely on the in-house clinical pharmacist in accomplishing this task and reporting the results to them.
The use of PK/TDM software by physicians to calculate pharmacokinetic parameters was also investigated. About half (46.5%) of the respondents stated that they have previously used software programs for this purpose.
Over 64% of the respondents said that they have a specialized laboratory facility for TDM in their hospital and 17.4% of the respondents were unaware whether such facility existed in their workplace. Only 56.5% of the physicians had used the services of TDM laboratory for the care of their patients. Although not significant, European and North American doctors are more likely to use TDM services in the hospital than other physicians [OR=2.262, (95% CI=0.944–5.419), p=0.06].
The respondents were asked about the medication classes that they used the PK/TDM laboratory for (Table 4). A strong agreement between the preferences of Western physicians and other physicians was observed (Spearman’s rho=0.955, p=0.001 and Kendall tau-b=0.878, p=0.006) indicating a relatively similar drug monitoring need. Another strong agreement in ranking of drug classes was observed between male and female respondent (Spearman’s rho=0.929, p=0.011 and Kendall tau-b=0.81, p=0.003). The only significant difference in drug choice between males and females was with antineoplastic drugs (14.8% and 8.3%, respectively, χ2[df=1]=6.284, p=0.012).
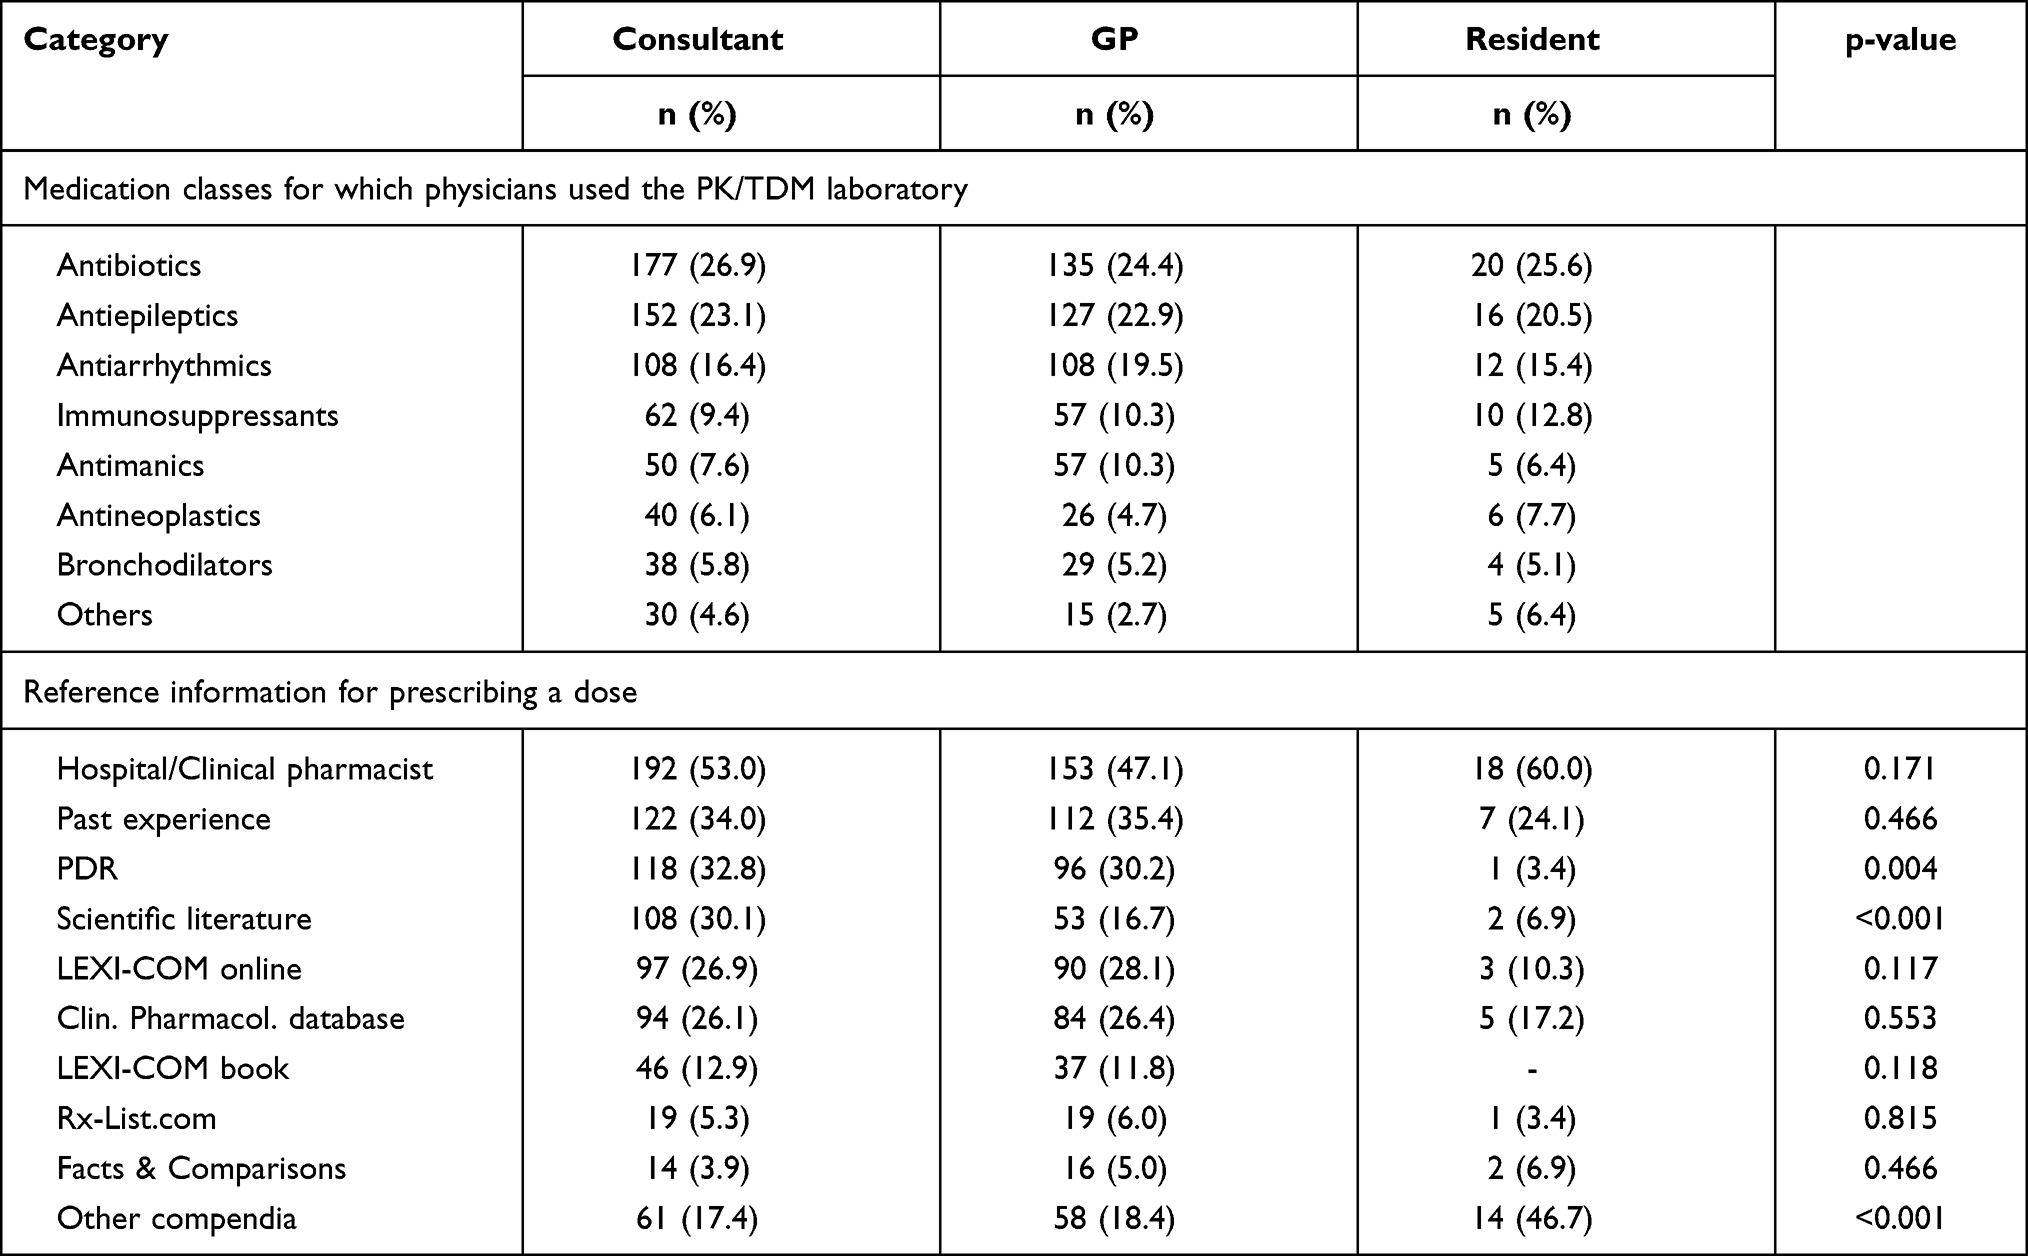 |
Table 4 Prescriber Knowledge About Medication Classes Used in PK/TDM |
Practice and Attitude
Physicians were asked, “How important is the dose adjustment in the care of their patient”. A substantial majority of the sample of physicians (78.4%) said it is “very important”, 17.8% “somewhat important” and only 2.8% “not very important”.
The respondents were asked to rank 6 criteria in terms of priority (1=low priority, 4=high priority). These criteria constitute the basis upon which they would adjust adult or pediatric dose. Organ function received the highest rating (3.72±0.68) followed by concomitant disease (3.38±0.88), body weight (3.37±0.86), age (3.28±0.95), body surface area (2.72±1.15) and height (1.96±1.09). A high level of agreement between the rankings of Western physicians and other groups in the sample (Spearman’s rho=0.943, p=0.005 and Kendall tau-b=0.867, p=0.015) and the agreement between male and female physician was almost perfect.
A similar pattern emerged when respondents were asked about their direct contact with the hospital or clinical pharmacist regarding the appropriate dose calculation based on standard PK principles. An overwhelming majority (596 or 82.3%) reported consultation with pharmacists for their pharmacologic expertise and their knowledge of pharmacokinetics. Although residents and younger physicians (≤39 years) had the most favorable consultation rate with pharmacist (93.3% and 85.4%, respectively), the difference between physicians in this regard was statistically insignificant (p>0.05).
Almost half (44.8%) of the respondent physicians reported modifying the dosages outside dose requirements for about 20% of their patients, whereas 23.5% of them do such modification in excess of 50% of the time.
Physician respondents were asked where they currently get reference information for dosing when prescribing a medication to their patients (Table 4). The most used sources of dosing information were: hospital or clinical pharmacist (50.1%), past experience (33.3%), Physicians’ Desk Reference (PDR) (29.7%), LEXI-COMP online (26.2%), clinical pharmacology (25.3%), scientific literature (22.5%), other compendia (18.4%), LEXI-COMP handbook (11.5%), Rx-list (5.4%) and Facts & Comparisons (4.4%). No significant differences (p>0.05) were observed between respondents in this regard with respect to age, gender, specialty, workplace and nationality. Significant differences (p<0.01) were found between physicians with respect to type of practice in their choice of scientific literature, other compendia and PDR (Table 4). Surprisingly, the respondents relied primarily on hospital or clinical pharmacist as a source of dose information more than any other source. This result may provoke, to some extent, suspicion that it was contaminated by Hawthorne effect.27 It is an experimenter effect whereby participants, in any human-centered study, may exhibit atypically high levels of performance simply because they are aware that they are being studied. The respondents in our study were aware that they are investigated by pharmacists. These results are inconsistent with previous reports where pharmacists were not the first choice by physicians as a drug information source.28
A similar trend was observed when participants were asked on what basis they adjust the dose for their patients, when necessary. More than 55% of the physicians indicated that they first consult with their pharmacists (Table 5). It was astonishing to notice that 29 (4.2%) of the physicians usually adjust the dose upon the request of the patient. GP’s significantly (p=0.025) tend to consult with their colleagues for dose adjustments more than consultants or residents (36.9%, 27.1% and 31%, respectively).
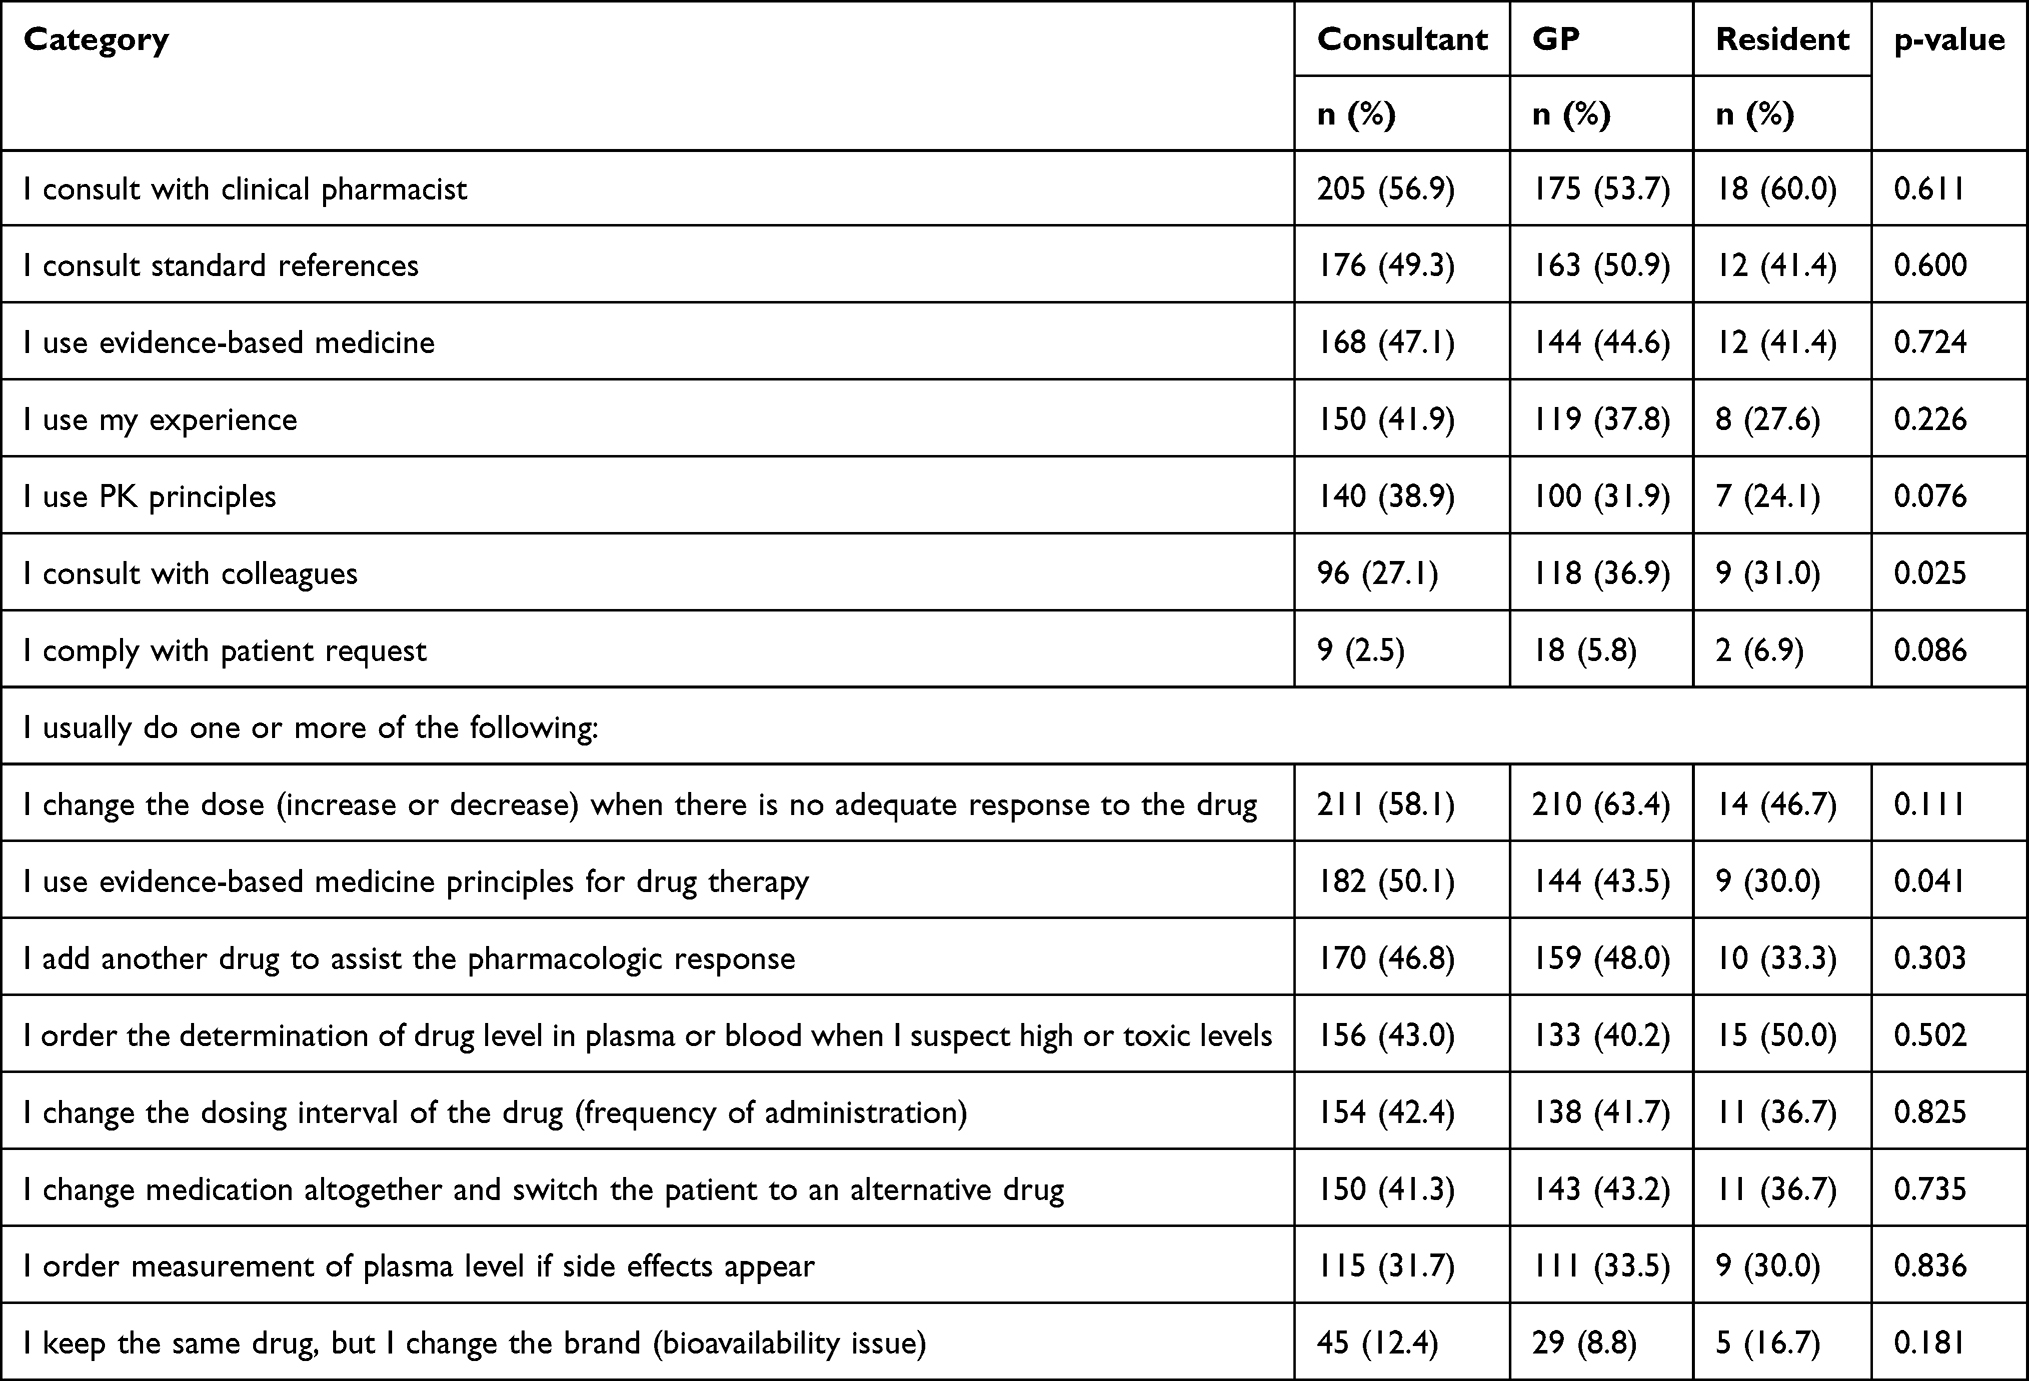 |
Table 5 Basis for Dose Adjustment |
The respondents were asked about the medication classes that are difficult to manage. Physicians were not uniform in their opinions about this matter. Consultants (50.8%) thought that anticoagulants were difficult to manage, and these drugs should be therapeutically monitored. On the other hand, anticonvulsants were the first choice of GP’s (47.2%) and residents (44.8%). There were statistically significant differences between respondents in their choice of anticonvulsants (p=0.009), central nervous system (CNS) agents (p=0.001), immunosuppressants (p=0.002) and cardiovascular drugs (p=0.004). The percentage of GP’s who indicated that these four classes of medication were difficult to manage was far greater than that of the consultants. There were no significant differences in the choice of antibiotics, antidepressants, bronchodilators, antivirals and antiarrhythmics (p>0.05) between the three groups of physicians.
An optimal strategy for obtaining a clear picture about the behavior of physicians toward PK/TDM was to ask them about the core of these disciplines. Table 5 lists the actions and attitudes of the respondents towards situations involving PK/TDM during their encounter with patients. More than 60% of the respondents tended to change the dose of the prescribed drug if they felt that the patient is not getting an adequate pharmacologic response. There were no statistically significant differences between physicians with respect to their type of practice, age, specialty or ethnic origin in any of these attitudes.
Physicians preferred a variety of delivery format for continuing education about PK/TDM. The most frequent choice of format was lectures (59.8%). The second most sought format was technology-based information sources through web-based courses (43.8%) followed by print-based courses (38.5%).
In response to a question about the most probable reasons for not utilizing the services of PK/TDM facilities in their institutions in the care of their patients, 172 (23.8%) admitted that they have no idea about the functions of such facilities and 22.5% stated that they did not prescribe narrow therapeutic index drugs that require monitoring. Negative attitude toward TDM was expressed by 22 (3.3%) physicians who said that such services are not reliable and another 24 (3.6%) insisted that the measurement of drug plasma concentration is not an adequate indicator of efficacy or toxicity.
The participation of physicians in clinical research in the field of PK/TDM was also investigated. An overwhelming majority (85.8%) had never participated in any clinical research. An even larger proportion of respondents (88.4%) stated that they were not familiar with any published trials of this type that were conducted in Saudi Arabia. Although there were no significant differences (p>0.05) in this regard between respondents with respect to age, gender, specialty, type of practice and ethnic origin, 35.7% of those who were previously involved in research were Europeans, 15.4% North Americans, 14% Arabs and 7% Southeast Asians.
The averages of responses regarding attitudes toward PK/TDM and the perceived importance of this discipline can be found in Table 6. It is apparent from these responses that the level of appreciation for practice of PK/TDM is somewhat higher in consultants and GP’s compared with residents. Kruskal–Wallis analysis of variance test revealed significant differences between residents and other physicians in their beliefs that PK/TDM should be used to enhance their practice (p=0.011) and to avoid subtherapeutic levels (p=0.012). Even though ethnic differences in drug response among patients did not catch the attention of physicians compared with other factors, they had considered it as an important factor when prescribing a drug.
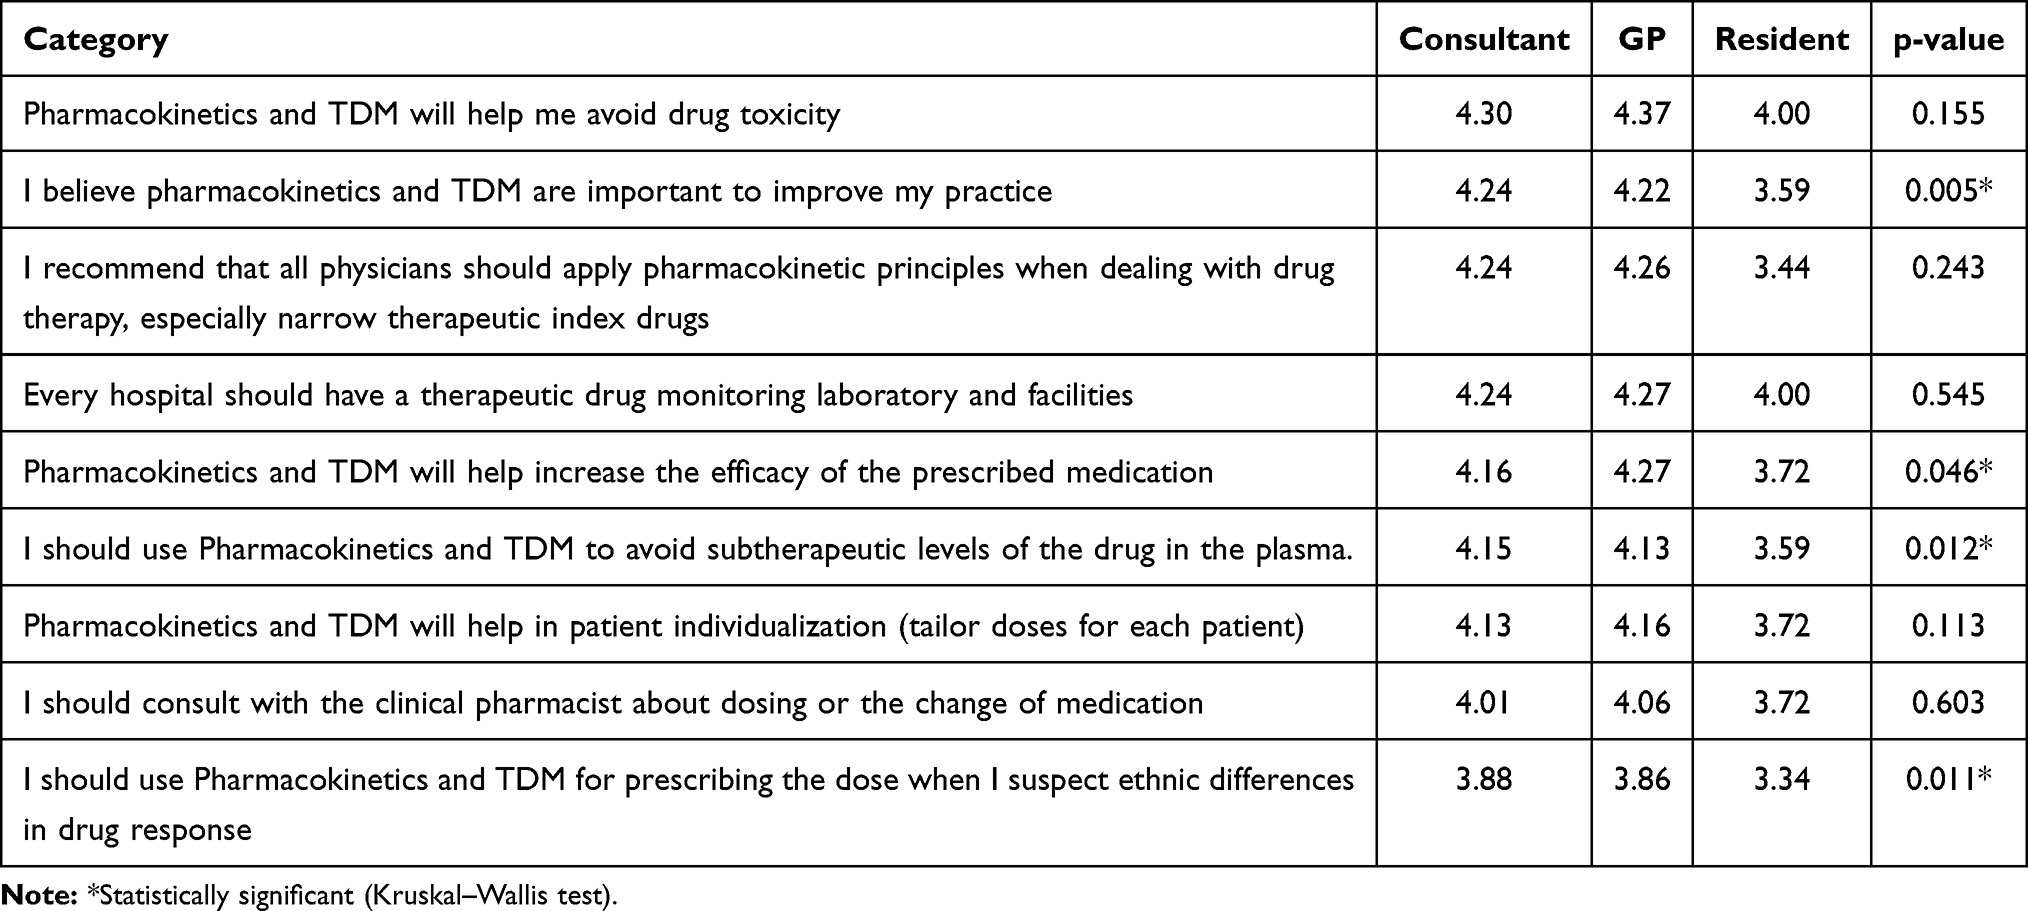 |
Table 6 Quantitative Assessment of Some Attitudinal Statements Toward PK/TDM in Rank Order (Mean Values, Max Score 5) |
Conclusion
This study was carried out in three major cities in Saudi Arabia (Riyadh, Jeddah, Dammam) to measure the knowledge, practice and attitudes of physicians towards PK/TDM services.
Most of the physicians are not aware of the fact that these facilities are usually operated by competent clinical pharmacists trained in pharmacokinetics and therapeutic drug monitoring. Most of the physicians may be reluctant to use such services primarily because they are lacking information about these disciplines. Therefore, physicians should be informed and trained about the benefit of integrating such skills in their practice and they should pay more attention to patient-centered outcomes to optimize the effective use of medicines prescribed to the patient. Physicians, in collaboration with pharmacists who are trained in PK/TDM, can make a vital contribution to patient care. An interdisciplinary educational program between medicine and pharmacy for PK/TDM will enhance the interprofessional clinical collaboration and consequently, will lead to a better medication management system.
In conclusion, TDM should be an essential component of rational drug prescribing by the practicing physician especially for those drugs that need individualization of their dosage regimen to provide an optimal response and, ultimately, to improve patient care.
Acknowledgment
The authors are very grateful to the Deanship of Scientific Research and Research Center, College of Pharmacy, King Saud University, Riyadh, Saudi Arabia.
Disclosure
The authors declared that there are no conflicts of interest in this work.
References
1. Ghiculescu RA. Therapeutic drug monitoring: which drugs, why, when and how to do it. Aust Prescriber. 2008. doi:10.18773/austprescr.2008.025
2. Lucas C, Donovan P. Just a repeat”: when drug monitoring is indicated. Aust Fam Physician. 2013;42:18–22.
3. Gross AS. Best practice in therapeutic drug monitoring. Br J Clin Pharmacol. 1998;46:95–99. doi:10.1046/j.1365-2125.1998.00770.x
4. Bayer WH. Therapeutic drug monitoring Clinical Guide. West J Med. 2008.
5. C. KN, Touw DJ. Therapeutic drug monitoring, a practical application. Basic Clin Pharmacol Toxicol. 2010.
6. Patsalos PN, Berry DJ, Bourgeois BFD, et al. Antiepileptic drugs - Best practice guidelines for therapeutic drug monitoring: a position paper by the subcommission on therapeutic drug monitoring, ILAE Commission on Therapeutic Strategies. Epilepsia. 2008.
7. Mordasini MR, Krähenbühl S, Schlieger RG. Appropriateness of digoxin level monitoring. Swiss Med Wkly. 2002;132:506–512.
8. Pennell PB. The role of therapeutic drug monitoring in patient care. Adv Stud Med. 2004.
9. Selesky M, Spiehler V, Cravey RH, Elliot HW. Digoxin Concentrations in Fatal Cases. J Forensic Sci. 1977;22:10603J. doi:10.1520/JFS10603J
10. Brodie MJ, Feely J. Practical clinical pharmacology. Therapeutic drug monitoring and clinical trials. Br Med J. 1988;296(6629):1110–1114. doi:10.1136/bmj.296.6629.1110
11. Watson I, Thomson A. The value of therapeutic drug monitoring to the practising physician‐ an hypothesis needing sensible application. Br J Clin Pharmacol. 1989;28:619–620. doi:10.1111/j.1365-2125.1989.tb03553.x
12. Bates DW, Soldin SJ, Rainey PM, Micelli JN. Strategies for physician education in therapeutic drug monitoring. Clin Chem. 1998;44:401–407. doi:10.1093/clinchem/44.2.401
13. Pedersen CA, Schneider PJ, Scheckelhoff DJ. ASHP national survey of pharmacy practice in hospital settings: monitoring and patient education - 2012. Am J Health-System Pharm. 2013;70:787–803. doi:10.2146/ajhp120777
14. Alomi YA, Elshenawy RA. National survey of the pharmacokinetics services at Ministry of Health Hospitals in Saudi Arabia: pharmacy management practice. Int J Pharmacol Clin Sci. 2019.
15. Fink A. How to Design Survey Studies; 2011.
16. Jackson CFA. Best practice in survey design within health professions. London John Wiley; 2000.
17. Watkins MW. Determining parallel analysis criteria. J Mod Appl Stat Methods. 2006.
18. Kim J, Mueller CW. Introduction to factor analysis: what it is and how to do it sage University papers series. Quantitative applications in the social sciences. Quant Appl Soc Sci. 1978.
19. Afifi AA, Clark V. Computer aided multivariate analysis lifetime learning publications belmont. California; 1984.
20. Watson R, Thompson DR. Use of factor analysis in Journal of Advanced Nursing: literature review. J Adv Nurs. 2006;55:330–341. doi:10.1111/j.1365-2648.2006.03915.x
21. Hayton JC, Allen DG, Scarpello V. Factor retention decisions in exploratory factor analysis: a tutorial on parallel analysis. Organizational Res Methods. 2004;7:191–205. doi:10.1177/1094428104263675
22. Ferguson E, Cox T. Exploratory factor analysis: a users’ guide. Int J Sel Assess. 1993;1:84–94. doi:10.1111/j.1468-2389.1993.tb00092.x
23. Martin Bland J, Altman DG. Statistics notes: cronbach’s alpha. Gen Pract. 1997;314.
24. Cronbach LJ, Shavelson RJ. My Current Thoughts on Coefficient Alpha and Successor Procedures. Educ Psychol Meas. 2004;64:391–418. doi:10.1177/0013164404266386
25. Costello AB, Osborne JW. Best practices in exploratory factor analysis: four recommendations for getting the most from your analysis. Pract Assess Res Eval. 2005.
26. Kaiser HF. An index of factorial simplicity. Psychometrika. 1974;39:31–36. doi:10.1007/BF02291575
27. Macefield R. Usability studies and the hawthorne effect. Journal of usability studies. 2007;2(3):145–154.
28. Abou-Auda HS. Information-seeking behaviors and attitudes of physicians toward drug information centers in Saudi Arabia. Saudi Med J. 2008;29:107–115.
 © 2021 The Author(s). This work is published and licensed by Dove Medical Press Limited. The full terms of this license are available at https://www.dovepress.com/terms.php and incorporate the Creative Commons Attribution - Non Commercial (unported, v3.0) License.
By accessing the work you hereby accept the Terms. Non-commercial uses of the work are permitted without any further permission from Dove Medical Press Limited, provided the work is properly attributed. For permission for commercial use of this work, please see paragraphs 4.2 and 5 of our Terms.
© 2021 The Author(s). This work is published and licensed by Dove Medical Press Limited. The full terms of this license are available at https://www.dovepress.com/terms.php and incorporate the Creative Commons Attribution - Non Commercial (unported, v3.0) License.
By accessing the work you hereby accept the Terms. Non-commercial uses of the work are permitted without any further permission from Dove Medical Press Limited, provided the work is properly attributed. For permission for commercial use of this work, please see paragraphs 4.2 and 5 of our Terms.