")
Back to Journals » International Journal of Nanomedicine » Volume 9 » Issue 1
A nanotechnological, molecular-modeling, and immunological approach to study the interaction of the anti-tumorigenic peptide p28 with the p53 family of proteins
Authors Coppari E, Yamada T, Bizzarri AR, Beattie CW, Cannistraro S
Received 29 November 2013
Accepted for publication 22 December 2013
Published 10 April 2014 Volume 2014:9(1) Pages 1799—1813
DOI https://doi.org/10.2147/IJN.S58465
Checked for plagiarism Yes
Review by Single anonymous peer review
Peer reviewer comments 3
Emilia Coppari,1 Tohru Yamada,2 Anna Rita Bizzarri,1 Craig W Beattie,2 Salvatore Cannistraro1
1Biophysics and Nanoscience Centre, CNISM-DEB, Università della Tuscia, Viterbo, Italy; 2Division of Surgical Oncology, Department of Surgery, University of Illinois College of Medicine, Chicago, IL, USA
Abstract: p28 is an anionic, amphipathic, cell-penetrating peptide derived from the cupredoxin azurin that binds to the DNA-binding domain (DBD) of the tumor suppressor protein, p53, and induces a post-translational increase in the level of wild type and mutated p53 in a wide variety of human cancer cells. As p63 and p73, additional members of the p53 superfamily of proteins, also appear to be involved in the cellular response to cancer therapy and are reportedly required for p53-induced apoptosis, we asked whether p28 also binds to p63 and p73. Atomic force spectroscopy demonstrates that p28 forms a stable, high-affinity complex with full-length p63, the DBD of p63, and full-length p73. Exposure to p28 decreased the level of TAp63α and ΔNp63α, the truncated form of p63, in p53 wild type and mutated human breast cancer cells, respectively. p28 increased the level of TAp73α, but not ΔNp73α, in the same breast cancer cell lines. In contrast, p28 increased the level of the TA and ΔN isoforms of p63 in p53 wild type, but not in p53 mutated melanoma cells, while decreasing TA p73α in p53 wild type and mutated human melanoma cells. All changes were mirrored by an associated change in the expression of the HECT E3 ligases Itch/AIP4, AIP5, and the RING E3 ligase Pirh2, but not in the receptor for activated C kinase or the RING E3 ligases Mdm2 and Cop1. Collectively, the data suggest that molecules such as p28 bind with high affinity to the DBD of p63 and p73 and alter their expression independent of the Mdm2 and Cop1 pathways.
Keywords: molecular interaction, anticancer peptide, p53 superfamily of proteins
Introduction
p28, a 28-amino acid fragment of the cupredoxin azurin, preferentially enters cancer cells1–3 and binds to specific, high-affinity motifs within the DNA-binding domain (DBD) of the tumor suppressor protein p53.4,5 Once bound to either wild type or mutated p53,6,7 p28 blocks the binding of the E3 ubiquitin ligase Cop1 and induces its autodegradation. This increases the level and activity of p53 and the expression of its downstream cell cycle targets p21 and p27 significantly, inhibiting the cancer cell cycle at G2/M.4,5,8 The structural similarity between p53 DBD and that of its homologues p63 and p73 suggests that p28 could also bind to either p63 or p73 and potentially enhance the reported tumor suppressive activity of individual isomers4,7,9 through a similar mechanism of post-translational stabilization that alters their ubiquitination.10–13
p63 and p73 are also involved in the processes of cycle cell regulation, cell death, apoptosis, and differentiation, but unlike p53, are not involved in the regulation of DNA repair.14,15 Although the proteins share a general structure: a transactivation domain (TA), a DBD, and a carboxy-terminal oligomerization domain, the most significant structural similarity lies within their DBDs.9 Despite their structural similarity, each protein has unique activities and is expressed as multiple isoforms via alternative promoters or splicing.12 Transactivating isoforms bind DNA and activate transcription of target genes. N-terminally truncated isoforms (ΔN) lack the transactivation domain and appear to act in a dominant-negative manner by either competing with the TA isoforms of p63 and p53 for DNA binding sites or by direct protein interaction.10–12
p63 is involved in embryonic development, epithelial differentiation, autosomal dominant disorders, and in tumor suppression, but can also act as an oncogene.16,17 Like p63, p73 TA isoforms are similar to p53 and activate an array of target genes promoting neuronal18 and epidermal19 differentiation, cell cycle arrest, and cell death.20–22 Although ΔN isoforms can also act as dominant-negative inhibitors of the full-length proteins and promote tumorigenesis in cells containing wild-type p53 and TAp7313 in contrast to p53, mice lacking p73 show no increased susceptibility to spontaneous tumorigenesis.23,24 This suggests that p73 might be a weaker tumor suppressor.25 The difference in suppressor activity may also suggest that p73 differentially regulates target gene activation and cell physiology compared to p53.23
In addition to autoregulatory feedback loops, polyubiquitination regulates the stability of the p53 family of proteins through a series of E3 ubiquitin ligases divided into three subfamilies: the Homologous to E6-AP Carboxyl Terminus (HECT) domain-containing E3s, the Really Interesting New Gene (RING) finger domain-containing E3s, and the U box E3s.26 The RING E3 ligase Mdm2 binds to the N-terminal transactivation (TA) domain of p53, p63, and p73, along with Mdmx, which binds to and regulates Mdm2 activity. However, Mdm2 does not initiate the proteasomal degradation of p63 or p73.27 Cop1 (constitutive photomorphogenesis protein 1) and Pirh2 (p53-induced RING-H2) negatively regulate p53 by blocking p53-mediated transcriptional activity and targeting p53 for proteasomal degradation.28 Pirh2 also ubiquitinates p63 and p73, but little information is available on the binding of Cop1 to either p63 or p73.20,29,30
We used atomic force spectroscopy (AFS) to determine the binding characteristics between p28, p63, and p73 at the single molecule level with piconewton sensitivity, in near native conditions without labeling. This strategy was integrated with dynamic modeling and a molecular immunologic approach to demonstrate that p28 also binds stably and with high affinity to the DBD of p63 and p73 but, unlike p53,6,7 does not uniformly increase the intracellular level of either by inhibiting the binding of HECT or RING E3 ubiquitin ligases.
Materials and methods
Peptide synthesis
p28 (Leu50–Asp77 LSTAADMQGVVTDGMASGLDKDYLKPDD, 2,914 Da) and p29 CLSTAADMQGVVTDGMASGLDKDYLKPDD (3,035 Da) were synthesized under cGMP by C S Bio, Inc., (Menlo Park, CA, USA) at >99% purity and mass balance.
Molecular dynamics and docking studies
Computer simulations were performed essentially as described.4,7,31,32 Configurations for azurin and the DBD of p63 were taken from 1E5Z and 3QYN of Protein Data Bank (PDB) files, respectively. ClusPro was used to conduct automated docking between the two molecules.33 The predicted complexes were subjected to cluster analysis under a pairwise binding site root mean squared deviation criterion. The cluster model with the best score was used to further compare the protein–protein interface.34
Tips and substrates functionalization
Potential interacting biomolecules were covalently linked onto atomic force microscopy (AFM) tips and glass slides as these bonds are stronger than the intermolecular forces holding the complex. This favors the detection of p28 unbinding. p28 was bound to silicon nitride AFM tips (Veeco Instruments, Plainview, NY, USA) through a cysteine residue conjugated to its NH2-terminus to create p29 (Cys-p28, 3.0 kDa) as described.7 The tips were first cleaned in acetone for 10 minutes at room temperature and ultraviolet (UV) irradiated for 30 minutes to expose hydroxyl groups. The probes were then immersed in a solution of 2% (volume/volume) 2-aminopropyl-triethoxysilane (APTES) (Acros Organics, Geel, Belgium) in chloroform in order to functionalize the tip surface with amino groups, incubated for 2 hours at room temperature, extensively washed with chloroform, and dried with nitrogen. The silanized tips were incubated with a 1 mM solution of N-hydroxysuccinimide-polyethylene glycol-maleimide (NHS-PEG-MAL, molecular weight 1,395 Da, 9.5 nm in length) (Thermo Scientific Inc., Waltham, MA, USA) and dissolved in dimethylsulfoxide (DMSO) for 3 hours. This heterobifunctional PEG exhibits an NHS-ester at one side of its chain, allowing it to target the -NH2 groups of APTES, and at the other end, a -MAL group that reacts with the -SH group of the cysteine residue conjugated to the NH2-terminal of p28. The flexible linkers provide each protein with mobility and reorientational freedom to favor the biorecognition process.35 Moreover, they prevent possible distortions or denaturation of the protein structure, by keeping the biomolecules at a certain distance from the inorganic surfaces. Furthermore, the stretching of flexible linkers during the tip-retraction provides a typical non-linear trend in force curves, starting and ending at the zero deflection line, which could help to discriminate specific unbinding events from unspecific ones. After washing with DMSO and Milli-Q® (Millipore, Billerica, MA, USA) water, the tips were incubated with 10 μL of a 10 μM solution of p29 in 50 mM phosphate buffered saline (PBS), pH 7.5, overnight at 4°C.
Distinct glass slides were prepared to separately immobilize the three proteins, which were p63 DBD, full-length p63, and p73.7 Briefly, glass slides were cleaned in acetone for 5 minutes, dried under a stream of nitrogen, and then irradiated with UV for 30 minutes. Then, the substrates were immersed in a 0.3 M APTES solution in chloroform, incubated for 3 minutes, rinsed with chloroform, dried with nitrogen, and incubated with 1% glutaraldehyde (Sigma-Aldrich, St Louis, MO, USA) in Milli-Q water solution for 4 minutes, rinsed gently with Milli-Q water, and dried with nitrogen. Such aldehyde groups exposed on the surface of the substrates allow them to target the amine groups of the lysine residues on the proteins’ surfaces. Fifty microliters of a 10 μM solution of p63 DBD, full-length p63, or p73 in 50 mM PBS pH 7.5, were poured on the reactive surfaces of the substrates and incubated overnight at 4°C.
Atomic force microscopy (AFM) imaging and force spectroscopy
A Nanoscope IIIa/Multimode AFM (Digital Instruments, Santa Barbara, CA, USA) was used for imaging and force spectroscopy as previously described.7 Substrates functionalized with p63 DBD, full-length p63, or p73 were imaged by tapping mode AFM before proceeding with force spectroscopy experiments by using a cantilever with a bare tip and a nominal spring constant, knom, of ~40 N/m. Contact mode scratching of the substrates was performed to assess whether the monolayers had the expected protein heights, using a cantilever with a bare tip and a nominal spring constant of 0.5 N/m, by applying a force ranging from a few nN for imaging to hundreds of nN for scratching as reported in Funari et al.36 Force measurements were executed in PBS buffer (50 mM K3PO4, 150 mM NaCl, pH 7.5) using force calibration mode AFM. The cantilever had a nominal spring constant, knom, of 0.02 N/m. The effective spring constant, keff, was determined by the non-destructive thermal noise method.37
A ramp size of 150 nm was set up and an encounter time (interval between approach and retraction phase) of 100 ms was established. To limit the maximum contact force applied by the tip on the protein monolayer to 0.5 nN, a relative trigger of 25 nm was used in all force measures.
Force curves were collected by approaching the functionalized tip on different points of the substrates’ surfaces at the constant velocity of 50 nm/s, while the retraction velocity was varied from 50 to 4,200 nm/s, according to the selected nominal loading rates, defined as the product of the nominal cantilever spring constant (knom) by the tip pulling velocity (v), and set in the nominal range of 1–84 nN/s. The effective loading rates were calculated from ksyst · v, where the spring constant of the entire system, ksyst, could be different from knom due to the molecules (ie, proteins and/or linkers) bound to the AFM tip. The ksyst values were obtained, at various loading rates, from the slope of the retraction curve immediately prior to the unbinding event.38 For each force experiment, we recorded a thousand curves for each of five different loading rates. Finally, to check the specificity of the interactions, control experiments were performed by adding a 30 μM solution of free p28 on the full-length p73, p63, and p63 DBD monolayers and changes in unbinding frequency were monitored.
Cell culture
Human breast cancer cells MCF-7, p53wt (ATCC, Manassas, VA, USA), the isogenic MDD2, p53dom/neg (courtesy of Dr Andrei V Gudkov, Roswell Park Cancer Institute, Buffalo, NY, USA),39 and MDA-MB-231, p53mut, as well as normal breast (MCF-10A, p53wt) (ATCC) and human melanoma cells (UISO-Mel-6, p53null; UISO-Mel-23, p53mut; UISO-Mel-29, p53wt) were cultured as described previously.40
Construction and purification of p63 and its DBD
Plasmid DNA carrying the human p63 gene was purchased from OriGene Technologies, Inc., (Rockville, MD, USA). DNA fragments of full-length and p63 DBD encoding aa 127–323 of p63 were amplified with specific primer sets, full length; 5′-CGG GAT CCC CAT GAA TTT TGA AAC TTC ACG GTG TGC C-3′ and 5′-ATA GTC GAC TCA CTC CCC CTC CTC TTT GAT GC-3′, p63DBD; 5′-CGG GAT CCC CTC CAA CAC CGA CTA CCC AGG CCC GC-3′ and 5′-ATA GTC GAC TCA CTG CTT TCT GAT GCT ATC TTC ATC-3′ containing the BamHI and Sal I restriction enzyme sites, respectively.41 DNA fragments were introduced into the pGEX5X3 plasmid DNA in frame. Glutathione S-transferase (GST)-fusion proteins were purified by Glutathione Sepharose 4B affinity chromatography and HiLoad™ Superdex 75 gel-filtration column connected to the ÄKTA prime plus FPLC system (GE Healthcare, Little Chalfont, UK).5
GST immunoprecipitation assays
p28 binding to p53, p63, and p73 was analyzed using GST immunoprecipitation (pull-down) assays essentially as described.4,5 GST and GST-p28 were bound to Glutathione Sepharose 4B beads (GE Healthcare) and unbound protein removed by washing with PBS. Whole-cell lysates of MCF-7, MDA-MB-231, Mel-29, -23, or -6 cells were mixed with beads and incubated for 2 hours. After excessive washing, each sample was loaded on 10% sodium dodecyl sulfate polyacrylamide gel electrophoresis (SDS-PAGE), blotted onto membranes, and anti-p53 Ab, p63 Ab, or p73 Ab were used for immunoblotting.
Potential interactions between the p63 DBD and E3 ligases, Cop1, and Pirh2 in the presence or absence of p28 were determined by competitive pull-down assays.42 GST fused to the p63 DBD was immobilized on beads, followed by incubation in the presence or absence of p28 (10–100 mole excess). Whole-cell lysates containing Cop1 and Pirh2 were prepared from MCF-7 cells in PBS containing 0.1% Triton X-100, 10% glycerol, and a protease inhibitor cocktail (Sigma-Aldrich). Soluble extracts were incubated with beads, and each sample was washed with PBS, pelleted, and analyzed with anti-Cop1 or anti-Pirh2 antibody. Polyclonal antibodies against the C-terminus aa 513–641 of p63 (H129; Santa Cruz Biotechnology, Dallas, TX, USA), Pirh2 (A300-357A; Bethyl Laboratories, Montgomery, TX, USA), and p53 (sc-6243; Santa Cruz Biotechnology), and monoclonal antibodies against the C-terminus aa 495–637 of p73 (ER13; EMD Millipore) and Cop1 (sc101227; Santa Cruz Biotechnology) were used for pull-down assays according to the suppliers’ instructions.
Western analysis and RT-PCR
We were able to directly compare the expression of p63 and p73 and their ubiquitination in response to p28 using whole-cell lysates identical to those described previously for p53.4,8 Human breast and melanoma cells were cultured with p28 at 50 μM for 24–72 hours, whole-cell lysates prepared, and Western analysis conducted. Polyclonal antibodies against p63 (H129; Santa Cruz Biotechnology), Itch (ab63940; Abcam, Cambridge, MA, USA), AIP5 (H260; Santa Cruz Biotechnology) and RACK-1 (ab62735; Abcam), and monoclonal p73 antibody (ER13; EMD Millipore) were used for Western analyses according to the suppliers’ instructions. The level of actin expression was determined with a monoclonal antibody (sc1616; Santa Cruz Biotechnology). Band intensity was determined using UN-SCAN-IT™ (Silk Scientific Inc., Orem, UT, USA). Each control and experimental band was first normalized by calculating the ratio of specific protein/actin and then each experimental level expressed as the (relative) percentage from control over time. Although Western analyses are semi-quantitative, the data reflect the minimum values (%) of at least two independent experiments with no significant variance.
Total RNA was extracted from identical MCF-7, MDD2, MDA-MB-231, and MCF-10A human breast and Mel-29, -23, and -6 melanoma cells, exposed to 50 μM p28, from which whole-cell lysates were developed. RT-PCR was conducted as previously described.5 Primer sequences were as follows: Itch, 5′- ACC TGG ATG GGA GAA GAG AA-3′ and 5′-TGT GCG GGG ATC TAT ATA GG-3′; AIP5, 5′-CAA CGA TAC CTC TAT TCG GC-3′ and 5′-GCA GGG GTT CTT CAT TCT GT-3′; RACK-1, 5′-CAA GGA TGT GCT GAG TGT GG-3′ and 5′-CAA TGT GGT TGG TCT TCA GC-3′; GAPDH, 5′-ACC TGA CCT GCC GTC TAG AA-3′ and 5′-TCC ACC ACC CTG TTG CTG TA-3′. Each control and experimental band was normalized by calculating the ratio of specific gene/GAPDH. Each experimental level was then expressed as the (relative) percentage of control over time. Although RT-PCR analyses do not provide actual copy number, the data reflect the minimum values (%) of at least two independent experiments with no significant variance.
Results
Docking simulation of p28 and p63 complex
Docking simulations of p28 and p63 identified motifs within loops connecting the parallel sheet structures of S4, S6, S7, S9, and S10 within the p63 DBD41 predicted to bind p28 (Figure 1A). This allowed calculation of the molecular surface and electrostatic potential of the p63 DBD (DeepView ver 4.0.3; Swiss Institute of Bioinformatics, Geneva, Switzerland) (Figure 1B). The blue, red, and white color gradient represents positive, negative, and neutral (including hydrophobic aa) potentials on the molecular surface, respectively. The DNA-binding surface of the p63 DBD is highly cationic (blue). In contrast, p28 (green) binds to an area that is essentially neutral (white). This suggests that electrostatic interaction may not play a significant role in p28 binding to p63 or p73, and that p28 does not interfere with the ability of p63 to bind DNA (Figure 1B). The amino acid composition of the predicted p28 binding motif on p63 was PSTYPVRMHQVDPITRLVPITERDGQVLR; 48% hydrophobic, 21% neutral, and 31% hydrophilic residues (Figure 1C). The amino acids predicted to bind p28 (red) are indicated in a sequence map of p63 DBD (Figure 1D) and compared to that of p53. These sites do not include the DNA-binding residues (orange boxes) or the zinc coordination sites (green boxes) of p63, suggesting that p28 does not interfere with the ability of p63 to bind to DNA or alter the overall conformation of p63. The ClusPro best score model also predicted that the amino acid residues LSTAADMQVVMKYLKDD of p28 (17/28; 61%) bind to p63. Forty-seven percent of the predicted residues are hydrophobic, again suggesting that hydrophobic rather than electrostatic interaction is essential to the formation of the p63/p28 complex (Figure 1B). These results are supported by studies demonstrating that p28 binds to the p53 DBD through non-polar residues at the interface, creating a short-range hydrophobic interaction.4
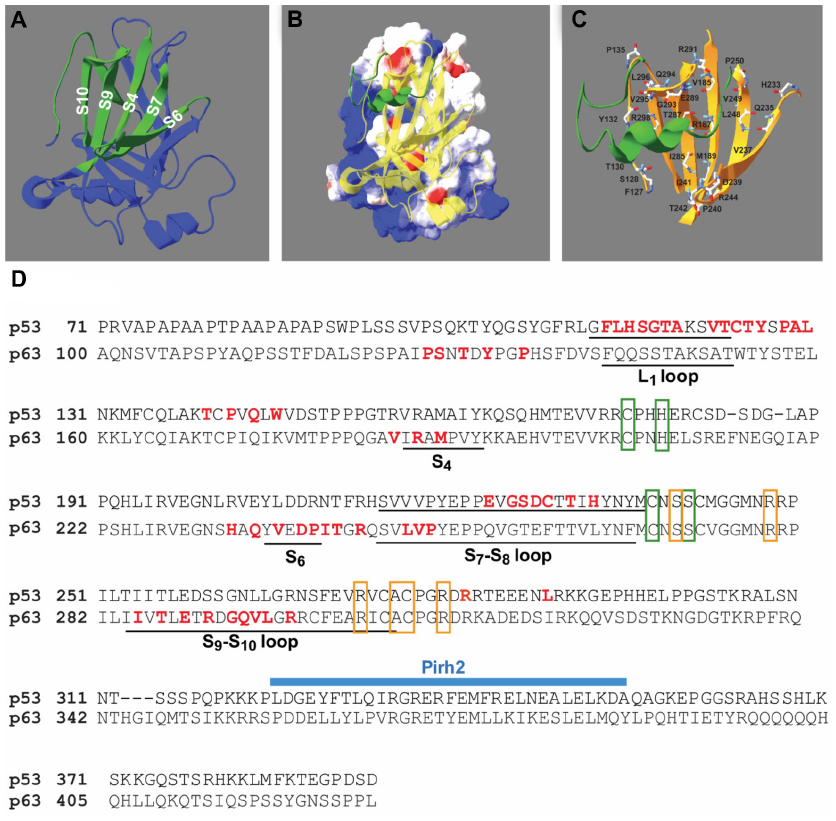 | Figure 1 Docking model of p28 and p63 DBD. |
Although the DBDs of p63 and p53 share 60% amino acid sequence identity and the overall structure of the p63 DBD closely resembles that of the p53 DBD, the p63 DBD and p53 DBD greatly differ in the binding affinity of their response elements, which likely results from the notable differences in the conformation of the L1 loop.41,43 This may be the reason that, unlike the p53 DBD/p28 complex (Figure 1D), p28 does not bind to the L1 loop of the p63 DBD. Finally, these predictions clearly suggest that p28 does not inhibit the binding of the RING E3 ligase Pirh2, the HECT E3 ligases AIP4/5, or RACK1 to either p63 or p73.44–46
AFM imaging and force spectroscopy
The study of the biological interaction between p28 with full-length p63, p73, or p63 DBD was conducted by AFS, according to the procedure reported by Bizzarri et al.7
Preliminary, we carried out a topological study of the complexes through tapping mode AFM. Figure 2 shows the images of the p63 DBD-functionalized substrate before (A) and after (B) deposition of p28. In the absence of p28, the image of the p63 DBD substrate reveals the presence of a limited number of bright spots randomly distributed over the surface (Figure 2A). Incubation of p28 with the p63 DBD-functionalized substrate resulted in a numerical increase in the incidence of bright spots (Figure 2B). However, quantitative topological analysis of the monolayer did not assign a significant difference to the increase.32 Similar results were obtained for full-length p73 and p63-functionalized substrates (results not shown).
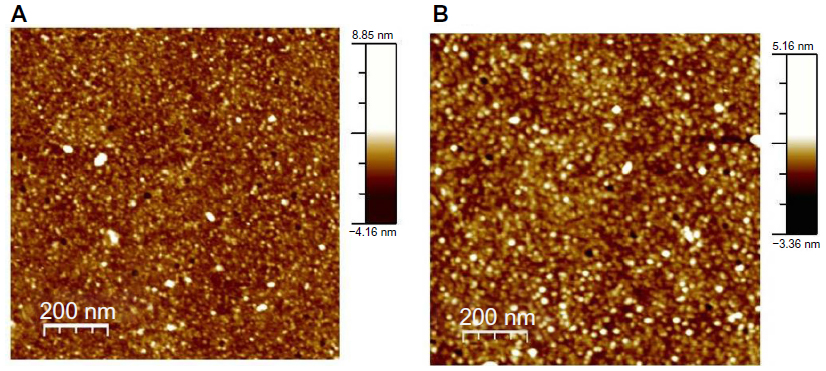 | Figure 2 Tapping mode AFM images of protein monolayer. |
Figure 3 illustrates AFS analyses of p28 binding. The left panel details the immobilization strategies for p28 and p53 family members. The right panel illustrates a representative force–piezo displacement cycle. At the beginning of an approach/retraction cycle, the p28-functionalized tip is moved toward the protein-functionalized substrate and the cantilever deflection is zero (point 1). The biomolecules jump-to-contact at point 2. With further pressure of the tip onto the substrate, there is an electronic repulsion due to overlapping of molecular orbitals, producing an upward deflection. Once the preset maximum contact force value of 0.5 nN is reached, the approaching phase (dotted line) of the cantilever is stopped (point 3). The cantilever is then retracted from the substrate. During this retraction phase (continuous line), adhesion forces and/or bonds formed in the contact phase, cause the tip to bend downward, adhering to the substrate up to a certain distance beyond the initial contact point (point 4). As retraction continues, the spring force overcomes the interacting force and the cantilever jumps off, sharply returning to a non-contact position (point 5). The cantilever deflection measured at the jump-off is used to determine the force required to break the complex, called “unbinding or rupture force”; the latter being express by the product of such a deflection (d) and the cantilever affective spring constant (keff).
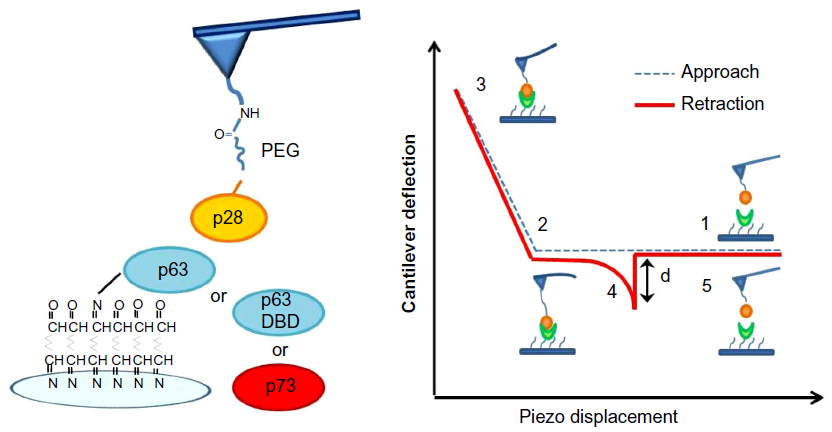 | Figure 3 Schematic representation of AFS analysis. |
The force curves registered during the measurements showed different shapes. Curves corresponding to acceptable unbinding events are characterized, in the retraction phase, by sharp peaks, starting and ending points at zero deflection line, and by a nonlinear curved shape before the jump-off. This is due to the viscoelastic properties of the PEG molecules under stretching and straight pull-off jumps.47,48 Force curves were discarded from the analysis, when they showed a lack of events, a dubious deflection-jump, or when the curve retained the same slope during the retraction after the contact point (adhesions).49
Unbinding forces were extracted at each loading rate from the collection of curves assigned to specific events and plotted as histograms. The most probable unbinding force values were then determined from the maximum of the main peak of each histogram. Figure 4A, C, and E show the unbinding force distribution at loading rate 7 nN/s for the complex p63 DBD (A), full-length p63 (C), and full-length p73 (E). The most probable unbinding force values for the three experiments at loading rate 7 nN/s, were found to be around 70 pN. The unbinding frequency, defined as the ratio between the number of the accepted unbinding events and the total of the collected force–distance curves, was evaluated for each loading rate. The unbinding frequency values found at loading rate 7 nN/s for the three complexes were around 12%.
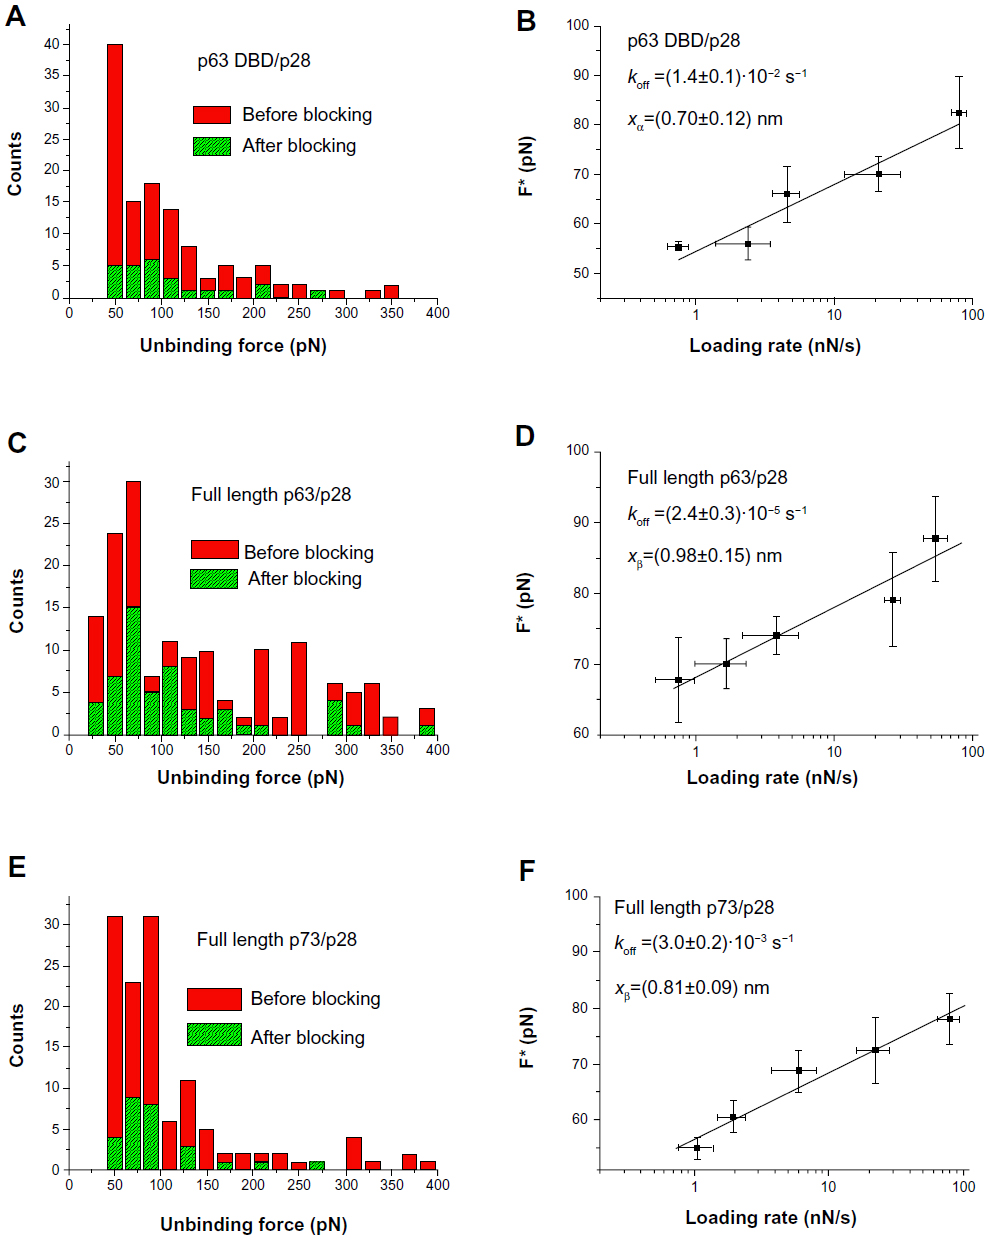 | Figure 4 AFS analysis of p28 binding. |
Interaction specificity was assessed using blocking experiments, where a reduction in the unbinding frequency was observed for all the complexes (Figure 4A, C, and E). The residual unbinding activity after the inhibition of the biorecognition process is likely to result from the forced interaction between the two partners under the experimental design.50 The unbinding force distributions before and after blocking for each of the complexes, are characterized by almost the same shape, exhibiting mean force values around the same range.
Once the most probable unbinding force was determined for each loading rate, the kinetic parameters xβ and koff, at zero force conditions, were extracted by applying the Bell–Evans model, which describes the unbinding process in a non-equilibrium condition, under the influence of an external force.51,52 In particular, the application of an external force induces a decrease in the activation barrier and a consequent exponential increase of the dissociation rate constant with the pulling force. The model predicts the most probable rupture force (F*) as a linear function of the natural logarithm of the loading rate (r) through the following expression:

where koff is the dissociation rate constant, xβ is the width of the potential barrier along the direction of the applied force, kB is the Boltzmann constant, and T the absolute temperature. Hence, the most probable unbinding forces were plotted versus the natural logarithm of the effective loading rates, r, to obtain a dynamic force spectrum displaying a linear dependence, in agreement with the Bell–Evans model (Figure 4B, D, and F) for all the complexes. When each plot was fit with Equation 1, the kinetic parameters koff and xβ were obtained from the intercept and the slope of the linear fit. In the analyzed loading rate range, a single linear regime was indicative of a single energy barrier and a unique transition state of the reaction. The kinetic parameters extracted from each experiment are shown in Table 1; for comparison, the results relative to the interactions between p53/p28 and p53 DBD/p28 were also reported.7 The koff values, which are related to the characteristic lifetime τ0 of the complexes 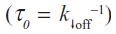 , provide information on the specificity of the reactions. Accordingly, the found koff values are generally indicative of stable complexes.49 Additionally, we evaluated the association rate constants, kon, which are dominated by the diffusive properties of the partners and geometric constraints of the actual binding, for the three complexes by applying the expression, where NA is Avogadro’s number, Veff is the effective volume of a half-sphere with radius reff around the tip, which describes the effective volume for proteins binding, and t0.5 is the time required for the half-maximal binding probability. Values of t0.5 around 0.05 seconds were obtained from the expression, where v is the approach velocity of the cantilever.50,53
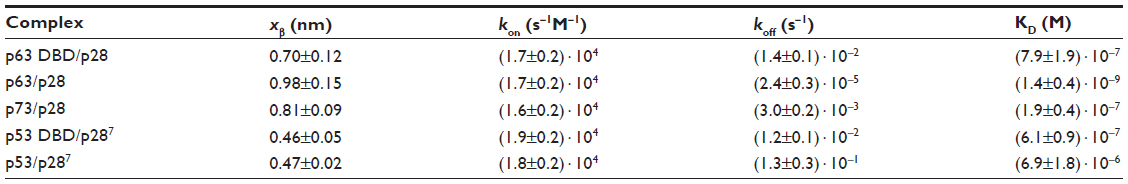 | Table 1 Kinetic parameters extracted from the AFS experiments between p28 and the p53 family of proteins |
The evaluation of both the dissociation and association rate constants allowed us to determine the dissociation constants (KD) for each complex (Table 1); the relative affinity of p28 for the p53 family members is p63 > p73 > p53DBD > p63DBD > p53.
p28 immunoprecipitation of p53, p63, and p73
Immunoprecipitation assays determined in identical cell lysates confirm computerized predictions (Figure 1) and AFS results with recombinant proteins (Figure 4A–F, Table 1). GST-p28 consistently pulled down p53 from cancer cell lysates containing p53, but GST alone did not (Figure 5).5 Although p28 bound to both TAp63α and TAp73α, it appeared that p28 had a higher affinity to p63 than p73, as the overall amount of p73 bound to p28 was less than that of p63, irrespective of cell line, with one exception; the triple negative p53mut cell line MDA-MB-231 (Figure 5). The differences are not likely to result from differences in antibody affinity, as all were at least one order of magnitude above the binding of p28 for either TAp63 or TAp73, and p28 immunoprecipitated a similar amount of p63 and p73 from the p53mut MDA-MB-231 cell line.
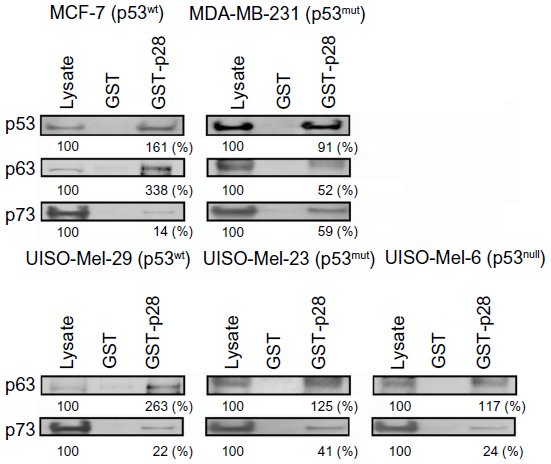 | Figure 5 Interaction of p28 with p53, p63, and p73. |
Interaction of RING E3 ligases and p63 DBD
p28 prevents the binding of the RING E3 ligase Cop1 to the DBD of p53 through the formation of a p53/p28 complex.4,8 Cop1 was not pulled down by GST-p63 DBD from breast cancer and melanoma cell lysates showing stable expression of Cop1 (Figure 6), suggesting that unlike p53, Cop1 may not bind to a similar region within the p63 DBD nor be a critical regulator of p63. In contrast to Cop1, the RING E3 ubiquitin ligase Pirh2 physically interacts with p63 and targets p63 for ubiquitination and proteasomal degradation.29 We show here that GST-p63 DBD pulled down Pirh2 (Figure 6). Again, GST alone did not bind to Pirh2, indicating that Pirh2 specifically binds within the DBD of p63. p28 did not block the interaction between Pirh2 and p63 DBD and may have actually enhanced it (Figure 6). This suggests that the p28 binding motif on p53 and p63 is not analogous to that of Pirh2.54 TAp73 is also ubiquitinated by Pirh2 reportedly within the DBD (aa 123–313), suggesting that p28 may also indirectly increase Pirh2 ubiquitination of p73 by increasing the level of p53.8,20,55
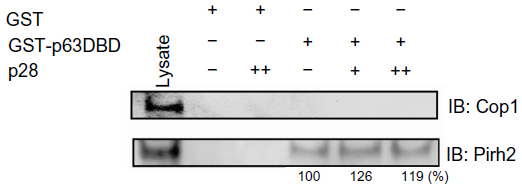 | Figure 6 Competitive immunoprecipitation assay for Cop1 and Pirh2. |
p28 alters the level of p63 and p73
p28 decreased the level of TAp63 in MCF-7, MDA-MB-231, and MDD2 cells without altering it in normal MCF-10A cells (Figure 7A). In contrast, p28 increased TAp63 in Mel-29 (p53wt) and Mel-6 (p53null), but decreased TAp63α in Mel-23 (p53mut) cells (Figure 8A). MCF-7 (p53wt) and MDD2 (p53dom/neg) breast cancer cells do not express ΔNp63α,56 while p28 reduced the level of ΔNp63α in MDA-MB-231 and induced a short-term decrease in MCF-10A cells (Figure 7A). Exposure to p28 produced a variable response in ΔNp63α in Mel-29 and Mel-23 cells, first increasing then decreasing ΔNp63α in Mel-29 cells and decreasing it at 72 hours in Mel-23, clearly suggesting the response was cell line dependent (Figure 8A). The absence of any effect in p53null cells also suggests that there was little direct effect on ΔNp63α, leaving open the possibility that any alteration resulted either from the effect on TAp63α or on p53. p28 increased the intracellular level of TAp73α in MCF-7 and MDD2 cells, but did not alter the expression of TAp73α in MDA-MB-231 and MCF-10A cells (Figure 7A). In contrast, the level of TAp73α in Mel-29 and Mel-23 cells decreased with time post-exposure, with no effect on Mel-6 cells (Figure 8A). A late increase (48–72 hours) in the level of ΔNp73α in p53dom/neg MDD2 breast cancer and normal MCF-10A mammary cells was not found in MCF-7 and MDA-MB-231 cells (Figure 7A). ΔNp73α was not detectable in melanoma cells. Collectively, p28-induced alterations in the level of TA and ΔN forms of p63 and p73 appeared dependent on the cell line treated and, possibly, p53 status.
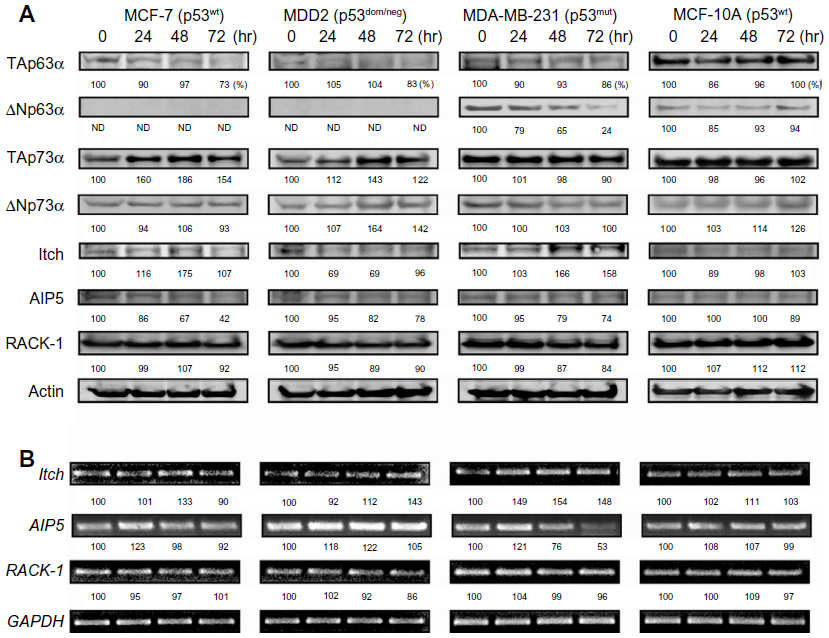 | Figure 7 Effect of p28 on p63, p73, and E3 ligases on p53wt, mut breast cancer cells. |
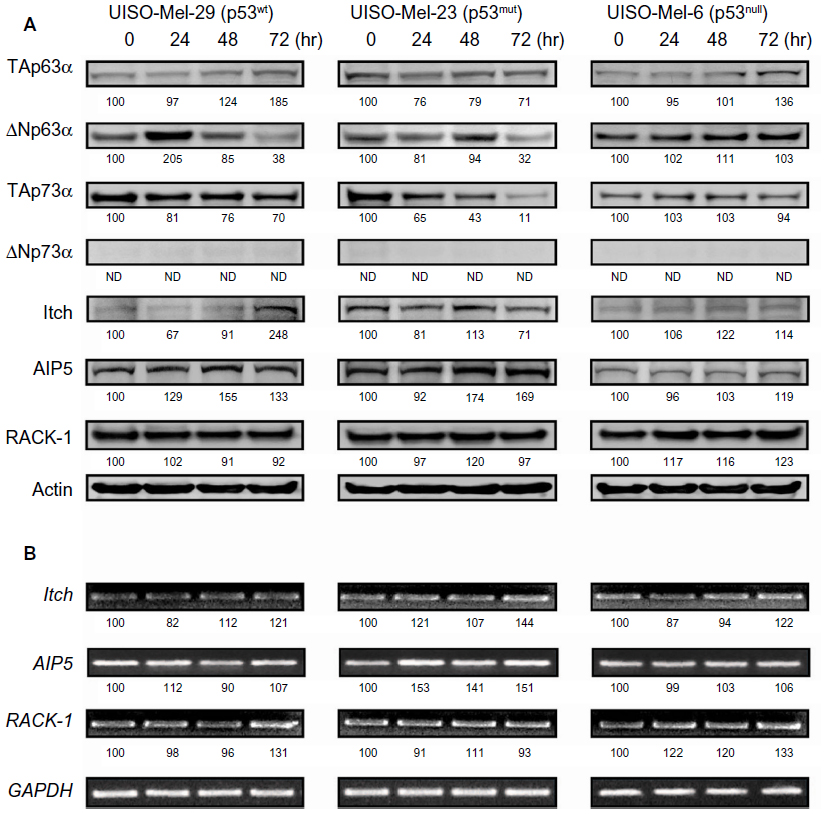 | Figure 8 Effect of p28 on p63, p73, and E3 ligases on p53wt, mut melanoma cells. |
p28 alters the ubiquitination of p63 and p73
As any changes in the levels of either TAp63α, TAp73α, or their ΔN forms could be in response to alterations of their respective ubiquitin ligases, we also determined their level of expression post-exposure to p28. Exposure of MCF-7 and MDA-MB-231 cells to p28 upregulated the HECT type E3 ligase Itch (AIP4) (Figure 7A) prior to or parallel with the decline in TAp63α. A similar effect on Itch levels was observed in Mel-29 and (p53null) Mel-6 cells (Figure 8A). In contrast, the level of Itch declined in parallel with the observed decrease in TA and ΔNp63 in Mel-23 cells (Figure 8A). Itch transcription also increased in all breast cancer and melanoma cell lines (Figures 7B and 8B), perhaps reflecting the significant alterations in Itch. The intracellular level of AIP5 was decreased in MCF-7, MDD2, and MDA-MB-231 in a time-dependent manner while the level of AIP5 was upregulated in Mel-29, Mel-23, and Mel-6 cells (Figures 7B and 8B). Conversely, the levels of Itch and AIP5 decreased in p53dom/neg MDD2 cells, where TA and ΔNp73α were elevated in response to p28 (Figure 7A). These changes, in response to p28, were also mirrored by changes in transcription (Figures 7B and 8B). The level and transcription of RACK1, the receptor for activated C kinase, a regulator of G1/S progression, which does not contain a consensus HECT or RING-type domain characteristic of typical E3 ubiquitin ligases,57 but binds to and promotes the ubiquitination of p63 and p73, was not altered in any cancer or normal cell line (Figures 7 and 8) in response to p28.44 These results demonstrate that multiple HECT type E3 ligases concomitantly regulate the expression of p63 and p73, and in the case of ΔNp63α, its expression may be dependent on p53 status (Figures 7 and 8).
Discussion
Molecular dynamic and cluster analyses showed that p28 bound to specific motifs within the L1 and S7–S8 loops of p53 DBD. Validation of that binding by AFS at the single molecule level under native conditions and immunoprecipitation, suggested a strategy to determine the relative affinity of p28 for p63 and p73.4,7 In spite of the lack of a crystal structure for p73, additional sequence and structural similarities within the DNA-binding and other domains of p53 family members suggested that p28, and similar analogs, would potentially bind to TAp63α and TAp73α, as well as their major isoforms.9 This is important because N-terminally truncated isoforms (ΔN), lacking the transactivation domain, retained their DNA-binding domain and could act in a dominant-negative manner either by competing with the TA isoforms of p63 and p53 for DNA-binding sites or by direct protein interaction.10–12 Although there was negligible overlap between p28 binding sites within the DBD of p53, p63, and presumably p73, p28 bound to p63 through hydrophobic interactions virtually identical to that with p53 (Figure 1B). The similar affinity (KD) of p28 for p53 and p63 and longer koff, immediately suggested that p28 could exert its antiproliferative activity by directly binding to p53 and inhibiting its ubiquitination by Cop1.4,7,8
Force measurements carried out on the full-length p73/p28 complex provided koff values which were between those of full-length p63/p28 and of full-length p53/p28 (Table 1). Indeed, the AFS data indicated that the affinity of p28 for the full-length p73 and p63 was higher than for full-length p53, suggesting that the overall conformation of p63 and p73 was more conducive to binding p28. Moreover, the results obtained for p63/p28 and p73/p28 complexes (koff values in the order of 10−5 and 10−3 s−1) showed higher affinity of p28 for p63 than for p73, which were confirmed by immunoprecipitation (Figure 5).
Our AFS results clearly suggested that specific interactions between p28 and p63 were confined to the DBD core domain. The results validated the computational docking study predicting that p28 and the DBD of p63 underwent a molecular association characterized by low, negative-binding free energy, high shape complementarity, and several hydrogen bonds at the interface. Moreover, the AFS data for the complex p63 DBD/p28 were comparable to those previously obtained for the complex p53 DBD/p28 (koff values in the order of 10−2 s−1 for both). This was likely due to the >60% amino acid sequence identity shared between the DBD of these two proteins. The lifetime τ (τ = 1/koff) of the full-length p63/p28 complex was 1,000 times longer than that of the p63 DBD/p28 association. This was in contrast to that obtained for the interaction between p28 and p53, where the formation of the p53 DBD/p28 complex was more stable than the full-length p53/p28 complex (Table 1).7 This suggests folding of the full-length p63 and p53 proteins is more complex, which could alter the binding between p28 and the DBD domains.
The kinetic description of the biorecognition process between p28 and the p53 family of proteins was completed by determining the association rate constant, kon.7,53 The values for all the complexes were found in the order of 104 M−1 s−1 (Table 1), suggesting that any change in binding (affinity) for p53, p63, and p73 may result from a higher dissociation constant (longer retention) of p28.
Immunoprecipitation (Figure 5) of cancer cell lysates identical to those used to identify the role of p28 in inducing a post-translational increase in p53 confirmed computerized predictions and AFS results with recombinant proteins; p28 bound to p53, p63, and p73 (Figures 1 and 3).4,8 Although p28 bound to both p63 and p73, p63 had a higher affinity for p28 than p73, as p28 bound less p73 than p63, irrespective of cell line and apparent overexpression of p73 relative to p63 in all cell lines (Figures 5, 7, and 8). The singular exception was the p53mut, estrogen receptor (ER), progesterone receptor (PGR), and human epidermal growth factor receptor 2 (Her-2) negative breast cancer cell line MDA-MB-231, where p28 also did not immunoprecipitate p53 to the same degree as in p53wt MCF-7 breast cancer cells. A subset of these triple negative tumors reportedly co-express the ΔNp63 isoform exclusively with TAp73.46 This was not the case with MDA-MB-231 cells (Figure 7), where expression of TAp63α may have altered the expression ratio of p63 to p73.
Intracellular levels of p53 family proteins were tightly regulated by a proteasomal pathway that is mediated through several E3 ubiquitin ligases. However, the reported lack of binding of either the HECT or RING E3 ligases to the p63 DBD (Figure 1) initially suggested that p28 had no direct effect on the ubiquitination of p63.27,44–46 A more recent report suggested that the RING E3 ubiquitin ligase Pirh2 bound to the DBD and C-terminus (aa 123–313) of p73.55 This was not a region that Pirh2 reportedly bound to on p53 (Figure 1), suggesting that p28 did not directly block the binding of Pirh2 on p73 and alter its ubiquitination.4,54 p73 turnover was also reportedly regulated by Pirh2, but not by COP1 or Mdm2.20 Although p28 inhibited the binding of the RING E3 ligase Cop1 to the p53 DBD, until now, its role in the ubiquitination of p63 was not defined. Both ligases were present in the lysates of p53wt MCF-7 cancer cells that also expressed TAp63α and TAp73α (Figure 6).4 Immunoprecipitation with a GST-p63-DBD probe confirmed that the RING E3 ligase Pirh2 bound to the p63 DBD and, to the authors’ knowledge, demonstrated for the first time that Cop1 did not bind to the p63 DBD and may not be a critical regulator of p63. Exposure to p28 increased the level of Pirh2, possibly as a result of significant post-translational increase in p53 and TAp73α in this cell line (Figure 7). These results also suggested that the p28 binding motifs within the DBD of p53, p63, and potentially p73 were not analogous to that of Pirh2.4,54
In addition to the RING E3 ligase Pirh2, the WW-domain, HECT-containing, E3 ligase Itch/AIP4 bound within aa 397–571 of the SAM domain of p63 and induced its ubiquitination and degradation.45,57 Itch was also able to bind to, ubiquitinate, and induce the proteasomal degradation of p73 via its second PR (proline-rich) region (aa 404–487).58 The HECT ligase AIP5 also bound to and ubiquitinated p63 through the PY motif in the SAM domain (aa 397–571) of p63, with Tyr543 being the critical residue for interaction,46 but was not reported to ubiquitinate p73. RACK1 bound to the C-terminal region of ΔNp63 and directed its proteasomal degradation.44 It also bound to the extreme C-terminal region of p73α (aa 427–548) repressing its activity without apparently initiating its degradation.59
We explored whether the specific binding of p28 to the DBD of p63 and p73 isoforms would directly increase their expression in a manner similar to p53 and result in an increase in their ubiquitination by assaying the expression of Itch/AIP4, AIP5, and RACK1. We did this in the context of a sustained increase in the level and activity of p53wt,mut following exposure to p28 (Figures 7 and 8).4,5 p28 did not increase the level of TAp63α in p53wt,dom/neg,mut breast cancer cell lines or normal mammary cells. The lack of ΔNp63α expression in p53wt breast cancer cells confirmed earlier reports and might be expected in p53dom/neg MDD2 cells, as p53 regulated the level of ΔNp63α through the ΔNp63α promoter and transcriptional activation of AIP5 in cancer cells.46,60 Although AIP5 levels remained low (Figure 7A), AIP5 transcription increased slightly in all three breast cancer cell lines (Figure 7B), confirming a role for p53 in the regulation of ΔNp63α. The decrease in ΔNp63α in p53mut triple negative MDA-MB-231 breast cancer cells also suggested that ΔNp63α may not play a major role in the regulation of TAp63α in breast cancer outside a small subset of triple negative tumors.46 The lack of effect on RACK1 levels and transcription suggested that changes in the level of p53 family proteins in response to p28 exposure may not involve this putative E3 ligase.
In contrast to breast cancer, p28 induced a significant, time-dependent increase in TAp63α in p53wt and p53null melanoma cells (Figure 8), but a decrease in p53mut Mel-23 cells. The increase in TAp63α at 72 hours in p53null melanoma cells was significant, as the increase is likely to be directly related to p28 stabilizing TAp63α, rather than any positive regulatory effect from p53 or loss in E3 ligase activity (Figure 8). Exposure of p53wt Mel-29 melanoma cells to p28 also induced an early (24 hours) and significant increase in ΔNp63α, which fell by 72 hours. The increase in ΔNp63α was not observed in p53mut Mel-23 cells, where the level of ΔNp63α only declined. An initial decrease and subsequent increase in Itch/AIP4 transcription in p53wt and p53null melanoma cells were mirrored by changes in Itch/AIP4 levels in p53wt and p53null in melanoma cells, suggesting that they were in response to the p28-induced increase in TAp63α and ΔNp63α. After p28 exposure, the levels of AIP5 and its transcription reflected changes in TAp63α and ΔNp63α, in all melanoma cell lines, clearly indicating that these HECT ligases, rather than RACK1 (Figure 8) were responsible for the alterations in TAp63α and ΔNp63α levels.
Like TAp63α, TAp73α promoted its own turnover as well as that of other p73 isoforms in a tightly regulated transactivation-dependent and -independent manner.23 Unlike p63, it did so, in part, via the p73 DBD. TAp73α and wild type, but not mutant p53 also positively regulated the level of ΔNp73α by directly activating transcription from the promoter of the gene.23,61 p73 turnover was also regulated post-translationally by Pirh2 and Itch/AIP4, but not by Mdm2 and Cop1.20 We showed here on a background of a sustained increased in p53wt,mut that p28 bound to and altered the level of TAp73α and ΔNp73α in a tissue-dependent manner (Figures 5, 7, and 8).4 The increase in TAp73α in p53wt MCF-7 p53dom/neg MDD2 breast cancer cells suggested some degree of post-binding stabilization, independent of p53 status. The lack of effect of p28 on the level of TAp73α in p53mut triple negative MDA-MB-231 and normal MCF10A cells, and increase in ΔNp73α in the same cells suggested that TAp73α and ΔNp73α were regulated independently of p53 with cell and tissue type(s) being a dominant factor. This suggestion was supported by the decrease in TAp73α in p53wt,mut melanoma cells in the absence of any effect on p53null cells that were devoid of ΔNp73α (Figure 8), and the observation that TAp73α appeared to promote its own turnover as well as that of other p73 forms, including the ΔNp73 in a transactivation-dependent manner.23 Exposure of p53wt,mut melanoma cells to p28 decreased TAp73α without altering it in p53null cells, suggesting that the decrease was unrelated to p28-induced increases in p53wt,mut.
As ΔNp73α was not expressed in any melanoma cell line, the decrease in TAp73α was not likely to result from interaction with other p73 isoform.23 Increases in Itch/AIP4 levels and transcription in p53wt Mel-29 cells and AIP5 in p53mut Mel-23 cells suggested that the decrease in TAp73α was due to proteasomal degradation. For example, DNA-damaging agents (eg, doxorubicin and cisplatin) induce AIP5 in a p53-dependent manner in HCT116 colon cancer cells while UV- or γ-irradiation decreased AIP5 transcription in p53wt fibroblast cells, suggesting DNA damage alters AIP5 expression in a cell line-dependent manner.62 Our results also suggest that increases in AIP5 levels and transcription in p53wt Mel-29 cells and p53mut Mel-23 cells were due to the stabilization of p53 in response to p28.8
In summary, we show for the first time that an anionic, amphipathic, α-helical, peptide fragment of azurin binds to all of the p53 superfamily of proteins, but unlike p53, does not induce a uniform, post-translational increase in p63 and p73 or their major isoforms.
Acknowledgment
This work was partly supported by a grant from the Italian Association for Cancer Research (AIRC No IG 10412).
Disclosure
The authors report no conflicts of interest in this work.
References
Taylor BN, Mehta RR, Christov K, et al. A novel antitumor peptide: The protein transduction domain (PTD) of azurin. In: Proceedings of the 97th Annual Meeting of the American Association for Cancer Research; April 1–5, 2006; Washington, DC. 47, 47, LB-187. | |
Taylor BN, Mehta RR, Yamada T, et al. Noncationic peptides obtained from azurin preferentially enter cancer cells. Cancer Res. 2009;69:537–546. | |
Yamada T, Fialho AM, Punj V, Bratescu L, Gupta TK, Chakrabarty AM. Internalization of bacterial redox protein azurin in mammalian cells: entry domain and specificity. Cell Microbiol. 2005;7:1418–1431. | |
Yamada T, Christov K, Shilkaitis, A, et al. p28, A first in class peptide inhibitor of Cop1 binding to p53. Br J Cancer. 2013;108:2495–2504. | |
Yamada T, Mehta RR, Lekmine F, et al. A peptide fragment of azurin induces a p53-mediated cell cycle arrest in human breast cancer cells. Mol Cancer Ther. 2009;8:2947–2958. | |
Santini S, Bizzarri AR, Cannistraro S. Modelling the interaction between the p53 DNA-binding domain and the p28 peptide fragment of azurin. J Mol Recognit. 2011;24:1043–1055. | |
Bizzarri AR, Santini S, Coppari E, et al. Interaction of an anticancer peptide fragment of azurin with p53 and its isolated domains studied by atomic force spectroscopy. Int J Nanomedicine. 2011;6:3011–3019. | |
Yamada T, Das Gupta TK, Beattie CW. p28, an anionic cell-penetrating peptide, increases the activity of wild type and mutated p53 without altering its conformation. Mol Pharm. 2013;10(9):3375–3383. | |
Levrero M, De Laurenzi V, Costanzo A, Gong J, Wang JY, Melino G. The p53/p63/p73 family of transcription factors: overlapping and distinct functions. J Cell Sci. 2000;113(Pt 10):1661–1670. | |
Melino G, De Laurenzi V, Vousden KH. p73: Friend or foe in tumorigenesis. Nat Rev Cancer. 2002;2(8):605–615. | |
Yang A, Kaghad M, Caput D, McKeon F. On the shoulders of giants: p63, p73 and the rise of p53. Trends Genet. 2002;18:90–95. | |
Melino G. p63 is a suppressor of tumorigenesis and metastasis interacting with mutant p53. Cell Death Differ. 2011;18:1487–1499. | |
Petrenko O, Zaika A, Moll UM. ΔNp73 facilitates cell immortalization and cooperates with oncogenic Ras in cellular transformation in vivo. Mol Cell Biol. 2003;23:5540–5555. | |
Mills AA, Zheng B, Wang XJ, Vogel H, Roop DR, Bradley A. p63 is a p53 homologue required for limb and epidermal morphogenesis. Nature. 1999;398:708–713. | |
Vogelstein B, Lane D, Levine AJ. Surfing the p53 network. Nature. 2000;408:307–310. | |
Flores ER. The roles of p63 in cancer. Cell Cycle. 2007;6:300–304. | |
Westfall MD, Pietenpol JA. p63: molecular complexity in development and cancer. Carcinogenesis. 2004;25:857–864. | |
De Laurenzi V, Raschella G, Barcaroli D, et al. Induction of neuronal differentiation by p73 in a neuroblastoma cell line. J Biol Chem. 2000;275:15226–15231. | |
De Laurenzi V, Rossi A, Terrinoni A, et al. p63 and p73 transactivate differentiation gene promoters in human keratinocytes. Biochem Biophys Res Commun. 2000;273:342–346. | |
Jung YS, Qian Y, Chen X. The p73 tumor suppressor is targeted by Pirh2 RING finger E3 ubiquitin ligase for the proteasome-dependent degradation. J Biol Chem. 2011;286:35388–35395. | |
Irwin M, Marin MC, Phillips AC, et al. Role for the p53 homologue p73 in E2F-1-induced apoptosis. Nature. 2000;407:645–648. | |
Lissy NA, Davis PK, Irwin M, Kaelin WG, Dowdy SF. A common E2F-1 and p73 pathway mediates cell death induced by TCR activation. Nature. 2000;407:642–645. | |
Dulloo I, Sabapathy K. Transactivation-dependent and -independent regulation of p73 stability. J Biol Chem. 2005;280:28203–28214. | |
Yang A, Walker N, Bronson R, et al. p73-deficient mice have neurological, pheromonal and inflammatory defects but lack spontaneous tumours. Nature. 2000;404:99–103. | |
Lee CW, La Thangue NB. Promoter specificity and stability control of the p53-related protein p73. Oncogene. 1999;18:4171–4181. | |
Bernassola F, Karin M, Ciechanover A, Melino G. The HECT family of E3 ubiquitin ligases: multiple players in cancer development. Cancer Cell. 2008;14:10–21. | |
Zdzalik M, Pustelny K, Kedracka-Krok S, et al. Interaction of regulators Mdm2 and Mdmx with transcription factors p53, p63 and p73. Cell Cycle. 2010;9:4584–4591. | |
Wang L, He G, Zhang P, Wang X, Jiang M, Yu L. Interplay between MDM2, MDMX, Pirh2 and COP1: the negative regulators of p53. Mol Biol Rep. 2011;38:229–236. | |
Jung YS, Qian Y, Yan W, Chen X. Pirh2 E3 ubiquitin ligase modulates keratinocyte differentiation through p63. J Invest Dermatol. 2013;133:1178–1187. | |
Jung YS, Qian Y, Chen X. Pirh2 RING-finger E3 ubiquitin ligase: its role in tumorigenesis and cancer therapy. FEBS Lett. 2012;586:1397–1402. | |
De Grandis V, Bizzarri AR, Cannistraro S. Docking study and free energy simulation of the complex between p53 DNA-binding domain and azurin. J Mol Recogn. 2007;20:215–226. | |
Bizzarri AR, Di Agostino S, Andolfi L, Cannistraro S. A combined atomic force microscopy imaging and docking study to investigate the complex between p53 DNA binding domain and Azurin. J Mol Recogn. 2009;22:506–515. | |
Kozakov D, Hall DR, Beglov D, et al. Achieving reliability and high accuracy in automated protein docking: ClusPro, PIPER, SDU, and stability analysis in CAPRI rounds 13–19. Proteins. 2010;78:3124–3130. | |
Meireles LM, Domling AS, Camacho CJ. ANCHOR: a web server and database for analysis of protein-protein interaction binding pockets for drug discovery. Nucleic Acids Res. 2010;38:W407–W411. | |
Friddle RW, Sulchek TA, Albrecht H, De Nardo SJ, Noy A. Counting and breaking individual biological bonds: force spectroscopy of tethered ligand-receptor pairs. Curr Nanosci. 2007;3:41–48. | |
Funari G, Domenici F, Nardinocchi L, et al. Interaction of p53 with Mdm2 and azurin as studied by atomic force spectroscopy. J Mol Recogn. 2010;23:343–351. | |
Hutter JL, Bechhoefer J. Calibration of atomic-force microscope tips. Rev Sci Instrum. 1993;64:1868–1873. | |
De Paris R, Strunz T, Oroszlan K, Guntherold HJ, Hegner M. Force spectroscopy and dynamics of the biotin-avidin bond studied by scanning force microscopy. Single Mol. 2000;1(4):285–290. | |
Shaulian E, Zauberman A, Ginsberg D, Oren M. Identification of a minimal transforming domain of p53: negative dominance through abrogation of sequence-specific DNA binding. Mol Cell Biol. 1992;12:5581–5592. | |
Kichina JV, Rauth S, Das Gupta TK, Gudkov AV. Melanoma cells can tolerate high levels of transcriptionally active endogenous p53 but are sensitive to retrovirus-transduced p53. Oncogene. 2003;22:4911–4917. | |
Chen C, Gorlatova N, Kelman Z, Herzberg O. Structures of p63 DNA binding domain in complexes with half-site and with spacer-containing full response elements. Proc Natl Acad Sci U S A. 2011;108:6456–6461. | |
Hosaka M, Watanabe T, Sakai Y, Kato T, Takeuchi T. Interaction between secretogranin III and carboxypeptidase E facilitates prohormone sorting within secretory granules. J Cell Sci. 2005;118:4785–4795. | |
Harms KL, Chen X. The functional domains in p53 family proteins exhibit both common and distinct properties. Cell Death Differ. 2006;13:890–897. | |
Fomenkov A, Zangen R, Huang YP, et al. RACK1 and stratifin target ΔNp63α for a proteasome degradation in head and neck squamous cell carcinoma cells upon DNA damage. Cell Cycle. 2004;3:1285–1295. | |
Melino G, Knight RA, Cesareni G. Degradation of p63 by Itch. Cell Cycle. 2006;5:1735–1739. | |
Li Y, Zhou Z, Chen C. WW domain-containing E3 ubiquitin protein ligase 1 targets p63 transcription factor for ubiquitin-mediated proteasomal degradation and regulates apoptosis. Cell Death Differ. 2008;15:1941–1951. | |
Kienberger F, Pastushenko VP, Kada G, et al. Static and dynamical properties of single poly (ethylene glycol) molecules investigated by force spectroscopy. Single Mol. 2000;1:123–128. | |
Thormann E, Hansen PL, Simonsen AC, Mouritsen OG. Dynamic force spectroscopy on soft molecular systems: improved analysis of unbinding spectra with varying linker compliance. Coll Surf B Biointerfaces. 2006;53:149–156. | |
Bizzarri AR, Cannistraro S. The application of atomic force spectroscopy to the study of biological complexes undergoing a biorecognition process. Chem Soc Rev. 2010;39:734–749. | |
Hinterdorfer P, Dufrene YF. Detection and localization of single molecular recognition events using atomic force microscopy. Nat Methods. 2006;3:347–355. | |
Bell GI. Models for the specific adhesion of cells to cells. Science. 1978;200:618–627. | |
Evans E, Ritchie K. Dynamic strength of molecular adhesion bonds. Biophys J. 1997;72:1541–1555. | |
Taranta M, Bizzarri AR, Cannistraro S. Probing the interaction between p53 and the bacterial protein azurin by single molecule force spectroscopy. J Mol Recognit. 2008;21:63–70. | |
Sheng Y, Laister RC, Lemak A, et al. Molecular basis of Pirh2-mediated p53 ubiquitylation. Nat Struct Mol Biol. 2008;15:1334–1342. | |
Wu H, Zeinab RA, Flores ER, Leng RP. Pirh2, a ubiquitin E3 ligase, inhibits p73 transcriptional activity by promoting its ubiquitination. Mol Cancer Res. 2011;9:1780–1790. | |
Qian Y, Jung YS, Chen X. ΔNp63, a target of DEC1 and histone deacetylase 2, modulates the efficacy of histone deacetylase inhibitors in growth suppression and keratinocyte differentiation. J Biol Chem. 2011;286:12033–12041. | |
Watson IR, Irwin MS. Ubiquitin and ubiquitin-like modifications of the p53 family. Neoplasia. 2006;8:655–666. | |
Rossi M, De Laurenzi V, Munarriz E, et al. The ubiquitin-protein ligase Itch regulates p73 stability. EMBO J. 2005;24:836–848. | |
Ozaki T, Watanabe K, Nakagawa T, Miyazaki K, Takahashi M, Nakagawara A. Function of p73, not of p53, is inhibited by the physical interaction with RACK1 and its inhibitory effect is counteracted by pRB. Oncogene. 2003;22:3231–3242. | |
Harmes DC, Bresnick E, Lubin EA, et al. Positive and negative regulation of ΔN-p63 promoter activity by p53 and ΔN-p63-α contributes to differential regulation of p53 target genes. Oncogene. 2003;22:7607–7616. | |
Vilgelm A, El-Rifai W, Zaika A. Therapeutic prospects for p73 and p63: rising from the shadow of p53. Drug Resist Updat. 2008;11:152–163. | |
Xu Z, Ceshi C. WWP1: a versatile ubiquitin E3 ligase in signaling and diseases. Cell Mol Life Sci. 2012;69:1425–1434. |
 © 2014 The Author(s). This work is published and licensed by Dove Medical Press Limited. The full terms of this license are available at https://www.dovepress.com/terms.php and incorporate the Creative Commons Attribution - Non Commercial (unported, v3.0) License.
By accessing the work you hereby accept the Terms. Non-commercial uses of the work are permitted without any further permission from Dove Medical Press Limited, provided the work is properly attributed. For permission for commercial use of this work, please see paragraphs 4.2 and 5 of our Terms.
© 2014 The Author(s). This work is published and licensed by Dove Medical Press Limited. The full terms of this license are available at https://www.dovepress.com/terms.php and incorporate the Creative Commons Attribution - Non Commercial (unported, v3.0) License.
By accessing the work you hereby accept the Terms. Non-commercial uses of the work are permitted without any further permission from Dove Medical Press Limited, provided the work is properly attributed. For permission for commercial use of this work, please see paragraphs 4.2 and 5 of our Terms.