")
Back to Journals » Cancer Management and Research » Volume 11
A Multi-Element Expression Score Is A Prognostic Factor In Glioblastoma Multiforme
Authors Li JQ, Wang QT, Nie Y, Xiao YP, Lin T, Han RJ, Li Z, Fan YY, Yuan XH, Wang YM, Zhang J, He YW , Liao HX
Received 21 August 2019
Accepted for publication 9 October 2019
Published 17 October 2019 Volume 2019:11 Pages 8977—8989
DOI https://doi.org/10.2147/CMAR.S228174
Checked for plagiarism Yes
Review by Single anonymous peer review
Peer reviewer comments 2
Editor who approved publication: Dr Eileen O'Reilly
Jun-Qi Li,1,* Qian-Ting Wang,1,2,* Ying Nie,2 Yun-Peng Xiao,3 Tao Lin,2 Ru-Jin Han,2 Zhe Li,2 Yu-Ying Fan,2 Xiao-Hui Yuan,1 Yue-Ming Wang,4 Jian Zhang,2 You-Wen He,5 Hua-Xin Liao1
1Department of Cell Biology and Institute of Biomedicine, College of Life Science and Technology, Jinan University, National Engineering Research Center of Genetic Medicine, Guangzhou 510632, People’s Republic of China; 2Guangdong 999 Brain Hospital, Guangzhou 510510, People’s Republic of China; 3Guangzhou Trinomab Biotechnology Co., Ltd, Guangzhou 510632, People’s Republic of China; 4Zhuhai Trinomab Biotechnology Co., Ltd., Zhuhai 519040, People’s Republic of China; 5Department of Immunology, Duke University Medical Center, Durham, NC 27710, USA
*These authors contributed equally to this work
Correspondence: Hua-Xin Liao
College of Life Science and Technology, 704 2nd Science and Engineering Building, Jinan University, 601 Huang Pu Avenue West, Guangzhou 510632, People’s Republic of China
Tel/Fax +86 20 8522 2062
Email [email protected]
You-Wen He
Department of Immunology, Duke University Medical Center, Durham NC 27710, USA
Tel/Fax +1 919 613 7870
Email [email protected]
Purpose: Glioblastoma multiforme (GBM) is a highly malignant tumor of the central nervous system. Although primary GBM patients receive extensive therapies, tumors may recur within months, and there is no objective and scientific method to predict prognosis. Adoptive immunotherapy holds great promise for GBM treatment. However, the expression profiles of the tumor-associated antigens (TAAs) and tumor immune microenvironment (TME) genes used in immunotherapy of GBM patients have not been fully described. The present study aimed to develop a predictive tool to evaluate patient survival based on full analysis of the expression levels of TAAs and TME genes.
Methods: Expression profiles of a panel of 87 TAAs and 8 TME genes significantly correlated with poor prognosis were evaluated in 44 GBM patients and 10 normal brain tissues using quantitative real-time polymerase chain reaction (qRT-PCR). A linear formula (the LASSO algorithm based in the R package) weighted by regression coefficients was used to develop a multi-element expression score to predict prognosis; this formula was cross-validated by the leave-one-out method in different GBM cohorts.
Results: After analysis of gene expression, clinical features, and overall survival (OS), a total of 8 TAAs (CHI3L1, EZH2, TRIOBP, PCNA, PIK3R1, PRKDC, SART3 and EPCAM), 1 TME gene (FOXP3) and 4 clinical features (neutrophil-to-lymphocyte (NLR), number of basophils (BAS), age and treatment with standard radiotherapy and chemotherapy) were included in the formula. There were significant differences between high and low scoring groups identified using the formula in different GBM cohorts (TCGA (n=732) and GEO databases (n=84)), implying poor and good prognosis, respectively.
Conclusion: The multi-element expression score was significantly associated with OS of GBM patients. The improve understanding of TAAs and TMEs and well-defined formula could be implemented in immunotherapy for GBM to provide better care.
Keywords: glioblastoma, gene expression score, prognosis, TAAs, TME
Introduction
Glioblastoma multiforme (GBM, also known as astrocytoma grade IV) is the most common and deadliest primary brain tumor, representing 30% of all central nervous system tumors.1 GBM exhibits various pathophysiological features of malignancy, including necrosis, vascular proliferation and pleomorphism.2 Owing to the blood-brain barrier, which restricts the infiltration of most antitumor drugs into the central nervous system, the standard treatment of GBM is limited to surgical resection followed by radiotherapy in combination with a chemotherapy (temozolomide, TMZ).3 However, surgical treatment for GBM is often compromised by the complexity of the intracranial operation and the dislodgement of tumor tissues. Residual tumor cells can lead to tumor recurrence within a relatively short time.4,5 Owing to the strong resistance of tumor cells to conventional therapies, including surgery, chemotherapy and radiotherapy, the median survival time of GBM patients with treatment is approximately only 12.5 months, and the two-year survival rate is less than 25%.6 Without any treatment, most GBM patients survive for only a few months.7
Recently, a variety of adoptive immunotherapies, including chimeric antigen receptor T cell immunotherapy (CAR-T), tumor-specific T cell receptors (TCR-T) and a multi-epitope-pulsed dendritic cell (DC) vaccine, have been used for the clinical treatment of GBM and showed major advantages.8–10 T cells can move through tissues, scan for MHC complexes and then activate their specific T cell receptors. In addition, tumor-specific T cells can be activated when encountering the TAAs of specialized antigen-presenting cells, including DCs.11 Moreover, a positive immune response to immunotherapy depends on dynamic interactions between tumor cells and immunomodulators inside the tumor microenvironment (TME).12 The TME is composed of tumor cells, stromal cells, inflammatory cell vasculature and extracellular matrices.13 Immunotherapies, which are capable of activating the immune system, expanding effector cells, infiltrating activated effector cells to the tumor tissue, and destroying tumor cells, exhibited successful tumor control.14 However, the TME usually prevents effective priming of lymphocyte, reduces there infiltration, and also suppresses infiltrating effector cells, leading to failure of immunotherapy.12 For example, PD-L1, the ligand of programmed cell death protein 1 (PD-1), can combine with T cells and inhibit their activation and then induce their exhaustion.15 Therefore, to improve the effectiveness of immunotherapies, especially those using specific TAAs as vaccine for personalized precision immunotherapies, a clear and more precise understanding of the expression of TAAs and TME gene in tumor cells is essential.9,10
With regard to the extreme short survival time of GBM patients, it is also very important to identify a method to accurately predict prognosis and to find an appropriate therapeutic scheme for patients. Currently, evaluation of prognosis for patients relies mainly on the clinical experience of doctors; a more comprehensive and exhaustive analysis is urgently needed. Recently, several gene signatures have been shown to predict prognostic outcomes. A previous study analyzed four data sets and identified a liver-specific, 7-gene signature that was correlated with a poor prognosis in Hepatocellular carcinomas (HCCs).16 Another study reported prognostic signatures derived from an optimized 5-gene platform to predict metastatic outcome independent of adjuvant chemotherapy use.17 Ng et al generated a 17-gene leukemia stem cell (LSC) score by extracting a list of genes differentially expressed in 78 acute myeloid leukemia (AML) patients and used this for analysis of five independent AML cohorts. The score was predictive of therapy resistance and patients with high LSC scores generally had a poor prognosis.18 However, the gene signatures for GBM remain to be elucidated. Therefore, it is imperative to develop a more objective and scientific evaluation method to predict the prognosis of GBM patients.
In this study, we designed specific primers for qRT-PCR to amplify 87 TAAs and 8 TME genes that were associated with tumorigenesis or had been used in clinical trials, and analyzed the expression levels of these genes in brain tumor tissues from 44 GBM patient tissues and 10 controls.19–28 We detected and quantified the mRNAs of these genes by qRT-PCR. All of the TAAs we selected induced immune responses, and some had already been used in the immunotherapy of other cancers.29–32 More importantly, we also analyzed the relationships between gene expression levels of these TAA/TME genes, clinical characteristics and OS using a linear regression method, and designed a system to predict prognosis of the patients. This may be helpful for designing clinical treatment and immunotherapy for GBM patients.
Materials And Methods
Patients And Tissues
Primary brain tumor tissues were obtained from 44 patients with stage IV GBM who underwent surgery at the Guangdong 999 Brain Hospital. None of these patients had received chemotherapy before surgery in this study. Normal brain tissues were obtained during surgical treatment of patients with non-malignant tumors or with trauma. Informed consent was obtained before collection of tissue samples in accordance with the Declaration of Helsinki and under the protocols approved by the Ethics Committee of the Guangdong 999 Brain Hospital. Clinic and pathological patient information is summarized in Table 1.
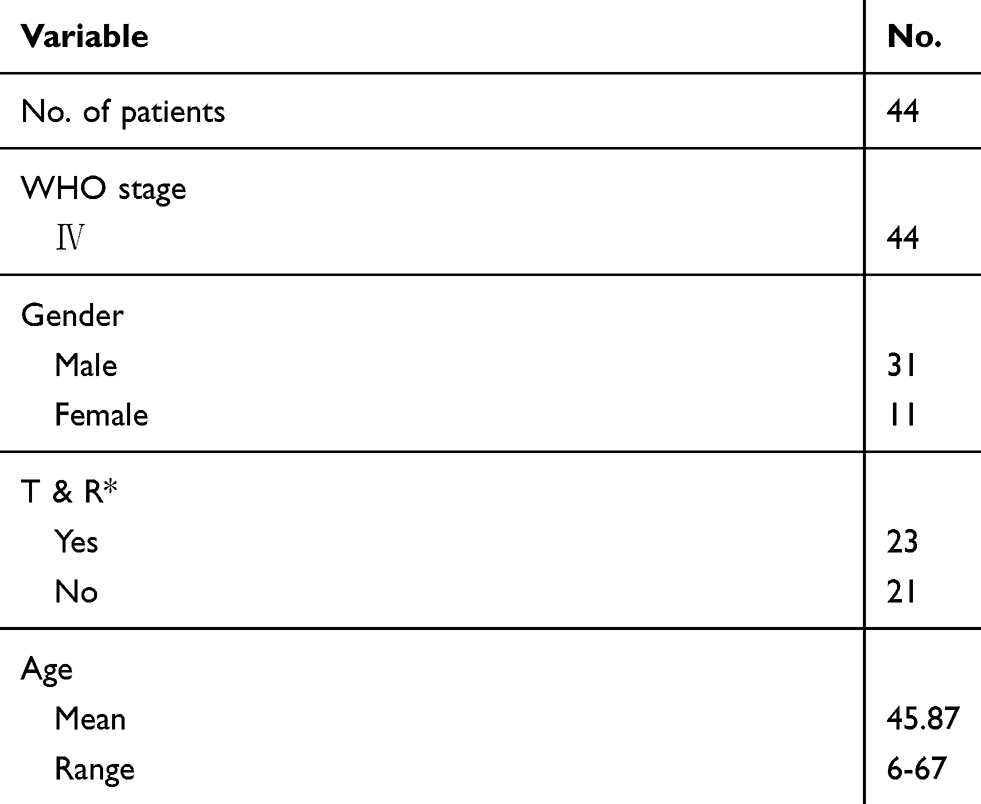 |
Table 1 Clinical Characteristics Of The GBM Patients In This Study |
RNA Isolation And RT-PCR
Total RNA was isolated from 100 mg of tissue by using an RNeasy mini kit (Qiagen, Germany) according to the user’s manual. The cDNA was transcribed from 1 μg of RNA using a High-Capacity cDNA Reverse Transcription kit (Thermo Fisher, USA). Expression levels of the genes of interest were evaluated by gene amplification with specific primers (Table 2) on a CFX96 Real-Time system (Bio-Rad, USA) with human house gene glyceraldehyde-3-phosphate dehydrogenase (GAPDH) as a loading control, using SYBR kit (Thermo Fisher, USA). The expression value of GAPDH was used to normalize the quantification of the relative expression of the TAAs and TME genes. The relative expression level of the targeted genes in patients were compared with the average expression level of the targeted genes in normal brain tissue using the 2−ΔΔC formula.
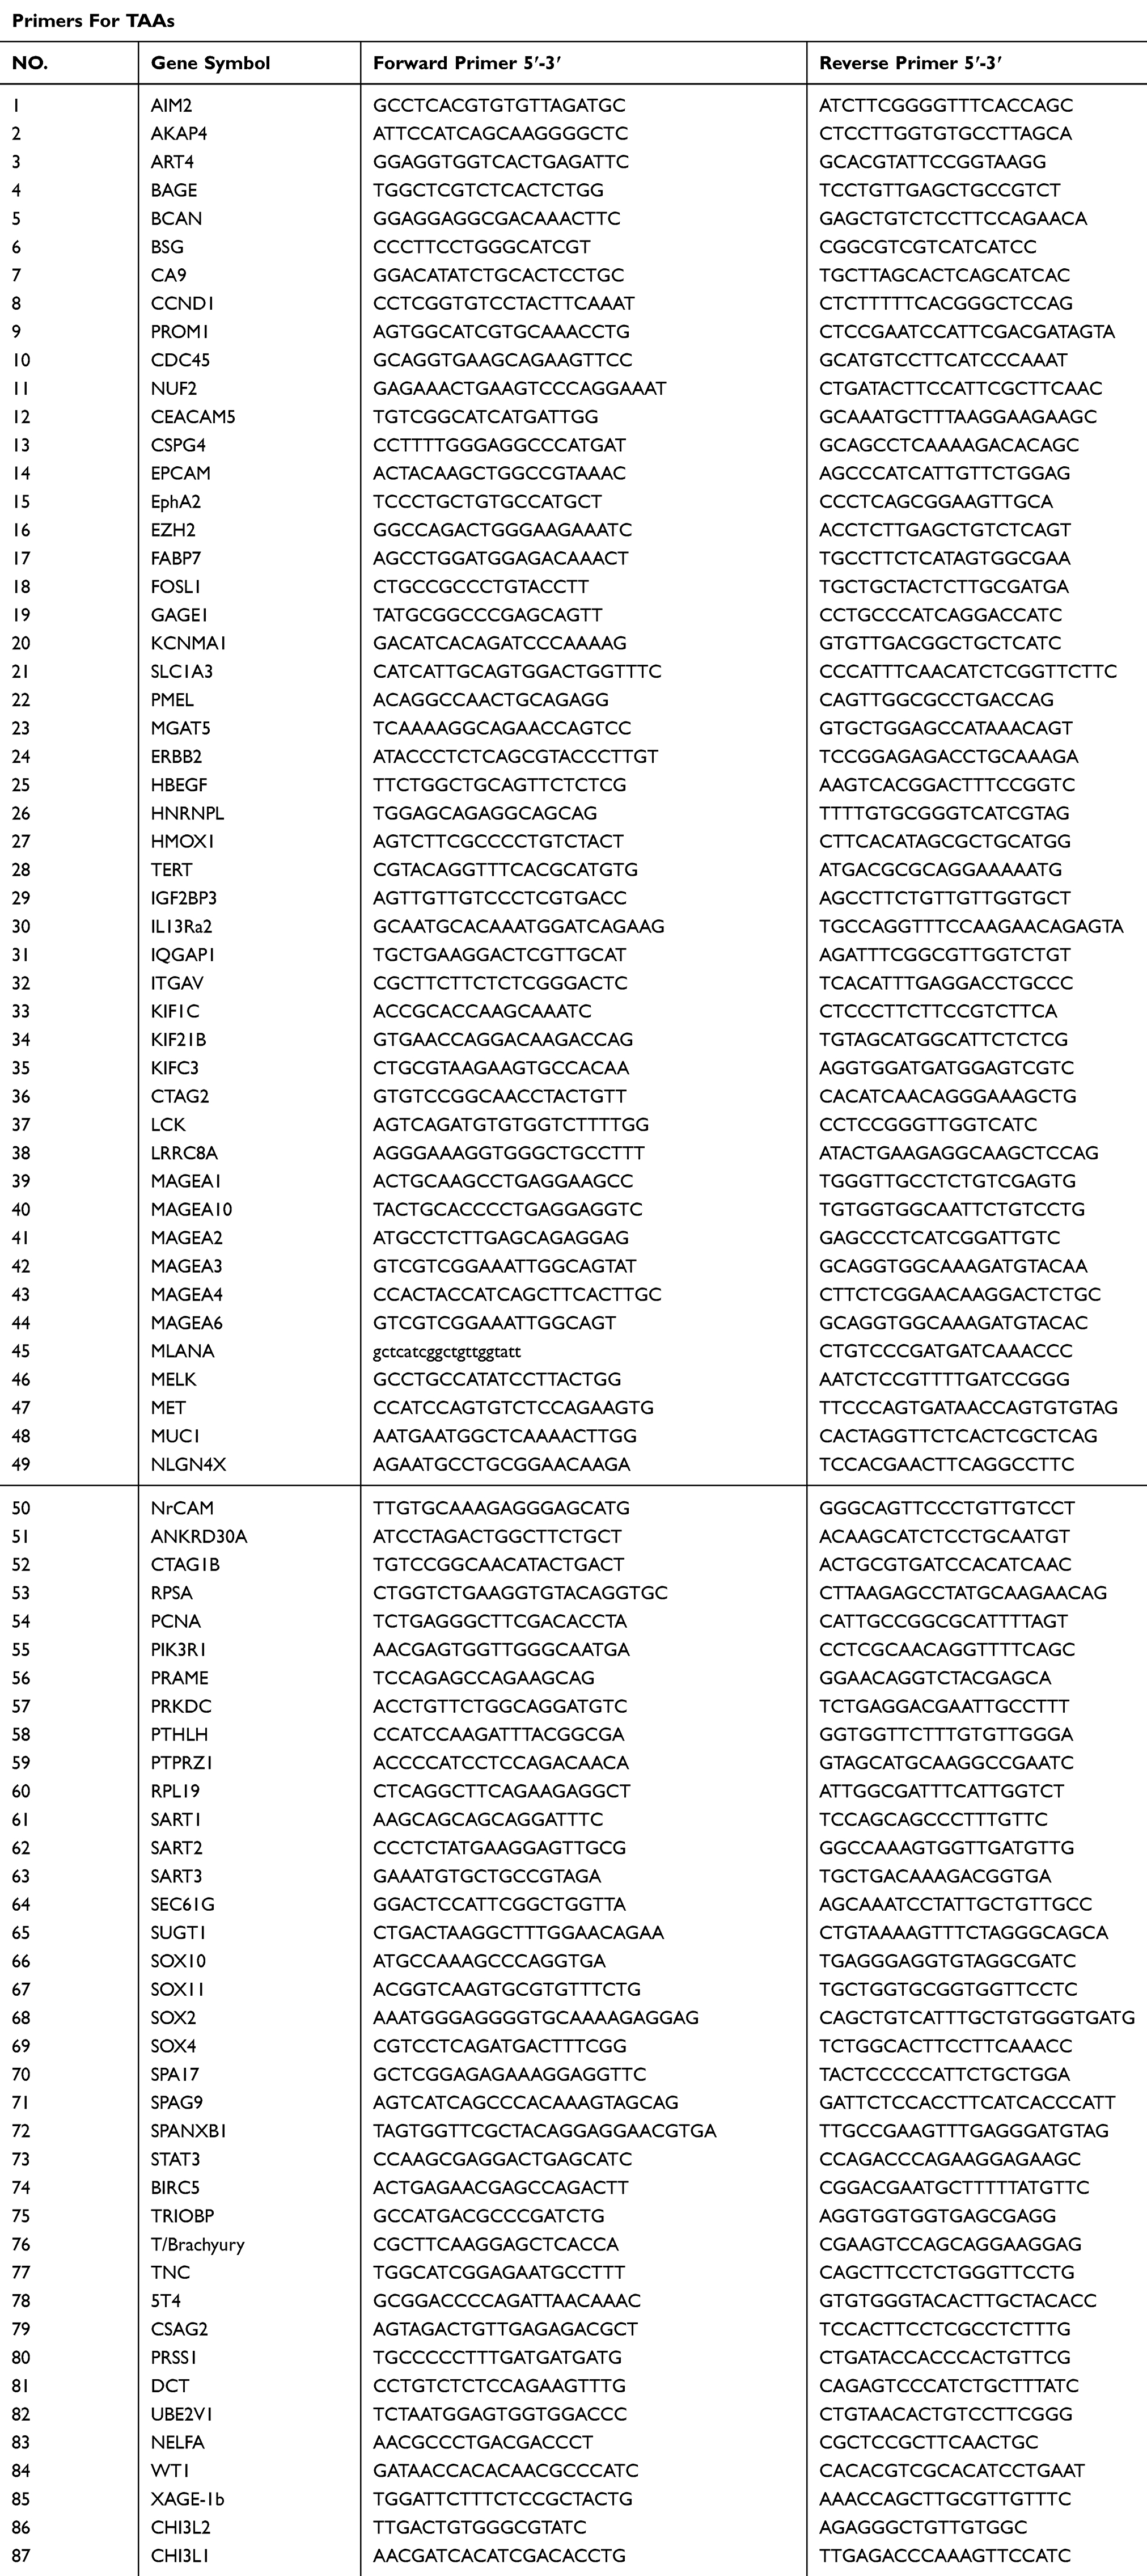 |
Table 2 Primers Used For Amplifying TAAs And TME Genes |
Based on previous research, we selected 87 TAAs and 8 TME genes that were associated with tumor oncogenicity, proliferation and metastasis or had been used in clinical trials. Specific primers for optimal amplification of these genes were designed using Primer 5 and DNAMAN software and are listed in in Table 2. The specificity of the TAAs and TME genes amplified by RT-PCR using these primers was confirmed by sequencing analysis of the PCR products.
Data Analysis, Signature Training And Statistical Analysis
Heat maps were generated using the MultiExperiment Viewer 4.9.0 software. To code the qRT-PCR data for use with the software, the gene expression levels of the 87 TAAs and 8 TME genes in the GBM tumor tissues and in the normal brain tissues were compared. When the expression level of a given gene in GBM tumor tissue was lower than, equal to, or higher than the mean value of the expression level of the corresponding gene in normal brain tissue, it was defined as < 0, =0, or >0, respectively.
Based on the overall median survival time (12.5 months), 44 GBM patients were divided into two groups depending on whether their survival was <12.5-months or >12.5-months. For both clinical characteristics and gene signatures, we used a linear regression method based on the LASSO algorithm as executed in the R package, and the leave-one-out cross-validation method was used to fit a Cox regression model.18 The clinical characteristics used in the formula included the NLR, the number of eosinophils (EOS) and BAS. GBM patients receiving standard chemotherapy and radiotherapy treatment were assigned a value of 1, otherwise, those patients were assigned a value of 0. The gene expression score was calculated as a linear formula weighted by regression coefficients as follows:
Y1 (Gene expression (GE) score for TAAs) = 0.153*CHI3L1-0.167*EZH2-0.075*PCNA-0.141*PIK3R1-0.046*PRKDC-0.004*SART3-0.121*EPCAM;
Y2 (GE score for TAAs and TME genes) = 0.143*CHI3L1-0.165*EZH2-0.020*PCNA
-0.163*PIK3R1-0.013*PRKDC-0.125*EPCAM-0.099*FOXP3;
Y3 (GE score for TAAs and TME genes, age and treatment) =0.049*CHI3L1-0.133*EZH2-0.066*TRIOBP-0.098*PIK3R1-0.008*PRKDC-0.066*SART3-0.102*EPCAM+0.116*Age-0.131*Treatment;
Y4 (GE score for TAAs and TME genes, NLR and BAS) =0.146*CHI3L1-0.201*EZH2-0.038*TRIOBP-0.092*PIK3R1-0.017*PRKDC-0.110*EPCAM-0.013*FOXP3+0.269*NLR+0.256*BAS; and
Y5 (GE score for TAA and TME genes and all clinical characteristics) = 0.110*CHI3L1-0.150*EZH2-0.066*TRIOBP-0.098*PIK3R1-0.008*PRKDC-0.102*EPCAM+0.237*NLR+0.155*BAS+0.116*Age-0.131*Treatment.
The statistical analysis was performed by using SPSS 19 and GraphPad Prism 7.0. Two-tailed t-tests were used to evaluate the correlation between patients and the other elements. OS was defined as the time from diagnosis of GBM until the patient’s death or the end of follow-up. Univariate analysis and multivariate survival analysis were performed using Kaplan-Meier and Cox regression, respectively.
Results
Expression Of TAAs And TME Genes In GBM Tumor Tissues
We investigated the mRNA expression levels of a panel of 87 TAAs and 8 TME genes in tumor tissues from 44 GBM patients in comparison with 10 normal brain tissues (Figure 1). A two-fold increase in mRNA expression level of a TAA relative to the mean expression level in the 10 normal brain tissues was defined as a positive result. A total of 14 TAAs were identified as positive in GBM tumors at the population level (Figure 1A and B), while the other tested TAAs showed no consistent increase or decrease in GBM patients compared with normal brain tissues. We also evaluated the expression levels of 8 TME genes (Figure 1C and D) and found significantly higher expression of IDO1 and PDL-2 in GBM patients than in normal brain tissues.
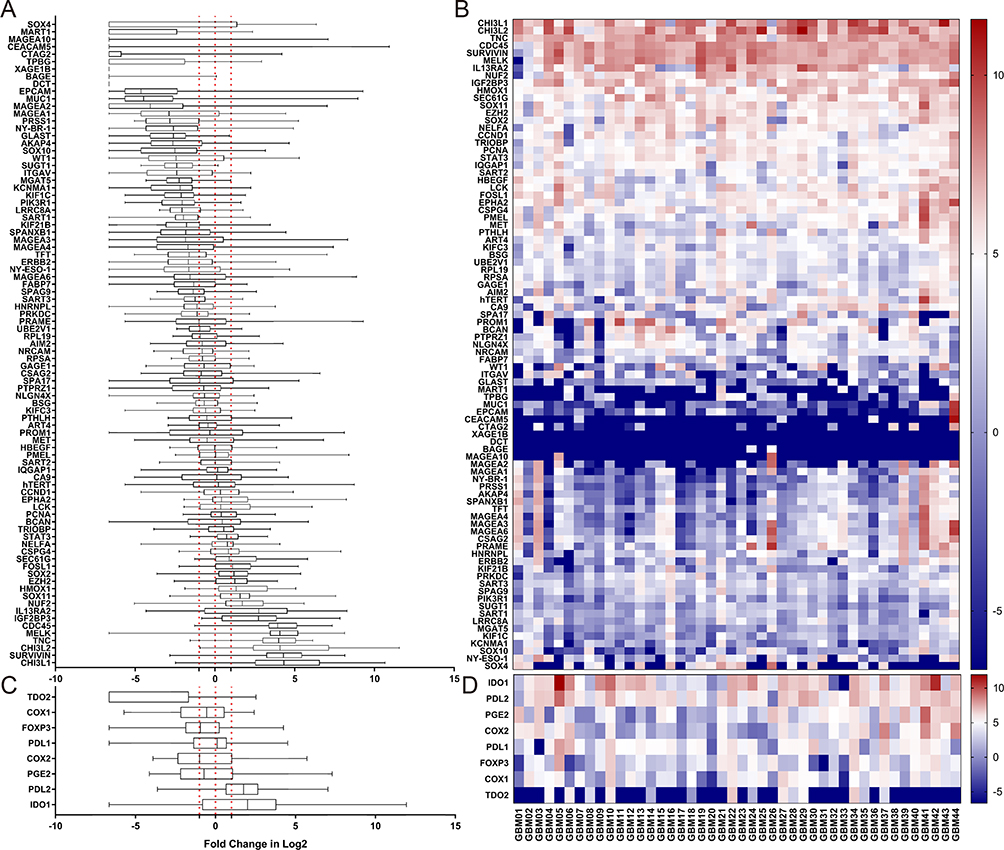 |
Figure 1 Relative expression levels of 87 TAA and 8 TME genes in tumor tissues of 44 GBM patients. Expression levels of each of the 87 TAAs and 8 TME genes in GBM patients were quantified by qRT-PCR and compared with the relevant gene expression level averaged from 10 normal brain tissues. Abbreviations on the y axis of the (A–D) of indicate the individual genes tested. GAPDH was used as the reference gene in this study. Fold change in gene expression level is indicated on the x axis in (A and C). Individual tumor tissues from 44 GBM patients are indicated on the x axis for (B and D). Gene expression levels of 87 TAAs are shown in (A and B), and expression levels of 8 TME genesis shown in (C and D). The red dotted line on the left in (A and C) indicates a two times lower gene expression level compared with the average level in normal tissues. The red dotted line in the middle indicates that the level of gene expression is the same as the average level in normal tissues. The red dotted line on the right indicates a two times higher gene expression level compared with the average level in normal tissues. <0, gene expression level lower than the average level in normal tissue (blue in the heat map). 0, the gene expression level the same as the average level in normal tissue (white in the heat map); >0, gene expression level higher than the average level in normal tissue (red in the heat map). |
Clinical Characteristics And Gene Expression Correlated With The OS Of GBM Patients
We next examined the contribution of clinical characteristics and gene expression to OS in 44 GBM patients by univariate analysis. Significant correlations with OS were found for age (p=0.0339, hazard ratio (HR): 1.6161, 95% CI: 1.0372–2.5179), postoperative standard of radiotherapy and chemotherapy (p=0.0082, HR: 0.3347, 95% CI: 0.1488–0.7532), NLR (p=0.0003, HR: 2.8430, 95% CI: 1.6037–5.0399), and BAS (p=0.0152, HR: 2.0712, 95% CI: 1.1509–3.7273) (Table 3). A total of 13 TAA genes with increased expression levels were significantly correlated with OS in GBM patients (Table 3). FOXP3 was the only gene among the 8 TME genes tested for which increased expression was significantly correlated with OS in GBM patients (p=0.0129, HR: 0.7544, 95% CI: 0.6042–0.9420).
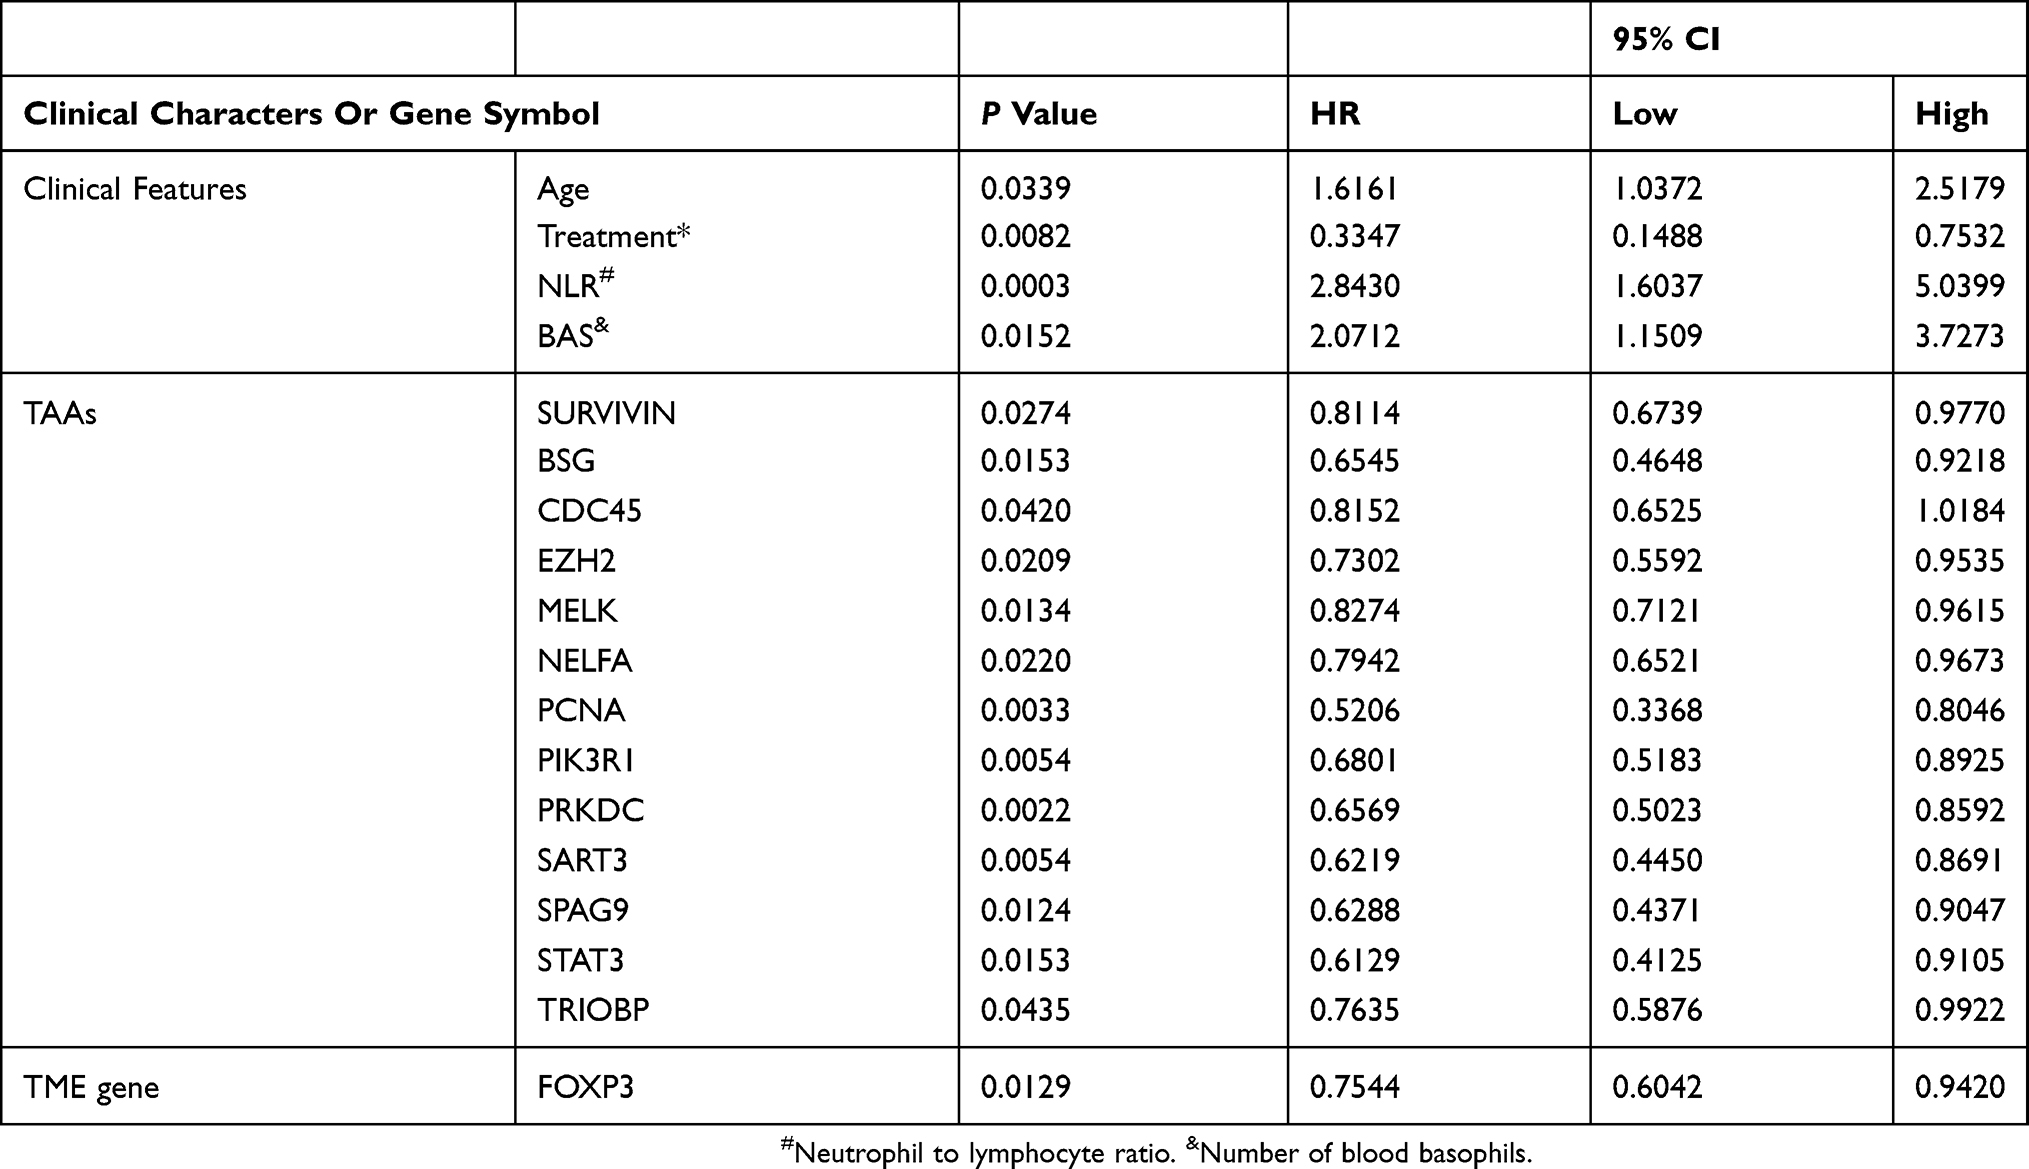 |
Table 3 Correlation Of Clinical Characteristics And Gene Expression Scores With The OS Of 44 GBM Patients |
Gene Expression Score Correlated With The OS Of GBM Patients
The median survival time of the GBM patient group with the OS <12.5 months and >12.5 months were plotted using Kaplan-Meier analysis in SPSS 19 (Figure 2A). We evaluated and correlated each of the clinical characteristics and gene signatures with the OS of the two GBM patient groups as described in the Material and Methods section. The overall scores (Table 4) evaluated based on the formulas (Y1-Y5) were significantly different between the two groups, demonstrating the reliability of these formulas (Figure 2B–F). When expression levels of TME genes and clinical features were added one by one to the Y1 formula, there was an increased trend in sensitivity, specificity and accuracy (Table 5).
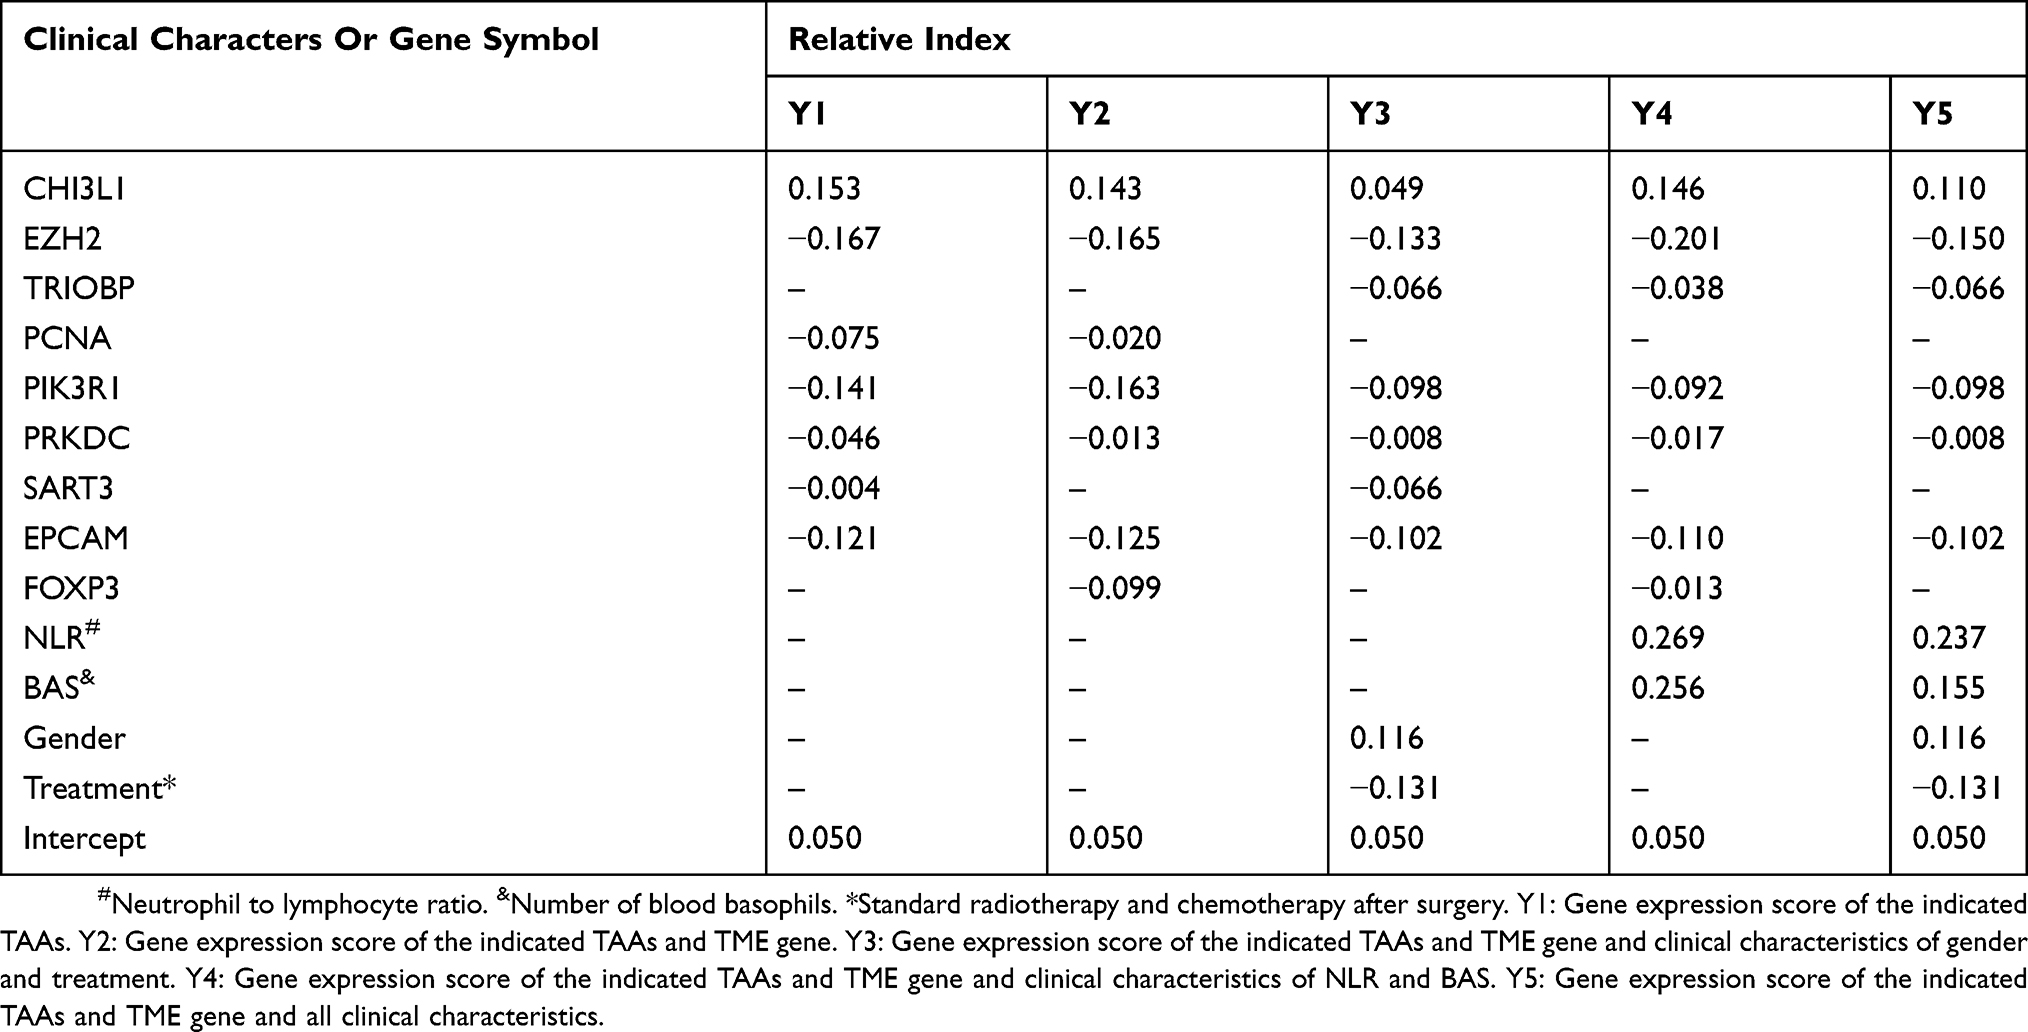 |
Table 4 Relative Index Of Different Models Based On The Correlation Between The Elements And The OS Of The 44 GBM Patients |
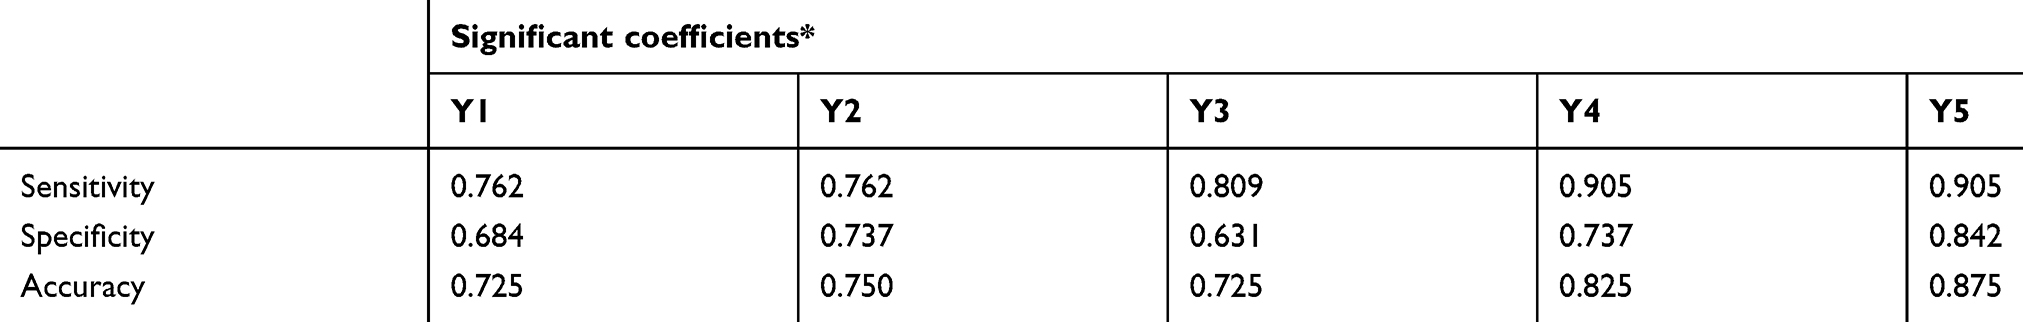 |
Table 5 Validation Of The Gene Expression Score Formulas (Y1-Y5) |
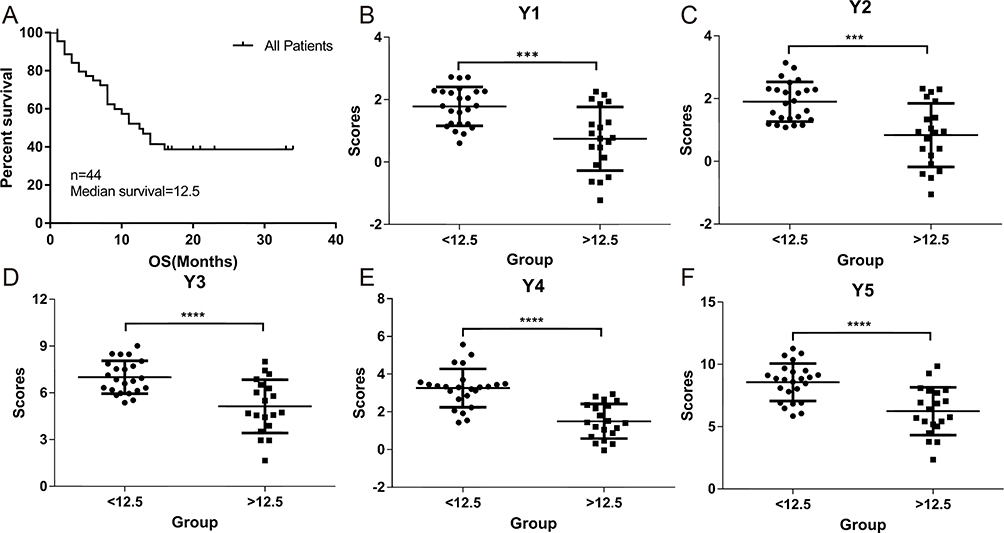 |
Figure 2 Correlation of gene expression scores in different models with the OS of GBM patients. The OS rate of the 44 GBM patients was plotted using Kaplan-Meier analysis (A). The median survival (12.5 months) was calculated and used to divide the patients into two patient groups with either <12.5 months or >12.5 months survival time. Five different models (Y1–Y5) using different combination of gene expression scores and clinical characteristics were used to examine the correlations between the two patient groups presented in (B–F). P values were calculated using the student’s t-test. *** indicates P <0.001 and **** indicates P <0.0001. |
To verify the sensitivity, specificity and accuracy of the gene expression score (Y1-Y5), we calculated gene expression scores for the 44 GBM patients individually, and grouped patients into high and low scoring groups based on the median score. The percentage of surviving GBM patients was significantly different (P<0.05, log rank test) between the high and low scoring groups with all of the five gene expression score formulas (Figure 3).
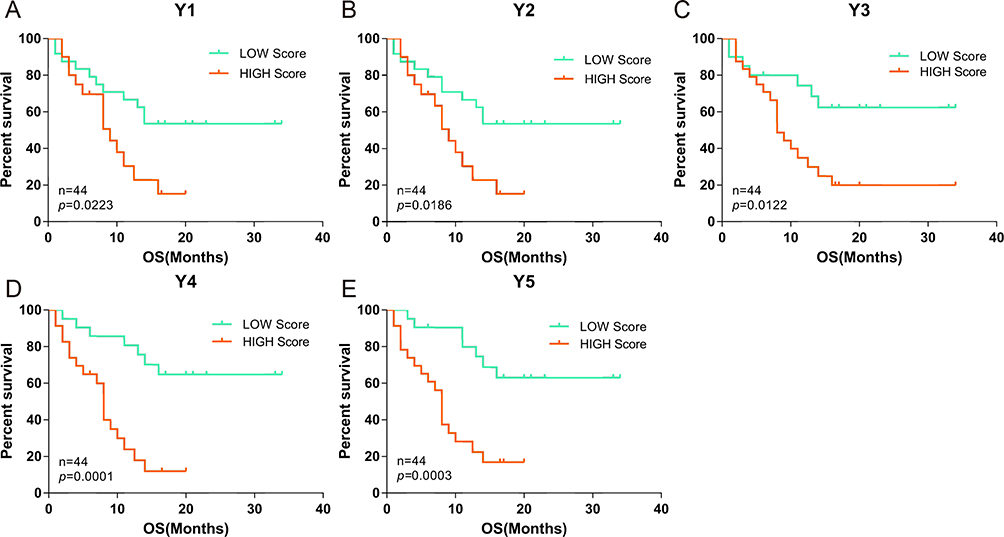 |
Figure 3 Correlation of the OS of the 44 GBM patients with high or low gene expression scores. Gene expression scores were calculated based on the level of gene expression of TAAs and TME genes quantified by qPCR as described in Material and Methods. Based on the level of gene expression, the 44 GBM patients were divided into low and high gene expression groups. Correlation of the percentage (on the y axis) of GBM patients with low (green curve) or high (red curve) gene expression scores with survival over time (x axis) was evaluated using 5 gene expression scoring models (Y1–Y5; A–E). P values were calculated using the log rank test and are indicated in the individual plots. |
Survival Analysis Of Patients Using TCGA And GEO Databases By Gene Expression Score (Y1-Y3)
Furthermore, to verify the applicability, sensitivity, specificity and accuracy of the formulas (Y1-Y3), gene expression scores were validated against published clinical GBM cohorts from the TCGA (Nature, 2008, n=527, Provisional, n=205) and GEO (GSE4412, n=84).33,34 As no information on NLR, EOS or BAS was available in these databases, we evaluated patients using only the Y1-Y3 formulas. Patients were again divided into high and low scoring groups with respect to gene expression, based on the median scores using the same method as described above (Figure 4). Again, we found significant differences between the two groups for each of the three different databases, as calculated by formulas Y1-Y3, with P values of 0.0033, 0.0018, and 0.0042 for patients in the TCGA (Nature, 2008) data set; 0.0399, 0.0294, and 0.0001 for patients in the TCGA (Provisional) data set; and 0.0139, 0.0095, and 0.0019 for patients in the GSE4412 data set.
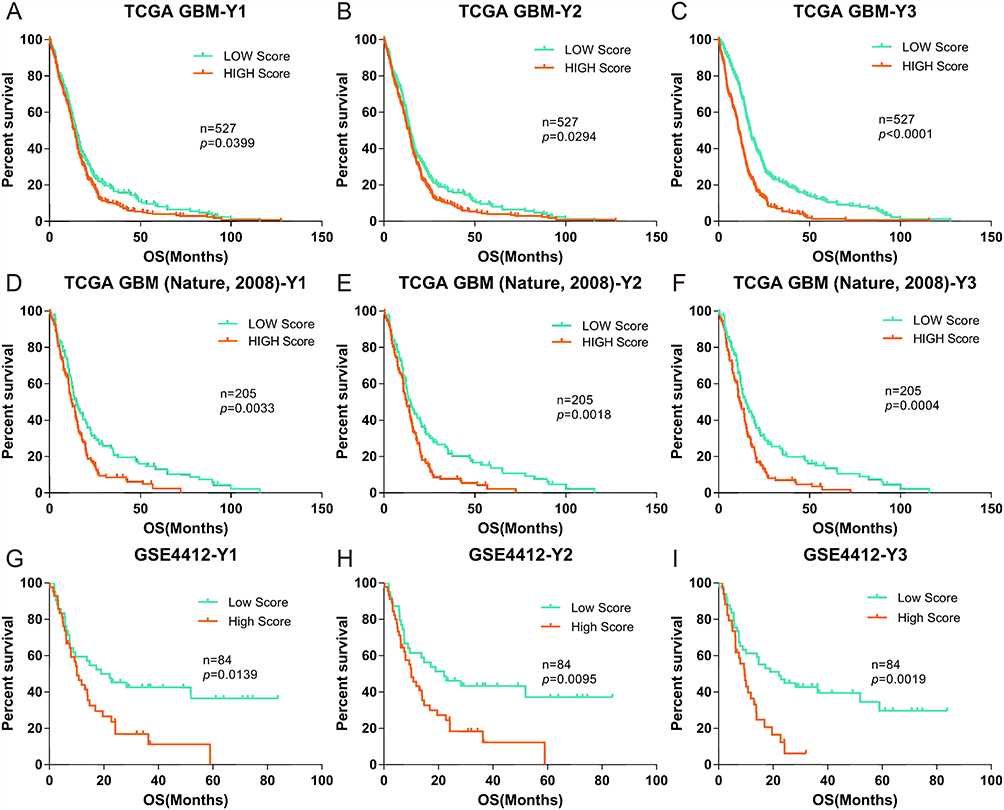 |
Figure 4 Correlation of the OS of GBM cohorts in the TCGA and GEO databases (Nature, 2008, Provisional and GSE4412) with low and high gene expression scores. (A-C), Kaplan-Meier evaluation of OS in the TCGA database Nature, 2008 based on gene expression scores (Y1–Y3); D-F and G-I data from the TCGA (Provisional) and GSE4412 databases, respectively. For all panels, the two groups with scores lower and higher than the median value in (A–C) are indicated by green and red lines, respectively. P values were calculated by using the log rank test, and are indicated in the individual plots. |
Discussion
In the present study, we first evaluated the expression levels of 87 TAAs and 8 TME genes in tumor tissues of 44 GBM patients compared with 10 normal tissues. We also established linear risk scores as survival prediction models based on the expression levels of the genes of interest and clinical characteristics for prediction of the prognosis of GBM patients.
Owing to the strong resistance of GBM to conventional therapies such as surgery, chemotherapy and radiotherapy, the median survival time of GBM patients with treatment is approximately only 12.5 months.35 In recent years, an increasing number of immunotherapies targeting human GBM and other solid cancers have been developed. CAR-T cells were generated from patients’ T cells using lentiviral transfection to introduce specific TAAs, leading to cell killing within a short time.36 Various of vaccine based immunotherapies, including DC based vaccines, autologous and allogeneic antigens vaccines, peptides vaccines and viral based vaccines, and the vaccine pulsed with specific TAAs were infused into patients and shown to stimulate autologous anti-tumor immune responses.28,36 The question remained how to predict the prognosis of patients in order to provide better and more effective treatment for GBM patients in such a short time. This study investigated whether prevalent and concomitant patterns of TAAs and TME genes expression in tumor tissues and clinical features of GBM patients could be used not only for prediction of prognosis but also for the design of cocktail immunotherapies (such as a multi-epitope-pulse DC vaccine).37 We determined the gene expression levels of 87 TAAs and 8 TME genes by qRT-PCR. All TAAs and TME genes selected in this study have been reported to be expressed in brain tumors and to induce a series of immune responses in vivo.26,30,38 Moreover, most, if not all, of these genes have already been used in clinical trials of immunotherapy.38,39 We identified 14 TAAs (CHI3L1, CHI3L2, BIRC5, TNC, MELK, CDC45, IGF2BP3, IL13Rα2, NUF2, SOX2, SOX11, HMOX1, EZH2 and FOSL1) with increased gene expression levels of in all GBM tumor tissues; these all have key roles in tumorigenesis, development, invasion and migration of brain tumors. For example, a bifunctional inhibitor of apoptosis protein BIRC5 is highly expressed in many human malignancies including GBM, where it plays important role in the proliferation, drug resistance and anti-apoptosis of cancer cells, and is correlated with the decrease OS.40 BIRC5 is also an ideal target for immunotherapy, and there are more than 60 ongoing or successfully completed clinical trials targeting BIRC5 listed on the Clinical trials website. One clinical study of a peptide vaccine targeting BIRC5 showed partial and even complete remission in participants.19 These TAAs that are highly expressed in almost all GBM patients could be used to design a cocktail DC vaccine. We also found individual differences in expression of some TAAs. For instance, TAAs such as IL13Rα2 was not highly expressed in all GBM patients, although it had been studied in a number of clinical trials involving GBM.41 Brown carried out CAR-T cell immunotherapy targeting IL13Rα2, and some patients showed anti-glioma responses.42 These results indicate that all TAAs that are highly expressed in individuals are of potential importance in clinical immunotherapy, and may have key roles in tumorigenesis, development, invasion and migration.
However, downregulation of immune responses mediated by the TME greatly decreases the effects of immunotherapy.43 In this study, we found that almost of all the GBM tumor tissues had elevated gene expression levels of TME genes (including IDO, TDO, PDL-1, COX2 and FOXP3). These results were consistent with previous observations that these genes have a key role in immune escape, invasion and angiogenesis.15 Thus, if these immunosuppression factors were neglected in immunotherapy, the treatment could be negative affected.
In addition, we examined several clinical features, including as age, gender, treatments, NLR, EOS and BAS. Correlation analysis of these clinical features with the OS of 44 GBM patients suggested that age, chemotherapy, radiotherapy and NLR are important prognostic factors in GBM patients. Similar observations have also been made in different malignant tumors.44–46
The diagnosis of GBM is currently based on the clinician’s experience and judgment, however this is often inaccurate and might change with the patient’s physical condition. The combination of gene expression levels and clinic factors may improve prediction accuracy, and have been used to identify a higher risk of recurrence and death.47 We designed mathematical models using a linear regression method based on the LASSO algorithm, starting with the gene expression levels of TAAs and adding expression levels of TME genes and clinical features one by one to optimize the models. In this way, we developed 5 models (Y1-Y5) with a cut-off value of 0.05 showing improvements with respect to sensitivity, specificity and accuracy (Table 4). These models were further validated using the relevant data in the TCGA and GEO databases suggesting that these formulas could be used objectively and accurately to predict prognosis of patients based on their gene expression scores.
Conclusion
In summary, our study established prognostic prediction models based on a full understanding of gene expression profiles that provides an accurate method for survival prediction and guidance for implementing better treatment strategies. The outcomes of this study will also benefit future personalized prediction and precision immunotherapy for GBM management.
Ethics Approval And Informed Consent
The study was approved by the Ethics Committee of the Guangdong 999 Brain Hospital, and all patients provided written informed consent in accordance with the Declaration of Helsinki.
Author Contributions
All authors contributed to data analysis, drafting and revising the article, gave final approval of the version to be published, and agree to be accountable for all aspects of the work.
Disclosure
Yue-Ming Wang and Yun-Peng Xiao are the Research Assistants of Zhuhai Trinomab Biotechnology Co., Ltd and Guangzhou Trinomab Biotechnology Co., Ltd, respectively. The authors report no other conflicts of interest in this work.
References
1. Buckingham SC, Campbell SL, Haas BR, et al. Glutamate release by primary brain tumors induces epileptic activity. Nat Med. 2011;17(10):1269–1274. doi:10.1038/nm.2453
2. Omuro A, DeAngelis LM. Glioblastoma and other malignant gliomas: a clinical review. JAMA. 2013;310(17):1842–1850. doi:10.1001/jama.2013.280319
3. Bernardi A, Braganhol E, Jager E, et al. Indomethacin-loaded nanocapsules treatment reduces in vivo glioblastoma growth in a rat glioma model. Cancer Lett. 2009;281(1):53–63. doi:10.1016/j.canlet.2009.02.018
4. Stupp R, Mason WP, van den Bent MJ, et al. Radiotherapy plus concomitant and adjuvant temozolomide for glioblastoma. N Engl J Med. 2005;352(10):987–996. doi:10.1056/NEJMoa043330
5. Chen Z, Wei X, Shen L, Zhu H, Zheng X. 20 (S)‐ginsenoside‐Rg3 reverses temozolomide resistance and restrains epithelial‐mesenchymal transition progression in glioblastoma. Cancer Sci. 2019;110(1):389.
6. Sabelström H, Quigley D, Fenster T, et al. High density is a property of slow-cycling and treatment-resistant human glioblastoma cells. Exp Cell Res. 2019;378:76–86. doi:10.1016/j.yexcr.2019.03.003
7. Ostrom QT, Gittleman H, Farah P, et al. CBTRUS statistical report: primary brain and central nervous system tumors diagnosed in the United States in 2006-2010. Neuro Oncol. 2013;15 Suppl 2:ii1–56. doi:10.1093/neuonc/not151
8. Klemen ND, Feingold PL, Goff SL, et al. Metastasectomy following immunotherapy with adoptive cell transfer for patients with advanced melanoma. Ann Surg Oncol. 2016;24(1):135–141.
9. Reardon DA, Freeman G, Wu C, et al. Immunotherapy advances for glioblastoma. Neuro-Oncology. 2014;16(11):1441–1458. doi:10.1093/neuonc/nou212
10. Suryadevara CM, Verla T, Sanchez-Perez L, et al. Immunotherapy for malignant glioma. Surg Neurol Int. 2015;6(Suppl 1):S68. doi:10.4103/2152-7806.170024
11. Phuphanich S, Wheeler CJ, Rudnick JD, et al. Phase I trial of a multi-epitope-pulsed dendritic cell vaccine for patients with newly diagnosed glioblastoma. Cancer Immunol Immunother. 2013;62(1):125–135. doi:10.1007/s00262-012-1319-0
12. Tang H, Qiao J, Fu YX. Immunotherapy and tumor microenvironment. Cancer Lett. 2016;370(1):85–90. doi:10.1016/j.canlet.2015.10.009
13. Klemm F, Joyce JA. Microenvironmental regulation of therapeutic response in cancer. Trends Cell Biol. 2015;25(4):198–213. doi:10.1016/j.tcb.2014.11.006
14. Yu P, Fu YX. Tumor-infiltrating T lymphocytes: friends or foes? Lab Invest. 2006;86(3):231–245. doi:10.1038/labinvest.3700389
15. Crespo J, Sun H, Welling TH, Tian Z, Zou W. T cell anergy, exhaustion, senescence, and stemness in the tumor microenvironment. Curr Opin Immunol. 2013;25(2):214–221. doi:10.1016/j.coi.2012.12.003
16. van Malenstein H, Gevaert O, Libbrecht L, et al. A seven-gene set associated with chronic hypoxia of prognostic importance in hepatocellular carcinoma. Clin Cancer Res. 2010. doi:10.1158/1078-0432.CCR-1009-3274
17. Yau C, Sninsky J, Kwok S, et al. An optimized five-gene multi-platform predictor of hormone receptor negative and triple negative breast cancer metastatic risk. Breast Cancer Res. 2013;15(5):R103. doi:10.1186/bcr3567
18. Ng SW, Mitchell A, Kennedy JA, et al. A 17-gene stemness score for rapid determination of risk in acute leukaemia. Nature. 2016;540(7633):433–437. doi:10.1038/nature20598
19. Wobser M, Keikavoussi P, Kunzmann V, Weininger M, Andersen MH, Becker JC. Complete remission of liver metastasis of pancreatic cancer under vaccination with a HLA-A2 restricted peptide derived from the universal tumor antigen survivin. Cancer Immunol Immunother. 2006;55(10):1294–1298. doi:10.1007/s00262-005-0102-x
20. Greenhough A, Smartt HJ, Moore AE, et al. The COX-2/PGE2 pathway: key roles in the hallmarks of cancer and adaptation to the tumour microenvironment. Carcinogenesis. 2009;30(3):377–386. doi:10.1093/carcin/bgp014
21. Inaba T, Ino K, Kajiyama H, et al. Role of the immunosuppressive enzyme indoleamine 2,3-dioxygenase in the progression of ovarian carcinoma. Gynecol Oncol. 2009;115(2):185–192. doi:10.1016/j.ygyno.2009.07.015
22. Baselga J, Bradbury I, Eidtmann H, et al. Lapatinib with trastuzumab for HER2-positive early breast cancer (NeoALTTO): a randomised, open-label, multicentre, phase 3 trial. Lancet. 2012;379(9816):633–640. doi:10.1016/S0140-6736(11)61847-3
23. Wang X, Osada T, Wang Y, et al. CSPG4 protein as a new target for the antibody-based immunotherapy of triple-negative breast cancer. J Natl Cancer Inst. 2010;102(19):1496–1512. doi:10.1093/jnci/djq343
24. Balyasnikova IV, Wainwright DA, Solomaha E, et al. Characterization and immunotherapeutic implications for a novel antibody targeting interleukin (IL)-13 receptor alpha2. J Biol Chem. 2012;287(36):30215–30227. doi:10.1074/jbc.M112.370015
25. De Rosa A, Pellegatta S, Rossi M, et al. A radial glia gene marker, fatty acid binding protein 7 (FABP7), is involved in proliferation and invasion of glioblastoma cells. PLoS One. 2012;7(12):e52113. doi:10.1371/journal.pone.0052113
26. Hsu KF, Shen MR, Huang YF, et al. Overexpression of the RNA-binding proteins Lin28B and IGF2BP3 (IMP3) is associated with chemoresistance and poor disease outcome in ovarian cancer. Br J Cancer. 2015;113(3):414–424. doi:10.1038/bjc.2015.254
27. Lu X, Liu J, Cui P, et al. Co-inhibition of TIGIT, PD1, and Tim3 reverses dysfunction of Wilms tumor protein-1 (WT1)-specific CD8+ T lymphocytes after dendritic cell vaccination in gastric cancer. Am J Cancer Res. 2018;8(8):1564.
28. Cuoco JA, Benko MJ, Busch CM, Rogers CM, Prickett JT, Marvin EA. Vaccine-based immunotherapeutics for the treatment of glioblastoma: advances, challenges, and future perspectives. World Neurosurg. 2018;120:302–315. doi:10.1016/j.wneu.2018.08.202
29. Sayour EJ, McLendon P, McLendon R, et al. Increased proportion of FoxP3+ regulatory T cells in tumor infiltrating lymphocytes is associated with tumor recurrence and reduced survival in patients with glioblastoma. Cancer Immunol Immunother. 2015;64(4):419–427. doi:10.1007/s00262-014-1651-7
30. Dutoit V, Herold-Mende C, Hilf N, et al. Exploiting the glioblastoma peptidome to discover novel tumour-associated antigens for immunotherapy. Brain. 2012;135(4):1042–1054. doi:10.1093/brain/aws042
31. Azad TD, Razavi S-M, Jin B, Lee K, Li G. Glioblastoma antigen discovery—foundations for immunotherapy. J Neurooncol. 2015;123(3):347–358. doi:10.1007/s11060-015-1836-8
32. Dellinger RP, Levy MM, Rhodes A, et al. Surviving sepsis campaign: international guidelines for management of severe sepsis and septic shock, 2012. Intensive Care Med. 2013;39(2):165–228. doi:10.1007/s00134-012-2769-8
33. Gao J, Aksoy BA, Dogrusoz U, et al. Integrative analysis of complex cancer genomics and clinical profiles using the cBioPortal. Sci Signal. 2013;6(269):pl1–pl1. doi:10.1126/scisignal.2004088
34. Cerami E, Gao J, Dogrusoz U, et al. The cBio cancer genomics portal: an open platform for exploring multidimensional cancer genomics data. Cancer Discov. 2012;2(5):401–404 doi:10.1094/PDIS-11-11-0999-PDN
35. Deorah S, Lynch CF, Sibenaller ZA, Ryken TC. Trends in brain cancer incidence and survival in the United States: surveillance, epidemiology, and end results program, 1973 to 2001. Neurosurg Focus. 2006;20(4):E1. doi:10.3171/foc.2006.20.4.E1
36. Zanders ED, Svensson F, Bailey DS. Therapy for glioblastoma: is it working? Drug Discov Today. 2019;24:1193–1201. doi:10.1016/j.drudis.2019.03.008
37. Karanikas V, Tsochas S, Boukas K, et al. Co-expression patterns of tumor-associated antigen genes by non-small cell lung carcinomas: implications for immunotherapy. Cancer Biol Ther. 2008;7(3):345–352. doi:10.4161/cbt.7.3.5424
38. Izumoto S, Tsuboi A, Oka Y, et al. Phase II clinical trial of Wilms tumor 1 peptide vaccination for patients with recurrent glioblastoma multiforme. J Neurosurg. 2008;108(5):963–971. doi:10.3171/JNS/2008/108/5/0963
39. Spigel DR, Ervin TJ, Ramlau RA, et al. Randomized phase II trial of Onartuzumab in combination with erlotinib in patients with advanced non-small-cell lung cancer. J Clin Oncol. 2013;31(32):4105–4114. doi:10.1200/JCO.2012.47.4189
40. Islam A, Kageyama H, Takada N, et al. High expression of Survivin, mapped to 17q25, is significantly associated with poor prognostic factors and promotes cell survival in human neuroblastoma. Oncogene. 2000;19(5):617–623. doi:10.1038/sj.onc.1203358
41. Thaci B, Brown CE, Binello E, Werbaneth K, Sampath P, Sengupta S. Significance of interleukin-13 receptor alpha 2-targeted glioblastoma therapy. Neuro Oncol. 2014;16(10):1304–1312. doi:10.1093/neuonc/nou045
42. Brown CE, Badie B, Barish ME, et al. Bioactivity and safety of IL13Ralpha2-redirected chimeric antigen receptor CD8+ T cells in patients with recurrent glioblastoma. Clin Cancer Res. 2015;21(18):4062–4072. doi:10.1158/1078-0432.CCR-15-0428
43. Brahmer JR, Tykodi SS, Chow LQ, et al. Safety and activity of anti-PD-L1 antibody in patients with advanced cancer. N Engl J Med. 2012;366(26):2455–2465. doi:10.1056/NEJMoa1200694
44. Gorlia T, Wu W, Wang M, et al. New validated prognostic models and prognostic calculators in patients with low-grade gliomas diagnosed by central pathology review: a pooled analysis of EORTC/RTOG/NCCTG phase III clinical trials. Neuro-Oncology. 2013;15(11):1568–1579. doi:10.1093/neuonc/not117
45. Mikheev AM, Ramakrishna R, Stoll EA, et al. Increased age of transformed mouse neural progenitor/stem cells recapitulates age‐dependent clinical features of human glioma malignancy. Aging Cell. 2012;11(6):1027–1035. doi:10.1111/acel.12004
46. Keime-Guibert F, Chinot O, Taillandier L, et al. Radiotherapy for glioblastoma in the elderly. N Engl J Med. 2007;356(15):1527–1535. doi:10.1056/NEJMoa065901
47. Ko JH, Ko EA, Gu W, Lim I, Bang H, Zhou T. Expression profiling of ion channel genes predicts clinical outcome in breast cancer. Mol Cancer. 2013;12(1):106. doi:10.1186/1476-4598-12-106
 © 2019 The Author(s). This work is published and licensed by Dove Medical Press Limited. The full terms of this license are available at https://www.dovepress.com/terms.php and incorporate the Creative Commons Attribution - Non Commercial (unported, v3.0) License.
By accessing the work you hereby accept the Terms. Non-commercial uses of the work are permitted without any further permission from Dove Medical Press Limited, provided the work is properly attributed. For permission for commercial use of this work, please see paragraphs 4.2 and 5 of our Terms.
© 2019 The Author(s). This work is published and licensed by Dove Medical Press Limited. The full terms of this license are available at https://www.dovepress.com/terms.php and incorporate the Creative Commons Attribution - Non Commercial (unported, v3.0) License.
By accessing the work you hereby accept the Terms. Non-commercial uses of the work are permitted without any further permission from Dove Medical Press Limited, provided the work is properly attributed. For permission for commercial use of this work, please see paragraphs 4.2 and 5 of our Terms.