")
Back to Journals » International Journal of Nanomedicine » Volume 10 » Issue 1
A hyperspectral and toxicological analysis of protein corona impact on silver nanoparticle properties, intracellular modifications, and macrophage activation
Authors Shannahan J, Podila R, Brown JM
Received 17 July 2015
Accepted for publication 12 September 2015
Published 13 October 2015 Volume 2015:10(1) Pages 6509—6521
DOI https://doi.org/10.2147/IJN.S92570
Checked for plagiarism Yes
Review by Single anonymous peer review
Peer reviewer comments 3
Editor who approved publication: Dr Thomas Webster
Jonathan H Shannahan,1 Ramakrishna Podila,2,3 Jared M Brown1
1Department of Pharmaceutical Sciences, Skaggs School of Pharmacy and Pharmaceutical Sciences, The University of Colorado Anschutz Medical Campus, Aurora, CO, 2Department of Physics and Astronomy, Clemson University, Clemson, 3Clemson Nanomaterials Center and COMSET, Clemson University, Anderson, SC, USA
Abstract: The inevitable adsorption of biomolecules on nanomaterials results in the formation of a protein corona (PC), which modifies the nanoparticle (NP)–cell interface resulting in modified uptake, activity, clearance, and toxicity. While the physicochemical properties of the NP govern the composition of PC, the formation of PC in turn alters the characteristics of the NP by imparting a new unique “biological” identity. To assess how the PC influences AgNP properties, intracellular modifications, and cellular responses, we utilized a combination of hyperspectral and toxicological analyses. AgNPs were coated with a complex PC (multiple proteins, eg, 10% fetal bovine serum) or a simple PC (single protein, eg, bovine serum albumin [BSA]) and evaluated by hyperspectral and dynamic light scattering for modifications in AgNP properties. Mouse macrophages were exposed to AgNPs with PCs and examined for differences in uptake, cytotoxicity, and cell activation. Hyperspectral imaging revealed intracellular modifications to AgNPs that were found to spectrally match alterations in AgNPs following incubation in lysosomal fluid. Addition of the PC influenced AgNP uptake and cytotoxicity; however, hydrodynamic size and surface charge did not contribute to these responses. Assessments of all endpoints demonstrated differences between complex and BSA PC, suggesting that these responses are not purely driven by the primary protein component of the complex PC (ie, BSA). Alterations in cellular–NP uptake/interactions may be driven through cell surface receptor recognition of protein constituents that make up the PC rather than the physicochemical differences in AgNPs.
Keywords: nanomaterials, biocorona, hyperspectral imaging, darkfield microscopy
Introduction
In the recent years, our ability to grow nanomaterials in different shapes, sizes, and functionalities with unprecedented control has catalyzed significant advances in the nanomedicine, diagnosis, and treatment of diseases.1 The toxicity of nanomaterials, however, is still a concern for realizing the promise of nanomedicine.2–7 Although concerted efforts from researchers across the globe have led to a better understanding of nanomaterial toxicity, the fundamental mechanisms through which nano–bio interactions occur still remain largely inconclusive.8 Building on the understanding of adsorbed biomolecules in cellular responses to biomaterials, a new picture of nanotoxicity based on protein–nanomaterial interactions is recently beginning to emerge.7–12 Once placed in a physiological environment, the surface of nanomaterials becomes coated with various biomolecules including proteins, peptides, and lipids, collectively referred to as the “corona”. Previously, others and we have shown that both the physiological environment and the physicochemical properties of the nanomaterial govern the composition of the corona.9,12–14 Ultimately, the addition of the corona alters the characteristics of the nanomaterials by imparting a new unique “biological” identity.11 Specifically, the corona alters the shape, charge, hydrodynamic size, and interfacial composition of the nanomaterial influencing its biodistribution, activity, clearance, and toxicity.15–18
Recently, we examined the formation of the complex protein corona (PC) on spherical silver nanoparticles (NPs) with a diameter of 20 or 110 nm coated with either polyvinylpyrrolidone (PVP) or citrate and suspended in typical cell culture media, Dulbecco’s Modified Eagle’s Medium (DMEM) supplemented with 10% fetal bovine serum (FBS).14 This complex PC for our studies is defined as a corona that is formed on the surface of NPs consisting of multiple proteins, which provides an excellent model for nanomaterials entrained in blood. Our previous study demonstrated that AgNPs formed unique PCs that were dependent on both surface curvature (diameter) and suspension material (PVP or citrate).14 Of the 45–82 total proteins found to bind to these AgNPs, unique proteins were found to account for 22% of the 20 nm citrate-suspended AgNP-PC, 31% of the 20 nm PVP-suspended AgNP-PC, 1% of the 110 nm citrate-suspended AgNP-PC, and 12% of the 110 nm PVP-suspended AgNP-PC. Overall, eleven proteins including albumin and apolipoproteins were found to associate with all AgNPs evaluated however at different abundances, suggesting that nano–bio interactions entail a large parameter space. From such a standpoint of intricate nano–bio interactions, the evaluation of nanomaterial toxicity and cellular interactions is a complex procedure as many interdependent characteristics could simultaneously contribute to responses.12 Therefore, it is critical to assess the changes in multiple physiological markers, upon the exposure of cells (in vitro) or the organism (in vivo) to nanomaterials, through both invasive and noninvasive tools. It is also necessary to understand extra- and intracellular NP alterations such as biomolecule adsorption, alterations in surface chemistry, and dissolution that may influence NP–cellular responses. Hyperspectral darkfield microscopy is a novel tool, which can be used to evaluate these alterations through comparatively assessing modifications in NP spectra within different environments.
In this study, we use a comprehensive array of spectroscopic tools and biological assays to conclusively show that the association of proteins forming a complex PC on AgNP influences cellular uptake, activation, and cytotoxicity in vitro. Interestingly, we found that the presence of the PC dictates the interparticle spacing in AgNPs and thereby leads to plasmon hybridization peaks, distinct and red shifted from the original Plasmon peak of isolated AgNPs, in their hyperspectral imaging data. This plasmon hybridization in AgNPs, which is dictated by the interparticle spacing, changes with the environment and can therefore enable us to conclusively distinguish intra-/extracellular particles. We used the distinct changes in hybridized plasmon peaks in tandem with inductively coupled plasma-mass spectrometry (ICP-MS) and flow cytometry to study the influence of complex PC on the uptake of AgNPs. To assess how the PC influences cellular interactions, we exposed mouse macrophages to AgNPs coated with a complex PC (10% FBS) and simple PC (bovine serum albumin [BSA]) and studied the differences in uptake, cytotoxicity, and cell activation using immunological markers such as tumor necrosis factor-α (TNF-α). When taken together, our studies (through hyperspectral imaging, flow cytometry, and ICP-MS) add to the established and growing scientific literature base demonstrating the importance of the PC for NP–cellular interactions.
Methods
Formation of AgNP-PC
AgNPs with a diameter of 20 and 110 nm suspended in either citrate or PVP were procured from NanoComposix by the NIEHS Centers for Nanotechnology Health Implications Research consortium at a concentration of 1 mg/mL. Complex PCs were formed on AgNPs as described in our recent publication evaluating the composition of the PC.14 Briefly, AgNPs were incubated in DMEM (control), DMEM with 10% FBS, or DMEM with BSA (100 μg/mL) for 1 hour at 37°C. Following incubation, AgNPs were pelleted by centrifugation for 10 minutes at a speed of 14,000 rpm (20,817× g) and then resuspended to 1 mg/mL with deionized water. The PC from 10% FBS is referred to as complex PC (due to the presence of multiple proteins), while the PC using BSA is denoted as simple PC due to the presence of only one protein.
Characterization of AgNP-PC
The hydrodynamic size and zeta potentials (ZetaSizer Nano, Malvern) of all control uncoated AgNPs and AgNPs with PCs were characterized in deionized water with AgNPs at a concentration of 50 μg/mL (n=3 per particle). This concentration was evaluated, as it was the highest concentration utilized in our studies for experimentation. Differences in AgNP dissolution due to the presence of the PC were determined by incubating AgNPs in DMEM (control), DMEM with 10% FBS, or DMEM with BSA (100 μg/mL) at 37°C for 1 hour. AgNPs were then loaded into a centrifugal filter unit with a normal molecular weight limit of 10 kDa (EMD Millipore, Billerica, MA, USA) and centrifuged for 10 minutes at 6,500 rpm (4,000× g). The eluted sample was collected, and assessment of Ag+ was performed by ICP-MS (X series II; Thermo Fisher Scientific, Waltham, MA, USA) using an internal standard containing Li, Y, and In with a detection limit of 0.05 ppb (corrected for sample dilution). Lastly, shifts in the spectra of AgNPs following addition of the PC were conducted using hyperspectral darkfield microscopy (Cytoviva, Auburn, AL, USA). Following formation of the PCs, AgNPs were loaded onto premium clean microscope slides, and mean spectra were created utilizing pixels with an intensity of ≥1,000. Mean spectra were then compared to uncoated AgNPs to evaluate modifications resulting from the addition of the PCs. Addition of the PC was confirmed by alterations in spectra of AgNPs indicative of protein coating of NPs.
Cell culture
Mouse macrophages (RAW264.7) (American Type Culture Collection [ATCC], Manassas, VA, USA) were cultured in DMEM containing 10% FBS and maintained in flasks under standard conditions of 37°C and 5% CO2. All experiments were performed at 90% confluency and in serum-free media conditions in order to inhibit secondary PC formation during exposures. Assessment of the PC and its role in cellular responses requires the use of serum-free media. The removal of serum from the media allows for the evaluation of the PC we formed by inhibiting the formation of a secondary PC within the cell culture system. This use of serum-free media however limits the evaluation of the PC and cellular responses to acute time points.
Cellular uptake of AgNPs
Macrophages were grown to 90% confluency in 24-well plates (Costar) and exposed for 2 hours to serum-free media (controls), AgNPs, AgNPs-complex PC, or AgNPs-BSA PC at concentrations of 25 μg/mL. The concentration and time point selected for the evaluation of macrophage uptake were selected based on previous research examining human epidermal keratinocyte and mouse macrophage uptake of AgNPs.19,20 Following exposure, cells were washed with phosphate-buffered saline (PBS) and collected by detachment with 250 μL of trypsin and neutralization with an equal volume of media. Altered PC-induced uptake was evaluated by changes in side scatter (SSC) shift through flow cytometry (Accuri C6 Flow Cytometer; BD Biosciences, San Jose, CA, USA) and ICP-MS analysis of Ag content. All samples for ICP-MS analysis including as-purchased AgNPs and the cells exposed to NPs were dissolved in 6 mL of 2% HNO3. Subsequently, the Ag concentration was determined with ICP-MS (X series II) using an internal standard containing Li, Y, and In with a detection limit of 6 ppb (corrected for sample dilution). Lastly, qualitative assessment of uptake was performed using enhanced darkfield microscopy. Macrophages were grown on microscope chamber slides and exposed as previously described to 12.5 μg/mL of particles. Following fixation with 2% paraformaldehyde, the nuclei of cells were stained with 4′,6-diamidino-2-phyenylindole and evaluated for differences in uptake by enhanced darkfield microscopy. The concentration of 12.5 μg/mL was selected to examine variations in uptake because higher concentrations reduced the ability to accurately depict differences due to higher amounts of total uptake.
Hyperspectral imaging and assessment of intracellular modifications to AgNPs
Macrophages were grown on microscope chamber slides and exposed to AgNPs (25 μg/mL) for 2 hours and fixed with 2% paraformaldehyde. This concentration was chosen to allow for enough pixels to be selected per image to generate a reliable spectrum for each internalized particle. Hyperspectral darkfield microscopy (Cytoviva, Auburn, AL, USA) was then used to evaluate changes in spectra following internalization. AgNPs within cells were selected by focusing on the nucleus of the cell, and a hyperspectral image was collected at a magnification of ×100. At least 1,000 pixels of internalized AgNPs were collected to form a region of interest for producing a mean spectrum. These spectra were then normalized and compared to the normalized original spectrum of the appropriate AgNP. In a separate experiment designed to determine a time course of intracellular dissolution, macrophages were exposed to 110 nm PVP-suspended AgNPs without or with PCs at a concentration of 25 μg/mL. Following 30 minutes of exposure, AgNPs were removed, and cells were washed with PBS and placed in DMEM with 10% FBS. Macrophages were then washed and fixed in 2% paraformaldehyde at 30 minutes, 2 hours, 6 hours, and 24 hours postexposure. Internalized AgNPs were then evaluated for alterations in spectra over the time course and compared to original AgNPs. In another separate experiment designed to understand modifications in the spectra of internalized AgNPs, PCs were formed on AgNPs, and then, AgNPs were incubated for 2 hours in artificial phagolysosomal fluid (APF).21 Following incubation in APF, AgNP spectra were again produced by hyperspectral darkfield analysis and compared with original spectra and spectra of internalized AgNPs.
Evaluation of AgNP cytotoxicity
Macrophages were grown to 90% confluency in 96-well plates (Costar) and exposed to AgNPs (0, 6.25, 12.5, 25, 50 μg/mL) with or without PCs for 3 and 6 hours in serum-free media. Due to the use of serum-free media, only acute time points could be evaluated. The concentration range evaluated for cytotoxicity was selected based on previous in vitro experimentation of other NPs.22 Changes in cell viability were assessed using the MTS assay (Promega Corporation, Fitchburg, WI, USA) via manufacturer’s instructions using a spectrophotometer (BioTek Synergy HT; BioTek, Winooski, VT, USA).
Cell activation following AgNP exposure
The ability of AgNPs with PCs to activate macrophages was evaluated following a 6-hour exposure to 50 μg/mL AgNPs and measuring TNF-α cellular mRNA expression and protein levels in the supernatant. The concentration and time point for this evaluation of macrophage activation were selected to maximize response. Since no concentration was found to induce significant cytotoxicity through 6 hours, we selected the highest concentration of 50 μg/mL to evaluate PC-induced differences. Total RNA was isolated from cells using Direct-zol RNA MiniPrep (Zymo Research Corp., Irvine, CA, USA) via manufacturer’s instructions and quantified via nanodrop (Nanodrop 2000c Spectrophotometer; Thermo Fisher Scientific, Waltham, MA, USA). Total RNA (1 μg) was reverse-transcribed to cDNA using an iScript cDNA Synthesis Kit (Bio-Rad Laboratories Inc., Hercules, CA, USA). Quantitative real-time PCR was performed for TNF-α and glyceraldehyde 3-phosphate dehydrogenase (GAPDH) (control) using SsoAdvancedTM SYBR Green Supermix (Bio-Rad Laboratories, Inc.) and QuantiTect primer assays (Qiagen, Venlo, the Netherlands). Relative mRNA fold changes were calculated considering serum-free media-exposed cells as control and normalized to GAPDH as the internal reference. Supernatants were collected following exposure and evaluated by a mouse-specific TNF-α enzyme-linked immunosorbent assay kit via manufacturer’s instructions (R&D Systems, Inc., Minneapolis, MN, USA).
Statistical analysis
All data are presented as mean ± standard error of mean, except hydrodynamic size, zeta potential, and Ag+ dissolution data in Table 1, which are presented as mean ± standard deviation, and all consist of three to six experiments. Each experimental group was run in triplicate and averaged together to provide a value for each experiment. Data were then analyzed by one-way analysis of variance, with differences between groups assessed by Tukey’s post hoc tests. All graphs and analyses were performed using GraphPad Prism 5 software (GraphPad Software Inc., La Jolla, CA, USA). Statistical significance was determined when P was found to be ≤0.05 between groups.
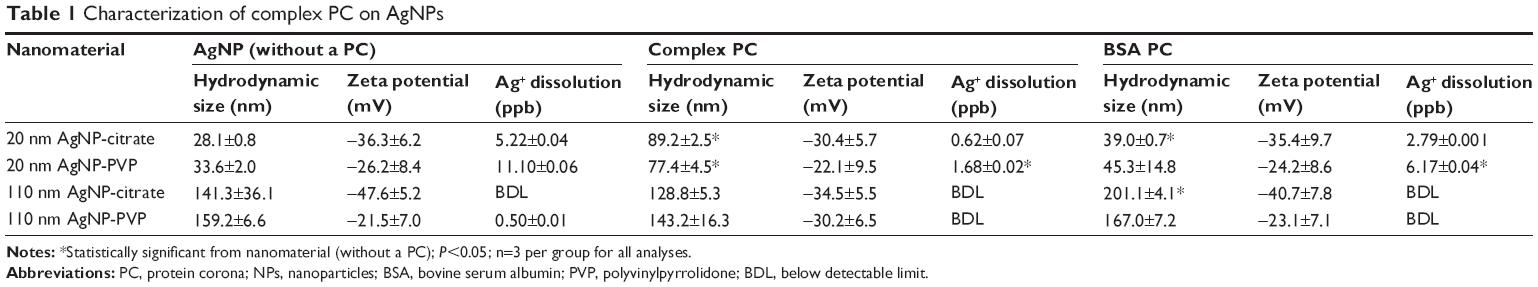 | Table 1 Characterization of complex PC on AgNPs |
Results and discussion
Characterization of AgNP-PC formation
As expected from our previous studies,14 AgNPs were found to associate with FBS proteins to form a complex PC or BSA to form a simplified PC. While the presence of the complex PC resulted in an increase in the hydrodynamic size for 20 nm AgNPs, the BSA PC was found to increase the hydrodynamic size of 20 and 110 nm citrate-suspended AgNPs (Table 1). Furthermore, our ICP-MS results showed decreased dissolution of 20 nm AgNPs with the addition of the PCs, while 110 nm AgNPs did not demonstrate dissolution above the limit of detection. A comparison of AgNPs before and after the addition of the PCs demonstrated no statistically significant alterations in zeta potential; however, the general trend was a reduction (Table 1). Overall addition of either the complex or BSA PC was not found to drastically modify AgNP physicochemical properties evaluated.
Hyperspectral analysis of NP-PC and cellular uptake
Interestingly, we observed significant shifts (~10–70 nm) in light-scattering spectrum for protein- or media-coated AgNPs in the hyperspectral profiles (Figure 1 and Table 2) with a peak >540 nm for all the samples. Although shifts in the optical spectra of AgNPs are expected due to changes in the surrounding dielectric medium upon protein coating, such shifts are often much lower (~5–10 nm).23 Previously, such large red shifts observed for gold NPs were explained using NP cluster (NPC) formation.24 In NPCs, the plasmons undergo hybridization due to interparticle interactions.25,26 Surface plasmons are charge density oscillations confined to the surface of the metal NP. When the interparticle distance between two AgNPs is comparable to their size, the Coulomb interaction between the charge density oscillations (from surface plasmons) results in a hybridization of the individual AgNP plasmons leading to new renormalized plasmon energies. In our experiments (Figure 1), AgNPs possibly aggregate into NPCs upon protein coating (containing more than two NPs in each cluster with interparticle distance ranging between 10 and 500 nm) and thereby exhibit surface plasmons at a lower energy (or higher wavelength) due to the interparticle interaction-induced changes in plasmon energies. Such a premise is supported by the fact that the addition of the complex/BSA PC to pristine AgNPs resulted in distinct shifts (Figure 1) in hybridized plasmon energy by affecting the interparticle interactions through the modulation of size, surface charge, and functionality. Considering that the hybridized plasmon energies are strongly dependent on interparticle interactions, any changes in the environment will be reflected as noticeable shifts in AgNPs. Indeed, we found that the plasmon energies exhibited a distinct shift for all AgNPs (except for 20 nm AgNP-citrate) for extra- and intracellular environments, when exposed to macrophages. Based on such shifts in plasmon energies, it is possible to study the uptake of AgNPs by macrophages using hyperspectral imaging. It is worth noting that the aggregates seen in Figure 2 are much larger (>0.5–1 m) than their hydrodynamic diameter, suggesting that AgNPs are agglomerating upon entering cells and thereby causing shifts in plasmon energies. As shown in Figure 3, our studies showed that most of the AgNPs exhibited a distinct shift (except 20 nm AgNP-citrate) in their spectrum upon cellular internalization, suggesting that the interparticle interactions (and hence the plasmon hybridization) changed due to differences in intra-/extracellular environments, possible loss of functional groups, PC, and Ag+ dissolution. It is expected that cellular internalization could either result in more aggregation (eg, lysosymal accumulation of NPs) or result in increased electrostatic repulsion between NPs (due to the coating of new proteins through the Vroman effect) leading to the observed red or blue shifts in the hybridized plasmon energies.
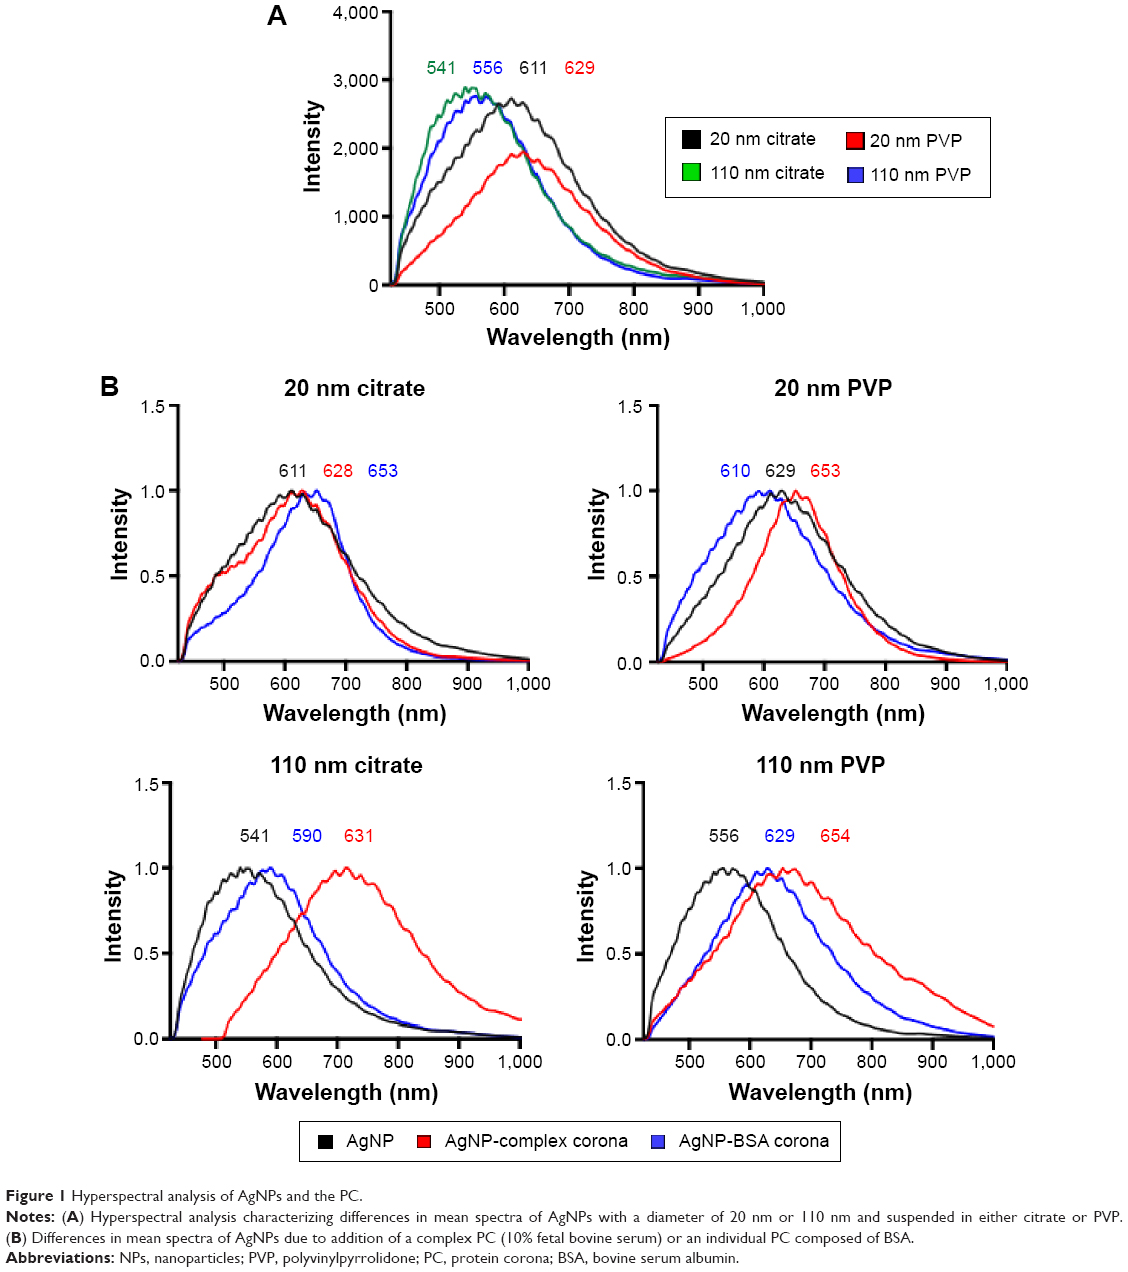 | Figure 1 Hyperspectral analysis of AgNPs and the PC. |
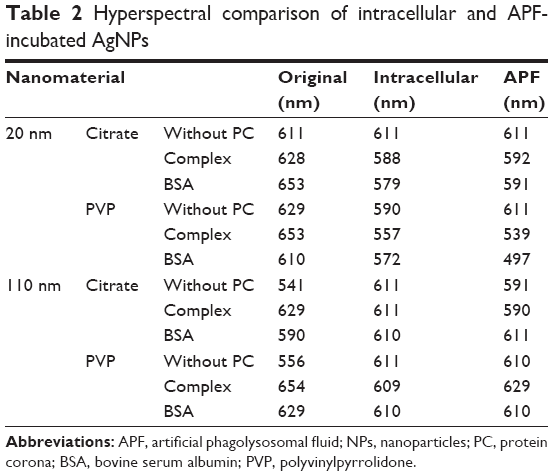 | Table 2 Hyperspectral comparison of intracellular and APF-incubated AgNPs |
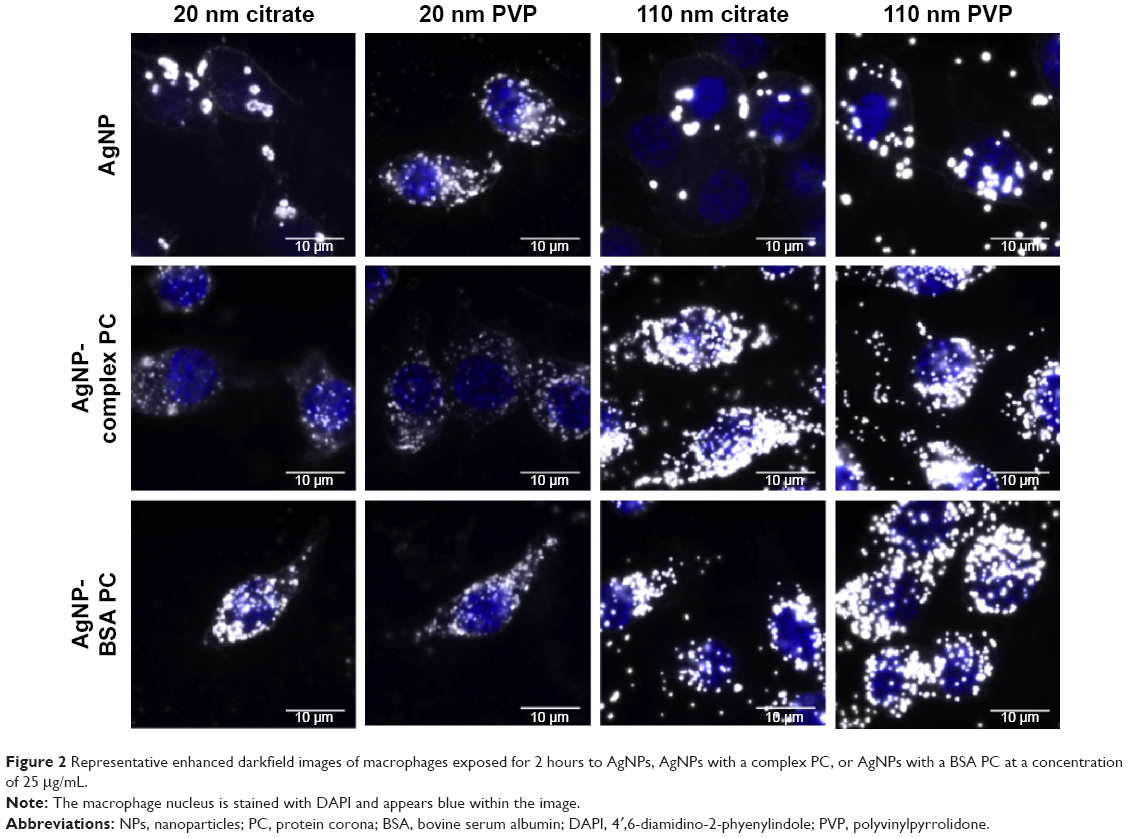 | Figure 2 Representative enhanced darkfield images of macrophages exposed for 2 hours to AgNPs, AgNPs with a complex PC, or AgNPs with a BSA PC at a concentration of 25 μg/mL. |
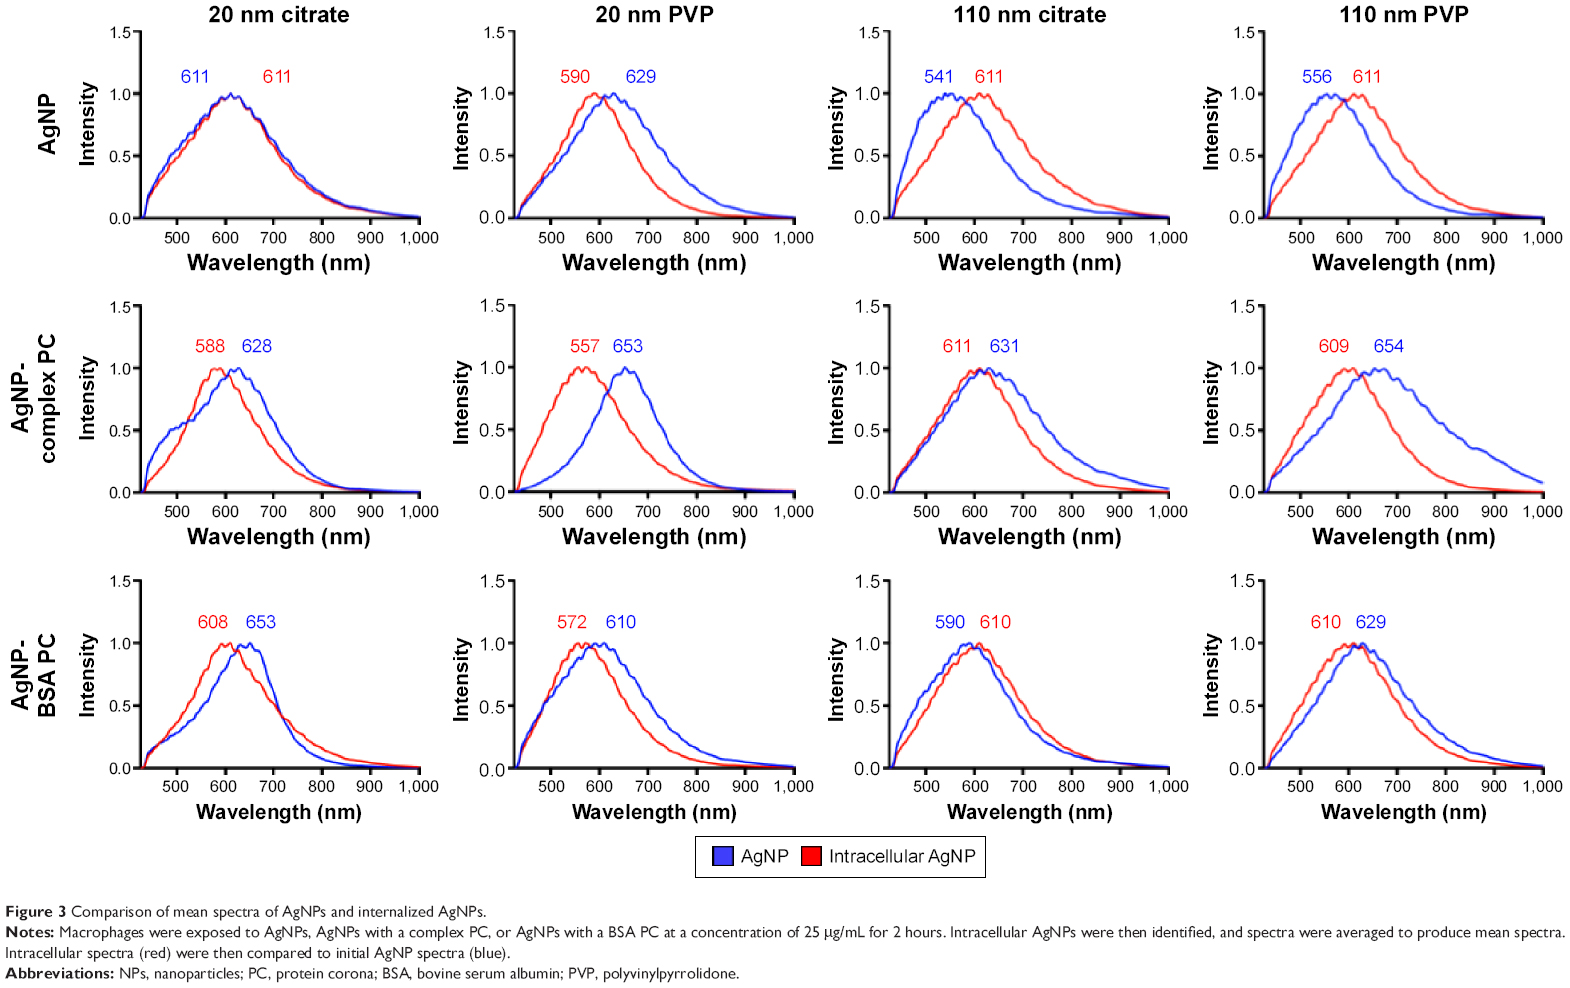 | Figure 3 Comparison of mean spectra of AgNPs and internalized AgNPs. |
To further understand the rate of these internal modifications, we exposed macrophages to 110 nm PVP-suspended AgNPs without or with PCs. We found that 110 nm PVP-suspended AgNPs without a PC began to exhibit a red shift in their spectrum 30 minutes following the exposure indicating the initial internalization (Figure 4). No additional shifts were seen at later time points of 2, 6, or 24 hours postexposure. The internalization of 110 nm PVP-suspended AgNPs with PCs, however, demonstrated a blue shift 30 minutes following exposure. Such an effect could be attributed to the presence of PC which influences the size and surface charge (Table 1), and thereby alters the rate of uptake, interparticle interactions, and aggregation. Previously, NPs and specifically AgNPs have been shown to accumulate in the phagolysosomes of macrophages.20 To further characterize the spectral shifts observed upon macrophage internalization, we incubated AgNPs without or with PCs for 2 hours in APF in an attempt to replicate the intracellular environment. Following incubation in APF, spectral profiles of AgNPs demonstrated similar shifts to those seen following internalization (Table 2), suggesting that the shifts indeed resulted from local microenvironment-induced changes in AgNP interparticle interactions.
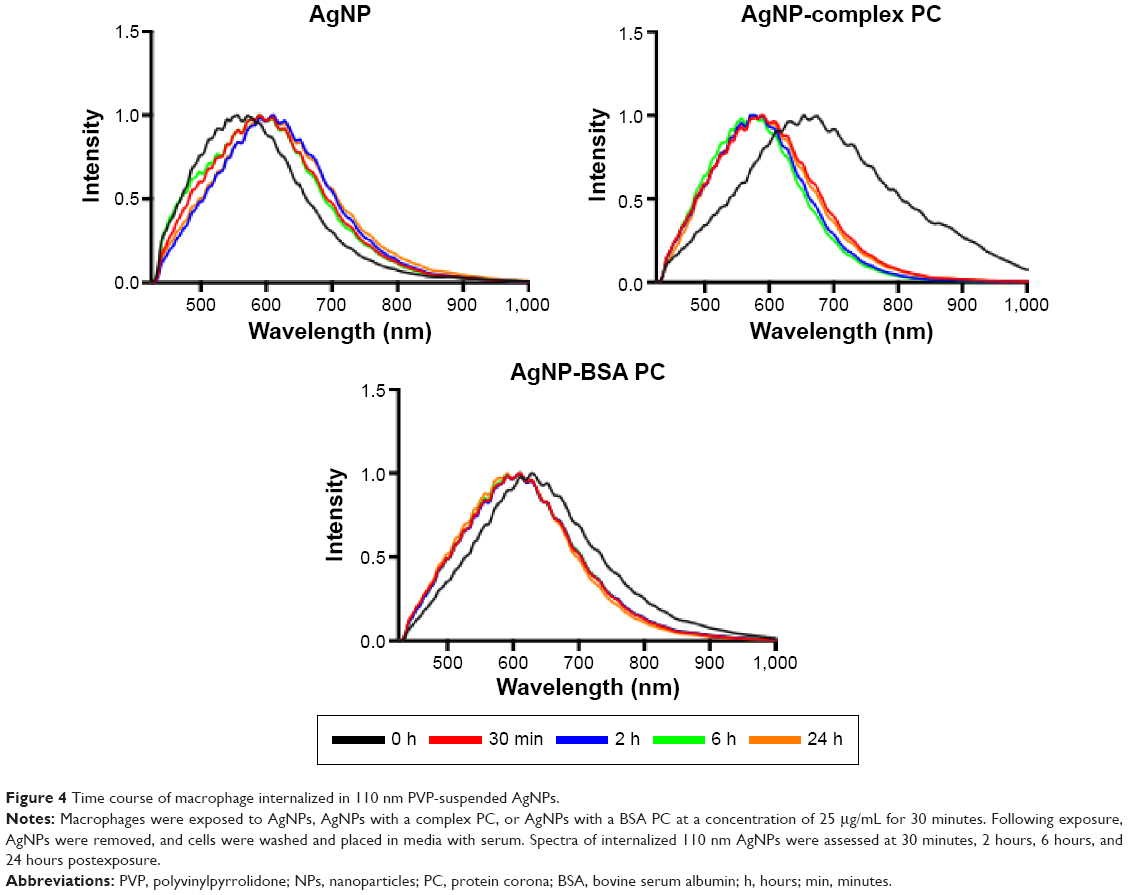 | Figure 4 Time course of macrophage internalized in 110 nm PVP-suspended AgNPs. |
Influence of AgNP-PC on cellular uptake and macrophage response
It is now well established that multiple techniques are necessary for the assessment of NP–cellular uptake/interactions as well as intracellular NP modifications. Accordingly, to evaluate the influence of the PC on AgNP cellular uptake, we assessed macrophage uptake by flow cytometry and ICP-MS in addition to hyperspectral imaging (Figure 5). In flow cytometry, shift in SSC intensity, which is known to increase with the granularity of cells, has been suggested as a method to evaluate NP uptake.27–29 AgNPs when internalized by macrophages serve as pseudo-granules and thereby increase SSC intensity by scattering light in a dose-dependent manner. Although some SSC intensity may arise from AgNPs bound to the surface receptors, their contribution is significantly lower compared to the internalized AgNPs. As shown in Figure 5A, exposures to all AgNPs were found to increase the SSC of macrophages indicative of uptake and cellular–NP interactions. The SSC intensity was found to be higher for larger size (110 nm AgNPs) in all the cases. Particularly, 110 nm PVP-suspended AgNPs resulted in the greatest increase in SSC compared to other AgNPs. The addition of the complex PC increased SSC of macrophages for all AgNPs except for 20 nm PVP-suspended AgNPs. We found that the addition of BSA PC enhanced macrophage SSC of cells exposed to both 20 and 110 nm citrate-suspended AgNPs, whereas it decreased SSC of macrophages exposed to 20 nm PVP-suspended AgNPs and had no influence on 110 nm PVP-suspended AgNP-exposed macrophages (Figure 5A). In addition to the SSC data, we measured the Ag content in macrophages through the use of ICP-MS. Ag was detected in all samples exposed to AgNPs; however, only significant differences were found in macrophages exposed to both 20 and 110 nm citrate-suspended and 110 nm PVP-suspended AgNPs compared to control cells (Figure 5B). With the exception of the 20 nm citrate-suspended AgNPs, all samples have the same pattern of uptake as demonstrated by changes in SSC (Figure 5). We found that ICP-MS and SSC intensity were not in complete agreement with each other. For example, ICP-MS measurements of total Ag+ in macrophages treated with 20 nm citrate-suspended AgNPs were much higher than anticipated compared to flow cytometry measurements. It is possible that the dissolution rates of NPs strongly influence ICP-MS results because a significant fraction of Ag+ ions may have been lost during washing steps for separating internalized AgNPs. Therefore, while ICP-MS provides a quantitative measure for Ag+, the evaluation of intracellular AgNPs may be limited due to particle dissolution of Ag+. For our study where the rate of AgNP dissolution is likely dependent on the PC and intracellular concentrations of AgNP, which varies based on uptake, ICP-MS may misrepresent particle dosimetry.
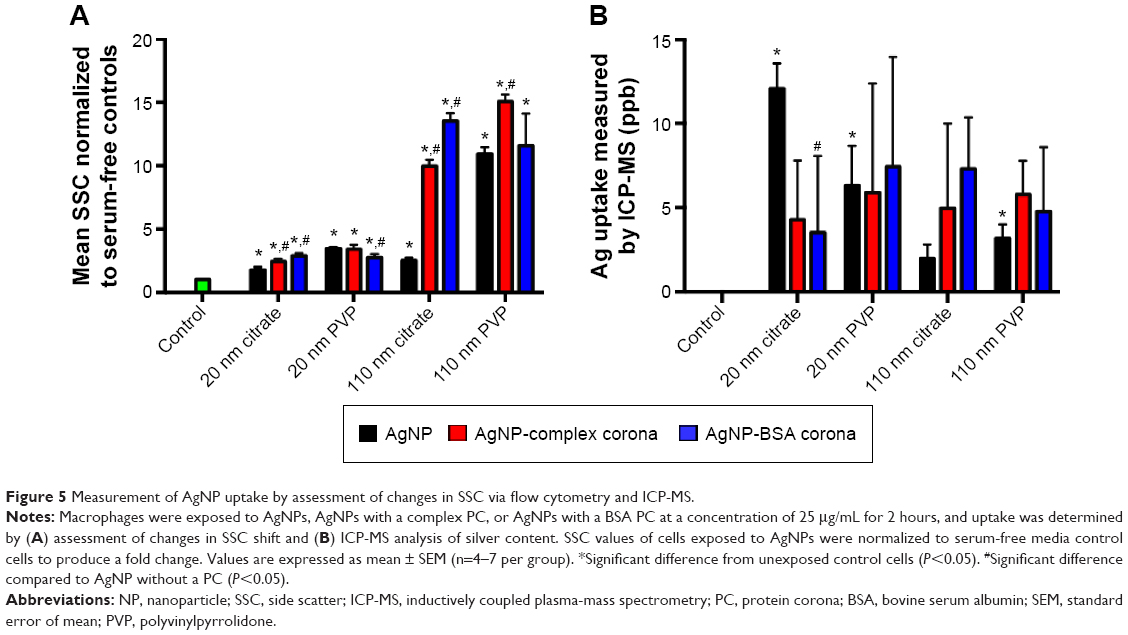 | Figure 5 Measurement of AgNP uptake by assessment of changes in SSC via flow cytometry and ICP-MS. |
When taken together, our macrophage studies (through hyperspectral imaging, flow cytometry, and ICP-MS) show that the few changes in the hydrodynamic size and the slight decreases in zeta potential (Table 1) of the AgNPs did not translate into differences in uptake (Figure 5). Therefore, it appears that alterations in cellular–NP uptake/interactions may be driven through cell surface receptor recognition of protein constituents that make up the PC rather than the physiochemical differences in AgNPs. Indeed, our recent results suggested that cell surface receptors such as scavenger receptor B1 may play a critical role in the recognition and uptake of AgNPs.17
To determine differences in cytoxicity due to the addition of the complex and simplified BSA PC, macrophages were exposed to AgNPs at concentrations of 0, 6.25, 12.5, 25, or 50 μg/mL for 3 or 6 hours and assessed for differences in viability. Due to the removal of serum from the media, only acute time points could be evaluated. None of the concentrations utilized induced significant cytotoxicity (ie, >20% cell death) (Figure S1). As a marker for macrophage activation, we assessed the mRNA and protein levels of the inflammatory cytokine TNF-α following exposure to AgNP with or without PCs. All AgNPs without PCs induced TNF-α mRNA expression at 6 hours (Figure 6A). The addition of the BSA PC reduced the induction of TNF-α mRNA; however, addition of the complex PC completely inhibited induction (AgNP > AgNP-BSA PC > AgNP-complex PC). A similar pattern for TNF-α protein release at 6 hours was also observed (Figure 6B). Only macrophages exposed to 20 nm citrate-suspended AgNPs demonstrated a significant increase in protein levels of TNF-α at 6 hours. Although at 6 hours many of the AgNPs induced significant TNF-α mRNA expression compared to controls, only a few sets of AgNPs were found to induce corresponding increases in TNF-α protein levels. These minor changes in the levels of TNF-α protein are likely due to the early time point that was assessed. This relatively short time point (6 hours) had to be chosen due to the use of serum-free media, which could induce cytotoxicity at longer time points. However, since mRNA levels remained elevated at the 6-hour time point, it is likely that protein levels would continue to rise at later time points. This finding however does demonstrate that NP uptake does not necessarily translate to cellular activation. NPs are known to have highly reactive surfaces that are thought to be a characteristic that contributes to their toxicity. The addition of the PC likely reduces the reactivity of their surfaces decreasing cell surface receptor-mediated inflammatory responses.17,30
 | Figure 6 Assessment of macrophage activation. |
Conclusion
The evaluation of NP toxicity and cellular interactions is a complex procedure as many interdependent characteristics contribute to cellular responses. The presence of a PC is one of these factors, which likely influences toxicity by modifying cellular interactions and internalization of NPs as well as cell surface receptor-mediated responses. We found that the addition of the PC stabilized 20 nm AgNPs and resulted in decreased dissolution, while minimal dissolution occurred with the larger 110 nm AgNPs. Our findings indicate that following introduction into a physiological environment, the ability of AgNPs to release Ag+ and thereby induce cytotoxicity is likely inhibited due to the formation of PC. However, the addition of the PC may only cause a decrease in the extracellular dissolution of AgNPs while initiating increased cellular uptake. Following this increased internalization, the PC may be lost resulting in an exacerbated release of Ag+ and toxicity. More importantly, minor changes in physicochemical properties (ie, surface charge and size) were demonstrated, while addition of the PCs was found to induce changes in NP uptake. Such findings suggest that NPs interact with cells through cell surface receptors in the presence of PC. Lastly, our studies demonstrate the potential for hyperspectral imaging to evaluate NP modifications resulting from PC formation and modifications caused by intracellular environments.
Acknowledgments
This study was supported by NIEHS grants R01 ES019311, U19 ES019525, and K99 ES024392, and silver nanomaterials used in this study were procured, characterized, and provided by the NIEHS Centers for Nanotechnology Health Implications Research consortium. Any opinions, findings, conclusions, or recommendations expressed herein are those of the authors and do not necessarily reflect the views of the National Institute of Environmental Health Sciences/National Institutes of Health.
Disclosure
The authors have no conflicts of interest to disclose.
References
Sun YG, Xia YN. Shape-controlled synthesis of gold and silver nanoparticles. Science. 2002;298(5601):2176–2179. | ||
Podila R, Brown JM. Toxicity of engineered nanomaterials: a physicochemical perspective. J Biochem Mol Toxicol. 2013;27(1):50–55. | ||
Firme CP 3rd, Bandaru PR. Toxicity issues in the application of carbon nanotubes to biological systems. Nanomedicine. 2010;6(2):245–256. | ||
Walczyk D, Bombelli FB, Monopoli MP, Lynch I, Dawson KA. What the cell “Sees” in bionanoscience. J Am Chem Soc. 2010;132(16):5761–5768. | ||
Wick P, Clift MJD, Roesslein M, Rothen-Rutishauser B. A brief summary of carbon nanotubes science and technology: a health and safety perspective. Chem Sus Chem. 2011;4(7):905–911. | ||
Watari F, Takashi N, Yokoyama A, et al. Material nanosizing effect on living organisms: non-specific, biointeractive, physical size effects. J R Soc Interface. 2009;6:S371–S388. | ||
Nel AE, Maedler L, Velegol D, et al. Understanding biophysicochemical interactions at the nano-bio interface. Nat Mater. 2009;8(7):543–557. | ||
Podila R, Brown JM, Kahru A, Rao AM. Illuminating nano-bio interactions: a spectroscopic perspective. MRS Bulletin. 2014;39(11):990–995. | ||
Lynch I, Dawson KA. Protein-nanoparticle interactions. Nano Today. 2008;3(1–2):40–47. | ||
Cedervall T, Lynch I, Lindman S, et al. Understanding the nanoparticle-protein corona using methods to quantify exchange rates and affinities of proteins for nanoparticles. Proc Natl Acad Sci U S A. 2007;104(7):2050–2055. | ||
Monopoli MP, Aberg C, Salvati A, Dawson KA. Biomolecular coronas provide the biological identity of nanosized materials. Nat Nanotechnol. 2012;7(12):779–786. | ||
Walkey CD, Olsen JB, Song F, et al. Protein corona fingerprinting predicts the cellular interaction of gold and silver nanoparticles. ACS Nano. 2014;8(3):2439–2455. | ||
Shannahan JH, Brown JM, Chen R, et al. Comparison of nanotube-protein corona 23 composition in cell culture media. Small. 2013;9(12):2171–2181. | ||
Shannahan JH, Lai X, Ke PC, Podila R, Brown JM, Witzmann FA. Silver nanoparticle protein corona composition in cell culture media. PLoS One. 2013;8(9):e74001. | ||
Arvizo RR, Giri K, Moyano D, et al. Identifying new therapeutic targets via modulation of protein corona formation by engineered nanoparticles. PLoS One. 2012;7(3):e33650. | ||
Mahon E, Salvati A, Baldelli Bombelli F, Lynch I, Dawson KA. Designing the nanoparticle-biomolecule interface for “targeting and therapeutic delivery”. J Control Release. 2012;161(2):164–174. | ||
Shannahan JH, Podila R, Aldossari AA, et al. Formation of a protein corona on silver nanoparticles mediates cellular toxicity via scavenger receptors. Toxicol Sci. 2015;143(1):136–146. | ||
Walkey CD, Chan WC. Understanding and controlling the interaction of nanomaterials with proteins in a physiological environment. Chem Soc Rev. 2012;41(7):2780–2799. | ||
Monteiro-Riviere NA, Samberg ME, Oldenburg SJ, Riviere JE. Protein binding modulates the cellular uptake of silver nanoparticles into human cells: implications for in vitro to in vivo extrapolations? Toxicol Lett. 2013;220(3):286–293. | ||
Aldossari AA, Shannahan JH, Podila R, Brown JM. Scavenger receptor B1 facilitates macrophage uptake of silver nanoparticles and cellular activation. J Nanopart Res. 2015. In press 2015. | ||
Marques M, Loebenberg R, Almukainzi M. Simulated biological fluids with possible application in dissolution testing. Dissolut Technol. 2011;18(3):15–28. | ||
Xia T, Hamilton RF, Bonner JC, et al. Interlaboratory evaluation of in vitro cytotoxicity and inflammatory responses to engineered nanomaterials: the NIEHS Nano GO Consortium. Environ Health Perspect. 2013;121(6):683–690. | ||
Podila R, Chen R, Ke PC, Brown JM, Rao AM. Effects of surface functional groups on the formation of nanoparticle-protein corona. Appl Phys Lett. 2012;101(26):263701. | ||
Chen AL, Hu YS, Jackson MA, et al. Quantifying spectral changes experienced by plasmonic nanoparticles in a cellular environment to inform biomedical nanoparticle design. Nanoscale Res Lett. 2014;9(1):454. | ||
Nordlander P, Oubre C, Prodan E, Li K, Stockman MI. Plasmon hybridizaton in nanoparticle dimers. Nano Lett. 2004;4(5):899–903. | ||
Prodan E, Radloff C, Halas NJ, Nordlander P. A hybridization model for the plasmon response of complex nanostructures. Science. 2003;302(5644):419–422. | ||
Suzuki H, Toyooka T, Ibuki Y. Simple and easy method to evaluate uptake potential of nanoparticles in mammalian cells using a flow cytometric light scatter analysis. Environ Sci Technol. 2007;41(8):3018–3024. | ||
Zucker RM, Daniel KM. Detection of TiO2 nanoparticles in cells by flow cytometry. Methods Mol Biol. 2012;906:497–509. | ||
Zucker RM, Daniel KM, Massaro EJ, Karafas SJ, Degn LL, Boyes WK. Detection of silver nanoparticles in cells by flow cytometry using light scatter and far-red fluorescence. Cytometry A. 2013;83(10):962–972. | ||
Aldossari AA, Shannahana JH, Podila R, Brown JM. Influence of physicochemical properties of silver nanoparticles on mast cell activation and degranulation. Toxicol Vitro. 2015;29(1):195–203. |
Supplementary material
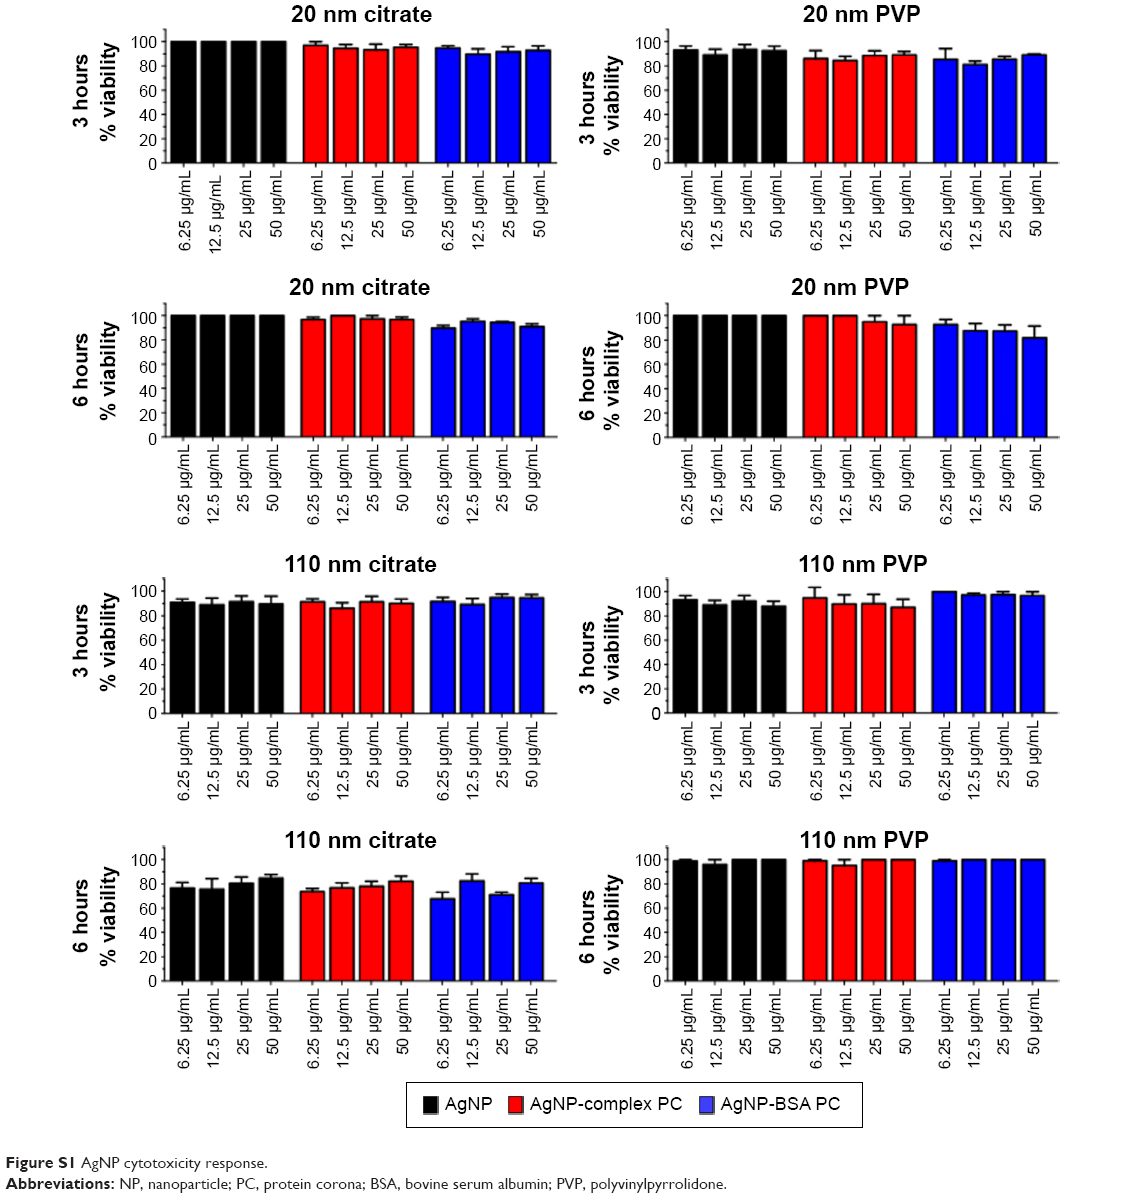 | Figure S1 AgNP cytotoxicity response. |
 © 2015 The Author(s). This work is published and licensed by Dove Medical Press Limited. The full terms of this license are available at https://www.dovepress.com/terms.php and incorporate the Creative Commons Attribution - Non Commercial (unported, v3.0) License.
By accessing the work you hereby accept the Terms. Non-commercial uses of the work are permitted without any further permission from Dove Medical Press Limited, provided the work is properly attributed. For permission for commercial use of this work, please see paragraphs 4.2 and 5 of our Terms.
© 2015 The Author(s). This work is published and licensed by Dove Medical Press Limited. The full terms of this license are available at https://www.dovepress.com/terms.php and incorporate the Creative Commons Attribution - Non Commercial (unported, v3.0) License.
By accessing the work you hereby accept the Terms. Non-commercial uses of the work are permitted without any further permission from Dove Medical Press Limited, provided the work is properly attributed. For permission for commercial use of this work, please see paragraphs 4.2 and 5 of our Terms.