")
Back to Journals » International Journal of Nanomedicine » Volume 16
A Hydroxypropyl Methylcellulose Film Loaded with AFCP Nanoparticles for Inhibiting Formation of Enamel White Spot Lesions
Authors Zhang Z, Shi Y, Zheng H, Zhou Z, Wu Z, Shen D, Wang Y , Zhang Y, Wang Z, Fu B
Received 24 August 2021
Accepted for publication 1 November 2021
Published 16 November 2021 Volume 2021:16 Pages 7623—7637
DOI https://doi.org/10.2147/IJN.S335549
Checked for plagiarism Yes
Review by Single anonymous peer review
Peer reviewer comments 3
Editor who approved publication: Dr Ebrahim Mostafavi
Zhixin Zhang,* Ying Shi,* Haiyan Zheng, Zihuai Zhou, Zhifang Wu, Dongni Shen, Yiru Wang, Yizhou Zhang, Zhe Wang, Baiping Fu
Stomatology Hospital, School of Stomatology, Zhejiang University School of Medicine, Zhejiang Provincial Clinical Research Center for Oral Diseases, Key Laboratory of Oral Biomedical Research of Zhejiang Province, Cancer Center of Zhejiang University, Hangzhou, 310006, People’s Republic of China
*These authors contributed equally to this work
Correspondence: Zhe Wang; Baiping Fu Tel +86-571-87217427
Fax +86-571-87217427
Email [email protected]; [email protected]
Objective: This study investigated the effects of mineralizing film consisting of hydroxypropyl methylcellulose (HPMC) and amorphous fluorinated calcium phosphate (AFCP) nanoparticles on enamel white spot lesions (WSLs).
Material and Methods: The AFCP nanoparticles and mineralizing film were prepared via nanoprecipitation and solvent evaporation, respectively. They were characterized with Fourier transform infrared spectroscopy (FTIR), X-ray powder diffraction (XRD), transmission electron microscopy (TEM), selected area electron diffraction (SAED), scanning electron microscopy (SEM), energy-dispersive X-ray spectroscopy (EDX), inductively coupled plasma atomic emission spectrometry (ICP-AES), and fluoride ion selective electrode. Thirty-two human enamel slices (4 mm × 4 mm × 1.5 mm) were highly polished and randomly assigned to four groups: negative control (no treatment); pure HPMC film; mineralizing film; GC Tooth Mousse Plus® (contains 10% CPP-ACP and 0.2% NaF). Subsequently, samples were challenged by a modified pH-cycling and characterized by color measurement, Micro-CT, SEM/EDX, and nanoindentation.
Results: The mineralizing film could sustain release of Ca, P and F ions over 24 h and maintain AFCP nanoparticles in metastable state over 8∼ 12 h. During 4 weeks of pH cycling, the mineralizing film group exhibited least color change (∆E), mineral loss and lesion depth (120 ± 10 μm) among four groups (p < 0.05). SEM findings revealed that the porosities among enamel crystals increased in negative control and pure HPMC film groups after pH cycling, whereas in mineralizing film group, the original microstructure of enamel was well conserved and mineral deposits were detected between enamel prisms. Mineralizing film group demonstrated a least reduction of nanomechanical properties such as elastic modulus of 77.02 ± 6.84 GPa and hardness of 3.62 ± 0.57 GPa (p < 0.05).
Conclusion: The mineralizing film might be a promising strategy for prevention and management of WSLs via inhibiting enamel demineralization and promoting enamel remineralization.
Keywords: mineralizing film, white spot lesions, color, micro-CT, SEM/EDX, nanoindentation
Introduction
Enamel white spot lesions (WSLs) are defined as a non-cavitated, incipient caries, with a prevalence of over 19% in the human population.1 The lesions not only affect dentofacial aesthetics but also gradually develop into carious enamel and dentin cavities.2,3 With the rapidly growing number of orthodontic patients and increasing demand for their dentofacial aesthetics, WSLs prevention has become a troublesome and important issue in preventive and aesthetic dentistry.
As mature enamel is acellular and highly mineralized, it fails to self-repaired once damaged.4 Consistently, fluorides are widely used in toothpastes, mouthwashes, gels, and varnishes for early caries prevention and treatment.3,5 However, recent reviews have revealed that these fluoride products have limited preventive and therapeutic efficacy of WSLs.6,7 Their efficacy may be restricted by the fluoride content, duration of action, and extra calcium and phosphate ions supplement.8,9 Therefore, there is an urgent need to advance efforts towards a novel re-mineralizing agent to arrest WSLs.
With the increased recognition of biomineralization process, biomimetic mineralization strategies are in line with the concept of “minimally invasive dentistry” and provide new ideas for the management of WSLs.10 During the biomimetic mineralization process, amorphous calcium phosphate (ACP) is believed as a liquid-state precursor of hydroxyapatite, and plays an important role in the formation of bone and teeth.11,12 Biomimetic mineralization for teeth depends on metastable state of calcium and phosphate mineral ions. The ACP nanoparticles served as a reservoir for calcium and phosphate sources have been used in a series of formulations for caries prevention, including toothpastes, mouthwashes, and pastes.13–15 However, the efficacy of these products in the prevention and treatment of WSLs remains implausible, because the ACP nanoparticles are extremely difficult to keep metastable state in hydrous liquid and paste.16 In addition, liquid and paste as precursor carriers to deliver biomimetic mineralization have their limitations because they cannot be maintained in situ for a long period to sustain release of calcium and phosphate ions.17,18 Moreover, ACP in liquid-precursor state is thermodynamically unstable and easily transform into crystalline phase, therefore high amounts of nucleation inhibitors are used to stabilize the ACP and inhibit its rapid nucleation in moist environments.16,19 This not only poses daunting challenges for product storage in hydrous liquid and paste but also restricts the mineralizing potential of ACP nanoparticles.16,20 Consequently, if ACP nanoparticles are used as solid dispersion, it might be favorable for ACP nanoparticles in long-term storage and high content loading. Recently, dental composites or bonding agents have been used as a carrier to deliver precursors.21,22 However, the motion of ACP nanoparticles and the release of Ca/P ions are limited in such carriers. In addition, the abundant mineral ions are not available for biomimetic mineralization because the kind of carriers cannot be replaced daily. This makes it hard to exert an excellent mineralization performance. A sustained supersaturation state of calcium, phosphate, and fluoride ions is critical for enamel mineralization.23,24 Fluoride is a catalyst of biomineralization, and a combination of ACP nanoparticles with fluoride will further enhance mineralization.25,26 Amorphous fluorinated calcium phosphate (AFCP) nanoparticles as a calcium, phosphate and fluoride reservoir are the promising nanomaterial.27 Hence, exploring a novel carrier for AFCP that can continuously deliver mineral ions to the tooth surface might possess a great potential for aesthetic and preventive dentistry.
To increase the bioavailability of drugs and their bioactivity in moist milieu, some bio-adhesive polymers have been investigated.28 The polymers can maintain the bioactivity of drugs within the oral cavity, and improve their residence time.29 Among these polymers, hydroxypropyl methylcellulose (HPMC) is the most important hydrophilic carrier material used for the preparation of oral controlled drug delivery systems.29,30 Its prominent features include hydrophilic swelling capacity and excellent film-forming ability, which have important implications for the incorporated drug delivery and storage.31,32 The presence of polar (hydroxypropyl) and non-polar (methyl) groups of the HPMC may contribute to drug delayed release and stability.31,33 Herein, we developed a novel mineralizing film consisting of AFCP nanoparticles and HPMC polymer, which might provide an innovative strategy for WSLs management. The objectives of this study were: (1) to prepare AFCP nanoparticles and mineralizing film; (2) to characterize their physicochemical properties, micromorphology and ion release performance; (3) and to investigate the phase stability of AFCP nanoparticles and mineralizing film, as well as effects of mineralizing film on enamel surface color changes (∆E), its micromorphology, mineral loss and lesion depth, and nanomechanical properties when enamel was challenged by pH cycling. The null hypothesis was that mineralizing film neither can inhibit enamel demineralization nor promote enamel remineralization.
Materials and Methods
Material
All chemical reagents and organic solvents used in this study were commercially purchased. They included CaCl2, Na2HPO4, poly-L-aspartic acid (PASP, MW = 7000–8000 Da), and 4-(2-hydroxyethyl)-1-piperazineethanesulfonic acid (HEPES) from Sigma-Aldrich, USA; NaCl, KCl, NaF, NaOH, hydroxypropyl methylcellulose (HPMC), KH2PO4, acetic acid, and chloramine T from Aladdin, China; 1,2-cyclohexanediaminetetraacetic acid (CDTA), sodium acetate, and absolute ethanol from Macklin, China. All solutions were filtered (0.22-μm filters, Millipore) prior to use. The commercial product used as positive control was: Tooth Mousse Plus® (GC, Tokyo, Japan), which contains active ingredients of 10% CPP-ACP and 0.2% NaF.
Preparation and Characterization of AFCP Nanoparticles and Mineralizing Film
AFCP nanoparticles were synthesized as follows: Calcium solution containing 10 mM of CaCl2 and 480 µg/mL of PASP, and phosphate solution containing 6 mM of Na2HPO4 and 110 ppm of NaF were first prepared in deionized water. Subsequently, the two solutions were mixed in equal volume under moderate magnetic stirring at room temperature. Meanwhile, the pH of the mixed solution was titrated to 9.5 ± 0.05 with 1 M NaOH. Afterwards, the precipitates of AFCP nanoparticles were separated by centrifugation (9500 rpm, 5 min, Sigma 3K15, Germany), and washed with deionized water and ethanol in sequence. Then, the AFCP nanoparticles were oven-dried and ground into powders. The mineralizing film was prepared as follows: 150 mg of HPMC was dissolved in 1.5 mL of 70 v/v% ethanol-aqueous solution and being stirred overnight to form HPMC gel in a low viscosity fluid state. After that, 50 mg of AFCP nanoparticles were ultrasonically dispersed in 1.5 mL of 70 v/v% ethanol-aqueous. Afterwards, HPMC gel and AFCP suspension were homogeneously mixed under magnetically stirring, and set aside for 15 min to get rid of air bubbles. Finally, the final mixture was coated on a glass plate and kept in a 37 °C oven to form mineralizing film (volume size: 15 × 40 × 0.1 mm3, weight = 200 ± 5 mg). The pure HPMC film was synthesized in the same manner without addition of AFCP.
Schematic diagram of the synthetic process of AFCP nanoparticles and mineralizing film are illustrated in Figure 1A. AFCP nanoparticles and mineralizing film were characterized by Fourier transform infrared spectroscopy (FTIR, Nicolet iS10, Thermo Scientific), X-ray powder diffraction (XRD, Rigaku D/MAX-2550pc, Japan), scanning electron microscopy (SEM, Zeiss Gemini SEM 300, Oberkochen, Germany) with energy-dispersive X-ray detection (EDX), transmission electron microscopy (TEM, JEM-1230, JEOL, Tokyo, Japan), high-resolution transmission electron microscopy (HRTEM, FEI Tecnai G2 F20 S-TWIN) with selected-area electron diffraction (SAED), and thermogravimetric analysis (TGA/DSC1, Mettler Toledo, Switzerland).
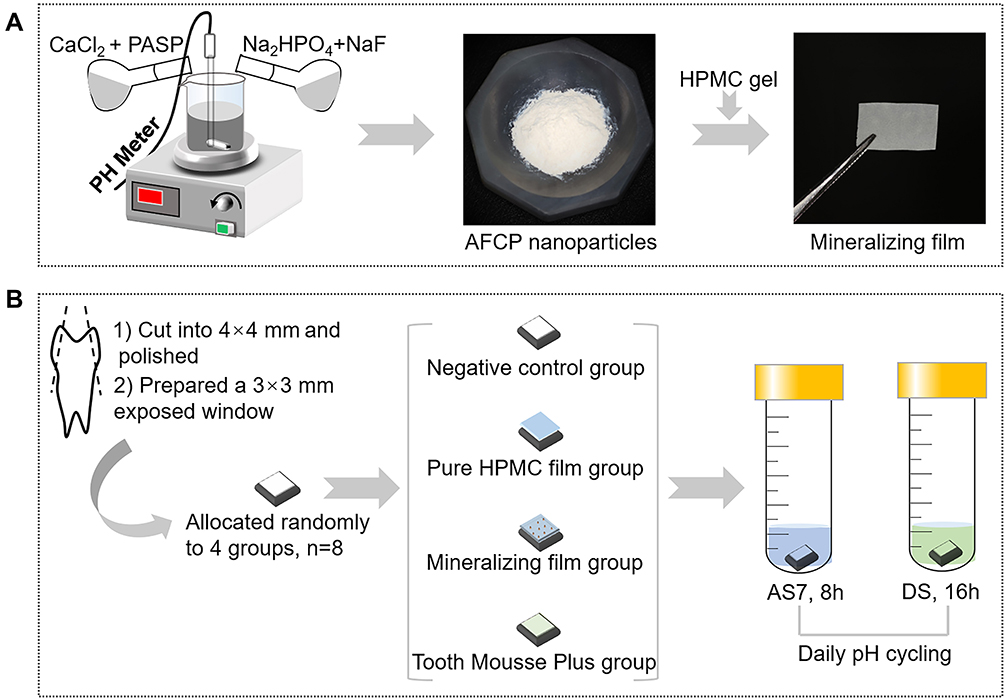 |
Figure 1 (A) Schematic diagram of the synthetic process of AFCP nanoparticles and mineralizing film; (B) enamel surface treatment for different groups during de- and re-mineralization process. Abbreviations: AS7, artificial saliva (pH 7.0); DS, demineralization solution. |
Phase Transition of AFCP in the Mineralizing Film
Artificial saliva was prepared as described in the previous research (1.5 mM CaCl2, 0.9 mM KH2PO4, 130 mM KCl, and 20 mM HEPES), and the pH was adjusted to 7 (AS7).34 To assess the phase stability of AFCP nanoparticles in presence or absence of HPMC, freshly prepared AFCP nanoparticles (50 mg) and mineralizing film (150 mg of HPMC, 50 mg of AFCP) were dispersed separately in 20 mL of AS7 at 37 °C. At the time point of 0, 4, 8 and 12 h, the precipitates were retrieved for FTIR analyses.
pH Buffering Capacity of Mineralizing Film
The same size of mineralizing film (15 × 40 × 0.1 mm3) was individually immersed in 20 mL of artificial saliva at pH 4.5 (AS4.5) and at pH 7 (AS7). The pH value of immersion solution was monitored by a FiveEasy Plus pH meter (Mettler Toledo) at 0, 2, 4, 8, 12 and 24 h.
Ca, P, and F Ion Release Measurement
The mineralizing film (15 × 40 × 0.1 mm3) was immersed in 20 mL of NaCl solution (133 mmol/L) buffered with 50 mmol/L HEPES (pH = 7.0, 37 °C).35 The concentrations of Ca, P, and F ions released from the film were measured at 0, 2, 4, 8, 12 and 24 h. At each time interval, an aliquot (0.5 mL) of immersion solution was retrieved and replenished with fresh solution. The concentrations of Ca and P ions were measured via inductively coupled plasma atomic emission spectrometry (ICP-AES 6300, Thermo Fisher).21 Moreover, the amount of F ions released was measured by a fluoride ion selective electrode (Shanghai D&B Biological Science and Technology Co., Ltd., Shanghai China). The solutions collected as aforementioned were first diluted to a concentration within the ranges of measurement and then mixed with ionic strength adjustment buffer (ISAB) (containing 0.2 M acetic acid, 1.0 M sodium acetate, 1.0 M NaCl and 0.02 M CDTA) in a volume ratio of 50:1. Fluoride standard solutions ranging from 1 × 10⁻⁶ to 1 × 10⁻¹ mol/L were measured to form a calibration curve, which was used to calculate the F ions concentration.36 All measurements were performed in triplicate, and the averaged values were used.
Preparation of Enamel Slices
This study was conducted in accordance with the Declaration of Helsinki. Approval for this study was obtained from the Ethics Committee of the Affiliated Hospital of Stomatology, Zhejiang University (approval No. 2019–05). The isolated human premolars used in this research were collected from orthodontic patients (18–30 years old) with informed written consent. Teeth without any caries, restorations, cracks, white spot lesions or hypomineralized enamel were selected. Enamel slices (4 × 4 × 1.5 mm3) were prepared using Isomet low speed saw (Buehler, Lake Bluff, IL, USA) under water cooling. Then, the outer enamel surfaces were ground flat and polished with silicon carbide grinding paper in the following sequence: P600, P1200, each for 20 s, P2500 for 30 s, and P4000 for 1 min. After that, the enamel surface except for an exposed window (3 × 3 mm2) was covered with nail varnish (O.P.I, USA). Finally, a total of 36 samples were stored in chloramine-T solution (0.616% w/v) at 4 °C prior to the experiment.
De- and Re-Mineralization Experiments
An overview of experimental methods is summarized in Figure 1B. Thirty-two enamel samples obtained as above-mentioned were randomly assigned to 4 groups (n = 8) according to different treatment strategies. The exposed enamel surface was nothing covered (1: Negative control); (2) covered with pure HPMC film for 8 h; (3) covered with mineralizing film for 8 h; (4) covered with Tooth Mousse Plus for 8 h.
The main components and application modes of each material are described in Table 1. In the following 4 weeks, all samples were subjected to a modified pH cycling, with 8 h of remineralization and 16 h of demineralization per day.37 The different treatment strategies described above for exposed enamel surface only conducted in the remineralization stage, and the treated samples were individually incubated in 5 mL of AS7 for 8 h. In demineralization stage, samples were immersed in 5 mL of demineralization solution (3.0 mM CaCl2, 3.0 mM KH2PO4, 50 mM acetic acid, pH 4.95) for 16 h.37 The AS7 and demineralization solution were refreshed daily. All samples were incubated at 37 °C. Each sample was thoroughly washed with deionized water and blot-dried between de- and re-mineralization stages.
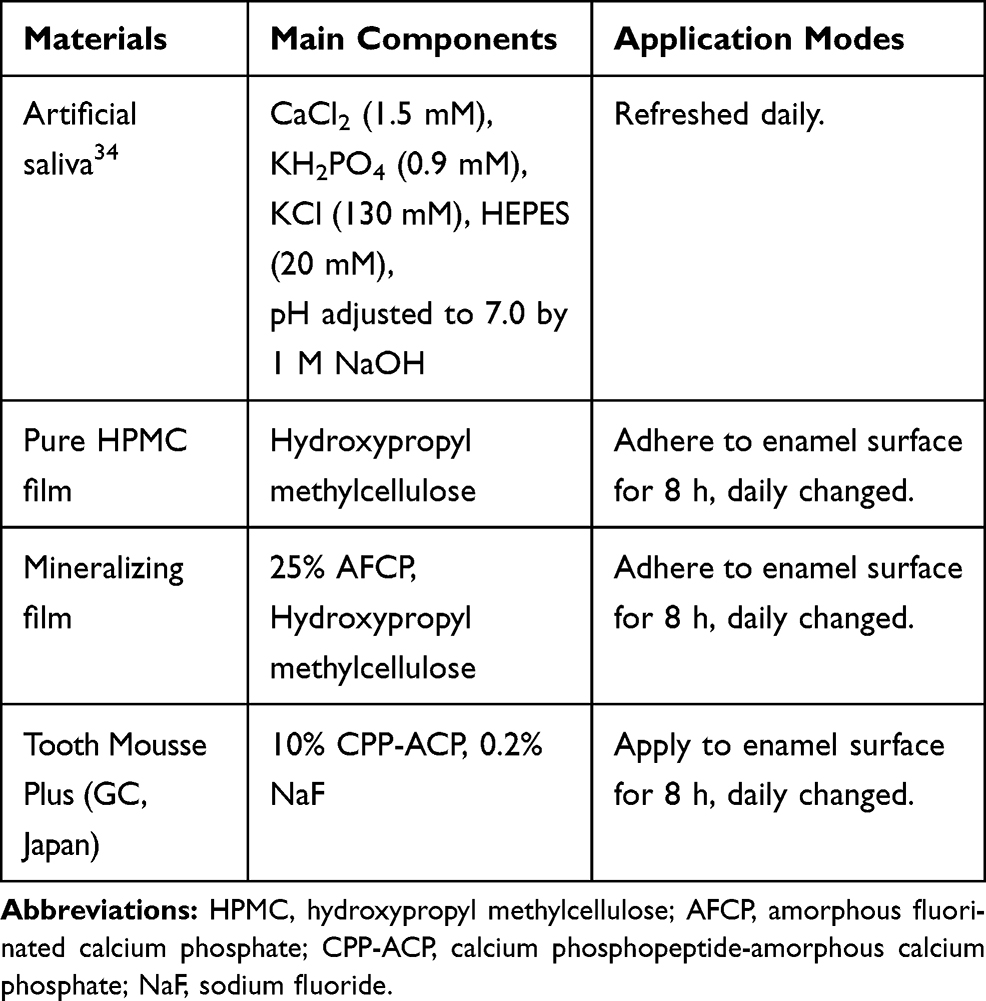 |
Table 1 Compositions of Materials and Their Mode of Application in This Study |
Surface Color Measurement
Digital photographs were taken under standardized conditions to investigate the color changes of enamel surface during pH cycling at the initial stage (baseline), 1, 2, 3, and 4 weeks after de- and re-mineralization cycling. The samples were placed into a photo box and photographed by a fixed SLR camera (Canon EOS 7D; Canon, Tokyo, Japan), equipped with macro lens (Mf100 mm/2.8, Canon) and ring flash (MR-14EX, Canon). The camera was preset with a shutter speed of 1/60 s, aperture F11, ISO 400, and exposure time 1/64 s. Camera placement remained constant throughout the whole experiment, and the samples were fixed in a custom-made holder with three marked points for exact repositioning.
Repeated photographs of the three standardized color patches (RAL1000, 1013, 8007, Germany) were taken at different dates, and the obtained CIE Lab values revealed highly reliable using intraclass correlation coefficient (ICC = 1).38 The white balance was adjusted by a 18% grey card (Kodak, USA) prior to photography. In addition, this gray card was used as shooting background to control color rendition and image brightness. Raw images were exported in 16-bit TIFF format with Digital Photo Professional version 4.0 software (Canon, United States). Final image processing and analyzing were conducted by Adobe Photoshop software. Average CIE L* (lightness), a* (redness), and b* (yellowness) values of each sample were recorded. The color difference (∆E) between baseline and other time points from the same sample was calculated using the formula:39 ∆E = ((∆L*)2 + (∆a*)2 + (∆b*)2)1/2
Micro-CT Scanning
A bench-top X-ray micro-CT scanner (Milabs, Netherlands) was used to assess mineral loss and lesion depth of enamel surface. Each enamel sample was scanned 2 times; separately at the baseline (initial stage) and 4 weeks after pH cycling. To ensure precise positioning and reproducibility, the sample was placed in a customized sample holder made of UV-curable resin and 3M polyvinyl siloxane impression material (Figure 2A). Scanning was performed in the accurate scan mode with ultra-focus magnification, and carried out with the following parameters: X-ray tube voltage (50 kV), current (210 mA), exposure time (75 ms), angular rotation (360°), and angular increment (0.25°).
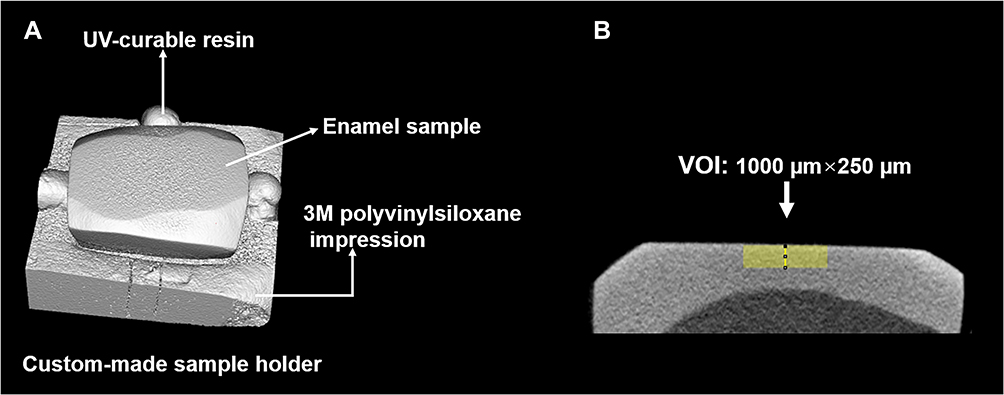 |
Figure 2 (A) Micro-CT image of enamel slice fixed in customized sample holder. (B) A 1000 × 250 μm2 region of interest (ROI) at the cross-sectional of enamel sample was selected for gray values measurement. |
The obtained data were 3D reconstructed using Milabs 3D Reconstruction software with an isotropic volumetric pixel (voxel) size of 10 µm. The reconstructed 3D image data were viewed and processed by using Imalytics Preclinical 2.1 (Version 2.1.8.9). For each sample, typical cross-sectional grayscale images of the same region at baseline and 4 weeks after pH cycling were saved for image analysis. All images were first converted to grayscale 8-bit images, and then gray values of images were analyzed by image analysis software (Image J; National Institutes of Health, USA). The assessment was performed on a 1000 × 250 µm2 region of interest (ROI) (Figure 2B).
SEM and EDX Analysis
After de- and re-mineralization cycling, samples were dehydrated by an ascending series of ethanol, dried in air and gold coated. The surface and cross-section morphologies of enamel sample were investigated by SEM (Zeiss Gemini SEM 300, Oberkochen, Germany), with accelerating voltage of 3 kV. The chemical compositions of the enamel lesion surface were examined by EDX operated at 15 kV.
Nanoindentation Test
Instrumented nanoindentation (Hysitron TI980 nanoindenter) with a diamond Berkovich tip was implemented to determine the nanomechanical properties of enamel samples. During indentation, each sample was mounted on a metal base with wax to ensure the enamel surface perpendicular to the indenter. The indentation was performed under force control scheme, with a maximum force of 15 µN. For each enamel sample, indentations were conducted in a 2 × 3 array with an interval of 20 µm. The force–displacement curve of loading and unloading was used to calculate the nanomechanical properties (elastic modulus and hardness). The same procedure was also performed on intact enamel samples (n = 4).
Statistical Analysis
Statistical analysis was performed using IBM SPSS Statistics 20 software. All data were presented as means and standard deviations. Two-way and one-way ANOVA followed by post hoc Tukey HSD multiple comparisons were used to analyze color changes as well as Micro-CT data and nanoindentation data, respectively. Significance level was set at P < 0.05.
Results
Characterization of AFCP and Mineralizing Film
The FTIR spectra of pure HPMC film, AFCP nanoparticles, and mineralizing film are shown in Figure 3A. The pure HPMC film exhibited absorption bands at 2934, 1644, 1459 and 1377 cm−1, which corresponded to stretching vibration of C-H group, bending vibration of -OH group, asymmetric and symmetric bending vibrations of a methoxy group (-OCH3), respectively.40 The characteristic peaks at 3473 and 1058 cm−1 were attributed to the stretching vibration of O-H and C-O groups of HPMC (Figure 3A(a)).41 The spectrum of AFCP nanoparticles Figure 3A(b) shows that a single characteristic peak at 560 and 1050 cm−1 is corresponding to the asymmetry bending and stretching modes of phosphate groups, respectively. The absorption bands at 1417 and 1594 cm−1 are from carboxylate anion of PASP, and band at 1650 cm−1 can be assigned to the overlapping peak of adsorbed water and the C=O stretching of carboxamide functional group of PASP.42 The peak at 870 and 3400 cm−1 is attributed to the carbonate ions and the -OH stretching, respectively. Whereas the mineralizing film exhibited similar FTIR vibrational bands of HPMC and AFCP nanoparticles with peak shifted and shape changed (Figure 3A(c)). The absorbing bands at 560 and 1050 cm−1 attributed to asymmetry bending and stretching of PO4 were shifted up to 565 and 1058 cm−1, respectively; while the other bands ascribed to PASP were disappeared. Furthermore, the peak at 3473 cm−1 of O-H stretching vibration was shifted to 3422 cm−1 and the peaks (1459 and 1377 cm−1) of the -OCH3 bending vibration of pure HPMC disappeared. These were caused by the incorporation of AFCP in the mineralizing film. However, the peak at 2937 cm−1 attributed to C-H stretching of HPMC was not affected. These results suggested that the AFCP nanoparticles interacted with the functional group of HPMC.43 XRD patterns of pure HPMC film, AFCP nanoparticles, and mineralizing film are shown in Figure 3B(a-c). The pure HPMC film had broad diffraction peaks at around 7.72º and 20.48º attributable to the (101) and (002) crystalline planes (Figure 3B(a)).40 The AFCP nanoparticles showed a broad, diffuse peak at 2θ = 30º (Figure 3B(b)). However, the mineralizing film displayed the mixed characteristics of HPMC and AFCP with diffuse peaks around 20º and 30º (2θ), and the (101) plane of HPMC was disappeared (Figure 3B(c)). The TEM images and SEM findings reveal that the AFCP nanoparticles are a spherical structure with a diameter of around 30–50 nm (Figure 3C and D). The AFCP nanoparticles were homogeneously distributed in HPMC matrix and wrapped by HPMC biomolecules in the mineralizing film (Figure 3F and G). The SAED patterns indicate the amorphous nature of AFCP nanoparticles and mineralizing film (insets in Figure 3C and F). Moreover, the EDX spectra demonstrated percent weight of F (4.09%), P (17.88%), and Ca (45.14%) in the AFCP nanoparticles (Figure 3E), and of F (0.87%), P (4.83%) and Ca (7.74%) in the mineralizing film (Figure 3H).
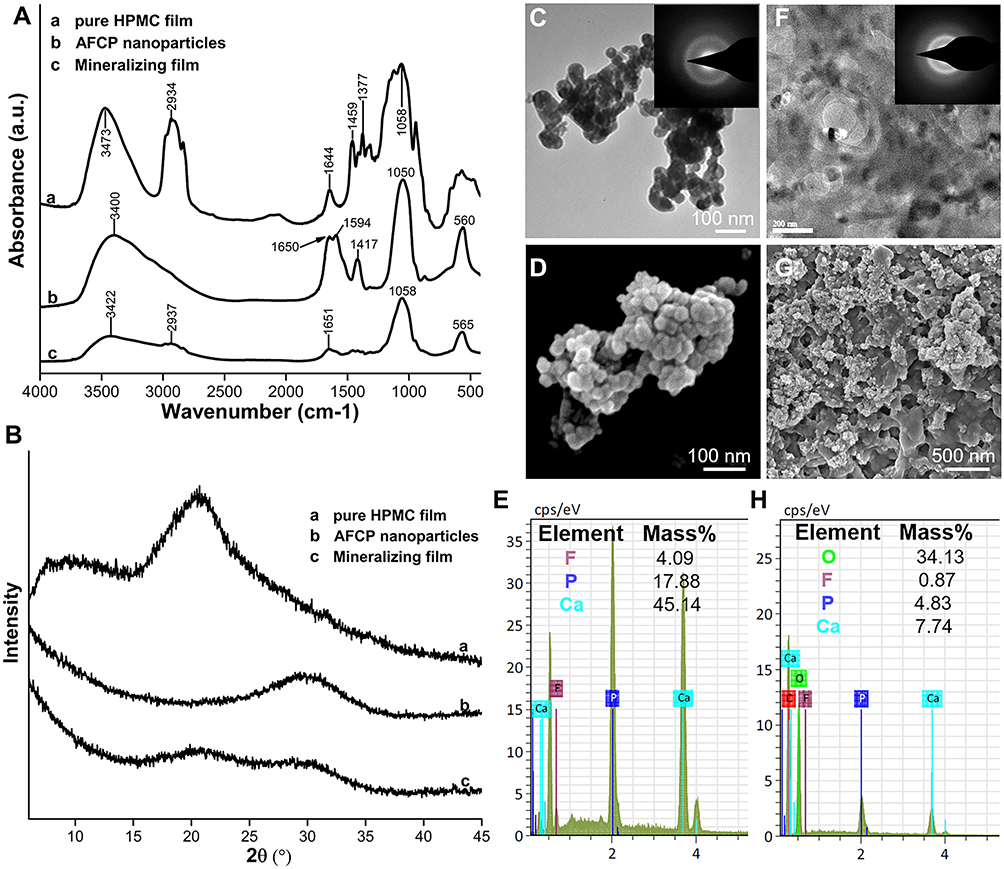 |
Figure 3 Characterizations of the AFCP nanoparticles and the mineralizing film. (A) FTIR and (B) XRD spectra of (a) pure HPMC film, (b) AFCP nanoparticles, and (c) mineralizing film. (C) TEM and (D) SEM images of AFCP nanoparticles, and the corresponding SAED pattern (inserts in (C)) indicates they are amorphous. (F) High-resolution TEM and (G) SEM images of mineralizing film, and the corresponding SAED pattern (inserts in (F)) indicates it is amorphous. (E) EDX spectra shows the weight percent of F, P and Ca elements in the AFCP nanoparticles. (H) EDX spectra shows the weight percent of F, P and Ca elements in the mineralizing film. |
SEM findings (Figure S1A, B) showed that the granules were spherical with an average size of 50–80 nm and heterogeneous distribution in the GC Tooth Mousse Plus. EDX mapping (Figure S1C) demonstrated that Ca, P, and F elements were homogeneously distributed in GC Tooth Mousse Plus. EDX pattern (Figure S1D) displayed that the percent weight of F, P and Ca elements were close to mineralizing film.
FTIR spectra (Figure 4A) exhibited the phase transform of AFCP nanoparticles and mineralizing film after being immersed in artificial saliva for different times. The results indicated that the characteristic split bands at 560 and 600 cm−1 appeared after AFCP nanoparticles were immersed in AS7 for 8 h, and mineralizing film for 12 h. According to the TGA curves of the pure HPMC film, AFCP nanoparticles and mineralizing film, the mass content of inorganics in mineralizing film was around 25% (Figure 4B). Mineralizing film caused a rapid pH increase of AS4.5 up to pH 6.57 at 2 h (Figure 4C). The amounts of Ca, P and F ions released from mineralizing film increased rapidly after 2 h of immersion, and the ion concentrations were sustained at high levels within 24 h (Figure 4D and E). Comparatively, when GC Tooth Mousse Plus was immersed in AS4.5 for 4 h, the pH value of immersion liquid was not significantly changed, and only buffered to pH 5.94 until 24 h (Figure S2). GC Tooth Mousse Plus exhibited a weaker and slower buffering capacity. The amount of F ions releasing from GC Tooth Mousse Plus increased slowly at 0–8 h (Figure S3).
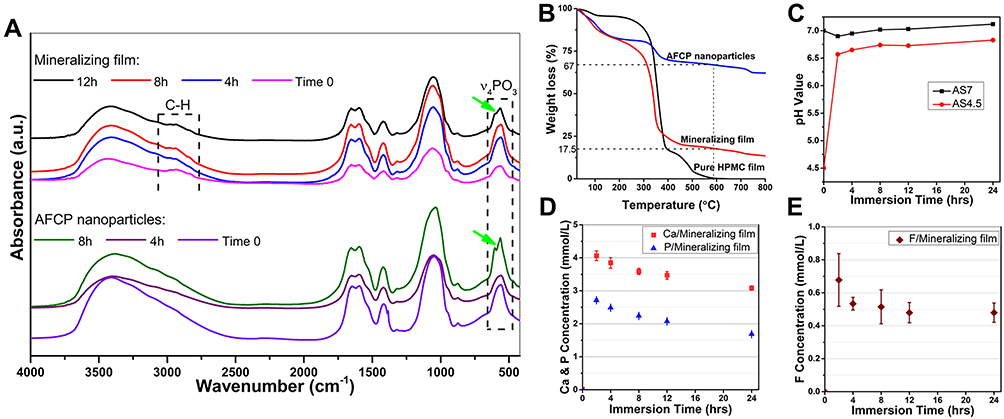 |
Figure 4 Characterizations of the mineralizing film. (A) FTIR spectra of the AFCP nanoparticles and mineralizing film after immersion in AS7 for 0, 4, 8, and 12 h. The characteristic band at 560 cm−1 split up for AFCP nanoparticles at 8 h and for mineralizing film at 12 h. (B) TGA curves of pure HPMC film, AFCP nanoparticles, and mineralizing film show that the mass content of inorganics in mineralizing film was around 25%. (C) pH buffering capacity of the mineralizing film upon immersion in AS4.5 and AS7. The pH of AS4.5 was increased by the mineralizing film up to pH 6.57 at 2 h and the pH of AS7 was not significantly changed. Ion release potential for mineralizing film: (D) Release kinetics of Ca, P and (E) F ions from mineralizing film in sodium chloride solution (133 mmol/L, pH 7.0). Abbreviations: AS4.5, artificial saliva pH 4.5; AS7, artificial saliva pH 7.0. |
Color Alternation of Enamel Surface During pH Cycling
The color changes (∆E) of enamel surface after pH cycling are summarized in Table 2. Repeated measures ANOVA (time as the within-subject factor and intervention as the between-subject factor) revealed significant differences in interventions and time (p < 0.001). Mineralizing film group caused the least color changes among the four groups (p < 0.05). There were not significant differences among the other three during the periods of pH cycling (p > 0.1).
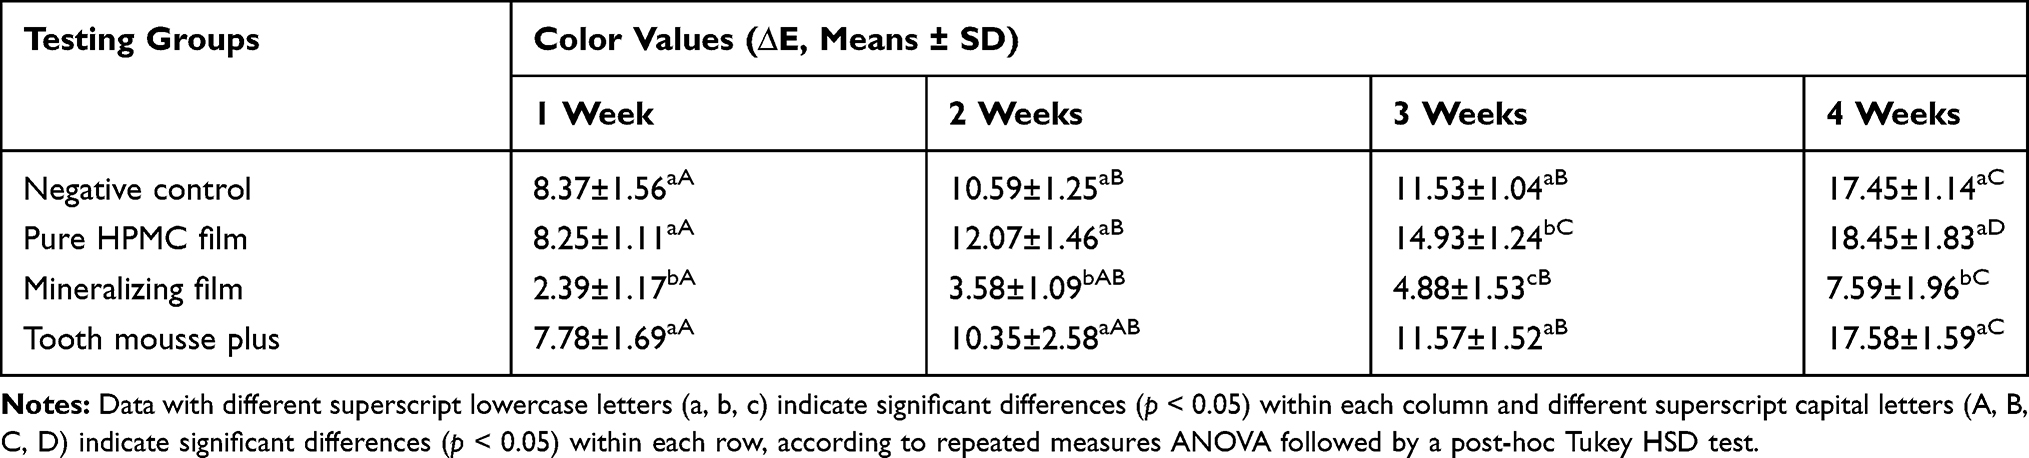 |
Table 2 The Changes of Enamel Color Values (∆E) After pH Cycling |
Assessment of Mineral Loss and Lesion Depth
Representative micro-CT images and mean gray value profiles for each group at baseline and after 4 weeks of pH cycling are displayed in Figure 5A. Gray values decreased after demineralization at the enamel surface, but subsurface porosity increased. The mean gray value profiles of control groups (negative control group and pure HPMC film group) after 4 weeks of pH cycling clearly showed gray value reduction (Figure 5A(c, f)). In the Tooth Mousse Plus group, the profile followed a similar pattern as those of the control groups (Figure 5A(l)), whilst in mineralizing film group, the profile showed less pronounced changes (Figure 5A(i)). Figure 5B(a, b) shows the mean gray values reduction and lesion depths of the four groups after 4 weeks of pH cycling. The mineralizing film group exhibited the least gray values reduction and lesion depth (p < 0.05). Lesion depths of negative control, pure HPMC film, mineralizing film, and Tooth Mousse Plus groups were 200 ± 20 µm, 217 ± 6 µm, 120 ± 10 µm, and 193 ± 29 µm, respectively.
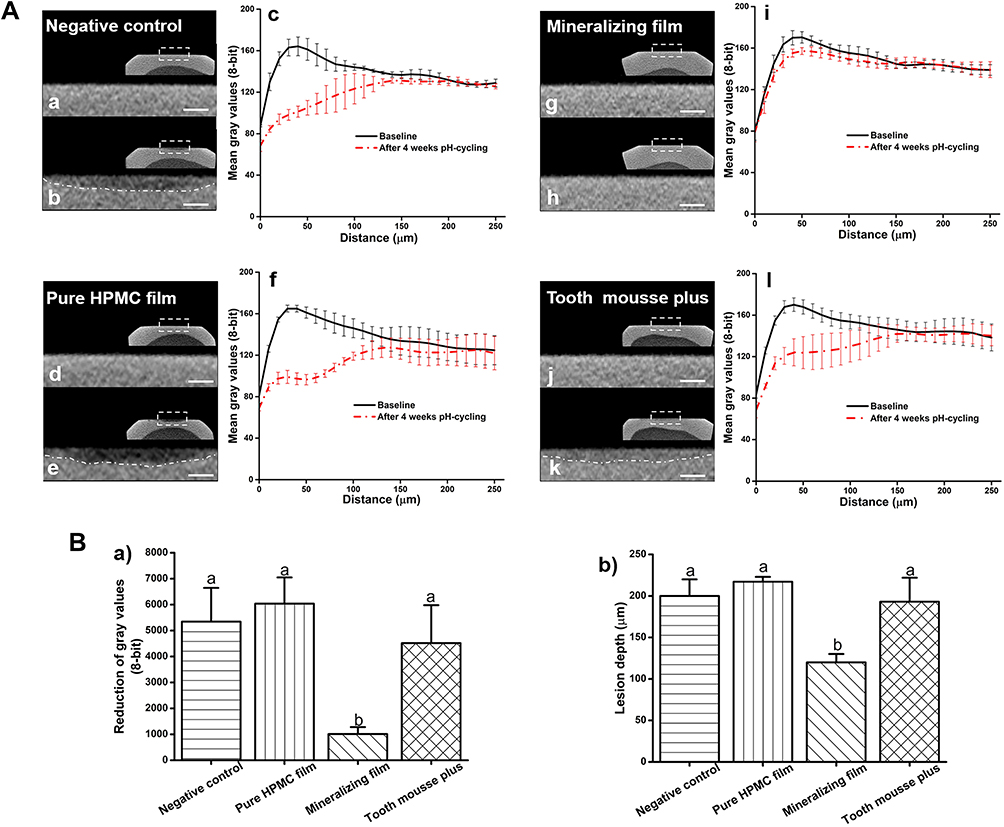 |
Figure 5 (A) Typical 2D micro-CT images of the same sample from each group, scanned at baseline (panels a, d, g, j) and after 4 weeks pH cycling (panels b, e, h, k), scale bar: 250μm. Comparative cross sectional mean gray value profiles for different groups. Graphs show the mean gray value profiles with the distance in x-axis (μm) and relative 8-bit gray value in y-axis, before demineralization (baseline) and after 4 weeks of pH cycling in (c) negative control, (f) pure HPMC film, (i) mineralizing film, and (l) tooth mousse plus groups. (B) a) Gray values reduction and b) lesion depth for different groups after 4 weeks of pH cycling. Results are expressed as means and standard deviations (SD). Bars with same letters indicate statistical insignificance (p > 0.05), and bars with different letters indicate statistical significance (p < 0.05). |
SEM Observation with EDX
The micrographs of enamel surfaces and cross-section are presented in Figure 6. In negative control group and pure HPMC film group, the enamel surfaces exhibited roughness and porosities resulting from 4 weeks of pH cycling. EDX elemental analysis presented that the calcium phosphate (Ca/P) ratio for negative control group and pure HPMC film group was 1.68. The cross-sectional views of negative control group and pure HPMC film group showed that enamel rods and inter-rods were demineralized, the enamel crystal gaps were increased and the enamel inter-rods partially disappeared, but substantial remineralization was not detected. However, in the mineralizing film and Tooth Mousse Plus groups, the enamel surfaces were relatively smooth and mineral deposits were visible. In mineralizing film group, elemental analysis reveals that Ca/P and Ca/F ratios were 1.97 and 14.80, respectively. The original microstructure of enamel was well conserved, and newly formed minerals deposited densely in the enamel crystal gaps. However, in Tooth Mousse Plus group the Ca/P ratio was 1.78 and Ca/F ratios were 1.78 and 90.80, respectively. And mineral depositions were less dense and enamel inter-rods were partially distinct compared to mineralizing film group.
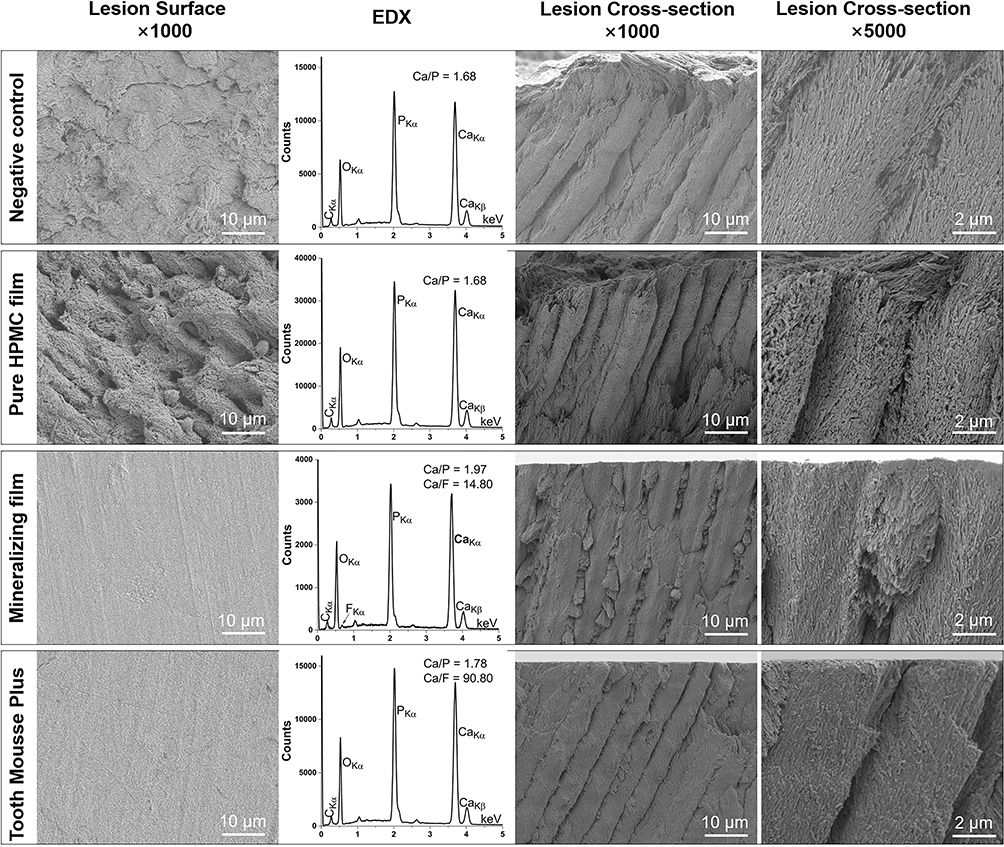 |
Figure 6 Representative SEM and EDX images of four groups: negative control, pure HPMC film, mineralizing film, and Tooth Mousse Plus groups. After 4 weeks of pH cycling, the porosities among enamel crystals were increased in negative control and pure HPMC film groups, whereas in mineralizing film group the original microstructure of enamel was well conserved and mineral deposits were detected between enamel prisms. EDX analysis showed a higher Ca/P ratio in the mineralizing film group than the controls. |
Nanomechanical Property Examination
Typical load–displacement curves are illustrated in Figure 7A. In comparison with the sound enamel group, the indentation depth increased sequentially in mineralizing film, Tooth Mousse Plus, negative control, and pure HPMC film groups. As seen in Figure 7B, the average elastic modulus dropped sharply from 126.96 ± 11.65 GPa (sound enamel group) to 41.13 ± 3.24 GPa (pure HPMC film group) and 42.14 ± 5.35 GPa (negative control group), respectively. Mineralizing film resulted in the significantly least modulus decrease among the four groups (p < 0.05). Similarly, Figure 7C shows that the average hardness of enamel surface decreased from 5.17 ± 0.59 GPa (sound enamel group) to 3.62 ± 0.57GPa (mineralizing film group), 2.24 ± 0.24 GPa (Tooth Mousse Plus group), 1.97 ± 0.27 GPa (negative control group), and 1.81 ± 0.24 GPa (pure HPMC film group). The mineralizing film caused the least reduction of enamel hardness among the four groups (p < 0.05).
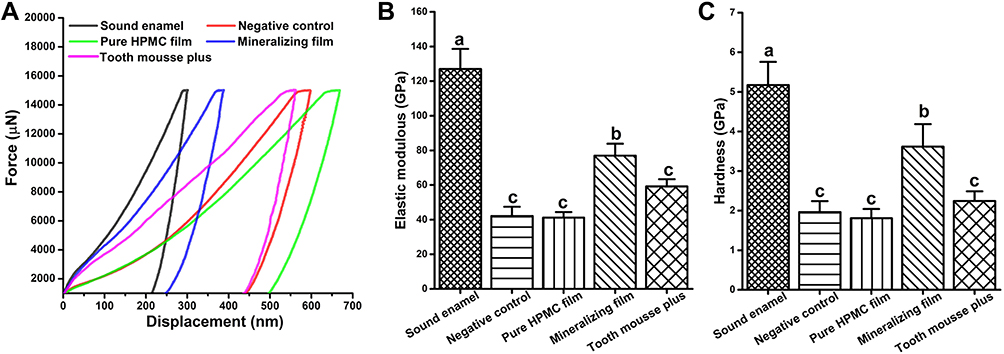 |
Figure 7 Nanomechanical analysis of enamel surface after 4 weeks of pH cycling. (A) Typical load displacement curves in nanoindentation tests. (B) Elastic modulus and (C) surface hardness of the sound enamel group, negative control group, pure HPMC film group, mineralizing film group, and Tooth Mousse Plus groups. Results are represented as means ± standard deviations. Bars with same letters indicate statistical insignificance (p > 0.05), and bars with different letters indicate statistical significance (p < 0.05). |
Discussions
In human tooth enamel, nanoscale crystallites of hydroxyapatite (Ca10(PO4)6(OH)2) are bundled into enamel rods or inter-rods.44 Within each enamel rod, crystals are parallel to the long axis of the rod, or at an angulation with 1~30 degree to adjacent crystals.44,45 The crystals deviate somewhat from the rod orientation, thus producing some long and narrow nanochannels between crystal gaps.45,46 Moreover, enamel apatite is usually calcium-deficient.45 Different elemental substitutions can exist within the apatite, for example, calcium replaced by magnesium, phosphate replaced by carbonate, and hydroxyl replaced by fluoride.47,48 The presence of nanochannels, apatite lattice defects, and substitutional apatite constitute the complex enamel physiological features. When patients receive orthodontic treatment, especially after the placement of fixed orthodontic appliances, the oral environment will become more complex and make it difficult to clean the teeth. Biofilms were easily accumulated surrounding brackets to produce organic acids, which will lead to WSLs formation due to calcium loss by organic acids.49
As a re-mineralizing agent for WSLs prevention, the compound can sustain Ca/P release and its phase stability are critical. Since HPMC possesses both polar (hydroxypropyl) and non-polar (methyl) nature, it can participate in inter-, intra-molecular, and hydrophobic interactions with loaded materials.50 The interactions between drug compounds and HPMC in dry solid dispersions are thought to contribute to the stabilization of amorphous drug compounds.51,52 This study has provided evidence for a phase-stability role of HPMC in AFCP nanoparticles. As seen in Figure 3A, the hydroxyl group of mineralizing film underwent a red shift when AFCP nanoparticles were added into the film, indicating the formation of intermolecular hydrogen bonds between AFCP and HPMC. XRD data revealed that the combination of AFCP nanoparticles and HPMC changed the partial crystallinity of HPMC into amorphous phase (Figure 3B). The phase transformation of AFCP is delayed in the presence of HPMC (Figure 4A), this might be due to the intermolecular hydrogen bond between AFCP and HPMC that increase the kinetic barrier to nucleation and make the AFCP more stable.52,53 In addition, the mineralizing film can sustain release of Ca, P, and F ions at high concentration level over a longer period of time (Figure 4D and E). The HPMC polymer can be changed from solid to gel, releasing AFCP nanoparticles from the mineralizing film via the polymer chain relaxation and volume expansion.54 The gel-like micro-environment has a consistency with enamel secretory or enamel matrix formation stage.55 The mode of crystal growth in the gel-like microenvironment is different than in the aqueous solutions.56,57 These characteristics endow the mineralizing film with the potential to arrest WSLs.
Color measurement of enamel surface is sensitive since the chalky appearance is visible at the incipient stage of enamel demineralization.2 The degree of color change of enamel surface can be reflected timely by CIE Lab color space. Micro-CT is an accurate, advanced technique that can provide three-dimensional information, and the gray values are positively associated to mineral density, therefore enamel mineral loss and lesion depth can be quantified by the micro-CT.58,59 Additionally, nanoindentation is recognized as one of the most sensitive methods for investigating enamel demineralization with two important parameters (hardness and elastic modulus) to reflect the mechanical properties of enamel.60 The mineralizing film in this study exhibited not only the least color change, mineral loss, lesion depth and nanomechanical reduction, but also the best remineralization efficacy (Table 2, Figures 5–7). When the mineralizing film was used in this study, hydroxyapatite (Ca10(PO4)6(OH)2) and fluorapatite (Ca10(PO4)6F2) as well as the calcium fluoride (CaF2) can also be formed in the lesions and fill the crystal gaps.61 Therefore, EDX analysis (Figure 6) showed a higher Ca/P ratio in the mineralizing film group than the controls.
According to our experimental results, the null hypothesis that mineralizing film neither can inhibit enamel demineralization nor promote enamel remineralization can be rejected. The potential WSLs prevention mechanisms of mineralizing film may be described as follows: Mineralizing film can be changed into hydrogel in moist milieu,31 in which the AFCP nanoparticles are gradually released due to gel-sol transition of the HPMC. HPMC contains hydrophobic microregions associated with its hydrophobic methoxy groups that provides a porous microstructure for drug loading and releasing.62 Moreover, the polyhydroxy groups of HPMC in the hydrophobic microregions can restrain ions.62 Thus, the abundance of Ca, P, and F ions released from the mineralizing film might be held up in the three-dimensional hydrogel network for a certain time, which provides a micro-environment for biomineralization.63,64 And in parallel, the phase stability of AFCP has been enhanced to 8~12 h by the HPMC (Figure 4A). When enamel is demineralized, the defects and gaps of enamel might become nucleation sites for mineral ions.65 In this situation, calcium and phosphate ions could infiltrate into enamel inter-crystal gaps and deposited there (Figure 6). Fluoride ions (F−) can substitute randomly for hydroxide ions (OH−) or carbonate ions (CO32-) of the hydroxyapatite (HAP) to form fluorapatite (FAP) on and in the enamel, which is more resistant to acid challenge.66,67 This might hinder the penetration of organic acids through nanochannels.46 Hence, the enamel WSLs might be reversed by biomimetic mineralization with the damaged crystallites repaired and the lost mineral content replaced.61
Although some studies have proposed that the regularly use of fluoride products may lower the incidence of WSLs, the mere presence of fluoride is insufficient to remineralize early carious lesions. This is the reason that fluoride-mediated salivary remineralization seems to be restricted to the outer layer about 30 µm of the tooth surface.68 In recent years, CPP-ACP with fluoride have been reported to manage dental caries.69 Thus, GC Tooth Mousse Plus® served as a positive control in this study. The mineralizing film displayed a superior prevention of WSLs than Tooth Mousse Plus in this study. First, the pH buffering capacity of mineralizing film was much better than Tooth Mousse plus (Figures 4C and S2). Second, compared to Tooth Mousse plus, the F ions released from mineralizing film were more rapidly and sustained at higher levels during the first period of 8 h (Figures 4E and S3). The AFCP nanoparticles in mineralizing film were synthesized by introducing fluorine into ACP, so that the fluoride ions can be released for comparably long time. In contrast, the NaF in Tooth Mousse Plus is simple admixture with ACP, the fluoride may combine with calcium to form low soluble “calcium fluoride-like” composition.69 The bioactivity of AFCP in dried mineralizing film can be preserved in a stable, solid form. In our preliminary study, a vacuum package of mineralizing film in the dry state could maintain the stability of the AFCP nanoparticles in amorphous phase at least for 3 months. Hydroxypropyl methylcellulose either in film or in hydrogel status was used as a carrier for AFCP nanoparticles in this study. We suggest that patients will put on the mineralizing film on their tooth surface by means their saliva during the night sleep for 6~8 h after toothbrushing. The mineralizing film attaching on the enamel surface in oral cavity will gradually become hydrogel that will deliver biomimetic mineralization.
Conclusions
The mineralizing film consisting of HPMC and AFCP nanoparticles could reduce enamel color change, mineral loss, nanomechanical decrease, and promote enamel mineralization when enamel was challenged by pH cycling. The mineralizing film might be a promising strategy for controlling WSLs via inhibiting enamel demineralization and promoting enamel remineralization.
Acknowledgments
This work was supported by the National Natural Science Foundation of China (grant numbers 81771120, 81970982 and 82001097) and the Key Research and Development Plan Projects of Zhejiang Province (No. 2020C03037).
Disclosure
Fu BP, Wang Z, and Wu ZF have reported a patent related to this work (patent number ZL 2016 1 0893384.3). The authors report no other conflicts of interest in this work.
References
1. Akin M, Tezcan M, Ileri Z, Ayhan F. Incidence of white spot lesions among patients treated with self- and conventional ligation systems. Clin Oral Investig. 2015;19(6):1501–1506. doi:10.1007/s00784-014-1382-3
2. Borges AB, Caneppele TM, Masterson D, Maia LC. Is resin infiltration an effective esthetic treatment for enamel development defects and white spot lesions? A systematic review. J Dent. 2017;56:11–18. doi:10.1016/j.jdent.2016.10.010
3. Paula AB, Fernandes AR, Coelho AS, et al. Therapies for White Spot Lesions-A Systematic Review. J Evid Based Dent Pract. 2017;17(1):23–38. doi:10.1016/j.jebdp.2016.10.003
4. Ruan Q, Moradian-Oldak J. Amelogenin and Enamel Biomimetics. J Mater Chem B. 2015;3(16):3112–3129. doi:10.1039/C5TB00163C
5. Pitts NB, Zero DT, Marsh PD, et al. Dental caries. Nat Rev Dis Primers. 2017;3:1–16. doi:10.1038/nrdp.2017.30
6. Benson PE, Parkin N, Dyer F, Millett DT, Germain P. Fluorides for preventing early tooth decay (demineralised lesions) during fixed brace treatment. Cochrane Database Syst Rev. 2019;2019(11):CD003809.
7. Sardana D, Zhang J, Ekambaram M, Yang Y, McGrath CP, Yiu CKY. Effectiveness of professional fluorides against enamel white spot lesions during fixed orthodontic treatment: a systematic review and meta-analysis. J Dent. 2019;82:1–10. doi:10.1016/j.jdent.2018.12.006
8. Philip N. State of the Art Enamel Remineralization Systems: the Next Frontier in Caries Management. Caries Res. 2019;53(3):284–295. doi:10.1159/000493031
9. Cochrane NJ, Cai F, Huq NL, Burrow MF, Reynolds EC. New approaches to enhanced remineralization of tooth enamel. J Dent Res. 2010;89(11):1187–1197. doi:10.1177/0022034510376046
10. Urquhart O, Tampi MP, Pilcher L, et al. Nonrestorative Treatments for Caries: systematic Review and Network Meta-analysis. J Dent Res. 2019;98(1):14–26. doi:10.1177/0022034518800014
11. Gordon LM, Cohen MJ, MacRenaris KW, Pasteris JD, Seda T, Joester D. Amorphous intergranular phases control the properties of rodent tooth enamel. Science. 2015;347(6223):746–750. doi:10.1126/science.1258950
12. Cantaert B, Beniash E, Meldrum FC. Nanoscale confinement controls the crystallization of calcium phosphate: relevance to bone formation. Chemistry. 2013;19(44):14918–14924. doi:10.1002/chem.201302835
13. Shen P, Walker GD, Yuan Y, et al. Importance of bioavailable calcium in fluoride dentifrices for enamel remineralization. J Dent. 2018;78:59–64. doi:10.1016/j.jdent.2018.08.005
14. Pakravanan K, Roknabadi MR, Farzanegan F, Hashemzadeh A, Darroudi M. Amorphous calcium phosphate nanoparticles-based mouthwash: preparation, characterization, and anti-bacterial effects. Green Chem Lett Rev. 2019;12(3):278–285. doi:10.1080/17518253.2019.1643412
15. Li J, Xie X, Wang Y, et al. Long-term remineralizing effect of casein phosphopeptide-amorphous calcium phosphate (CPP-ACP) on early caries lesions in vivo: a systematic review. J Dent. 2014;42(7):769–777. doi:10.1016/j.jdent.2014.03.015
16. Gelli R, Ridi F, Baglioni P. The importance of being amorphous: calcium and magnesium phosphates in the human body. Adv Colloid Interface Sci. 2019;269:219–235. doi:10.1016/j.cis.2019.04.011
17. Luo XJ, Yang HY, Niu LN, et al. Translation of a solution-based biomineralization concept into a carrier-based delivery system via the use of expanded-pore mesoporous silica. Acta Biomater. 2016;31:378–387. doi:10.1016/j.actbio.2015.11.062
18. Wang Z, Ouyang Y, Wu Z, et al. A novel fluorescent adhesive-assisted biomimetic mineralization. Nanoscale. 2018;10(40):18980–18987. doi:10.1039/C8NR02078G
19. Jiang S, Pan H, Chen Y, Xu X, Tang R. Amorphous calcium phosphate phase-mediated crystal nucleation kinetics and pathway. Faraday Discuss. 2015;179:451–461. doi:10.1039/C4FD00212A
20. Luo JB, Qiu SX, Zhou XY, Lai RH, Dong PJ, Xie XY. In situ grafting polyethylene glycol chains onto amorphous calcium phosphate nanoparticles to improve the storage stability and organic solvent redispersibility. Colloids Surf a Physicochem Eng Asp. 2014;444:81–88. doi:10.1016/j.colsurfa.2013.12.041
21. Wu Z, Wang X, Wang Z, et al. Self-Etch Adhesive as a Carrier for ACP Nanoprecursors to Deliver Biomimetic Remineralization. ACS Appl Mater Interfaces. 2017;9(21):17710–17717. doi:10.1021/acsami.7b01719
22. Melo MA, Guedes SF, Xu HH, Rodrigues LK. Nanotechnology-based restorative materials for dental caries management. Trends Biotechnol. 2013;31(8):459–467. doi:10.1016/j.tibtech.2013.05.010
23. Abou Neel EA, Aljabo A, Strange A, et al. Demineralization–remineralization dynamics in teeth and bone. Int J Nanomedicine. 2016;11:4743–4763. doi:10.2147/IJN.S107624
24. Fan Y, Nelson JR, Alvarez JR, Hagan J, Berrier A, Xu X. Amelogenin-assisted ex vivo remineralization of human enamel: effects of supersaturation degree and fluoride concentration. Acta Biomater. 2011;7(5):2293–2302. doi:10.1016/j.actbio.2011.01.028
25. Fontana M. Enhancing Fluoride: clinical Human Studies of Alternatives or Boosters for Caries Management. Caries Res. 2016;50(Suppl 1):22–37. doi:10.1159/000439059
26. Iijima M, Onuma K. Roles of Fluoride on Octacalcium Phosphate and Apatite Formation on Amorphous Calcium Phosphate Substrate. Cryst Growth Des. 2018;18(4):2279–2288. doi:10.1021/acs.cgd.7b01717
27. Ge X, Zhao JM, Lu X, et al. Controllable phase transformation of fluoridated calcium phosphate ultrathin coatings for biomedical applications. J Alloys Compd. 2020;847:155920. doi:10.1016/j.jallcom.2020.155920
28. Gopinath V, Saravanan S, Al-Maleki AR, Ramesh M, Vadivelu J. A review of natural polysaccharides for drug delivery applications: special focus on cellulose, starch and glycogen. Biomed Pharmacother. 2018;107:96–108. doi:10.1016/j.biopha.2018.07.136
29. Borges AF, Silva C, Coelho JF, Simões S. Oral films: current status and future perspectives: i - Galenical development and quality attributes. J Control Release. 2015;206:1–19. doi:10.1016/j.jconrel.2015.03.006
30. Malik QUA, Iftikhar S, Zahid S, et al. Smart injectable self-setting bioceramics for dental applications. Mater Sci Eng C Mater Biol Appl. 2020;113:110956. doi:10.1016/j.msec.2020.110956
31. Maderuelo C, Zarzuelo A, Lanao JM. Critical factors in the release of drugs from sustained release hydrophilic matrices. J Control Release. 2011;154(1):2–19. doi:10.1016/j.jconrel.2011.04.002
32. Chavan RB, Rathi S, Jyothi VGSS, Shastri NR. Cellulose based polymers in development of amorphous solid dispersions. Asian J Pharm Sci. 2019;14(3):248–264. doi:10.1016/j.ajps.2018.09.003
33. Wegiel LA, Mauer LJ, Edgar KJ, Taylor LS. Crystallization of amorphous solid dispersions of resveratrol during preparation and storage-Impact of different polymers. J Pharm Sci. 2013;102(1):171–184. doi:10.1002/jps.23358
34. Zhang J, Boyes V, Festy F, Lynch RJM, Watson TF, Banerjee A. In-vitro subsurface remineralisation of artificial enamel white spot lesions pre-treated with chitosan. Dent Mater. 2018;34(8):1154–1167. doi:10.1016/j.dental.2018.04.010
35. Alania Y, Chiari MD, Rodrigues MC, et al. Bioactive composites containing TEGDMA-functionalized calcium phosphate particles: degree of conversion, fracture strength and ion release evaluation. Dent Mater. 2016;32(12):e374–e381. doi:10.1016/j.dental.2016.09.021
36. Sun L, Yan Z, Duan Y, Zhang J, Liu B. Improvement of the mechanical, tribological and antibacterial properties of glass ionomer cements by fluorinated graphene. Dent Mater. 2018;34(6):e115–e127. doi:10.1016/j.dental.2018.02.006
37. Damato FA, Strang R, Stephen KW. Comparison of solution- and gel-prepared enamel lesions–and in vitro pH-cycling study. J Dent Res. 1988;67(8):1122–1125. doi:10.1177/00220345880670081201
38. Schoppmeier CM, Derman SHM, Noack MJ, et al. Power bleaching enhances resin infiltration masking effect of dental fluorosis. A randomized clinical trial. J Dent. 2018;79:77–84. doi:10.1016/j.jdent.2018.10.005
39. Johnston WM. Color measurement in dentistry. J Dent. 2009;37(Suppl 1):e2–e6. doi:10.1016/j.jdent.2009.03.011
40. Dharmalingam K, Anandalakshmi R. Fabrication, characterization and drug loading efficiency of citric acid crosslinked NaCMC-HPMC hydrogel films for wound healing drug delivery applications. Int J Biol Macromol. 2019;134:815–829. doi:10.1016/j.ijbiomac.2019.05.027
41. Ding C, Zhang M, Li G. Preparation and characterization of collagen/hydroxypropyl methylcellulose (HPMC) blend film. Carbohydr Polym. 2015;119:194–201. doi:10.1016/j.carbpol.2014.11.057
42. Zhao Y, Kang J, Tan TW. Salt-, pH- and temperature-responsive semi-interpenetrating polymer network hydrogel based on poly(aspartic acid) and poly(acrylic acid). Polymer. 2006;47(22):7702–7710. doi:10.1016/j.polymer.2006.08.056
43. Yamashita K, Nakate T, Okimoto K, et al. Establishment of new preparation method for solid dispersion formulation of tacrolimus. Int J Pharm. 2003;267(1–2):79–91. doi:10.1016/j.ijpharm.2003.07.010
44. Stifler CA, Jakes JE, North JD, Green DR, Weaver JC, Gilbert PUPA. Crystal misorientation correlates with hardness in tooth enamels. Acta Biomater. 2021;120:124–134. doi:10.1016/j.actbio.2020.07.037
45. Beniash E, Stifler CA, Sun CY, et al. The hidden structure of human enamel. Nat Commun. 2019;10(1):4383. doi:10.1038/s41467-019-12185-7
46. Peng C, de Sousa FB, Gan HY, et al. Enhanced Delivery of F-, Ca2+, K+, and Na+ Ions into Enamel by Electrokinetic Flows. J Dent Res. 2019;98(4):430–436. doi:10.1177/0022034518818463
47. Robinson C, Shore RC, Brookes SJ, Strafford S, Wood SR, Kirkham J. The chemistry of enamel caries. Crit Rev Oral Biol Med. 2000;11(4):481–495. doi:10.1177/10454411000110040601
48. Lacruz RS, Habelitz S, Wright JT, Paine ML. Dental Enamel Formation And Implications For Oral Health And Disease. Physiol Rev. 2017;97(3):939–993. doi:10.1152/physrev.00030.2016
49. Ren Y, Jongsma MA, Mei L, Van der mei HC, Busscher HJ. Orthodontic treatment with fixed appliances and biofilm formation–a potential public health threat? Clin Oral Investig. 2014;18(7):1711–1718. doi:10.1007/s00784-014-1240-3
50. Jayaramudu T, Varaprasad K, Pyarasani RD, et al. Hydroxypropyl methylcellulose-copper nanoparticle and its nanocomposite hydrogel films for antibacterial application. Carbohydr Polym. 2021;254:117302. doi:10.1016/j.carbpol.2020.117302
51. Meng F, Trivino A, Prasad D, Chauhan H. Investigation and correlation of drug polymer miscibility and molecular interactions by various approaches for the preparation of amorphous solid dispersions. Eur J Pharm Sci. 2015;71:12–24. doi:10.1016/j.ejps.2015.02.003
52. Konno H, Taylor LS. Influence of different polymers on the crystallization tendency of molecularly dispersed amorphous felodipine. J Pharm Sci. 2006;95(12):2692–2705. doi:10.1002/jps.20697
53. Navrotsky A. Energetic clues to pathways to biomineralization: precursors, clusters, and nanoparticles. Proc Natl Acad Sci U S A. 2004;101(33):12096–12101. doi:10.1073/pnas.0404778101
54. Saeidipour F, Mansourpour Z, Mortazavian E, Rafiee-Tehrani N, Rafiee-Tehrani M. New comprehensive mathematical model for HPMC-MCC based matrices to design oral controlled release systems. Eur J Pharm Biopharm. 2017;121:61–72. doi:10.1016/j.ejpb.2017.09.007
55. Lacruz RS, Hacia JG, Bromage TG, et al. The circadian clock modulates enamel development. J Biol Rhythms. 2012;27(3):237–245. doi:10.1177/0748730412442830
56. Dorvee JR, Boskey AL, Estroff LA. Rediscovering Hydrogel-Based Double-Diffusion Systems for Studying Biomineralization. CrystEngComm. 2012;14(18):5681–5700. doi:10.1039/c2ce25289a
57. Silverman L, Boskey AL. Diffusion systems for evaluation of biomineralization. Calcif Tissue Int. 2004;75(6):494–501. doi:10.1007/s00223-004-0019-y
58. Schwass DR, Swain MV, Purton DG, Leichter JW. A system of calibrating microtomography for use in caries research. Caries Res. 2009;43(4):314–321. doi:10.1159/000226230
59. Efeoglu N, Wood D, Efeoglu C. Microcomputerised tomography evaluation of 10% carbamide peroxide applied to enamel. J Dent. 2005;33(7):561–567. doi:10.1016/j.jdent.2004.12.001
60. Angker L, Swain MV. Nanoindentation: application to dental hard tissue investigations. J Mater Res. 2006;21(8):1893–1905. doi:10.1557/jmr.2006.0257
61. Dogan S, Fong H, Yucesoy DT, et al. Biomimetic Tooth Repair: amelogenin-Derived Peptide Enables in Vitro Remineralization of Human Enamel. ACS Biomater Sci Eng. 2018;4(5):1788–1796. doi:10.1021/acsbiomaterials.7b00959
62. Yang TL, He R, Omeoga U, et al. Biomimetic mineralization of the carbonates regulated by using hydroxypropyl methylcellulose macromolecules as organic templates. J Cryst Growth. 2019;508;72-81. doi:10.1016/j.jcrysgro.2018.12.029
63. Rupenthal ID, Green CR, Alany RG. Comparison of ion-activated in situ gelling systems for ocular drug delivery. Part 1: physicochemical characterisation and in vitro release. Int J Pharm. 2011;411(1–2):69–77. doi:10.1016/j.ijpharm.2011.03.042
64. Daculsi G, Rohanizadeh R, Weiss P, Bouler JM. Crystal polymer interaction with new injectable bone substitute; SEM and Hr TEM study. J Biomed Mater Res. 2000;50(1):1–7. doi:10.1002/(SICI)1097-4636(200004)50:1<1::AID-JBM1>3.0.CO;2-W
65. Yin Y, Yun S, Fang J, Chen H. Chemical regeneration of human tooth enamel under near-physiological conditions. Chem Commun. 2009;2(39):5892–5894. doi:10.1039/b911407f
66. Aoba T. The effect of fluoride on apatite structure and growth. Crit Rev Oral Biol Med. 1997;8(2):136–153. doi:10.1177/10454411970080020301
67. Davis HB, Gwinner F, Mitchell JC, Ferracane JL. Ion release from, and fluoride recharge of a composite with a fluoride-containing bioactive glass. Dent Mater. 2014;30(10):1187–1194. doi:10.1016/j.dental.2014.07.012
68. Schmidlin P, Zobrist K, Attin T, Wegehaupt F. In vitro re-hardening of artificial enamel caries lesions using enamel matrix proteins or self-assembling peptides. J Appl Oral Sci. 2016;24(1):31–36. doi:10.1590/1678-775720150352
69. Sleibi A, Tappuni AR, Karpukhina NG, Hill RG, Baysan A. A comparative evaluation of ion release characteristics of three different dental varnishes containing fluoride either with CPP-ACP or bioactive glass. Dent Mater. 2019;35(12):1695–1705. doi:10.1016/j.dental.2019.08.113
 © 2021 The Author(s). This work is published and licensed by Dove Medical Press Limited. The full terms of this license are available at https://www.dovepress.com/terms.php and incorporate the Creative Commons Attribution - Non Commercial (unported, v3.0) License.
By accessing the work you hereby accept the Terms. Non-commercial uses of the work are permitted without any further permission from Dove Medical Press Limited, provided the work is properly attributed. For permission for commercial use of this work, please see paragraphs 4.2 and 5 of our Terms.
© 2021 The Author(s). This work is published and licensed by Dove Medical Press Limited. The full terms of this license are available at https://www.dovepress.com/terms.php and incorporate the Creative Commons Attribution - Non Commercial (unported, v3.0) License.
By accessing the work you hereby accept the Terms. Non-commercial uses of the work are permitted without any further permission from Dove Medical Press Limited, provided the work is properly attributed. For permission for commercial use of this work, please see paragraphs 4.2 and 5 of our Terms.