")
Back to Journals » Clinical, Cosmetic and Investigational Dermatology » Volume 15
A Genome-Wide Association Study and Machine-Learning Algorithm Analysis on the Prediction of Facial Phenotypes by Genotypes in Korean Women
Authors Yoo HY , Lee KC , Woo JE , Park SH , Lee S , Joo J , Bae JS , Kwon HJ , Park BJ
Received 23 September 2021
Accepted for publication 12 January 2022
Published 11 March 2022 Volume 2022:15 Pages 433—445
DOI https://doi.org/10.2147/CCID.S339547
Checked for plagiarism Yes
Review by Single anonymous peer review
Peer reviewer comments 2
Editor who approved publication: Dr Jeffrey Weinberg
Hye-Young Yoo,1,* Ki-Chan Lee,2,* Ji-Eun Woo,1 Sung-Ha Park,1 Sunghoon Lee,2 Joungsu Joo,2 Jin-Sik Bae,2 Hyuk-Jung Kwon,2 Byoung-Jun Park1
1Skin & Natural Products Lab, Kolmar Korea Co., Ltd., Seoul, 06800, Republic of Korea; 2R&D Department, Eone Diagnomics Genome Center Co., Ltd, Songdo Incheon, 22014, Republic of Korea
*These authors contributed equally to this work
Correspondence: Byoung-Jun Park, Skin & Natural Products Lab, Kolmar Korea Co., Ltd., Seoul, 06800, Republic of Korea, Tel +82 1044025395, Fax +82 229759414, Email [email protected], Hyuk-Jung Kwon, R&D Department, Eone Diagnomics Genome Center Co., Ltd, Songdo Incheon, 22014, Republic of Korea, Tel +82 1081204403, Fax +82 327132107, Email [email protected]
Purpose: Changes in facial appearance are affected by various intrinsic and extrinsic factors, which vary from person to person. Therefore, each person needs to determine their skin condition accurately to care for their skin accordingly. Recently, genetic identification by skin-related phenotypes has become possible using genome-wide association studies (GWAS) and machine-learning algorithms. However, because most GWAS have focused on populations with American or European skin pigmentation, large-scale GWAS are needed for Asian populations. This study aimed to evaluate the correlation of facial phenotypes with candidate single-nucleotide polymorphisms (SNPs) to predict phenotype from genotype using machine learning.
Materials and Methods: A total of 749 Korean women aged 30– 50 years were enrolled in this study and evaluated for five facial phenotypes (melanin, gloss, hydration, wrinkle, and elasticity). To find highly related SNPs with each phenotype, GWAS analysis was used. In addition, phenotype prediction was performed using three machine-learning algorithms (linear, ridge, and linear support vector regressions) using five-fold cross-validation.
Results: Using GWAS analysis, we found 46 novel highly associated SNPs (p < 1× 10− 05): 3, 20, 12, 6, and 5 SNPs for melanin, gloss, hydration, wrinkle, and elasticity, respectively. On comparing the performance of each model based on phenotypes using five-fold cross-validation, the ridge regression model showed the highest accuracy (r2 = 0.6422– 0.7266) in all skin traits. Therefore, the optimal solution for personal skin diagnosis using GWAS was with the ridge regression model.
Conclusion: The proposed facial phenotype prediction model in this study provided the optimal solution for accurately predicting the skin condition of an individual by identifying genotype information of target characteristics and machine-learning methods. This model has potential utility for the development of customized cosmetics.
Keywords: customized cosmetics, single-nucleotide polymorphism, genome-wide association study, machine-learning algorithm, microarray
Introduction
The skin of Korean women is characterized by decreased moisture, elasticity, and skin gloss, with increased wrinkle depth and hyperpigmentation spots due to aging and external factors.1 Skin aging and changes are caused by a combination of intrinsic and extrinsic factors, which include increases in skin aging genes, lifestyle (eg, sleep restrictions and fatigue), and environmental exposure (eg, seasonal changes, airborne pollutants, and ultraviolet [UV] light). More recently, alongside resident skin microbiome diversity, skin irritation and changes from prolonged use of face masks (Korea Filter 94 mask) because of coronavirus disease 2019 (COVID-19) have emerged as aging factors.2–11 Because of individual differences in degree of aging and skin condition, there have been increases in the development of personalized cosmetic technology, such as three-dimensional parametric facial masks and skin diagnosis methods.12 The skin diagnosis methods for customized cosmetics involve lifestyle questionnaires, clinical evaluations using noninvasive devices, self-diagnosis equipment that converges technology and artificial intelligence (AI), and direct-to-customer genetic tests. Of these, skin condition and degree of aging of an individual can only be predicted using the following three methods: individual genetic analysis, lifestyle questionnaire, and the AI machine-learning algorithm.
Potential causative genes for specific skin-related phenotypes have been identified using genome-wide association studies (GWAS) and machine-learning algorithms.13–15 There are millions of single-nucleotide polymorphisms (SNPs) in each human genome.16 GWAS identify SNPs in a population that mark genomic regions that are strongly associated with several complex phenotypes.17 These genomic regions must contain the variant that is causally associated with the phenotype; however, the SNP that is identified by the GWAS is not necessarily directly causal. Therefore, most SNPs are located in noncoding regions and, thus, are indirectly involved in their phenotype association.18
In several GWAS on skin phenotypes, widely known genes, such as ASIP, MC1R, and TYR, have been shown to be involved with pigmentation traits, such as hyperpigmentation spots and skin color.19–22 In a recent study, novel genomic loci were shown to be related to facial pigmented spots in a Korean population.23 However, most large-scale GWAS have been conducted in individuals with European ancestry, and there are few genetic-based studies that have investigated diverse skin phenotypes, especially Korean skin phenotypes.
Genotype imputation using haplotype information from a genotyped reference sample from a dense genotype array or sequencing infers missing genotypes. This strategy is used because throughout the human genome, there is a correlation structure in the genetic variation of different loci, which is called linkage disequilibrium (LD). The use of this approach can improve GWAS. Reducing the number of missing genotypes can improve the statistical power to detect associations and increase the overall number and density of genomic variants available for association testing.24
Before applying machine learning, data preprocessing is an essential component of many classification and regression models. Appropriate feature selection during the preprocessing process can improve the performance of classification or regression problems with low time complexity.25
Machine-learning approaches adopt sets of complex statistical and computational algorithms to make predictions by mathematically mapping complex associations between risk SNPs and phenotypes26 and can be supervised or unsupervised.27 Although the utility of unsupervised machine-learning methods for nongenetic data in phenotype predictions has been demonstrated,28 our focus was on supervised modeling informed by SNP data. Supervised machine-learning phenotype prediction models are generated by training preset learning algorithms to map relationships between individual sample genotype data and the associated phenotype. Optimal predictive power for the target phenotype is achieved by mapping the pattern of selected features (variables) within the training genotype data.29 At the end of the training stage, models with the maximum predictive power for the training dataset are selected for validation.30 The validation stage is accomplished by evaluating the algorithm on an independent dataset. Cross-validation is a commonly used procedure for validating model performance using the original dataset. We performed five-fold cross-validation. The method divides the data into five sets, each of which is analyzed as a test set, and the data except for the test set are used as a training set to evaluate the model. However, external validation using an independent dataset is required to confirm the predictive power of a machine-learning model.
The identification of significant genotype–phenotype associations is essential for developing an effective model. The present study aimed to use machine-learning algorithms to find the optimal solution for personal skin diagnosis by identifying genetic markers that were associated with skin biophysical parameters, defining skin genotype–phenotype correlations, and providing the most appropriate machine-learning method for predicting skin phenotype from genotype. To confirm the feasibility, we performed three types of linear regression analyses as follows: linear regression, ridge regression using L2-regularization, and regression using a support vector.
We recruited 749 Korean women and generated various clinical and genomic skin data from each woman. These were merged with array data and used for GWAS and machine learning. Furthermore, we identified significant markers related to skin phenotype using GWAS level analysis. We built a machine-learning model and used linear regression analysis to evaluate the model’s performance. We expect that our results may be used as an indicator to provide personal skin traits.
Materials and Methods
Subjects
This research was approved by the Korean public institutional review board (IRB), and all participants were fully informed about the study process before obtaining written informed consent. All the study procedures were performed in accordance with the Korean public IRB. A total of 749 Korean women aged 30–50 years (40.8 ± 5.4 years) participated in this study, which was conducted from January 2019 to February 2020 in Kolmar Korea Co. There were 309 women aged <40 years and 440 women aged >40 years. Subjects who had any specific severe skin disease (eg, erythema or infectious disease) or allergy to cosmetics in the area for clinical measurement were excluded. Before the measurement procedure, subjects were required to remove all makeup with a cleanser. Subjects waited in a room that was maintained at constant temperature and humidity conditions (24°C ± 2°C and 50% ± 5%, respectively) for 30 min.
For the GWAS, all subjects provided saliva using the AccuSaliva collection kit (ACN11.01, AccuGene, Korea), which was stored in a preservative solution at room temperature (15°C–25°C) until delivery to the Eone Diagnomics Genome Center. During the 30 min before saliva collection, eating, brushing teeth, drinking, chewing gum, smoking were prohibited. Subjects gargled with water, and saliva was collected after 10 min. Lifestyle and current skin condition information were collected using a questionnaire, which included cosmetic (skin care and makeup products) use, facial washing habits, use of sunscreen, skin sensitivity, concerns about acne, smoking, and hours of sleep.
Evaluation of Skin Biophysical Parameters
To objectively investigate the skin condition of participants, we quantitatively measured five skin biophysical parameters using noninvasive clinical equipment: melanin level, gloss, hydration, wrinkle, and elasticity. We measured these biophysical skin parameters from four distinct facial sites: forehead, cheek, canthus, and chin. Repeated measurements were not exactly in the same location; however, measurements were obtained using the same pressure. The measurements were averaged to be used for group statistics.
Melanin
Melanin level, which contributes to skin pigmentation, was measured using Mexameter MX 18 (Courage & Khazaka, Cologne, Germany), which calculates the amount of light absorbed by the skin. Melanin level was measured three times on hyperpigmented areas of the face, and the averaged melanin index value (arbitrary unit [A.U.]) was used for further analysis.31
Gloss
Skin-Glossymeter GL200 (Courage & Khazaka, Cologne, Germany) was used to measure gloss, which is based on light reflection from the skin surface. The cheek area was measured 10 times in a row and averaged to obtain the gloss diffuse scattering correction (DSC) value (A.U.).32
Hydration
Skin hydration level of the cheek area was evaluated using Corneometer CM 825 (Courage & Khazaka, Cologne, Germany) by measuring the electrical capacitance of the stratum corneum, which is the outermost layer of the skin. Skin capacitance values were converted into A.U. according to the moisture content of skin measured by the device. Five measurements were acquired and averaged (A.U.).33
Wrinkle
For evaluation of fine wrinkle depth, a replica model was taken according to the method described in previous studies.34,35 Skin replica images of crow’s feet were obtained using Skin-Visiometer SV 600 (Courage & Khazaka, Cologne, Germany) to obtain mean wrinkle depth (A.U.).
Skin Elasticity
Cutometer Dual MPA 580 (Courage & Khazaka, Cologne, Germany) was used to assess skin elasticity, which evaluates the degree of skin resilience from skin deformed by suction of the probe. R2 (gross elasticity) was used as the main parameter to evaluate overall skin elasticity; the closer the R2 value is to 1 (100%), the better the skin elasticity.36
Genome-Wide SNP Genotyping and Algorithms
Genotyping and Data Quality Control
The Infinium Global Screening Array (GSA) by Illumina GSA Bead Chip (Illumina Inc., San Diego, CA) was used for this study. The GSA chip contains multiethnic genome-wide content, curated clinical research variants, and quality control (QC) markers for precision medicine research. In addition to the 646,824 GSA markers developed by the consortium, we designed 34,136 additional markers, which included pharmacogenomics and Korean-specific content, resulting in a total of 680,960 markers.
The variants with more than 0.2 differences in minor allele frequency (MAF) were compared with 1000G37 East Asian (EAS) and gnomAD38 EAS were removed. For the generic variants, we used the following QC criteria: control for MAF >1%, Hardy–Weinberg equilibrium (p > 0.00001), genotype call rate >98%, and individual missing rate <2%. Our final dataset comprised 375,084 SNPs.
For QC of the sample, six samples with an individual missing rate of >2% were excluded from analyses. Next, data outliers were removed from two analyses. For each phenotype, 10 outliers were removed on the basis of interquartile range (IQR). IQR represents the 25th–75th percentile of the data, and any differences of more than three times the IQR were excluded from analyses. Three further samples were removed on the basis of the principal component analysis (PCA) plot in Supplementary Figure 1.39 PCA is a dimensionality reduction method that is often used to reduce the dimensionality of large data sets by transforming a large set of variables into a smaller set that still contains most of the information. PCA reduces data by geometrically projecting them onto lower dimensions called principal components (PCs) and then uses a limited number of PCs with the goal of finding the best summary of the data. A total of 730 samples were used in the study.
GWAS (Imputation)
Imputation was performed using SHAPEIT v2.r904 and Minimac3 v2.0.1 software. We used 1000G Phase 3 and an imputed genetic dosage with R-squared statistics >0.8 for the association analysis. The association tests of genotyped SNPs were performed using a linear regression model in PLINK v1.90b (with the −linear flag) with age as a covariate. Manhattan plots were generated using the qqman 0.1.4 library in R v3.6 both before and after imputation.40–42
Feature Selection and Machine-Learning Models
a. Feature selection
First, we selected only potentially associated autosomal variants (GWAS p < 0.05) for machine-learning analyses. To extract the most promising predictors, XGBoost was applied to use the marker chosen with nonzero “gain” coefficients using the Sklearn v0.20.3 package, Xgboost in Python v3.0.
b. Machine-learning models
Initially, the dataset (N = 730) was randomly divided into training (N = 584, 80%) and test (N = 146, 20%) sets. We evaluated the model by five-fold cross-validation with the training set. This procedure was used to robustly evaluate the power of the machine-learning models. All steps of feature selection and training were conducted oLn training sets only, and testing sets were used only for the final evaluation.
The training set analyzed three algorithms using five-fold cross-validation. We used three well-established machine-learning algorithms employing linear regression: linear regression, ridge regression, and linear support vector regression (SVR).
- Linear regression43
The linear regression algorithm fits a linear model by minimizing the residual sum of squares between the observed yi in the training dataset (i = 1 … N, the sample size) and the values f(xi) predicted by the linear model. The object function is given as shown in the equation below:
Ridge regression is a regularized linear model that minimizes the sum of the squared prediction error in the training data and an L2-norm regularization, meaning the sum of the squares of regression coefficients. The advantage of ridge regression over linear regression is that it avoids overfitting the model. Ridge regression still performs well for large multivariate data with more predictors than observations. The object function is given as shown in the equation below:
The tuning parameter λ controls the model’s complexity. If λ = 0, ridge regression becomes a traditional linear regression model.
Linear SVR aims to find a function f(xi) for which the predictive value deviates by no more than a required accuracy ε from the actual yi for all training data while maximizing the flatness of the function. To implement flatness maximization, an L2-norm regularization that minimizes the squared sum of the regression coefficients is performed. The object function is given as follows:
where l is the quantity of “support vectors,” which are the samples that deviate by more than ε from the actual yi used to fit the model, and C regulates the smoothness of function f(xi).
In all methods applied here, the skin biophysical parameters were used as the phenotype (y), the genotype was used as the predictor s(x), and no additional covariates were included in the regression analysis. Because the phenotype is a continuous value and it is difficult to distinguish two or three consecutive values, only linear regression was used. Accuracy was obtained using r2 for the prediction of the subtest set and represented the proportion of variance in the data explained by the respective variables in the model. The result provides the r2 value of each fold, the average r2 value of five folds, and the r2 value of the test set.
We selected one algorithm with a large value with a small deviation in the value of r2. Training and testing were performed with the selected algorithms. Correlation was confirmed by plotting the real value and scatter of the prediction value. All computations were performed using the Sklearn v0.20.3 package in Python 3.0. All processes are outlined in Figure 1.
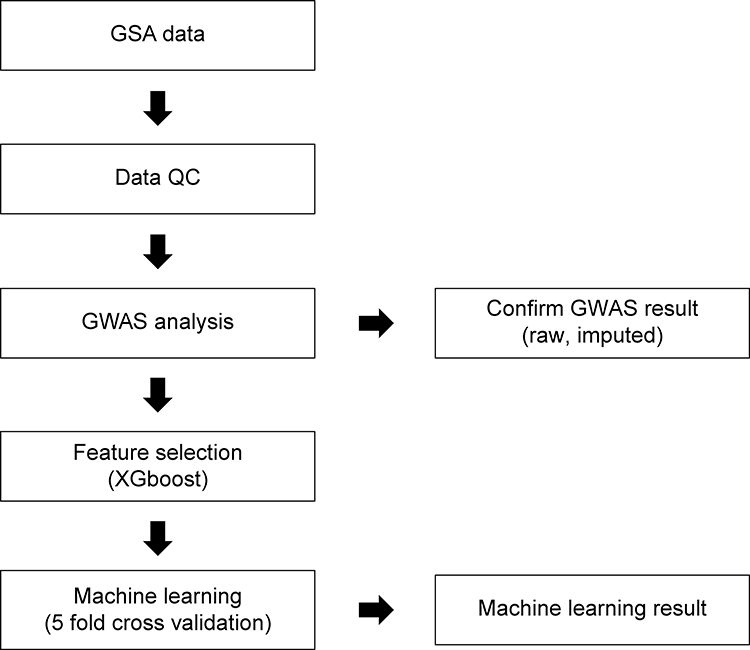 |
Figure 1 Flowchart for predicting skin phenotype using genome-wide association study (GWAS) analysis and a GWAS-based machine-learning approach. Abbreviations: GSA, global screening array; QC, quality control. |
Results
Phenotype Measurements
The five phenotype measurement data are presented as means and standard deviations in Table 1. Mean values of each phenotype were (1) melanin level of hyperpigmentation areas (chin and cheek) = 147.02 ± 35.33; (2) skin gloss value of the cheek = 4.35 ± 2.04; (3) hydration level of the cheek = 63.02 ± 16.94; (4) fine wrinkles of the canthus = 17.35 ± 4.96; and (4) skin elasticity level of the cheek = 0.67 ± 0.09.
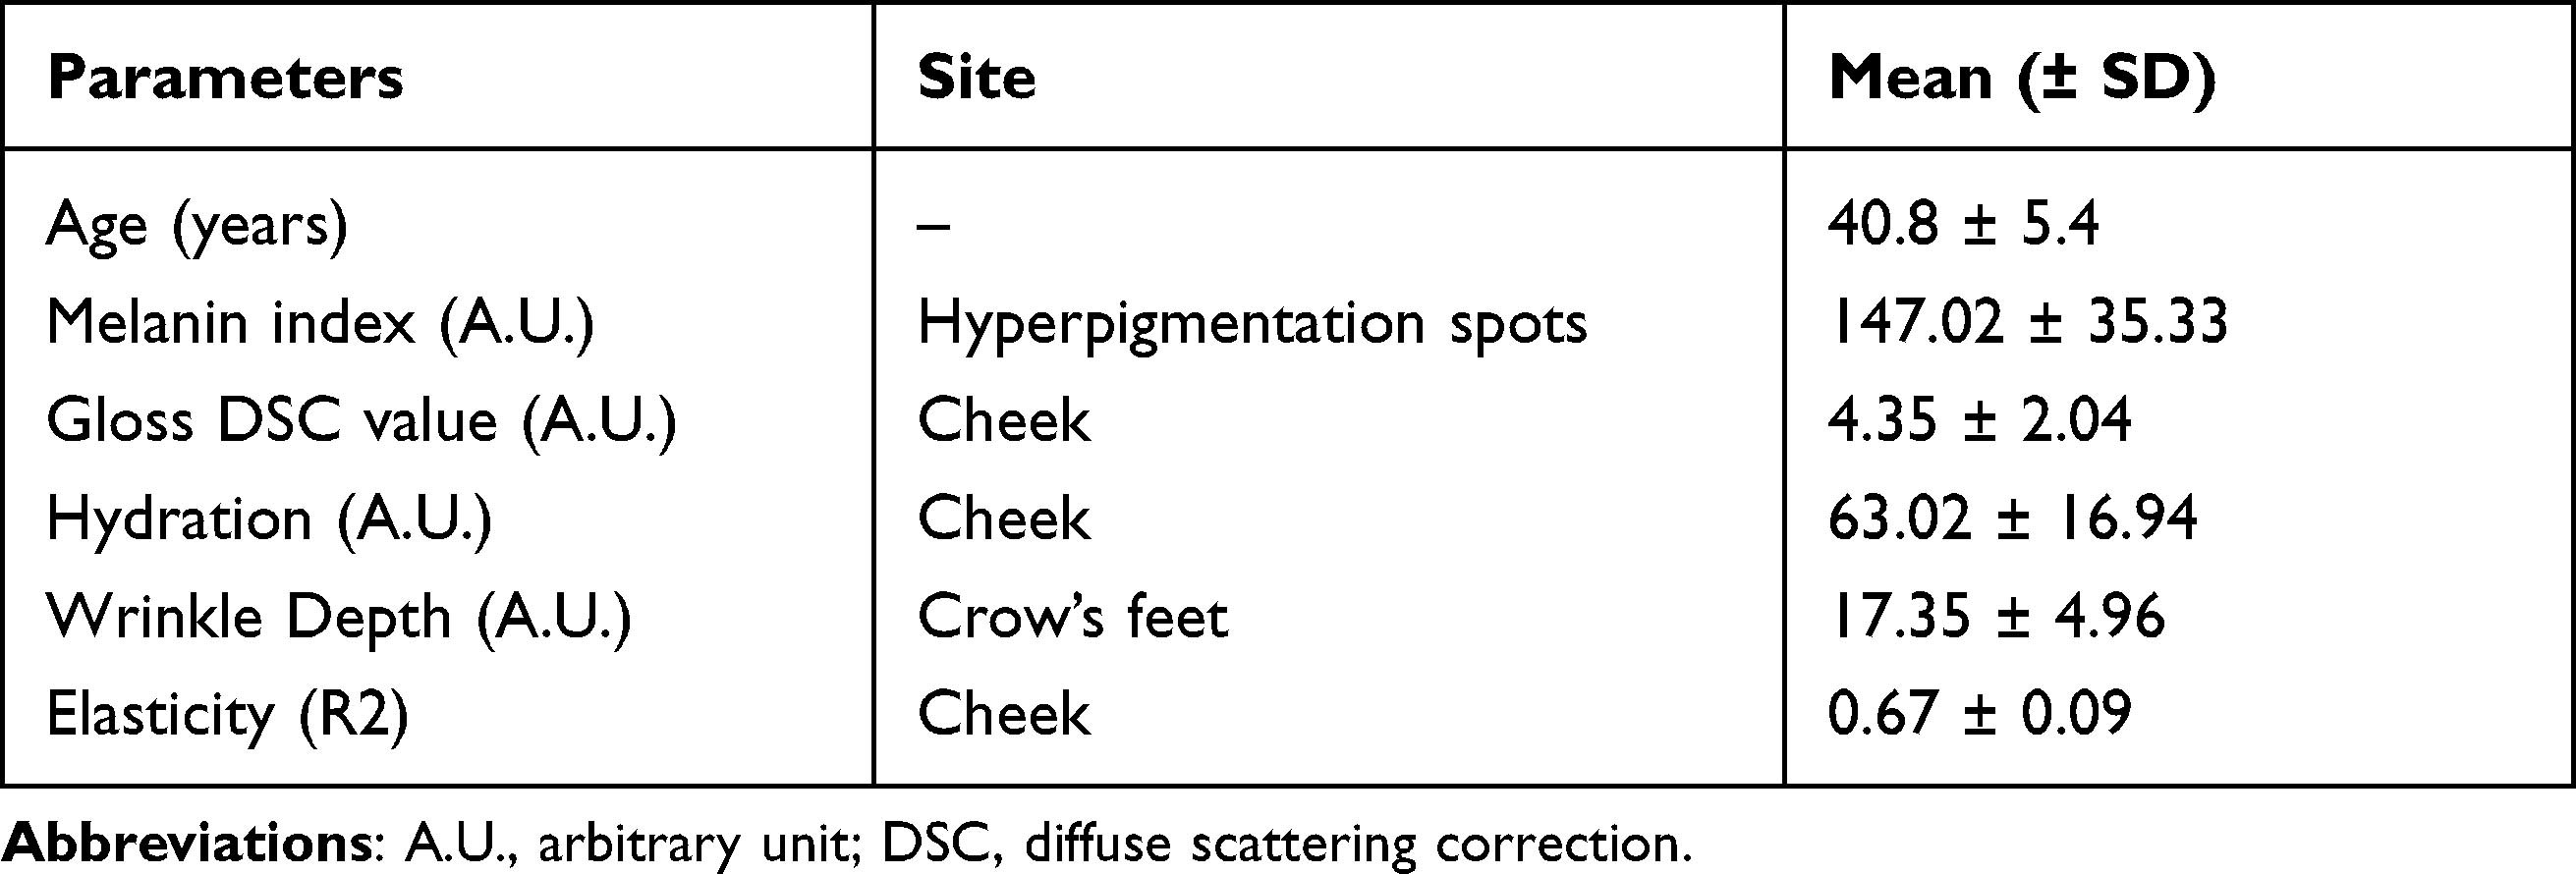 |
Table 1 Parameters, Mean Values, and Standard Deviations (SDs) of the Subjects |
GWAS
Nineteen samples were excluded from 749 samples at QC, which resulted in 730 samples of genotype data for the primary discovery analysis. All five types of skin measurement data were independently analyzed using GWAS. Results are shown in Manhattan plots and indicate the presence of multiple loci with modest effects (Figure 2). Figure 2 shows results before and after imputation to enable comparisons of SNP markers associated with each trait.
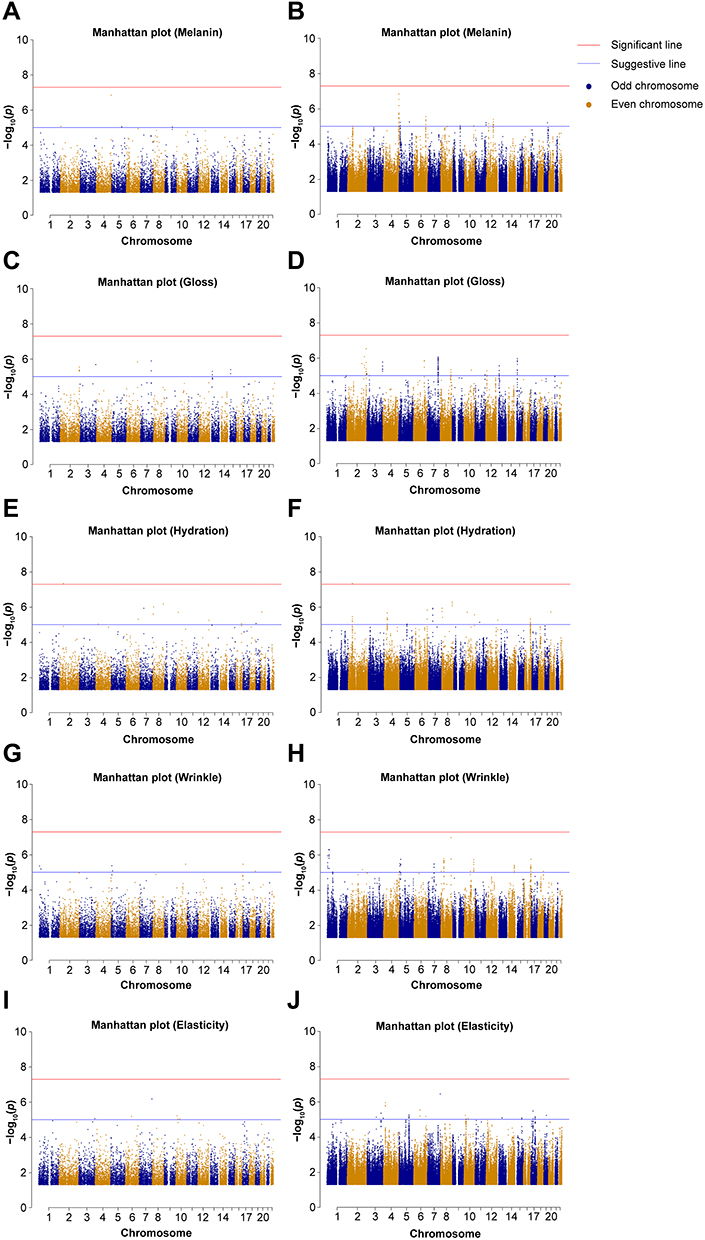 |
Figure 2 Manhattan plot of study results before and after imputation. Manhattan plot of −log10 (p value) for all tested single-nucleotide polymorphisms against genomic position. Horizontal lines indicate suggestive (blue, p < 1×10−05) and significant (red, p < 1×10−08) thresholds. Skin phenotypes: (A and B) melanin, (C and D) gloss, (E and F) hydration, (G and H) wrinkle, and (I and J) elasticity (A, C, E, G, and I are raw data, and B, D, F, H, and J are results after imputation). |
For each phenotype, we found the 46 highest association signals (p < 1×10−05). Of which, 3 were related to melanin, 20 to gloss, 12 to hydration, 6 to wrinkle, and 5 to elasticity (Table 2). Throughout the human genome, a correlation structure exists across genetic variation of different loci. Owing to the LD in GWAS, the significance marker and surrounding markers are also significant. To confirm this, we performed imputation and comparison and indicated markers that were relevant only to one of the results: one melanin (rs117929211), two hydration (rs138684226 and rs887932), two wrinkle (rs12187267 and rs1991506), and three elasticity (rs2446092, rs73499013, and rs112251095), which are denoted in Table 2. The imputed results are provided in the Supplementary Tables 1–5.
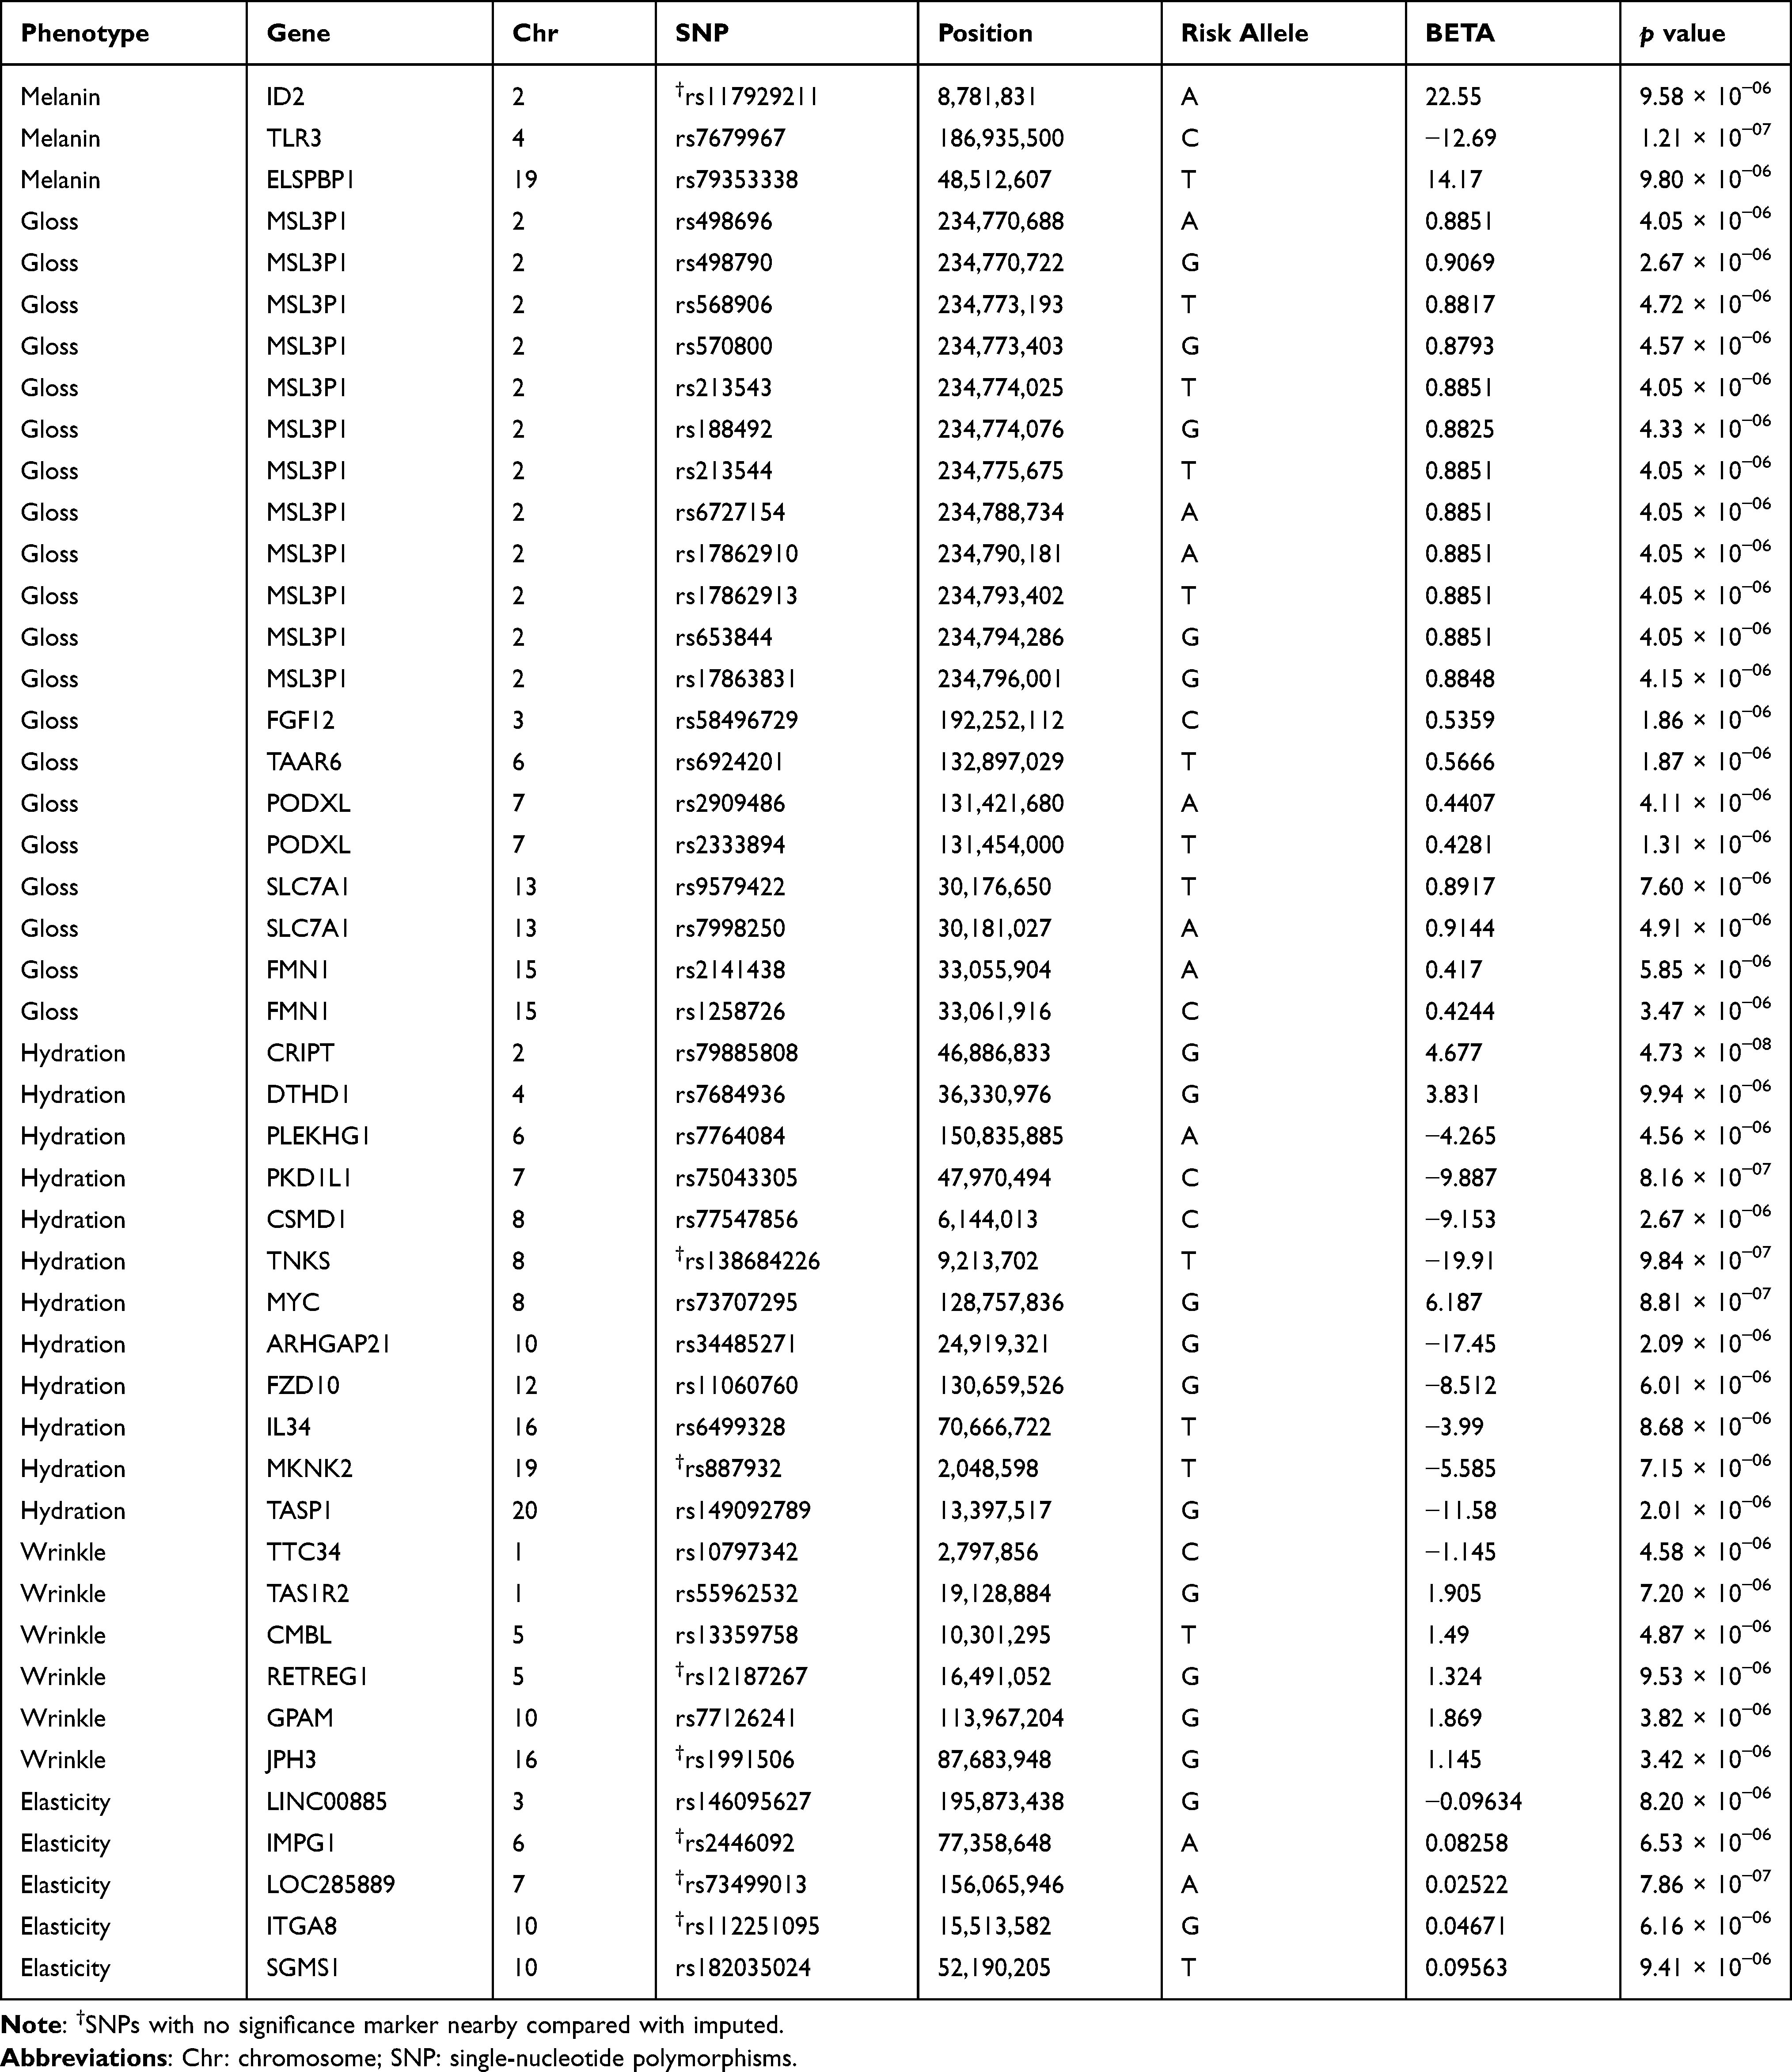 |
Table 2 Single-Nucleotide Polymorphisms Showing the Highest Association Signals for Each Phenotype |
The role of 46 novel skin genes (SNPs), which were shown to be associated with five skin phenotypes in this study, needs further study to determine the underlying mechanism of each phenotype.
Machine Learning
Cross-validation results from the training portion of the model building process showed that the best performing model for all phenotypes was ridge regression. However, models with poor performance differed depending on phenotype. Linear regression (r2 = 0.7982) performed poorer for melanin, when compared with ridge regression (r2 = 0.8586) and linear SVR (r2 = 0.8468). Linear SVR (r2 = 0.5517) performed poorer for gloss, when compared with linear regression (r2 = 0.8643) and ridge regression (r2 = 0.8668). The performance of the three models was similar for hydration and wrinkle. Elasticity showed similar performance with linear regression (r2 = 0.7981) and ridge regression (r2 = 0.8309).
Test results performance was poorer than cross-validation results of the train set. This was confirmed in all phenotypes and models. The differences between the ridge regression results, which showed the best performance, and cross-validation results were 0.2164 for melanin, 0.1402 for gloss, 0.1574 for hydration, 0.1962 for wrinkle, and 0.1232 for elasticity.
Finally, phenotype values predicted using the ridge regression model from the test set and the measured phenotype values were compared in a scatter plot (Figure 3). An optimal result is represented by data falling on the trend line; the closer the data are to the trend line, the closer the predicted value is to the measured value. In our study, the results were close to the trend line, which was confirmed by r2 in Table 3.
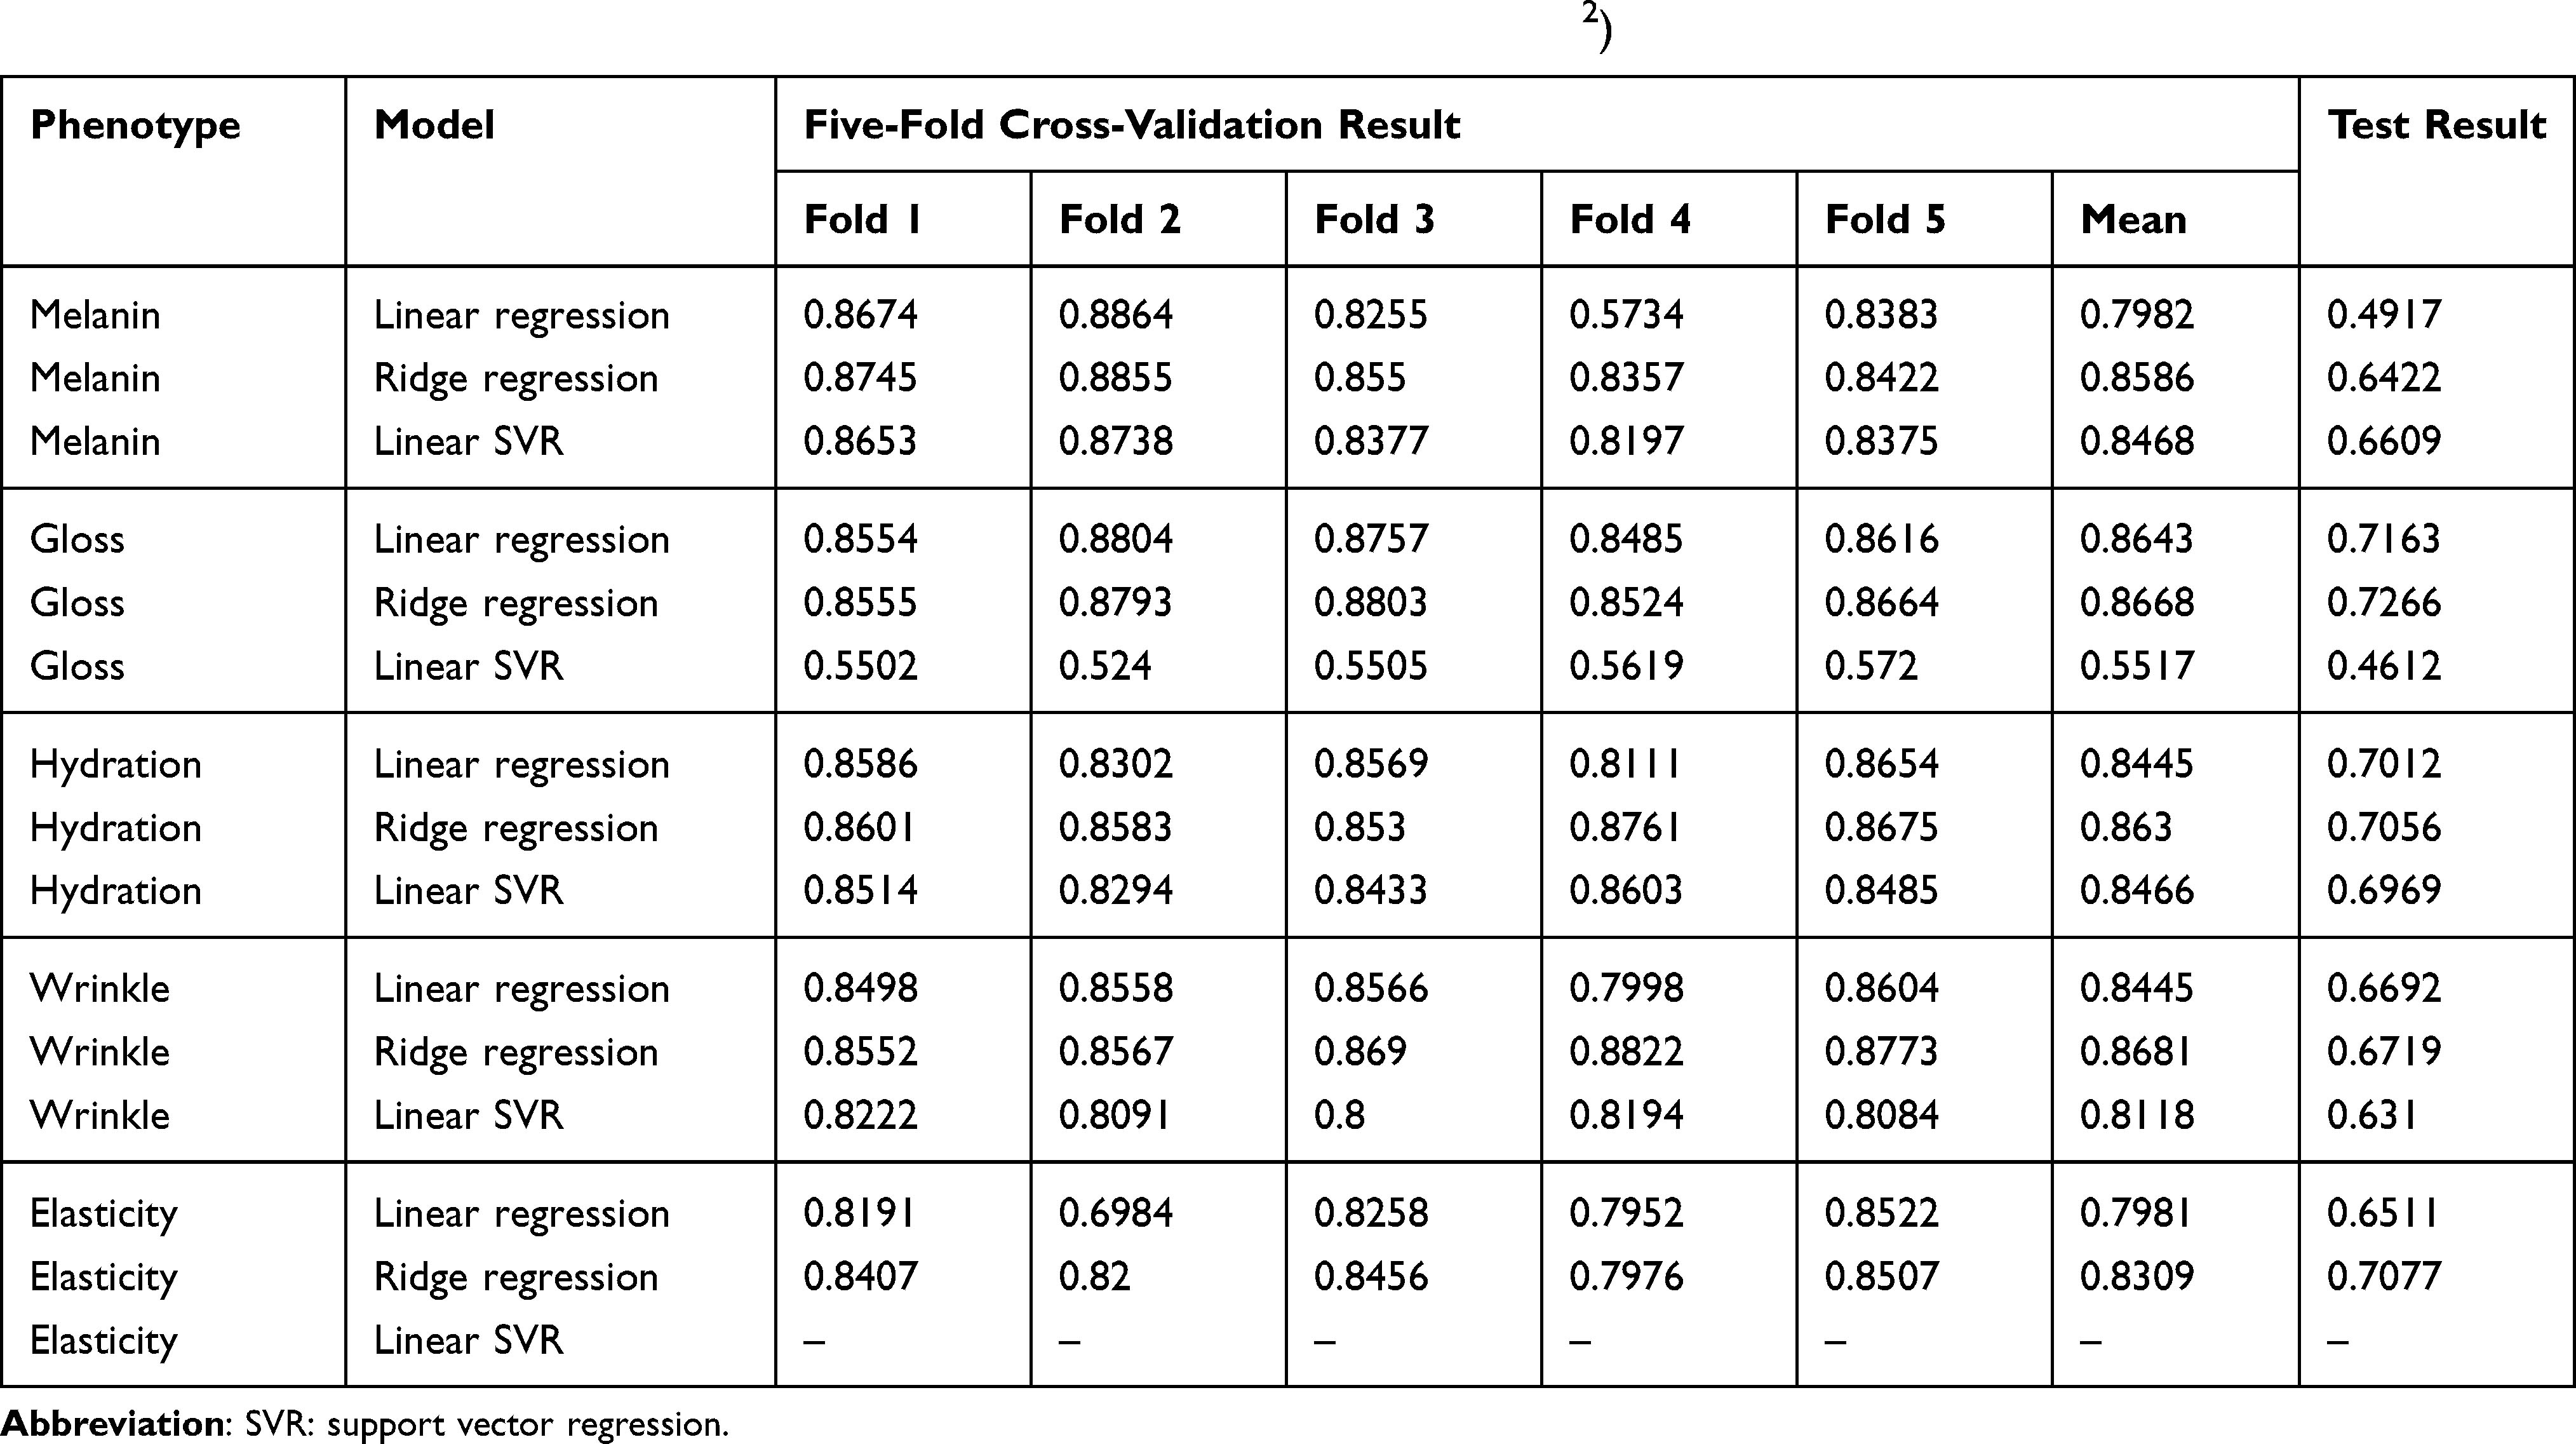 |
Table 3 Summary of Model Performance (Five-Fold Cross-Validation and Test, R2) |
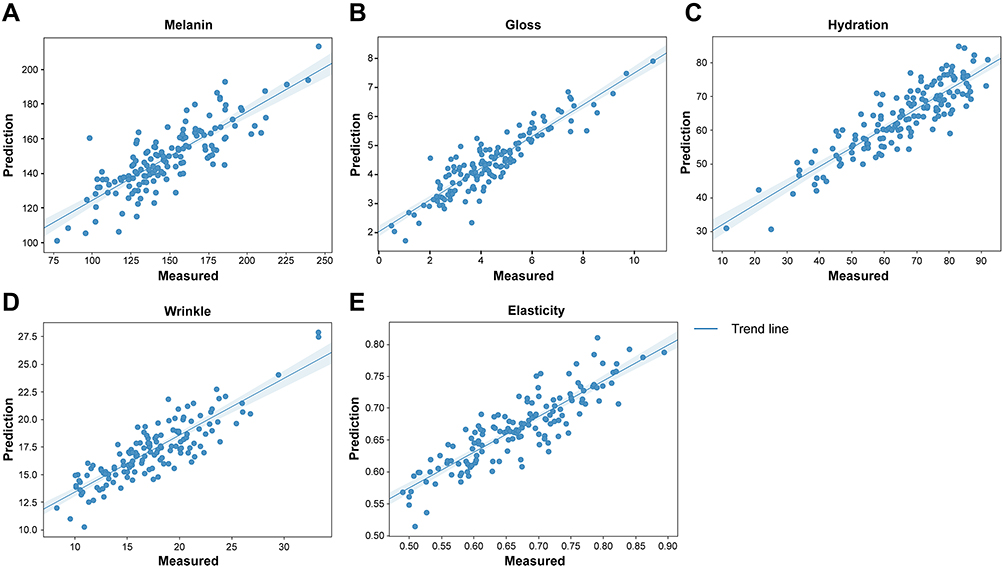 |
Figure 3 Scatter plot of measured values and machine-learning predicted values. Each skin phenotype: (A) Melanin, linear regression showed a best fit of y = 0.51x + 72.95, r2 = 0.6422; (B) Gloss, linear regression showed a best fit of y = 0.54x + 2.02, r2 = 0.8668; (C) Hydration, linear regression showed a best fit of y = 0.57x + 26.24, r2 = 0.8630; (D) Wrinkle, linear regression showed a best fit of y = 0.52x + 8.21, r2 = 0.8681; and (E) Elasticity, linear regression showed a best fit of y = 0.56x + 0.29, r2 = 0.8309. |
Discussion
There are differences in the degree of human skin aging, which depend on individual genes and the environment they encounter. Specifically, studies on clinical skin aging features based on age group in Asians, particularly Koreans, have shown that elasticity decreases between 20 and 40 years, wrinkle depth increases between 40 and 60 years, and age-dependent hyperpigmentation increases occur. Across the world, many cosmetic companies have tried to create products that include a cosmeceutical ingredient to address these aging factors.46–48 However, the aging process can vary because of the exposome (external and lifestyle factors).1,9,10,49 Although skin health and aging are affected by both the genome and exposome, an individual’s intrinsic genes do not change. Thus, predicting the possibility of aging through genetic analysis is an important research goal to prevent or slow aging effects. Previous trends have shown that people have used universal cosmetics and functional health foods in the market, but currently, there is a preference for products specifically suited to an individual’s own characteristics and condition. With the development of various technologies such as GWAS, various analyses such as the identification of unique SNPs and microbiomes of individuals have become easier and customized product development has become possible through machine learning and AI prediction. Most GWAS skin phenotyping studies have focused on Europeans and pigmentation; therefore, such analysis among Koreans (Asian) is needed. We performed a GWAS on five skin phenotypes among 749 Korean adult women and identified SNPs reaching genome-wide significant associations.
A recently reported large-scale GWAS study conducted in a Korean population, several genetic markers on pigmented spots, such as CDKN2B-AS1 and Inc01877, were found, which were different from those identified in other ethnicities.23 In addition, 21 new genes have been discovered, including the already known genes FCRL5 and OCA2 (pigmentation), associated with five cosmetic skin properties: wrinkles, moisture content, pigmentation, oil content, and sensitivity.50
In our study, we found 46 novel genetic markers that were significantly correlated with five skin traits of 749 Korean women. Although our result is based on smaller sample sizes than others reported in recent large-scale GWAS studies, this is considered scientifically significant because it was obtained from approximately 750 subjects and identified new related SNPs unique to Koreans. In the case of genes related to hydration and melanin among the identified candidate SNPs, biological correlations have been found in previous researches. Toll-like receptor 3 (TLR3) is the first sensor for UV exposure, and its activity is associated with barrier recovery. Moreover, TLR3 stimulation promotes melanogenesis, transfer of melanosome in melanocytes, and absorption of melanosomes by keratinocytes.51 The Cub and Sushi multiple domains 1 (CSMD1) gene has been identified as a candidate gene in psoriasis as well as cancer and smoking in numerous human genetics studies.52–54 The Myc gene has been shown to affect the sebocyte differentiation pathway; overexpression of the c-Myc gene results in an increase in sebaceous gland size and number.55 Given that maintaining skin health is associated with parameters such as sebum, acidic pH, and hydration, the Myc gene is thought to interact with skin hydration.56 The biological role of our other novel candidate genes will be examined in future studies.
Because the present findings were not compared with those of other ethnic groups, further research in larger samples is needed to gain complete understanding of genomic characteristics. Nevertheless, to the best of our knowledge, this study is the first to altogether show new candidate genes for five skin traits in a Korean cohort. It may be possible to accurately diagnose or predict an individual’s skin condition with only genotype information. This application model of skin trait prediction potentially can be applied to the development of customized cosmetics that are perfect for individuals based on individual genes. To estimate personal skin condition, DNA analysis and a ridge regression machine-learning model can be used without the need for noninvasive clinical devices. Although our results are specific to Asians, they are valuable in regard to the discovery of SNPs unique to Koreans and for comparisons with previous research results.
Taken together, our study procedures using saliva-derived genetic DNA analysis and machine-learning algorithms can not only predict an individual’s skin characteristics but also replace clinical noninvasive measurements.
Conclusion
All people have different facial characteristics due to various intrinsic and extrinsic factors such as life style patterns and genomic factors. Therefore, recently, some technologies such as skin diagnosis and genetic test related to personalized product that meets individual characteristics have been developed. Given that large-scale GWAS researches are aimed at Europeans, the discovery of unique SNPs in Korean population is meaningful. However, future studies are needed to elucidate the role of genes in determining facial phenotypes. Skin aging is mainly affected by age, environmental factors, and genetic factors. Of these factors, genetic factors of a person do not change; therefore, personalized cosmetics can be developed by exploiting and studying these factors. In summary, skin types of Korean women can be estimated through DNA analysis without a clinical device.
Data Sharing Statement
The datasets used and/or analyzed during the current study are available from the corresponding author (Byoung-Jun Park; [email protected]) upon reasonable request.
Ethics Approval and Informed Consent
The study followed the Declaration of Helsinki and was approved by the Korean public IRB of Korea national institute for bioethics policy (Approval number: 2018-1695-004; P01-201811-23-024). All participants were fully informed about the study process before obtaining written informed consent.
Acknowledgments
We would like to thank Kolmar Korea Co. and Eone Diagnomics Genome Center Co. for their support.
Funding
This study was supported by Kolmar Korea Co. and Eone Diagnomics Genome Center Co. equally.
Disclosure
Hye-Young Yoo, Ji-Eun Woo, Sung-Ha Park, and Byoung-Jun Park are employees of Kolmar Korea Co., Ltd. Ki-Chan Lee, Sunghoon Lee, Joungsu Joo, Jin-Sik Bae, and Hyuk-Jung Kwon are employees of Eone Diagnomics Genome Center Co., Ltd. The authors report no other potential conflicts of interest in this work.
References
1. Cho C, Cho E, Kim N, et al. Age‐related biophysical changes of the epidermal and dermal skin in Korean women. Skin Res Technol. 2019;25(4):504–511. doi:10.1111/srt.12679
2. Zhang Y, Jiang R, Kezele I, et al. A new procedure, free from human assessment, that automatically grades some facial skin signs in men from selfie pictures. Application to changes induced by a severe aerial chronic urban pollution. Int J Cosmet Sci. 2020;42(2):185–197. doi:10.1111/ics.12602
3. Guinot C, Malvy DJ-M, Ambroisine L, et al. Relative contribution of intrinsic vs extrinsic factors to skin aging as determined by a validated skin age score. Arch Dermatol. 2002;138(11):1454–1460. doi:10.1001/archderm.138.11.1454
4. Kim M, Park T, Yun JI, Lim HW, Han NR, Lee ST. Investigation of age-related changes in the skin microbiota of Korean women. Microorganisms. 2020;8(10):1581. doi:10.3390/microorganisms8101581
5. Jang SI, Lee M, Han J, et al. A study of skin characteristics with long‐term sleep restriction in Korean women in their 40s. Skin Res Technol. 2020;26(2):193–199. doi:10.1111/srt.12797
6. Fussell JC, Kelly FJ. Oxidative contribution of air pollution to extrinsic skin ageing. Free Radic Biol Med. 2020;151:111–122. doi:10.1016/j.freeradbiomed.2019.11.038
7. Yan Y, Chen H, Chen L, et al. Consensus of Chinese experts on protection of skin and mucous membrane barrier for health‐care workers fighting against coronavirus disease 2019. Dermatol Ther. 2020;33(4):e13310. doi:10.1111/dth.13310
8. Park SR, Han J, Yeon YM, Kang NY, Kim E. Effect of face mask on skin characteristics changes during the COVID-19 pandemic. Skin Res Technol. 2021;27(4):554–559. doi:10.1111/srt.12983
9. Hasham R, Choi HK, Sarmidi MR, Park CS. Protective effects of a Ficus deltoidea (Mas cotek) extract against UVB-induced photoageing in skin cells. Biotechnol Bioprocess Eng. 2013;18(1):185–193. doi:10.1007/s12257-012-0353-2
10. Park YM, Park SN. Inhibitory effect of lupeol on MMPs expression using aged fibroblast through repeated UVA irradiation. Photochem Photobiol. 2019;95(2):587–594. doi:10.1111/php.13022
11. Kim K, Xuan S, Park S. Licoricidin, an isoflavonoid isolated from Glycyrrhiza uralensis Fisher, prevents UVA‐induced photoaging of human dermal fibroblasts. Int J Cosmet Sci. 2017;39(2):133–140. doi:10.1111/ics.12357
12. Chu CH, Wang IJ. Mass customized design of cosmetic masks using three-dimensional parametric human face models constructed from anthropometric data. J Comput Inf Sci Eng. 2018;18(3):034501. doi:10.1115/1.4039335
13. Gustafson E, Pacheco J, Wehbe F, Silverberg J, Thompson W. A machine learning algorithm for identifying atopic dermatitis in adults from electronic health records.
14. Chang ALS, Atzmon G, Bergman A, et al. Identification of genes promoting skin youthfulness by genome-wide association study. J Invest Dermatol. 2014;134(3):651–657. doi:10.1038/jid.2013.381
15. Arabfard M, Ohadi M, Tabar VR, Delbari A, Kavousi K. Genome-wide prediction and prioritization of human aging genes by data fusion: a machine learning approach. BMC Genomics. 2019;20(1):832. doi:10.1186/s12864-019-6140-0
16. Auton A, Brooks LD, Durbin RM, et al.; 1000 Genomes Project Consortium. A global reference for human genetic variation. Nature. 2015;526(7571):68–74. doi:10.1038/nature15393.
17. Visscher PM, Brown MA, McCarthy MI, Yang JJ. Five years of GWAS discovery. Am J Hum Genet. 2012;90(1):7–24. doi:10.1016/j.ajhg.2011.11.029
18. Visscher PM, Wray NR, Zhang Q, et al. 10 years of GWAS discovery: biology, function, and translation. Am J Hum Genet. 2017;101(1):5–22. doi:10.1016/j.ajhg.2017.06.005
19. Peng F, Zhu G, Hysi PG, et al. Genome-wide association studies identify multiple genetic loci influencing eyebrow color variation in Europeans. J Invest Dermatol. 2019:139:1601–1605.
20. Law MH, Medland SE, Zhu G, et al. Genome-wide association shows that pigmentation genes play a role in skin aging. J Invest Dermatol. 2017;137(9):1887–1894. doi:10.1016/j.jid.2017.04.026
21. Visconti A, Duffy DL, Liu F, et al. Genome-wide association study in 176,678 Europeans reveals genetic loci for tanning response to sun exposure. Nat Commun. 2018;9(1):1–7. doi:10.1038/s41467-018-04086-y
22. Endo C, Johnson TA, Morino R, et al. Genome-wide association study in Japanese females identifies fifteen novel skin-related trait associations. Sci Rep. 2018;8(1):1–22. doi:10.1038/s41598-018-27145-2
23. Shin JG, Leem S, Kim B, et al. GWAS analysis of 17,019 Korean women identifies the variants associated with facial pigmented spots. J Invest Dermatol. 2021;141(3):555–562. doi:10.1016/j.jid.2020.08.007
24. Porcu E, Sanna S, Fuchsberger C, Fritsche LG. Genotype imputation in genome‐wide association studies. Curr Protoc Hum Genet. 2013;Chapter 1:
25. Masoudi-Sobhanzadeh Y, Motieghader H, Masoudi-Nejad A. FeatureSelect: a software for feature selection based on machine learning approaches. BMC Bioinformat. 2019;20(1):1–17. doi:10.1186/s12859-019-2754-0
26. Kruppa J, Ziegler A, König IR. Risk estimation and risk prediction using machine-learning methods. Hum Genet. 2012;131(10):1639–1654. doi:10.1007/s00439-012-1194-y
27. Dasgupta A, Sun YV, König IR, Bailey‐Wilson JE, Malley JD. Brief review of regression‐based and machine learning methods in genetic epidemiology: the Genetic Analysis Workshop 17 experience. Genet Epidemiol. 2011;35(Suppl 1):S5–S11. doi:10.1002/gepi.20642
28. Singh G, Samavedham L. Unsupervised learning based feature extraction for differential diagnosis of neurodegenerative diseases: a case study on early-stage diagnosis of Parkinson disease. J Neurosci Methods. 2015;256:30–40. doi:10.1016/j.jneumeth.2015.08.011
29. Okser S, Pahikkala T, Airola A, Salakoski T, Ripatti S, Aittokallio T. Regularized machine learning in the genetic prediction of complex traits. PLoS Genet. 2014;10(11):e1004754. doi:10.1371/journal.pgen.1004754
30. Abraham G, Inouye M. Genomic risk prediction of complex human disease and its clinical application. Curr Opin Genet Dev. 2015;33:10–16. doi:10.1016/j.gde.2015.06.005
31. Matias AR, Ferreira M, Costa P, Neto P. Skin colour, skin redness and melanin biometric measurements: comparison study between Antera® 3D, Mexameter® and Colorimeter®. Skin Res Technol. 2015;21(3):346–362. doi:10.1111/srt.12199
32. Igarashi K, Maeda K. Research on hair bleach that causes less hair damage and smells less pungent than ammonium hydroxide. Cosmetics. 2018;5(2):39. doi:10.3390/cosmetics5020039
33. Barel AO, Clarys P. In vitro calibration of the capacitance method (Corneometer CM 825) and conductance method (Skicon-200) for the evaluation of the hydration state of the skin. Skin Res Technol. 1997;3(2):107–113. doi:10.1111/j.1600-0846.1997.tb00171.x
34. Kim H, Kim M, Quan Y, et al. Novel anti-wrinkle effect of cosmeceutical product with new retinyl retinoate microsphere using biodegradable polymer. Skin Res Technol. 2012;18(1):70–76. doi:10.1111/j.1600-0846.2011.00533.x
35. Kim KY, Lee EJ, Whang WK, Park CH. In vitro and in vivo anti-aging effects of compounds isolated from Artemisia iwayomogi. J Anal Sci Technol. 2019;10(1):35. doi:10.1186/s40543-019-0193-1
36. Akhtar N, Zaman SU, Khan BA, Amir MN, Ebrahimzadeh MA. Calendula extract: effects on mechanical parameters of human skin. Acta Pol Pharm. 2011;68(5):693–701.
37. Abecasis GR, Auton A. 1000 Genomes Project Consortium. An integrated map of genetic variation from 1092 human genomes. Nature. 2012;491(7422):56–65.
38. Karczewski KJ, Francioli LC, Tiao G, et al. The mutational constraint spectrum quantified from variation in 141,456 humans. Nature. 2020;581(7809):434–443. doi:10.1038/s41586-020-2308-7
39. De Vries PS, Sabater-Lleal M, Chasman DI, et al. Comparison of HapMap and 1000 genomes reference panels in a large-scale genome-wide association study. PLoS One. 2017;12(1):e0167742. doi:10.1371/journal.pone.0167742
40. Delaneau O, Marchini J, Zagury JF. A linear complexity phasing method for thousands of genomes. Nat Methods. 2011;9(2):179–181. doi:10.1038/nmeth.1785
41. Delaneau O, Zagury JF, Marchini J. Improved whole-chromosome phasing for disease and population genetic studies. Nat Methods. 2013;10(1):5–6. doi:10.1038/nmeth.2307
42. Van Leeuwen EM, Kanterakis A, Deelen P, et al. Population-specific genotype imputations using minimac or IMPUTE2. Nat Protoc. 2015;10(9):1285–1296. doi:10.1038/nprot.2015.077
43. Lunt M. Introduction to statistical modelling: linear regression. Rheumatology. 2015;54(7):1137–1140. doi:10.1093/rheumatology/ket146
44. Hoerl AE, Kennard RW. Ridge regression: biased estimation for nonorthogonal problems. Technometrics. 1970;12(1):55–67. doi:10.1080/00401706.1970.10488634
45. Brereton RG, Lloyd GR. Support vector machines for classification and regression. Analyst. 2010;135(2):230–267. doi:10.1039/B918972F
46. Jeong YM, Ha JH, Noh GY, Park SN. Inhibitory effects of mung bean (Vigna radiata L.) seed and sprout extracts on melanogenesis. Food Sci Biotechnol. 2016;25(2):567–573. doi:10.1007/s10068-016-0079-6
47. Xuan SH, Park YM, Ha JH, Jeong YJ, Park SN. The effect of dehydroglyasperin C on UVB–mediated MMPs expression in human HaCaT cells. Pharmacol Rep. 2017;69(6):1224–1231. doi:10.1016/j.pharep.2017.05.012
48. Choi HK, Cho YH, Lee EO, Kim JW, Park CS. Phytosphingosine enhances moisture level in human skin barrier through stimulation of the filaggrin biosynthesis and degradation leading to NMF formation. Arch Dermatol Res. 2017;309(10):795–803. doi:10.1007/s00403-017-1782-8
49. Nam GW, Baek JH, Koh JS, Hwang JK. The seasonal variation in skin hydration, sebum, scaliness, brightness and elasticity in Korean females. Skin Res Technol. 2015;21(1):1–8. doi:10.1111/srt.12145
50. Kim JO, Park B, Choi JY, et al. Identification of the underlying genetic factors of skin aging in a Korean population study. J Cosmet Sci. 2021;72(1):63–80.
51. Park M, Woo SY, Cho KA, Cho MS, Lee KH. PD-L1 produced by HaCaT cells under polyinosinic-polycytidylic acid stimulation inhibits melanin production by B16F10 cells. PLoS One. 2020;15(5):e0233448. doi:10.1371/journal.pone.0233448
52. Abdel-Rahman SM, Preuett BL. Genetic predictors of susceptibility to cutaneous fungal infections: a pilot genome wide association study to refine a candidate gene search. J Dermatol Sci. 2012;67(2):147–152. doi:10.1016/j.jdermsci.2012.05.003
53. Li M, Chen Y, Yao J, et al. Genome-wide association study of smoking behavior traits in a Chinese Han population. Front Psychiatry. 2020;11:564239. doi:10.3389/fpsyt.2020.564239
54. Distler MG, Opal MD, Dulawa SC, Palmer AA. Assessment of behaviors modeling aspects of schizophrenia in Csmd1 mutant mice. PLoS One. 2012;7(12):e51235. doi:10.1371/journal.pone.0051235
55. Smith K, Thiboutot D. Thematic review series: skin lipids. Sebaceous gland lipids: friend or foe? J Lipid Res. 2008;49(2):271–281. doi:10.1194/jlr.R700015-JLR200
56. Lim S, Shin J, Cho Y, Kim KP. Dietary patterns associated with sebum content, skin hydration and pH, and their sex-dependent differences in healthy Korean adults. Nutrients. 2019;11(3):619. doi:10.3390/nu11030619
 © 2022 The Author(s). This work is published and licensed by Dove Medical Press Limited. The full terms of this license are available at https://www.dovepress.com/terms.php and incorporate the Creative Commons Attribution - Non Commercial (unported, v3.0) License.
By accessing the work you hereby accept the Terms. Non-commercial uses of the work are permitted without any further permission from Dove Medical Press Limited, provided the work is properly attributed. For permission for commercial use of this work, please see paragraphs 4.2 and 5 of our Terms.
© 2022 The Author(s). This work is published and licensed by Dove Medical Press Limited. The full terms of this license are available at https://www.dovepress.com/terms.php and incorporate the Creative Commons Attribution - Non Commercial (unported, v3.0) License.
By accessing the work you hereby accept the Terms. Non-commercial uses of the work are permitted without any further permission from Dove Medical Press Limited, provided the work is properly attributed. For permission for commercial use of this work, please see paragraphs 4.2 and 5 of our Terms.