")
Back to Journals » OncoTargets and Therapy » Volume 14
A Functional Food Inhibits Azoxymethane/Dextran Sulfate Sodium-Induced Inflammatory Colorectal Cancer in Mice
Authors Zhang J, Chen Z, Lu Y, Tu D, Zou F, Lin S, Yu W, Miao M, Shi H
Received 1 October 2020
Accepted for publication 16 February 2021
Published 26 February 2021 Volume 2021:14 Pages 1465—1477
DOI https://doi.org/10.2147/OTT.S283465
Checked for plagiarism Yes
Review by Single anonymous peer review
Peer reviewer comments 2
Editor who approved publication: Prof. Dr. Geoffrey Pietersz
Jie Zhang,1,* Zhewen Chen,2,* Yanwen Lu,1 Daoyuan Tu,3 Fengqian Zou,4 Shouwen Lin,5 Weinan Yu,1 Mingyong Miao,6 Hanping Shi7
1Department of Endocrinology, The Affiliated Huai’an Hospital of Xuzhou Medical University, Huai’an, 223002, Jiangsu, People’s Republic of China; 2Department of Nutrition, Zhejiang Provincial People’s Hospital, Hangzhou, 310000, Zhejiang, People’s Republic of China; 3Department of Gastrointestinal Surgery, The Affiliated Huai’an Hospital of Xuzhou Medical University, Huai’an, 223002, Jiangsu, People’s Republic of China; 4Department of Academic, Yantai Briteley Institute of Life Sciences, Yantai, 264003, Shandong, People’s Republic of China; 5Center of Research and Development, Yantai Briteley Institute of Life Sciences, Yantai, 264003, Shandong, People’s Republic of China; 6Department of Biochemistry and Molecular Biology, The Naval Medical University, Shanghai, 200433, People’s Republic of China; 7Department of Gastrointestinal Surgery, Department of Clinical Nutrition, Beijing Shijitan Hospital, Capital Medical University, Beijing, 100038, People’s Republic of China
*These authors contributed equally to this work
Correspondence: Hanping Shi
Department of Gastrointestinal Surgery, Department of Clinical Nutrition, Beijing Shijitan Hospital, Capital Medical University, Beijing, 100038, People’s Republic of China
Email [email protected]
Mingyong Miao
Department of Biochemistry and Molecular Biology, The Naval Medical University, Shanghai, 200433, People’s Republic of China
Email [email protected]
Purpose: This study aimed to investigate the potential antitumor effects and mechanisms underlying the action of a functional food containing 55 different natural food ingredients.
Materials and Methods: Azoxymethane/dextran sulfate sodium was used to establish a mouse model of colorectal cancer. Serum levels of cytokines, diamine oxidase, D-lactate, and endotoxin were measured using enzyme-linked immunosorbent assays. Immune cells from the mouse spleen and tumor tissue were analyzed by flow cytometry. Finally, 16S rRNA gene sequencing and liquid chromatography–mass spectrometry were used to study the fecal microbiota and microbial metabolites, respectively.
Results: The tumor growth was significantly lower in the FFD group than in the model group. The intestinal barrier function, fat mass, and lean body mass were significantly improved in the FFD group compared with the model group. The levels of interleukin-6 and tumor necrosis factor-α were significantly lower in the FFD group, while the proportions of total T cells, CD3+CD4+, CD3+CD8+, and interferon-γ-producing CD4+ T cells were significantly higher. Analysis of the diversity of the gut microbiota identified 60 differential bacterial genera between the FFD and model groups, with lower abundances of Desulfovibrio and unclassified Ruminococcaceae and higher abundances of the beneficial bacterial genera Bacteroides and Parasutterella in the FFD group. The fecal metabolite analysis revealed 635 differential metabolites between the FFD and model groups, with lower levels of deuteroporphyrin IX and citrulline and higher levels of acetic acid and ascorbic acid in the FFD group.
Conclusion: Our results demonstrate that the functional food tested can inhibit the growth of colorectal cancer. This effect may be due to the ability of this food to improve nutritional status, enhance intestinal barrier function, and regulate the tumor microenvironment via changes in the intestinal microbiota and metabolites.
Keywords: functional food, tumor microenvironment, cancer nutrition, colorectal cancer, gut microbiota, metabolite
Introduction
Colorectal cancer is one of the leading causes of cancer-related death worldwide.1,2 Although the risk of death has been declining in developed countries, largely due to the implementation of regular screening, the incidence of colorectal cancer is still increasing in many other countries, such as China.3 The mortality rate from colorectal cancer in China is projected to be 8.6 per 100,000 in 2020.4 Thus, developing effective tumor-inhibiting agents is an immediate medical need. Much attention has been paid to the identification of natural antitumor compounds in food,5,6 as it has been postulated that the intake of antioxidant-rich food can reduce the risk of cancer.7,8 For example, onion juice can strongly inhibit adenosine diphosphate-induced platelet coagulation, as well as thrombin and arachidonic acid formation, in humans.9
Emerging evidence indicates that microbiota plays a regulatory role in the host homeostasis via modulation of the gut immune system.12–14 Studies have shown that aberrant interactions between the host and gut microbiome directly lead to the development of many diseases, including colorectal cancer.15–17 Therefore, regulating the intestinal microbiota may represent an effective way to treat colorectal cancer, although this hypothesis warrants extensive evaluation.18 In this regard, high-throughput sequencing is an accurate and powerful approach to obtaining detailed information on the microbiome,10 as it can overcome the limitations of traditional culture strategies, particularly for unculturable gut microorganisms. Furthermore, metabolomics represents an unprecedented approach for detecting often subtle differences in a broad range of metabolites in tissues or biofluids.11
A functional food is a formula-based food specially processed and configured to meet the special nutritional or dietary needs of people who have difficulty eating, digestive and absorption disorders, metabolic disorders, or specific disease states. This kind of food plays an important role in maintaining the physiological function and physical recovery of people with various diseases. In recent years, there have been many new advances in the study of food and nutrition and cancer prevention. In addition to traditional nutrients, certain functional ingredients in foods have been shown to play an important role in the prevention and treatment of cancers. Thus, developing antitumor functional foods has been suggested as a non-pharmaceutical approach to the prevention and treatment of cancer. In the present study, we examined the antitumor efficacy of a functional food and its potential mechanisms of action using a mouse model of colorectal cancer. The information obtained in this study may support the use of this novel functional food for the treatment of colorectal cancer.
Materials and Methods
Composition of the Functional Food
The functional food used in the present study was provided by Yantai Wushen Food Technology Co., Ltd. (Yantai, China). The fat, protein, and fiber contents were 12.7%, 22.1%, and 21.7%, respectively. The food contained 55 different natural food ingredients, including meats, plants, vegetables, and cereals and was produced without additives, extraction, and synthesis. The food was enriched with active immunoregulatory, anti-inflammatory, and antioxidant substances (Supplementary Tables S1 and S2). The proportions of nutrients in this food met the formulation requirements for foods for special medical purposes (FSMPs) for cancer patients.19 A previous study has demonstrated that many of the ingredients in this functional food are rich in antioxidants and exhibit antitumor activity, such as the traditional Chinese herb laminaria.20 Composition analysis also revealed that the energy, protein, fat, vitamins, and other nutrient components in this functional food conformed to the dietary reference intake of Chinese residents, and the amino acid and fatty acid compositions were adequate. This food provides high-quality protein and immune nutrients to adjust the fat-to-carbohydrate ratio, which aligns with tumor-specific principles and medical requirements (REFs).
Mouse Model of Azoxymethane/Dextran Sulfate Sodium (AOM/DSS)-Induced Colorectal Cancer
Male, 4–5-week-old BALB/c mice (15–20 g) were purchased from Changzhou Cavens Laboratory Animal Technology Co., Ltd. (Changzhou, China). All animal studies were carried out in accordance with the Guidelines for the Care and Use of Laboratory Animals issued by the National Institutes of Health and approved by the Animal Ethics Committee of the Huai’an Hospital, affiliated with Xuzhou Medical University (Huai’an, China) (Approval No. AEC 2019-HA07).
The mice were randomized into a control, model, and FFD groups (n = 20 each). To establish the AOM/DSS model, the mice in the model and FFD groups were injected intraperitoneally with an AOM (Sigma–Aldrich, St. Louis, MO, USA) working solution (10 mg/kg body weight) on day 0, while those in the control group were treated with sterile isotonic saline. On day 7, the model and FFD mice were treated with 2.5% (w/v) DSS (Sigma–Aldrich) for 7 consecutive days, while the control group received water. Consecutive DSS treatments were repeated for four cycles every 14 days.21 The mice in the control and model groups consumed a standard diet, while those in the FFD group consumed a diet supplemented with the functional food. The compositions of the standard and FFD diets are shown in Supplementary Table S3. Mouse body weights and food intake were measured and recorded every 3 days. The food intake was based on the average amount of food each mouse consumed over 3 days.
Another 60 mice, of which 40 were treated with AOM/DSS according to the above-described procedure, were selected for a survival analysis. The mice in each group were monitored for 8 weeks for survival. Only 15 mice per group were included in the final time point because 10 of the 40 AOM/DSS-treated mice were sacrificed for ethical reasons.
Analysis of General Nutritional Status
Ten mice from each group were randomly selected for the measurement of the hind leg muscle circumference. Serum albumin levels were quantified in the same mice using an enzyme-linked immunosorbent assay (ELISA) kit (R&D Systems Europe, Abingdon, UK) according to the manufacturer’s instructions. Meanwhile, five mice from each group were randomly selected for a body composition analysis using the MesoQMR23-060H nuclear magnetic resonance analyzer (Suzhou Niumag Analytical Instrument Corporation, Suzhou, China) with the following parameters: coil diameter, 60 mm; magnet strength, 0.5 T; resonance frequency, 21 MHz; and magnet temperature, 32 ± 0.01 °C.
Tumor Histopathology
After the last cycle of AOM/DSS treatment, all mice were sacrificed by cervical dislocation. The colon between the ileocecum and the rectum was washed with phosphate-buffered saline (PBS) and opened longitudinally. Tumor tissues were fixed with 10% (v/v) neutral formalin, embedded in paraffin, and sectioned into 5-mm slices. The tumor growth was examined microscopically (200×) with hematoxylin and eosin (H&E) staining.
Cytokine Measurements
An ELISA kit (R&D Systems Europe) was used to determine the serum levels of inflammatory cytokines, such as tumor necrosis factor-α (TNF-α), interferon-γ (IFN-γ), interleukin (IL)-2, IL-4, IL-6, and IL-10, according to the manufacturer’s protocol.
Intestinal Barrier Function Tests
Serum D-lactic acid was quantified at the end of the study using a commercial AmpliteTM fluorimetric D-lactate assay kit (AAT Bioquest, Hamburg, Germany). A diamine oxidase (DAO) assay kit (Nanjing Jiancheng Bioengineering Institute, Nanjing, China) was used for the measurement of DAO activity. Endotoxin was quantified using the PierceTM chromogenic endotoxin quantitative kit (Thermo Fisher Scientific, Waltham, MA, USA).
Immune Cell Profiling
Tumor and spleen tissues were collected for lymphocyte isolation. The colon was cut longitudinally, washed with PBS, and 1–2 cm of colon tissue surrounding the tumor was excised. After removing epithelial cells and the mucus with solution A [50 mL of PBS, 3 mL of 0.5 mM EDTA, 500 μL of 1 M 4-(2-hydroxyethyl)-1-piperazineethanesulfonic acid (HEPES), and 25 μL of 2 M dithiothreitol (DTT)], the colon tissue was transferred to a new centrifuge tube. After addition of solution B (50 mL of PBS, 3 mL of 0.5 mM EDTA, and 500 μL of 1 M HEPES), the colon tissue was digested with 1 mg/mL collagenase VIII (Sigma–Aldrich), followed by filtration and resuspension of the cell precipitate in a 40% Percoll solution. Next, the cell precipitate was washed with 80% Percoll and resuspended in PBS to obtain a single-cell suspension. The cells were incubated with antibodies (Supplementary Table S4) and stained with propidium iodide. Flow cytometry was performed using an LSRFortessa X-20 flow cytometer (BD Biosciences, Franklin Lakes, NJ, USA). Single-cell suspensions from spleen tissue were prepared and analyzed using the same method. CD4+CD25+FOXP3+ and other cell populations were characterized using an eBioscience kit (eBioscience, San Diego, CA, USA).
16S rRNA Gene Sequencing
Total genomic DNA was extracted from fecal samples (50 mg) of mice using the DNeasy PowerSoil kit (Qiagen, Germantown, MD, USA) and then quantified by agarose gel electrophoresis. The V3–V4 hypervariable region of the 16S rRNA gene was amplified using the 343F (5′-TACGGRAGGCAGCAG-3′) and 798R (5′-AGGGTATCTAATCCT-3′) primers as described previously.22 Polymerase chain reaction (PCR) products were detected by electrophoresis, purified using magnetic beads, and used as a template in a second round of PCR. The concentrations of the PCR products were measured using the Qubit dsDNA assay kit (Life Technologies, Carlsbad, CA, USA). Samples were mixed according to their concentrations, and PCR products were sequenced using a computer program.
The sequencing data were preprocessed to generate high-quality sequences, and the Vsearch software was used to combine sequences according to their similarity. Sequences with a similarity ≥97% were grouped into the same operational taxonomic unit (OTU).23 The QIIME (Quantitative Insights Into Microbial Ecology) software was used to select representative sequences of each OTU, which were compared to sequences in a database.24
Detection of Intestinal Microbiota Metabolites
Metabolites were detected in fecal samples from the three groups of mice (n = 8) by liquid chromatography coupled with mass spectrometry (LC/MS). A fecal sample (10 mg) was mixed with 10 μL of an internal standard (2-chloro-L-phenylalanine) in methanol (0.3 mg/mL) and 300 μL of an extraction solvent (methanol/water 4:1, v/v). The extract was centrifuged at 13,000 rpm for 10 min at 4 °C, and the supernatant was dried. A total of 200 μL of methanol/water (1:4, v/v) was added, and the mixture was vortexed for 30 s. Chromatographic separation was conducted using an ultra-performance LC system (Waters Corporation, Milford, MA, USA) with an ACQUITY BEH C18 reversed-phase column (100 mm × 2.1 mm, 1.7 μm) at a constant column temperature of 35 °C.
Blood was collected from the abdominal aorta of mice. Subsequently, serum was separated by centrifugation (13,000 rpm, 10 min, 4 °C) and stored at −80 °C until use. Metabolites were detected in the serum samples from the three groups (n = 8) by LC/MS (Shanghai LuMing Biotechnology Co., Ltd) using the same method.
The original LC/MS data were collected using the UNIFI 1.8.1 software and then processed using the Progenesis QI software (Waters Corporation) with the following parameters: precursor tolerance, 5 ppm; fragment tolerance, 10 ppm; and retention time (RT) tolerance, 0.02 min. The Progenesis QI analysis provided a matrix containing peak picking, peak grouping, RT correction, second peak grouping, and annotation of isotopes for every sample. An Excel file was obtained with three-dimensional data sets, containing the m/z, peak RT, and peak intensities, and an RT–m/z pair was used as an identifier for each ion. Any peak with a missing value (ion intensity = 0) in more than 50% of samples was removed. The internal standard was used for quality control of the data (reproducibility).
Positive and negative data were combined and imported into the R ropls package. Principal component analysis and orthogonal partial least-squares discriminant analysis (OPLS-DA) were carried out to visualize the metabolic alterations among the experimental groups after mean centering and Pareto variance scaling, respectively. The 95% confidence interval of the modeled variation was defined by the Hotelling’s T2 region. The overall contribution of each variable to the OPLS-DA model was ranked based on the variable importance in the projection (VIP), and variables with VIP > 1 were considered relevant for group discrimination. Differential metabolites were screened based on the combination of a statistically significant threshold of VIP values obtained from the OPLS-DA model and p-values from a two-tailed Student’s t-test on the normalized peak areas, where metabolites with VIP > 1 and p < 0.05 were considered differential metabolites. In addition, the Kyoto Encyclopedia of Genes and Genomes database (https://www.genome.jp/kegg/pathway.html) was used to perform enrichment analysis on the screened differential metabolites. The p-value was adjusted for multiple tests (Benjamini–Hochberg), and p < 0.05 was considered to be statistically significant.
Statistical Analysis
The IBM SPSS Statistics v19 software (IBM Corp., Armonk, NY, USA) and GraphPad Prism version 7.0 for Windows (GraphPad Software, La Jolla, CA, USA) were employed for statistical analysis. The Kaplan–Meier method and a Log rank test were applied for the analysis of mouse survival. A two-tailed Student’s t-test was used to evaluate differences between two groups. A one-way analysis of variance was used to evaluate differences among the three groups. Differences with p values < 0.05 were considered statistically significant.
Results
Mouse Body Weights and Food Intake
The mouse body weights in the FFD and model groups decreased during the experiment. The average body weight was slightly higher in the FFD group than in the model group, but the difference was not statistically significant. The average body weights in the control (20.67 ± 1.56 g), model (16.02 ± 1.03 g), and FFD (18.16 ± 1.68 g) groups differed significantly at the end of the experiment (F = 11.003, p < 0.0001). The average body weights in the FFD and model groups were significantly lower (p = 0.006) than that in the control group. The food intake in the model and FFD groups slowly decreased with the increase in the tumor growth but was consistently higher in the FFD group than in the model group (Figure 1A).
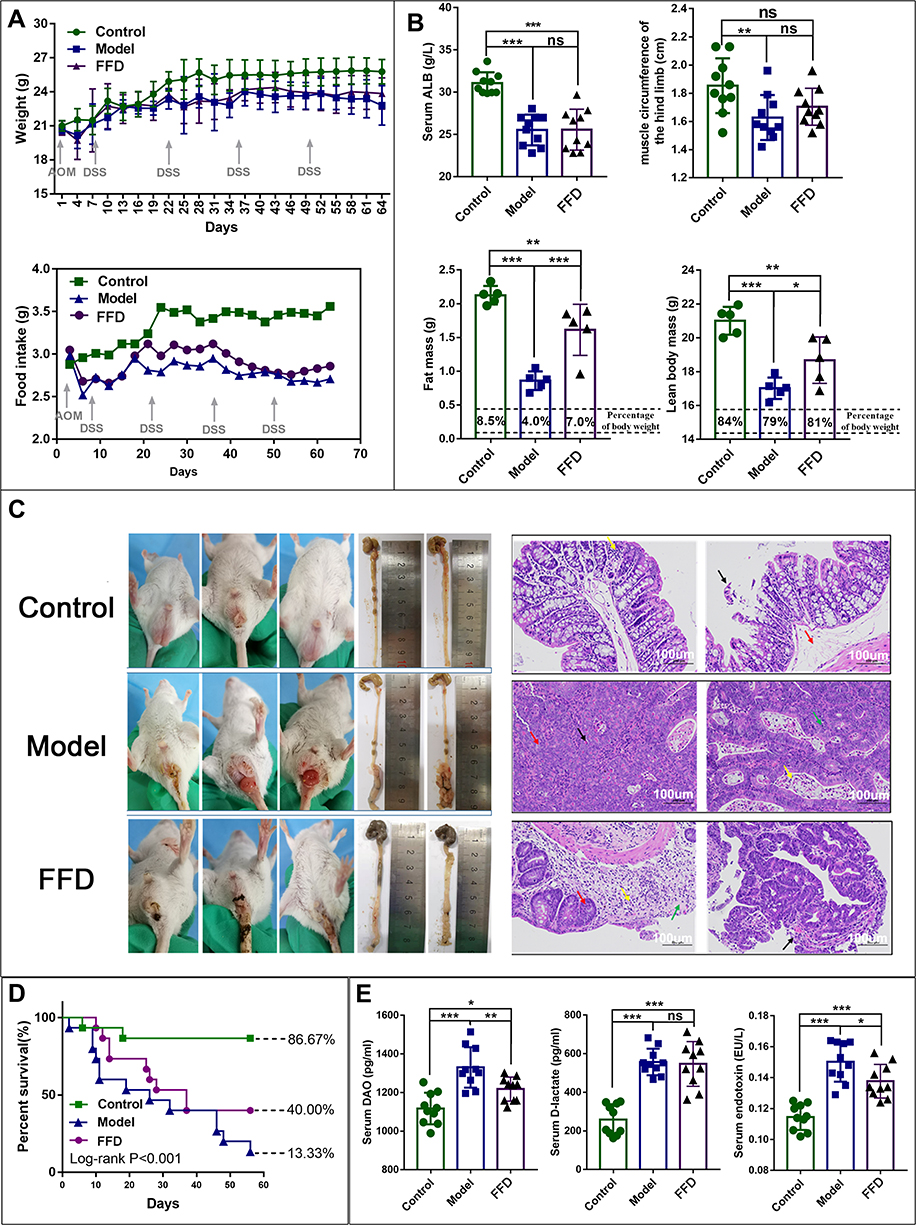 |
Figure 1 (A) The body weight and food intake in the mice in the control, model, and functional food (FFD) groups over time. (B) The general nutritional status in the control, model, and FFD groups, including the serum albumin level, hind limb muscle circumference, fat mass, and lean body mass are also shown (*p < 0.05; **p < 0.01; ***p < 0.001) (C) Tumor tissues from mice in the control, AOM/DSS tumor-bearing model, and FFD groups, and the tumor histopathology with hematoxylin and eosin (H&E) staining. (D) The results of a survival analysis of mice in the control, AOM/DSS tumor-bearing model, and FFD groups. (E) The serum levels of diamine oxidase (DAO), D-lactate, and endotoxin in mice in the control, AOM/DSS tumor-bearing model, and FFD groups. (*p < 0.05; **p < 0.01; ***p < 0.001). Abbreviation: ns, not significant. |
General Nutritional Status
The serum albumin levels and hind leg muscle circumferences in the model group were significantly lower (p < 0.001 and p < 0.01, respectively) than those in the control group. The serum albumin levels in the FFD group were also significantly lower than those in the control group (p < 0.001). Neither of these nutritional indicators differed significantly between the FFD and model groups. In addition, the lean body mass and fat mass in the model and FFD groups were significantly lower than those in the control group (p < 0.01), while both indicators were significantly higher in the FFD group than in the model group (p < 0.05 and p < 0.001, respectively; Figure 1B).
Colon Tumor Growth and Histopathological Analysis of Colon Tumor Tissue
The mice in the control group displayed clean anuses and no edema, loose stool, or blood in the stool. By contrast, the mice in the model group showed loose stools, blood in the stool, and their colons were obviously swollen with hyperemia. The tumor growth in the lower part of the colon covered the whole intestine, which seriously affected mouse defecation. The mice in the FFD group also had loose stools and blood in the stool but did not have an obvious edema or prolapse. The tumor growth was observed in the lower segment of the colon. The numbers and sizes of the tumors were lower in the FFD group than in the model group (Figure 1C).
No tumors were observed in the control group. However, there was some local mucosal epithelial detachment, a slight edema of the local lamina propria, a small amount of plasma cell infiltration into the lamina propria, and an extensive submucosal edema observed in H&E-stained colon tissues from the control group. A large tumor formation area was observed in the model group. The local tumors were tubular glands with different sizes and shapes and small atypical tumor cells. A small number of neutrophils infiltrating into tumor cells could be observed, and more necrotic fragments could be observed in the lumen. Local tumor cells were arranged in a mesh pattern, with a loss of polarity and visible eosinophils in the mesh. H&E-stained colon tissues from the FFD group exhibited papillary tumors, which were locally protruding toward the lumen, with glands varying in size and shape and atypia of tumor cells observed. Greater mucosal epithelial exfoliation was observed on the surface of the tumors. Ulcerative lesions were observed locally in the tissues, and glands were absent, with more neutrophilic infiltration. Glandular goblet cells were considerably reduced near the ulcer (Figure 1C). However, the pathological changes in the colons from the FFD group were substantially improved compared with those from the model group.
Survival Analysis
The median survival times and survival rates were 50.13 ± 3.90 days (86.67%) in the control group, 39.42 ± 2.96 days (40%) in the FFD group, and 30.81 ± 5.21 days (13.33%) in the model group. Thus, the results differed among the three groups, and the survival time and survival rate in the FFD group were improved compared with those in the model group (p < 0.001; Figure 1D).
Intestinal Barrier Function
The levels of DAO, D-lactic acid, and endotoxin were significantly higher in the mice from the FFD and model groups than in those from the control group (p < 0.05). However, the serum DAO and endotoxin levels were lower in the FFD group than in the model group. The D-lactic acid levels did not differ significantly between the model and FFD groups (Figure 1E). These results suggest that the intestinal mucosal barrier function was improved in the mice from the FFD group compared with that in the mice from the model group.
Serum Cytokine Levels
Compared with those in the control group, the serum levels of TNF-α, IFN-γ, IL-2, IL-4, IL-6, and IL-10 were higher in the model group. The serum levels of IL-6 and TNF-α in the FFD group were significantly lower than those in the model group (p < 0.01 and p < 0.001, respectively; Figure 2), suggesting that there was less inflammation in the FFD group.
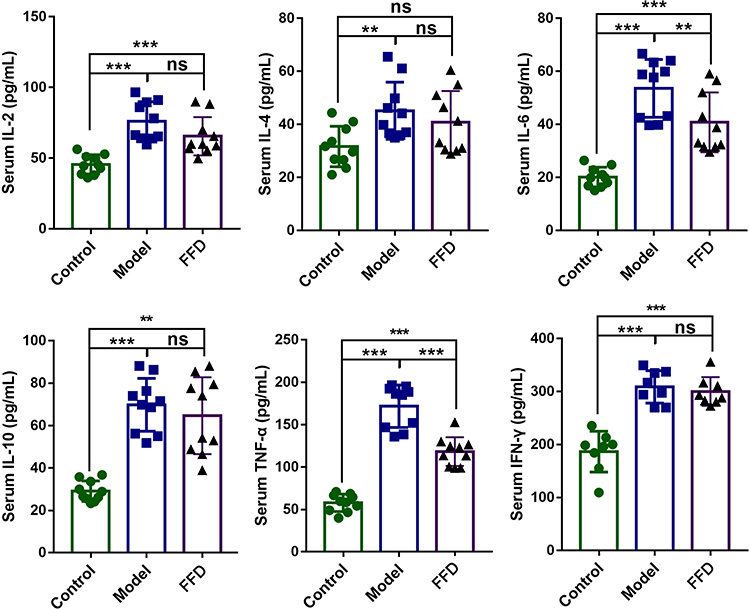 |
Figure 2 The levels of inflammatory cytokines in mice from the control, AOM/DSS tumor-bearing model, and FFD groups (**p < 0.01; ***p < 0.001). Abbreviation: ns, not significant. |
Immune Cells
The proportions of lymphocytes, total T cells, CD3+CD4+ T cells, CD3+ CD8+ T cells, and helper T (Th1; CD4+IFN-γ+) cells in the spleen immune cell populations were significantly higher in the FFD group (p < 0.01) than in the other two groups. However, the numbers of natural killer (NK) cells, B cells, regulatory T (Treg) cells, and Th2 and Th17 cells showed no statistically significant differences among the three groups (Figures 3A and S1).
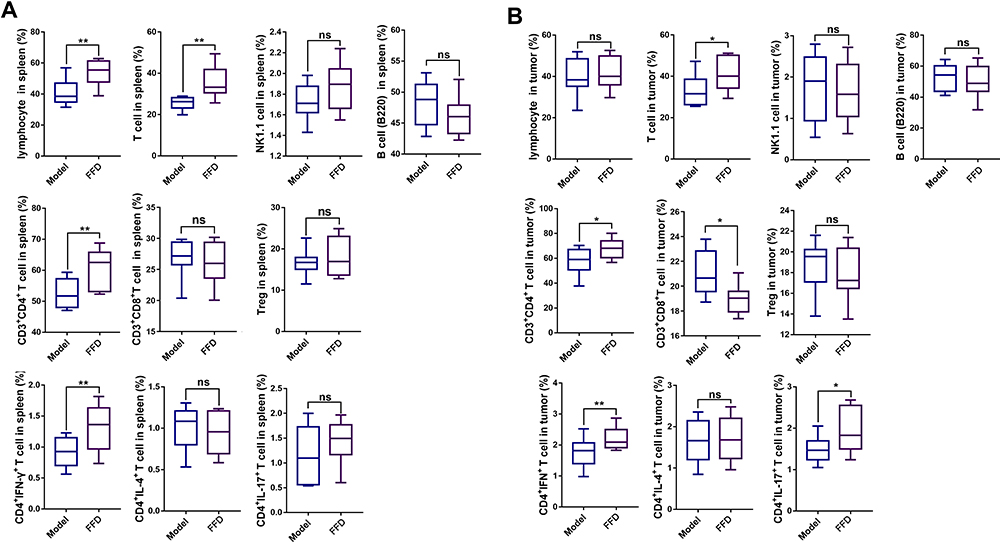 |
Figure 3 The numbers of lymphocytes, T cells, NK1.1 cells, B cells, CD3+ CD4+ T cells, CD3+ CD8+ T cells, Tregs, CD4+ IFN-γ T cells, CD4+ IL-4+ T cells, and CD4+ IL-17+ T cells in (A) the spleens and (B) the tumors of mice in the model and FFD groups (*p < 0.05; **p < 0.01). Abbreviation: ns, not significant. |
Compared with those in the model group, the proportions of T cells, CD4+ T cells, CD8+ T cells, and Th1 and Th17 cells were significantly higher in colorectal cancer tissues from the FFD group (p < 0.05). The proportions of lymphocytes, NK cells, B cells, Treg cells, and Th2 cells showed no significant differences (Figures 3B and S1), suggesting that the immune function of T cells in the FFD group was superior to that in the model group.
Intestinal Microbiota
An alpha diversity boxplot (Figure 4A) indicates that the intestinal microbiotas in the model and FFD groups were significantly different from that in the control group. As shown in Figure 4B, the Specaccum species accumulation curves tended to flatten, which indicated sufficient sampling. A beta diversity analysis revealed that samples from the same group were grouped closely together, indicating that the differences within the group were small and the experiment was reliable (Figure 4C and D). Figure 4E illustrates the relative abundances of 14 most abundant genera, including Odoribacter, Bacteroides, Alistipes, Alloprevotella, Rikenella, Lactobacillus, Lachnospiraceae_NK4A136_group, Helicobacter, Ruminococcaceae_UCG-014, Rikenellaceae_RC9_gut_group, Prevotellaceae_UCG-001, Parabacteroides, Muribaculum, and Parasutterella. Figure 4F shows 10 most abundant differential genera among the three groups. In total, 60 differential bacterial genera were found between the FFD and model groups. Figure 4G provides an overview of 50 most abundant (overall) and 10 most abundant differential genera between the two groups, with lower abundances of Desulfovibrio and Ruminococcaceae (NK4A214_group and UCG-014) and higher abundances of the beneficial genera Bacteroides, Parasutterella, Ruminiclostridium_6, Holdemanella, Clostridium_sensu_stricto_1, and Allobaculum in the FFD group, which may be an important factor affecting the activity of this functional food.
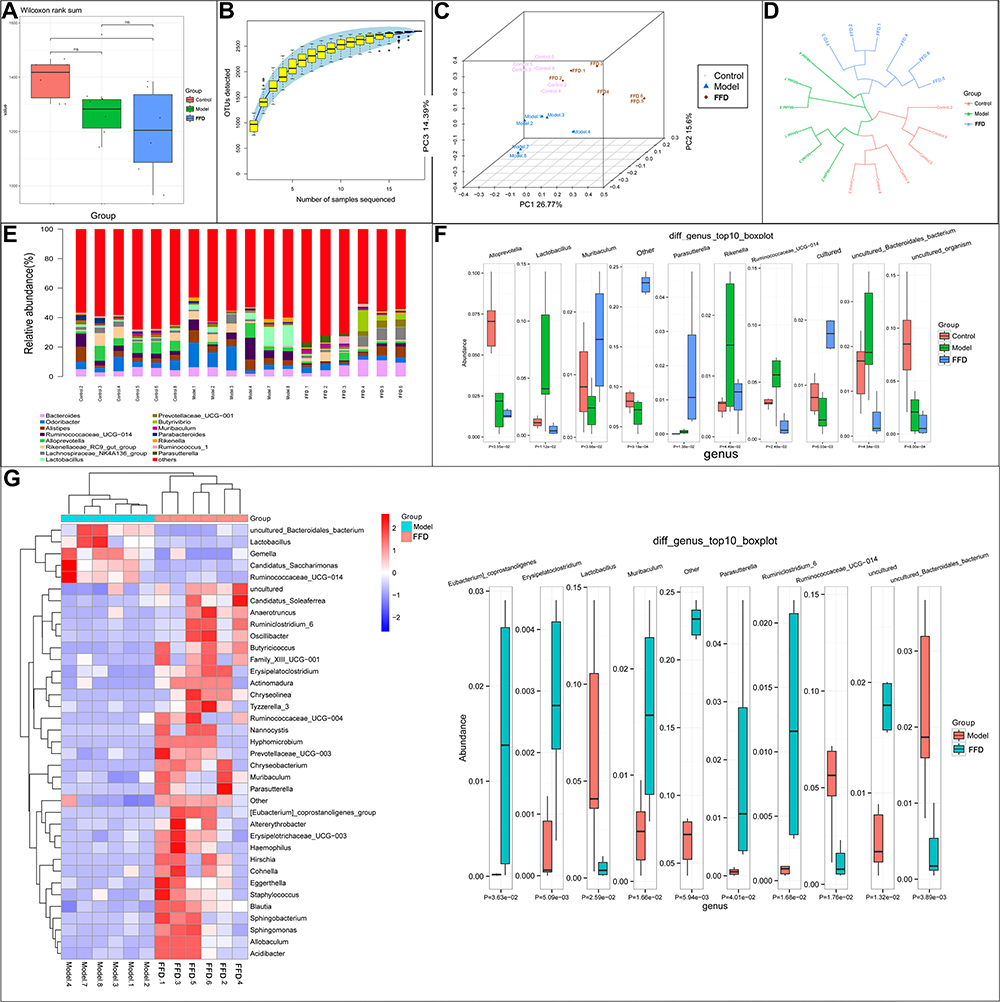 |
Figure 4 (A and B) The alpha diversity and (C and D) beta diversity of the intestinal flora of mice in the control, model and FFD groups. (E) The relative abundance of the 14 most abundant flora and (F) 10 the most abundant differentially-detected flora between the control, model, and FFD groups. (G) The most abundant flora and the 10 most abundant differentially-detected flora between the FFD and model groups (*p < 0.05). Abbreviation: ns, not significant. |
Fecal Metabolites
Quality control of the fecal metabolite analysis revealed that samples were clustered closely together, which indicated that the experiment had good stability and repeatability (Figure 5A). The LC/MS analysis revealed a total of 625 differential metabolites between the model and control groups, while there were 635 differential metabolites between the FFD and model groups. The 50 most abundant differential metabolites are shown in a heatmap (Figure 5B, Supplementary Tables S5 and S6), with contrasting patterns of metabolites between the FFD and model groups. The metabolite pattern in the FFD group was similar to that in the control group, including lower levels of deuteroporphyrin IX, citrulline, and diferuloylputrescine and higher levels of acetic acid, ascorbic acid, branched-chain amino acids, palmitic acid, quinic acid, rosmaridiphenol, ursocholic acid, and scillirosidin than those in the model group; the latter may represent the antitumor metabolites of this functional food.
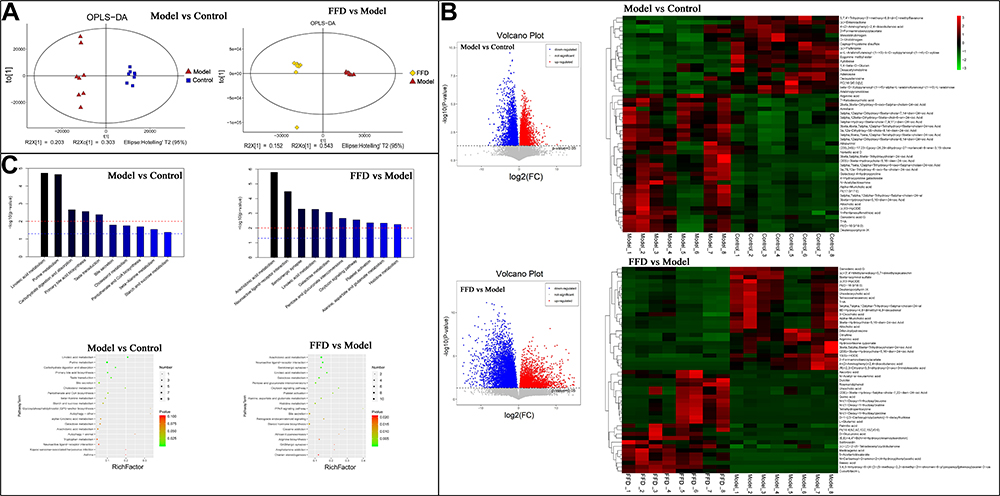 |
Figure 5 The results of the fecal metabolite analysis. (A) Quality control results. (B) A heatmap of different metabolites and the 50 most abundant differentially-detected metabolites between the FFD and model groups. (C) The metabolic pathway enrichment results obtained through the Kyoto Encyclopedia of Genes and Genomes (KEGG) ID analysis. |
A pathway enrichment analysis of the differential fecal metabolites (Figure 5C) showed that they were involved in arachidonic acid metabolism; neuroactive ligand–receptor interactions; serotonergic synapses; linoleic acid metabolism; galactose metabolism; pentose and glucuronate interconversions; the oxytocin signaling pathway; platelet activation; alanine, aspartate and glutamate metabolism; and histidine metabolism.
Serum Metabolites
Quality control of the serum metabolite analysis revealed that samples were clustered closely together, which indicated that the experiment had good stability and repeatability (Figure 6A). The LC/MS analysis revealed 254 differential metabolites between the model and control groups and 234 differential metabolites between the FFD and model groups. The 50 most abundant differential metabolites among the groups are shown in a heatmap (Figure 6B, Supplementary Tables S7 and S8), with higher levels of α,β-dihydroxanthohumol and p-cresol sulfate, branched-chain amino acids (L-isoleucine and L-valine), 1-heptadecanoyl-sn-glycero-3-phosphocholine, betaine, palmitic acid, and L-histidinol in the FFD group. The latter may also be important metabolites influencing the antitumor effects of this functional food.
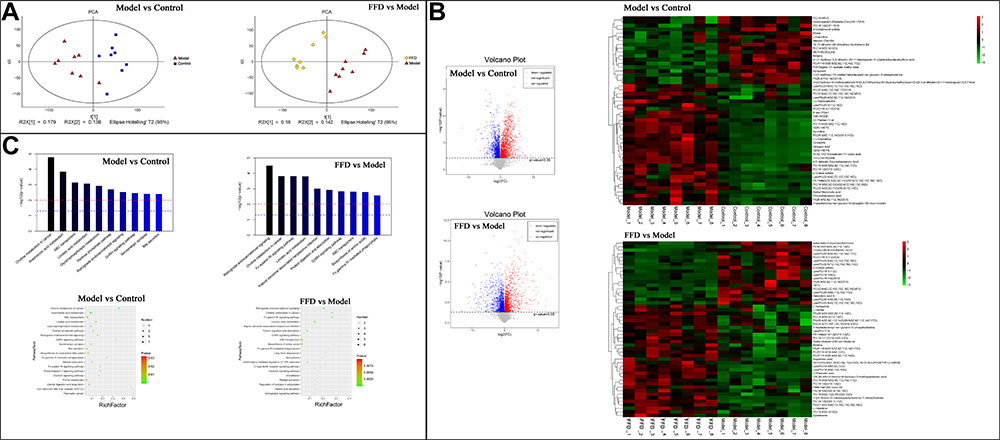 |
Figure 6 The results of a serum metabolite analysis. (A) Quality control results. (B) A heatmap of the different metabolites and 50 most abundant differentially-detected metabolites between the FFD and model groups. (C) The metabolic pathway enrichment results obtained through the Kyoto Encyclopedia of Genes and Genomes (KEGG) ID analysis. |
A pathway enrichment analysis of the differential metabolites in the serum showed their involvement in a variety of pathways, including choline metabolism; linoleic acid metabolism; protein digestion and absorption; the GnRH signaling pathway; ABC transporters; and biosynthesis of amino acids, among others (Figure 6C).
Discussion
Currently, the pathogenesis of malignant tumors remains unclear, but metabolic reprogramming is considered to be a core feature of tumor energy metabolism. Abnormal energy metabolism of tumor cells and changes in the metabolic profile can cause changes in the tissue microenvironment.15–17 Therefore, many studies have proposed that an abnormal metabolism of nutrients in the body is associated with the occurrence of tumors, and changing the body’s energy metabolism may be an effective means of preventing or treating cancer.18–20 The functional food used in the present study comprises 55 different natural ingredients, some components of which have been reported to exert antioxidant and immunomodulatory effects (Supplementary Table S2). For instance, spinacene, lutein, melatonin, choline, β-carotene, procyanidin, zeaxanthin, and anthocyanin are some of the active ingredients present in this functional food. The composition and nutritional analysis demonstrated that the energy, protein, fat, vitamins, and other nutrient components of this food meet the criteria of dietary reference intake. This functional food provides high-quality protein and immune nutrients, thus being able to regulate the fat-to-carbohydrate ratio, supplement dietary fiber levels, and increase the overall content of antioxidants, which is consistent with the formulation principles and requirements for FSMPs for cancer patients and makes full use of the characteristics associated with tumor metabolism. Thus, investigating the antitumor activity of this functional food has attracted significant interest.
As a prevalent cancer with high mortality rates, colorectal cancer is considered to have a complex mechanism of initiation and progression.25 In the present study, we observed that dietary supplementation with the functional food alleviated many features of this malignancy in mice with AOM/DSS-induced colorectal cancer, including reduced numbers and sizes of tumors. It has been demonstrated that inflammation plays a key role in the development of colorectal cancer.26 Tumors growing in the human colon are known to overexpress IL-6, COX-2, and TNF-α,27 and gastrointestinal tumors are also closely associated with the upregulation of these cytokines.28 One study has shown that colorectal tumors could be reduced in mice by blocking TNF-α.29 Kraus and Arber27 demonstrated markedly increased DSS-induced mucosal inflammation in Il6/Stat−/− mice. Thus, modulation of the immune system and immune responses could form a part of effective interventions for the prevention and/or treatment of colorectal cancer. In the present study, the serum levels of TNF-α, IFN-γ, IL-2, IL-4, IL-6, and IL-10 were different among the three groups. Compared with those in the model group, the IL-6 and TNF-α serum levels were significantly lower in the animals fed the functional food-supplemented diet (p < 0.01 and p < 0.001, respectively). This indicated that the inflammatory response was significantly reduced in the FFD group.
Pro- and anti-inflammatory responses are mainly associated with adaptive immune cells in colorectal cancer.30 In our study, the proportions of lymphocytes, T cells, CD3+CD4+ T cells, Th1 (CD4+IFN-γ+) cells, and CD3+CD8+ T cells were significantly higher (p < 0.01) in the spleens of mice from the FFD group than in those of mice from the model group. Further, the proportions of all T cells, CD3+CD8+ T cells, CD3+CD4+ T cells, and Th1 and Th17 cells were significantly higher in colorectal cancer tissues of the mice from the FFD group than in those of the mice from the model group (p < 0.05). The host immune system is complex, including innate and adaptive mechanisms, activated by tumor and immune cells.31 The presence of tumor-specific T cells is important for improving clinical outcomes,32–34 as T cells are associated with antitumor immunity and inhibition of tumor growth.35 Studies have shown that Treg (CD4+CD25+) cells are associated with immunological hyporesponsiveness to cancer, while CD8+ T cells and CD4+ effector T cells play antitumor roles.36,37 The functional food used in this study has been shown to improve the immune response, especially T-cell immune function.
The human colon is inhabited by a large number of microorganisms.38 The gut microbiota is associated with human health and disease development.39 In a previous study on inflammatory bowel disease, the interplay between host immune factors and the intestinal microbiota was shown to account for abnormal inflammatory responses in the subjects.40 In the present study, the overall microbiome diversity was lower in the model and FFD groups than in the control group, which was consistent with modifications of the microbiome observed in various inflammation-related conditions and during cancer development.41 Notably, Ruminiclostridium 6 was more abundant in the FFD group than in the model group and was among the 10 most abundant differential genera. Feng et al42 demonstrated that Ruminiclostridium was highly abundant in the feces of healthy subjects, whereas its levels were reduced in patients with colorectal cancer, which was consistent with our present findings. In particular, Ruminiclostridium is known to produce acetic and butyric acids, which are short-chain fatty acids with multiple biological roles.43
Our results showed 635 differential fecal metabolites, including ascorbic acid, between the FFD and model groups. Accumulation of ascorbic acid in the plasma is known to significantly increase during tumorigenesis and cancer growth.44 Researchers have proposed that ascorbic acid can block the formation of carcinogenic nitrosamines and inhibit the growth of a variety of tumors.45 There also were 234 differential serum metabolites, with their levels often showing opposite patterns between the FFD and model groups, while the metabolite pattern in the FFD group was similar to that in the control group. The results suggested that the main signaling pathways associated with the differential fecal metabolites were involved in the arachidonic acid metabolism, serotonergic synapses, linoleic acid metabolism, neuroactive ligand–receptor interactions, and pentose and glucuronate interconversions. The major signaling pathways associated with the differential serum metabolites were involved in retrograde endocannabinoid signaling, choline metabolism in cancer, linoleic acid metabolism, the Fc epsilon RI signaling pathway, and Kaposi sarcoma-associated herpesvirus infection. Linoleic acid metabolism was a common pathway associated with both serum and fecal metabolites. The anticancer properties of conjugated linoleic acid are widely recognized.46 Therefore, it is speculated that this food can regulate the metabolic processes and remodel the metabolic profile of the gut microbiota in mice with AOM/DSS-induced colorectal cancer. However, the precise mechanism(s) underlying these effects warrant further investigation.
Conclusion
In conclusion, the present study demonstrated that supplementation with a functional food could significantly protect colon tissues of mice with AOM/DSS-induced colorectal cancer. The functional food altered the overall microbiota and metabolic pathways, as well as the metabolic profile related to the gut microbiome. Thus, our study provides evidence supporting the use of this food as a novel treatment for colorectal cancer. Further studies are warranted to validate these findings for the possible clinical application of this functional food.
Abbreviations
AOM, Azoxymethane; DAO, Diamine Oxidase; DSS, Dextran Sulfate Sodium; DTT, Dithiothreitol; ELISA, Enzyme-Linked Immunosorbent Assay; FSMP, Food for Special Medical Purposes; H&E, Hematoxylin and Eosin; HEPES, 4-(2-Hydroxyethyl)-1-Piperazineethanesulfonic Acid; IFN, Interferon; IL, Interleukin; LC, Liquid Chromatography; MS, Mass Spectrometry; NK, Natural Killer; OPLS-DA, Orthogonal Partial Least-Squares Discriminant Analysis; OTU, Operational Taxonomic Unit; PBS, Phosphate-Buffered Saline; PCR, Polymerase Chain Reaction; RT, Retention Time; Th, Helper T; TNF, Tumor Necrosis Factor; VIP, Variable Importance in the Projection.
Data Sharing Statement
The metabolomic datasets generated and analyzed during the current study are available in the “Baidu Netdisk” (https://pan.baidu.com/s/1DrhGa43vgkV_TTYXWKNoag) with the extraction code ott1.
Ethics and Consent Statement
All animal studies were carried out in accordance with the Guidelines for the Care and Use of Laboratory Animals issued by the National Institutes of Health and approved by the Animal Ethics Committee of the Huai’an Hospital, affiliated with Xuzhou Medical University (Huai’an, China) (Approval No. AEC 2019-HA07).
Author Contributions
All authors made a significant contribution to the work reported, whether that is in the conception, study design, execution, acquisition of data, analysis and interpretation, or in all these areas; took part in drafting, revising or critically reviewing the article; gave final approval of the version to be published; have agreed on the journal to which the article has been submitted; and agree to be accountable for all aspects of the work.
Funding
This study was supported by the National Key Research and Development Program: The key technology of palliative care and nursing for cancer patients (2017YFC1309200).
Disclosure
The authors report no conflicts of interest in this work.
References
1. Zeuner A, Todaro M, Stassi G, De Maria R. Colorectal cancer stem cells: from the crypt to the clinic. Cell Stem Cell. 2014;15(6):692–705. doi:10.1016/j.stem.2014.11.012
2. Kataoka K, Debrie E, Shiozawa M, Goetghebeur E, Ceelen WP. Prognostic significance of number versus location of positive mesenteric nodes in node positive colon cancer. Eur J Surg Oncol. 2019;45(10):1862–1869. doi:10.1016/j.ejso.2019.05.022
3. Siegel RL, Miller KD, Fedewa SA, et al. Colorectal cancer statistics, 2017. CA Cancer J Clin. 2017;67(3):177–193. doi:10.3322/caac.21395
4. Zhu J, Tan Z, Hollis-Hansen K, Zhang Y, Yu C, Li Y. Epidemiological trends in colorectal cancer in China: an ecological study. Dig Dis Sci. 2017;62(1):235–243. doi:10.1007/s10620-016-4362-4
5. Meng Y-Q, Xu C-D, Yu -T-T, Li W, Li Q-W, Li -X-X. Synthesis and antitumor activity evaluation of ursolic acid derivatives. J Asian Nat Prod Res. 2020;1–11.
6. Klein M, Poverenov E. Natural biopolymer‐based hydrogels for use in food and agriculture. J Sci Food Agric. 2020;100(6):2337–2347. doi:10.1002/jsfa.10274
7. Borek C. Dietary antioxidants and human cancer. J Restor Med. 2017;6(1):53–61. doi:10.14200/jrm.2017.6.0105
8. Parohan M, Sadeghi A, Khatibi SR, et al. Dietary total antioxidant capacity and risk of cancer: a systematic review and meta-analysis on observational studies. Crit Rev Oncol Hematol. 2019;138(70):70–86. doi:10.1016/j.critrevonc.2019.04.003
9. Chen C, Zhang Q, Wang F-Q, et al. In vitro anti-platelet aggregation effects of fourteen fruits and vegetables. Pak J Pharm Sci. 2019;32(1):185–195.
10. Loman NJ, Constantinidou C, Chan JZ, et al. High-throughput bacterial genome sequencing: an embarrassment of choice, a world of opportunity. Nat Rev Microbiol. 2012;10(9):599–606. doi:10.1038/nrmicro2850
11. Han J, Meng J, Chen S, Li C. Integrative analysis of the gut microbiota and metabolome in rats treated with rice straw biochar by 16S rRNA gene sequencing and LC/MS-based metabolomics. Sci Rep. 2019;9(1):17860. doi:10.1038/s41598-019-54467-6
12. Owen JL, Mohamadzadeh M. Microbial activation of gut dendritic cells and the control of mucosal immunity. J Interferon Cytokine Res. 2013;33(11):619–631. doi:10.1089/jir.2013.0046
13. Slater TW, Finkielsztein A, Mascarenhas LA, Mehl LC, Butin-Israeli V, Sumagin R. Neutrophil microparticles deliver active myeloperoxidase to injured mucosa to inhibit epithelial wound healing. J Immunol. 2017;198(7):2886–2897. doi:10.4049/jimmunol.1601810
14. Tsoi H, Chu ES, Zhang X, et al. Peptostreptococcus anaerobius induces intracellular cholesterol biosynthesis in colon cells to induce proliferation and causes dysplasia in mice. Gastroenterology. 2017;152(6):1419–1433. doi:10.1053/j.gastro.2017.01.009
15. Chiaro TR, Soto R, Stephens WZ, et al. A member of the gut mycobiota modulates host purine metabolism exacerbating colitis in mice. Sci Transl Med. 2017;9(380):1–11. doi:10.1126/scitranslmed.aaf9044
16. Forbes JD, Van Domselaar G, Bernstein CN. The gut microbiota in immune-mediated inflammatory diseases. Front Microbiol. 2016;7:1–18. doi:10.3389/fmicb.2016.01081
17. Gagnière J, Raisch J, Veziant J, et al. Gut microbiota imbalance and colorectal cancer. World J Gastroenterol. 2016;22(2):501–508. doi:10.3748/wjg.v22.i2.501
18. Sobhani I, Tap J, Roudot-Thoraval F, et al. Microbial dysbiosis in colorectal cancer (CRC) patients. PLoS One. 2011;6(1):e16393. doi:10.1371/journal.pone.0016393
19. Wang C, Peng R, Wang L, et al. Wushen, a food mixture containing 55 different natural ingredients, inhibits S180 tumor growth in vivo. Food Funct. 2014;5(7):1475–1480. doi:10.1039/c4fo00008k
20. Vishchuk OS, Ermakova SP, Zvyagintseva TN. Sulfated polysaccharides from brown seaweeds saccharina japonica and undaria pinnatifida: isolation, structural characteristics, and antitumor activity. Carbohydr Res. 2011;346(17):2769–2776. doi:10.1016/j.carres.2011.09.034
21. Gao X, Cao Q, Cheng Y, et al. Chronic stress promotes colitis by disturbing the gut microbiota and triggering immune system response. Proc Natl Acad Sci. 2018;115(13):E2960–E69. doi:10.1073/pnas.1720696115
22. Nossa CW, Oberdorf WE, Yang L, et al. Design of 16S rRNA gene primers for 454 pyrosequencing of the human foregut microbiome. World J Gastroenterol. 2010;16(33):4135–4144. doi:10.3748/wjg.v16.i33.4135
23. Bolger AM, Lohse M, Usadel B. Trimmomatic: a flexible trimmer for Illumina sequence data. Bioinformatics. 2014;30(15):2114–2120. doi:10.1093/bioinformatics/btu170
24. Caporaso JG, Kuczynski J, Stombaugh J, et al. QIIME allows analysis of high-throughput community sequencing data. Nat Methods. 2010;7(5):335–336. doi:10.1038/nmeth.f.303
25. Brenner H, Kloor M, Pox CP, et al. Colorectal cancer. Lancet. 2014;383(9927):1490–1502. doi:10.1016/S0140-6736(13)61649-9
26. Grivennikov IS. Inflammation and colorectal cancer: colitis-associated neoplasia. Semin Immunopathol. 2013;35(2):229–244.
27. Kraus S, Arber N. Inflammation and colorectal cancer. Curr Opin Pharmacol. 2009;9(4):405–410. doi:10.1016/j.coph.2009.06.006
28. Li Y, Wang L, Pappan L, Galliher-Beckley A, Shi J. IL-1β promotes stemness and invasiveness of colon cancer cells through Zeb1 activation. Mol Cancer. 2012;11(1):1–13. doi:10.1186/1476-4598-11-87
29. Popivanova BK, Kitamura K, Wu Y, Kondo T, Mukaida N. Blocking TNF-alpha in mice reduces colorectal carcinogenesis associated with chronic colitis. J Clin Invest. 2008;118(2):560–570.
30. Antoniou E, Margonis GA, Angelou A, Zografos GC, Pikoulis E. Cytokine networks in animal models of colitis-associated cancer. Anticancer Res. 2015;35(1):19–24.
31. Dunn GP, Bruce AT, Ikeda H, Old LJ, Schreiber RD. Cancer immunoediting: from immunosurveillance to tumor escape. Nat Immunol. 2002;3(11):991–998. doi:10.1038/ni1102-991
32. Zhang L, Conejo-Garcia JR, Katsaros D, et al. Intratumoral T cells, recurrence, and survival in epithelial ovarian cancer. N Engl J Med. 2003;348(3):203–213. doi:10.1056/NEJMoa020177
33. Ohtani H. Pathophysiologic significance of host reactions in human cancer tissue: desmoplasia and tumor immunity. Tohoku J Exp Med. 1999;187(3):193–202. doi:10.1620/tjem.187.193
34. Molldrem JJ, Lee PP, Wang C, et al. Evidence that specific T lymphocytes may participate in the elimination of chronic myelogenous leukemia. Nat Med. 2000;6(9):1018–1023. doi:10.1038/79526
35. Inagaki A, Ishida T, Ishii T, et al. Clinical significance of serum Th1‐, Th2‐and regulatory T cells‐associated cytokines in adult T‐cell leukemia/lymphoma: high interleukin‐5 and‐10 levels are significant unfavorable prognostic factors. Int J Cancer. 2006;118(12):3054–3061. doi:10.1002/ijc.21688
36. Sutmuller RP, Van Duivenvoorde LM, Van Elsas A, et al. Synergism of cytotoxic T lymphocyte–associated antigen 4 blockade and depletion of CD25+ regulatory T cells in antitumor therapy reveals alternative pathways for suppression of autoreactive cytotoxic T lymphocyte responses. J Exp Med. 2001;194(6):823–832. doi:10.1084/jem.194.6.823
37. Yu P, Fu Y-X. Tumor-infiltrating T lymphocytes: friends or foes? Lab Invest. 2006;86(3):231–245. doi:10.1038/labinvest.3700389
38. Sears CL, Garrett WS. Microbes, microbiota, and colon cancer. Cell Host Microbe. 2014;15(3):317–328. doi:10.1016/j.chom.2014.02.007
39. Wang B, Yao M, Lv L, Ling Z, Li L. The human microbiota in health and disease. Engineering. 2017;3(1):71–82. doi:10.1016/J.ENG.2017.01.008
40. Sands BE. Inflammatory bowel disease: past, present, and future. J Gastroenterol. 2007;42(1):16–25. doi:10.1007/s00535-006-1995-7
41. Yamamoto M, Matsumoto S. Gut microbiota and colorectal cancer. Genes Environ. 2016;38(1):1–7. doi:10.1186/s41021-016-0038-8
42. Feng Q, Liang S, Jia H, et al. Gut microbiome development along the colorectal adenoma–carcinoma sequence. Nat Commun. 2015;6(1):1–13. doi:10.1038/ncomms7528
43. Xu G-D, Cai L, Ni Y-S, et al. Comparisons of effects on intestinal short-chain fatty acid concentration after exposure of two glycosidase inhibitors in mice. Biol Pharm Bull. 2018;41(7):1024–1033. doi:10.1248/bpb.b17-00978
44. Castaldo SA, Freitas JR, Conchinha NV, Madureira PA. The tumorigenic roles of the cellular REDOX regulatory systems. Oxid Med Cell Longev. 2016;2016:1–17. doi:10.1155/2016/8413032
45. Weisburger, JohnH. Vitamin c and prevention of nitrosamine formation. Lancet; 310(8038):607–607. doi:10.1016/S0140-6736(77)91451-9
46. Degen C, Habermann N, Piegholdt S, Glei M, Jahreis G. Human colon cell culture models of different transformation stages to assess conjugated linoleic acid and conjugated linolenic acid metabolism: challenges and chances. Toxicol in Vitro. 2012;26(6):985–992. doi:10.1016/j.tiv.2012.05.002
 © 2021 The Author(s). This work is published and licensed by Dove Medical Press Limited. The full terms of this license are available at https://www.dovepress.com/terms.php and incorporate the Creative Commons Attribution - Non Commercial (unported, v3.0) License.
By accessing the work you hereby accept the Terms. Non-commercial uses of the work are permitted without any further permission from Dove Medical Press Limited, provided the work is properly attributed. For permission for commercial use of this work, please see paragraphs 4.2 and 5 of our Terms.
© 2021 The Author(s). This work is published and licensed by Dove Medical Press Limited. The full terms of this license are available at https://www.dovepress.com/terms.php and incorporate the Creative Commons Attribution - Non Commercial (unported, v3.0) License.
By accessing the work you hereby accept the Terms. Non-commercial uses of the work are permitted without any further permission from Dove Medical Press Limited, provided the work is properly attributed. For permission for commercial use of this work, please see paragraphs 4.2 and 5 of our Terms.