")
Back to Journals » International Journal of General Medicine » Volume 14
A Feasibility Study on Using Single-Photon Emission Computed Tomography Pulmonary Perfusion/Ventilation Imaging for the Diagnosis of Chronic Thromboembolic Pulmonary Hypertension and Patient Risk Assessment
Authors Ma RZ, Han PP, Tao XC, Li H, Wang L, Zhai ZG, Fu LP
Received 19 August 2021
Accepted for publication 11 October 2021
Published 10 November 2021 Volume 2021:14 Pages 8029—8038
DOI https://doi.org/10.2147/IJGM.S335051
Checked for plagiarism Yes
Review by Single anonymous peer review
Peer reviewer comments 2
Editor who approved publication: Dr Scott Fraser
Rong-Zheng Ma,1 Ping-Ping Han,1 Xin-Cao Tao,2 Huan Li,1 Ling Wang,1 Zhen-Guo Zhai,2 Li-Ping Fu1
1Department of Nuclear Medicine, China-Japan Friendship Hospital, Beijing, 100029, People’s Republic of China; 2Department of Pulmonary and Critical Care Medicine, China-Japan Friendship Hospital, National Center for Respiratory Medicine, Institute of Respiratory Medicine, Chinese Academy of Medical Sciences, National Clinical Research Center for Respiratory Diseases, Beijing, 100029, People’s Republic of China
Correspondence: Li-Ping Fu
Department of Nuclear Medicine, China-Japan Friendship Hospital, No. 2 of Yinghuayuan Road, Chaoyang District, Beijing, 100029, People’s Republic of China
Tel +86 10 84205389
Fax +86 10-84205389
Email [email protected]
Zhen-Guo Zhai
Department of Pulmonary and Critical Care Medicine, China-Japan Friendship Hospital, No. 2 of Yinghuayuan Road, Chaoyang District, Beijing, 100029, People’s Republic of China
Tel +86 10 84206269
Fax +86 10 84206269
Email [email protected]
Objective: The study is designed to evaluate the diagnostic ability of single-photon emission computed tomography (SPECT) pulmonary ventilation/perfusion (V/Q) imaging in patients with chronic thromboembolic pulmonary hypertension (CTEPH) and investigate its feasibility in assessing patient risk.
Methods: A total of 83 patients suspected of having CTEPH who received V/Q tomography were retrospectively analyzed. The consistency between SPECT V/Q imaging and pulmonary angiography was compared to investigate the correlation between the percentage of pulmonary perfusion defect score (PPDs%) and the hemodynamic indices. Patients were grouped according to the pulmonary arterial hypertension risk stratification, and the V/Q imaging results were compared between different groups.
Results: For the 1494 pulmonary segments of the 83 patients, the sensitivity, specificity, and accuracy of identifying pulmonary segments with defects using V/Q imaging was 87.05%, 82.78% (668/807), and 84.74% (1266/1494), respectively. The average PPDs% (58.8 ± 12.6%) was positively correlated with the mean pulmonary arterial pressure (mPAP), pulmonary vascular resistance (PVR), and right ventricular pressure (RVP; r =0.316, 0.318, and 0.432, respectively; P < 0.05) and negatively correlated with the six-minute walk distance (6MWD; r = − 0.309; P < 0.05). There were 37 patients in the low-risk group and 46 in the medium-high-risk group. The number of pulmonary segments with perfusion defects (NPSPDs) and PPDs% were higher in the medium-high risk than in the low-risk group (t = − 6.721, − 5.032; P < 0.05). In the low- and medium-high-risk groups, the cut-off values for the NPSPDs (7.2 ± 2.1 and 10.2 ± 2.0) and PPDs% (51.9 ± 11.1% and 64.3 ± 11.1%,) were 8.5 and 61.25%, respectively.
Conclusion: SPECT V/Q imaging achieved an accurate diagnosis of CTEPH. The semi-quantitative analysis index (PPDs%) was correlated with the hemodynamic indices and 6MWD. SPECT V/Q could be used for the preoperative risk assessment of patients with CTEPH.
Keywords: pulmonary artery, thrombosis, pulmonary hypertension, pulmonary perfusion/ventilation imaging, 99mTc-MAA, risk stratification
Introduction
Chronic thromboembolic pulmonary hypertension (CTEPH) is a disease characterized by vascular stenosis or occlusion caused by pulmonary artery thrombosis, pulmonary vascular remodeling, and the progressive elevation of pulmonary arterial pressure, finally leading to right heart failure, which is generally assigned to class IV on the pulmonary arterial hypertension (PAH) risk scale.1 It has been reported that the incidence of CTEPH is about five per one million of the population per year. For the population with acute pulmonary embolism (APE), the cumulative incidence rate of CTEPH over two years is approximately 0.1–9.1%.2 The pathogenesis of CTEPH is relatively complex. Recent studies have indicated that the collective effect of a variety of factors promote the pathogenesis of CTEPH, including risk factors related to the patient’s medical history, such as a history of thromboembolism, inherited and acquired thrombophilia, mechanisms of abnormal coagulation and fibrinolysis, inflammatory mechanisms, revascularization, and in-situ thrombosis. At present, the therapeutic method for CTEPH primarily relies on operative therapy, including pulmonary endarterectomy (PEA) and pulmonary balloon angioplasty, anticoagulants, and targeted drug therapy, as well as lung transplantation or combined heart–lung transplantation.
Pulmonary perfusion/ventilation (V/Q) imaging is recommended as the preferred examination method for the diagnosis of CTEPH in the Guidelines for Diagnosis and Treatment of Pulmonary Hypertension (2015) by the European Society of Cardiology (ESC) and the European Respiratory Society (ERS). If the V/Q imaging result is negative, CTEPH can be safely excluded (Level C evidence, Class I recommendation). China’s Guidelines for the Diagnosis and Treatment of Pulmonary Hypertension (2021) proposed that the sensitivity of V/Q imaging in screening for CTEPH is higher than computed tomography (CT) pulmonary angiography, and V/Q imaging showing normal or low risk could exclude CTEPH (sensitivity 90–100% and specificity 94–100%). Recently, the study of pulmonary perfusion imaging in the diagnosis of CTEPH has become an important topic.3–5 However, there is still a lack of studies on the application of pulmonary perfusion imaging in the preoperative risk stratification of CTEPH. This study used V/Q single-photon emission computed tomography (SPECT) to diagnose CTEPH at the individual and pulmonary segment levels. An attempt was made to establish a noninvasive and quantitative imaging method for preoperative risk assessment to produce an effective reference index for the clinical assessment of patients.
Materials and Methods
Patients’ Data and Grouping
Patients suspected of having CTEPH who underwent V/Q tomography at the China–Japan Friendship Hospital from March 2019 to January 2021 were retrospectively collected. CTEPH was diagnosed according to the 2015 ESC/ERS Guidelines for the Diagnosis and Treatment of Pulmonary Hypertension.1 All patients received the standard anticoagulation therapy for at least three months, and CT pulmonary angiography, V/Q imaging, or pulmonary angiography confirmed the presence of chronic thrombosis. The examination of the right heart catheterization showed a mean pulmonary artery pressure (mPAP) in the resting state of ≥25 mmHg (1 mmHg = 0.133 kPa). Exclusion criteria: (1) patients with a history of lung surgery, vasculitis, pulmonary artery aneurysm, etc.; (2) an interval between V/Q imaging and pulmonary angiography >12 months; and (3) incomplete data on the examination of the right heart catheterization.
A total of 87 patients were analyzed, of which 83 were diagnosed with CTEPH, three with fibrosing mediastinitis, and one with Takayasu’s arteritis. Of the 83 patients diagnosed with CTEPH, 36 were males, and 47 were females, with an average age of 57.2 ± 12.7 y. The patients were classified according to the New York Heart Association Functional Classification, and 10 patients were classified as Class A, 37 as Class B, 30 as Class C, and 6 as Class D. The average six-minute walking distance (6MWD) was 386 ± 99 m. Patients were grouped according to the PAH risk stratification (World Symposium on Pulmonary Hypertension 2018),6–8 and 37 patients were placed in the low-risk group, including 15 males and 22 females, with an average age of 55.4 ± 13.5 y, and 46 patients were placed in the medium-high-risk group, including 21 males and 25 females, with an average age of 58.6 ± 12.1 y (see Table 1). The study complied with the principles of the Declaration of Helsinki.
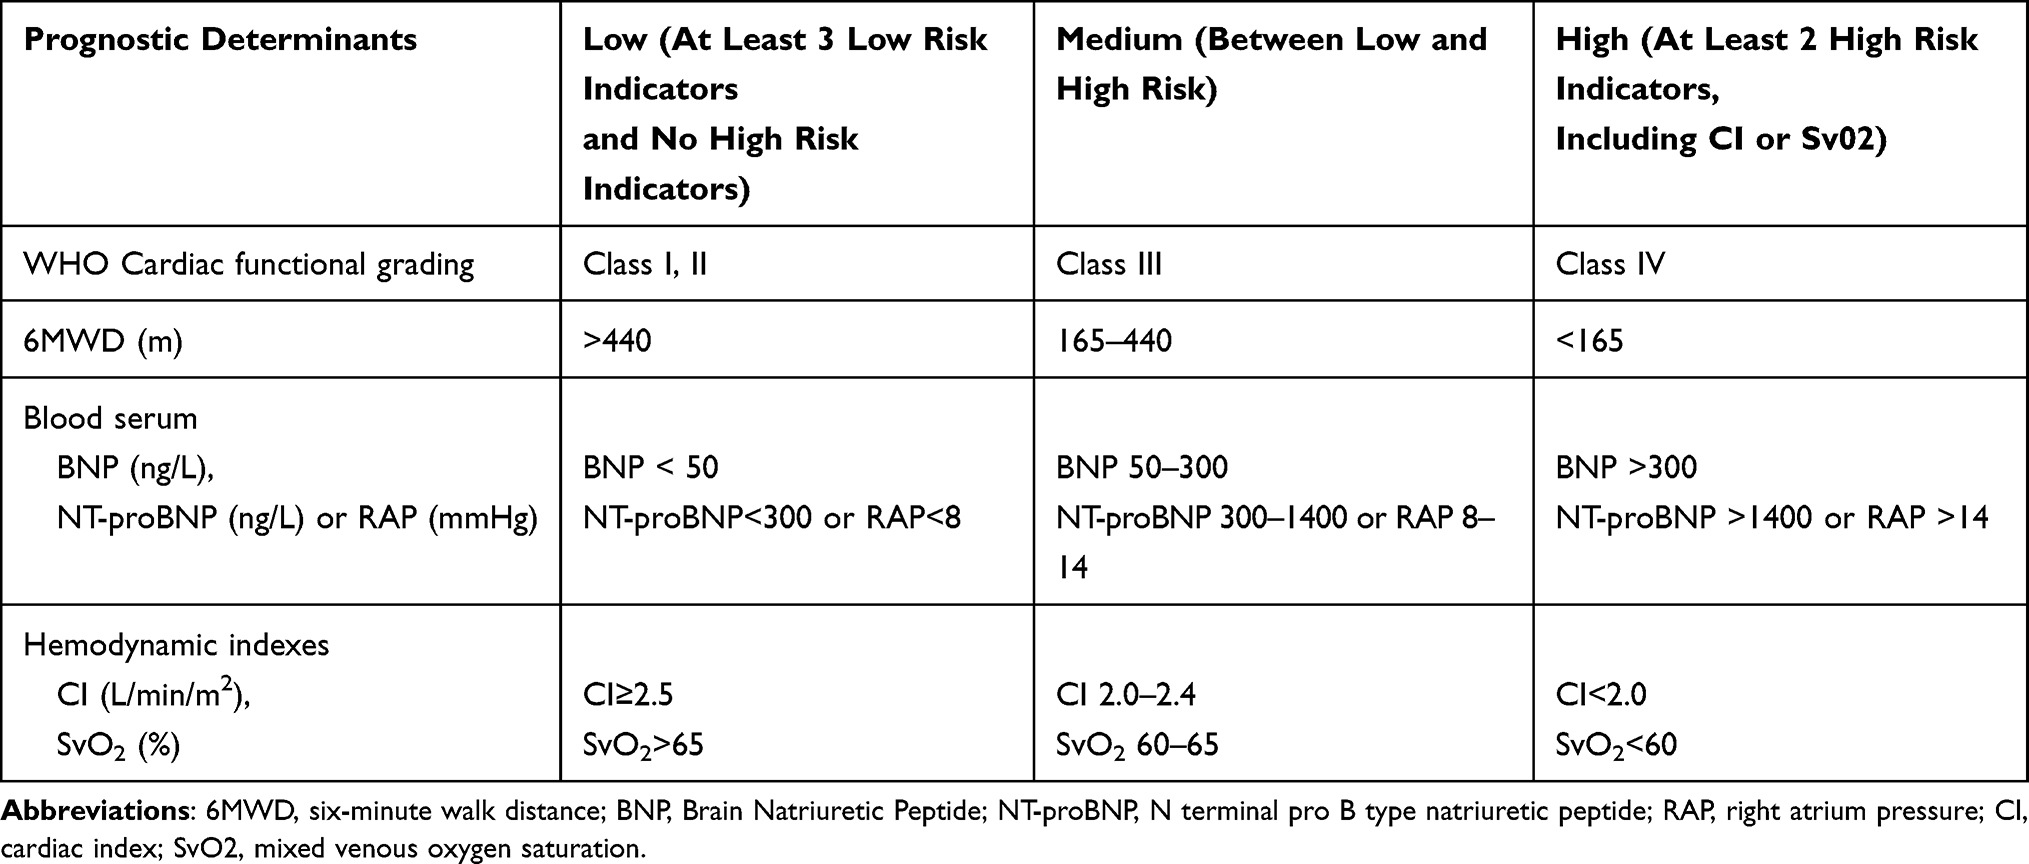 |
Table 1 Risk Stratification in Pulmonary Arterial Hypertension |
Imaging Method
The scanning equipment was equipped with a dual-probe SPECT/CT scanner (Symbia™ T16, Siemens, Germany), with low energy and high-resolution parallel hole collimator, an energy peak of 140 keV, and window width of 20%. The ventilators used were disposable lung ventilators (99mTc-technegas ventilators, Vita Medical Limited, Australia). V/Q imaging was performed using the one-day protocol. The SPECT ventilation imaging was performed first, and then the ventilation acquisition.
99mTcO4− with a high radioactive concentration (>370 MBq/0.1 mL) was injected into a closed device in the Technegas generator to be energized and heated. 99mTcO4− was vaporized to form Technegas, and patients were instructed to inhale the Technegas (99mTc-technegas) through the connecting tube and face mask for 1 min. The patients were then asked to lie on the examination table in the supine position with their hands behind their heads. The probe was placed as close to their chests as possible for lung ventilation imaging. Acquisition parameters: with two probes rotating 180° each, 32 projections were collected with each probe, each lasting 15 s. The acquisition matrix was 128×128 at 1× zoom. During the collection process, patients were instructed to breathe gently to reduce the interference of respiratory movements on lung imaging. SPECT perfusion imaging was then performed, and three times more radioactivity counts of perfusion imaging than ventilation imaging were acquired. Before perfusion imaging, patients were instructed to inhale oxygen at a flow rate of 2–4 L/min for 5–10 min and were given an intravenous injection of 111–185 MBq 99mTc, labeled macroaggregated albumin, with a radiochemical purity ≥95% (HTA Co., LTD., Beijing). Acquisition parameters: with two probes rotating 180° each, 32 projections were collected by each probe, with each projection lasting for 10 s, for a total of 64 projections. The acquisition matrix was 128×128 at 1× zoom. The images were reconstructed using the ordered subsets expectation maximization method (eight subsets and two iterations), and the coronal, sagittal, horizontal, and three-dimensional (3D) images were obtained.
Image Analysis
Blind interpretation of the V/Q images was made by two experienced nuclear medicine physicians who recorded the number of pulmonary segments with perfusion defects (NPSPDs) and performed a semi-quantitative analysis on the pulmonary perfusion images based on Meyer’s method.9 V/Q imaging was combined to evaluate the defect at the level of the CTEPH segments (18 segments in the lungs, with S1–10 in the right lung and S1–8 in the left lung).10–12 A V/Q mismatch defect defined the change in the pulmonary embolic perfusion defect. Image interpretation was based on the guidelines for LUNG V/Q Imaging published by the European Association for Nuclear Medicine (EANM) in 2019,13 as shown below. (1) PE: a V/Q mismatch of at least one segment or two subsegments in keeping with the pulmonary vascular anatomy (wedge-shaped defects with the base projecting to the lung periphery). (2) No PE: a normal perfusion pattern in keeping with the anatomic boundaries of the lungs; matched or reversed mismatched V/Q defects of any size, shape, or number in the absence of a mismatch; a mismatch that does not follow a lobar, segmental, or subsegmental pattern. (3) Nondiagnostic for PE: widespread V/Q abnormalities not typical of specific diseases. The number of PE segments was calculated as NPSPDs, and the percentage of pulmonary perfusion defect scores (PPDs%) was calculated. The percentages of normal perfusion in each lobe were 18% in the upper lobe, 12% in the middle lobe, and 25% in the lower lobe of the right lung, and 13% in the upper lobe, 12% in the lingual lobe, and 20% in the lower lobe of the left lung. Different coefficients were assigned to each lung lobe according to the degree of pulmonary perfusion defect: the completely normal coefficient of perfusion was 1; the degree of perfusion defect from mild to severe was 0.75, 0.50, and 0.25, and the coefficient of a complete defect was 0. The actual perfusion percentage was calculated as the product of the average perfusion percentage and the coefficient of each lung lobe, and the sum of these was the total pulmonary perfusion percentage. PPDs% was calculated as 1 – the total pulmonary perfusion percentage and reflected the severity of the total pulmonary perfusion defect.9
Statistical Processing
The IBM SPSS 19.0 software was used for statistical analysis. The quantitative data conforming to the normal distribution were represented by mean ± standard deviation ( ). The quantitative data not conforming to a normal distribution were described by the median and interquartile range (M, P25–P75), and the qualitative data were represented by a frequency or percentage. The kappa test was used to check the repeatability of the scores by the two physicians. The paired t-test was used to compare the number of abnormal pulmonary segments in the pulmonary angiography and the number of V/Q perfusion defects in the patients with CTEPH. The chi-squared test was used to check the consistency between the perfusion imaging and pulmonary angiography at the individual level. The Pearson correlation analysis was used to determine the correlation between the PPDs% and hemodynamic indices. Two independent sample t-tests were used to compare the measurement indicators of CTEPH between the low- and medium-high-risk groups. A receiver operating characteristic (ROC) curve was used to calculate the area under the curve (AUC). The cut-off values for the number of V/Q perfusion defects and PPDs% against the CTEPH risk group were analyzed. The DeLong approach was used to test the difference in the AUC between the qualitative and semi-quantitative methods (MedCalc). P < 0.05 was considered statistically significant.
Results
SPECT: The Diagnostic Efficacy of Pulmonary Perfusion Imaging
Out of the 1494 pulmonary segments from 83 patients, 687 segments with a defect (45.98%) were confirmed by pulmonary angiography, and 737 (49.33%) were detected by pulmonary perfusion imaging, with a sensitivity of 87.05% (598 of 687), specificity of 82.78% (668 of 807), accuracy of 84.74% (1266 of 1494), positive predictive value (PPV) of 81.14% (598 of 737), and negative predictive value (NPV) of 88.24% (668 of 757) for lung segment defects. An average of 8.9 ± 2.5 pulmonary segment defects was detected by SPECT V/Q imaging and 8.3 ± 2.5 by pulmonary angiography, with no significant difference (t = 1.530, P = 0.128). The results of the SPECT pulmonary perfusion imaging and pulmonary angiography of the 83 patients were examined using the chi-squared test. In 73 patients, there was no significant difference, but there was a significant difference in the other 10 patients.
An Analysis of the Correlation Between the Pulmonary Perfusion Imaging PPDs% and the Hemodynamic Indices
In the 83 patients, the average PPDs% was 58.8 ± 12.6% and mPAP was 37.0 ± 13.5 mmHg, and there was a statistically significant weak positive correlation between them (r = 0.316, P=0.004). The average PVR was 10.8 ± 7.2 Wood units, and there was a statistically significant weak positive correlation between PPDs% and PVR (r = 0.318, P = 0.003). The average right ventricular pressure (RVP) was 24.8 ± 11.5 mmHg and exhibited a statistically significant moderate positive correlation with PPDs% (r = 0.432, P <0.001). The average mean pulmonary arterial wedge pressure was 8.8 ± 2.9 mmHg and was not correlated with PPDs% (r = 0.055, P = 0.624). The average 6MWD was 386 ± 99 m and exhibited a statistically significant weak negative correlation with PPDs% (r = −0.309, P = 0.004; see Figure 1).
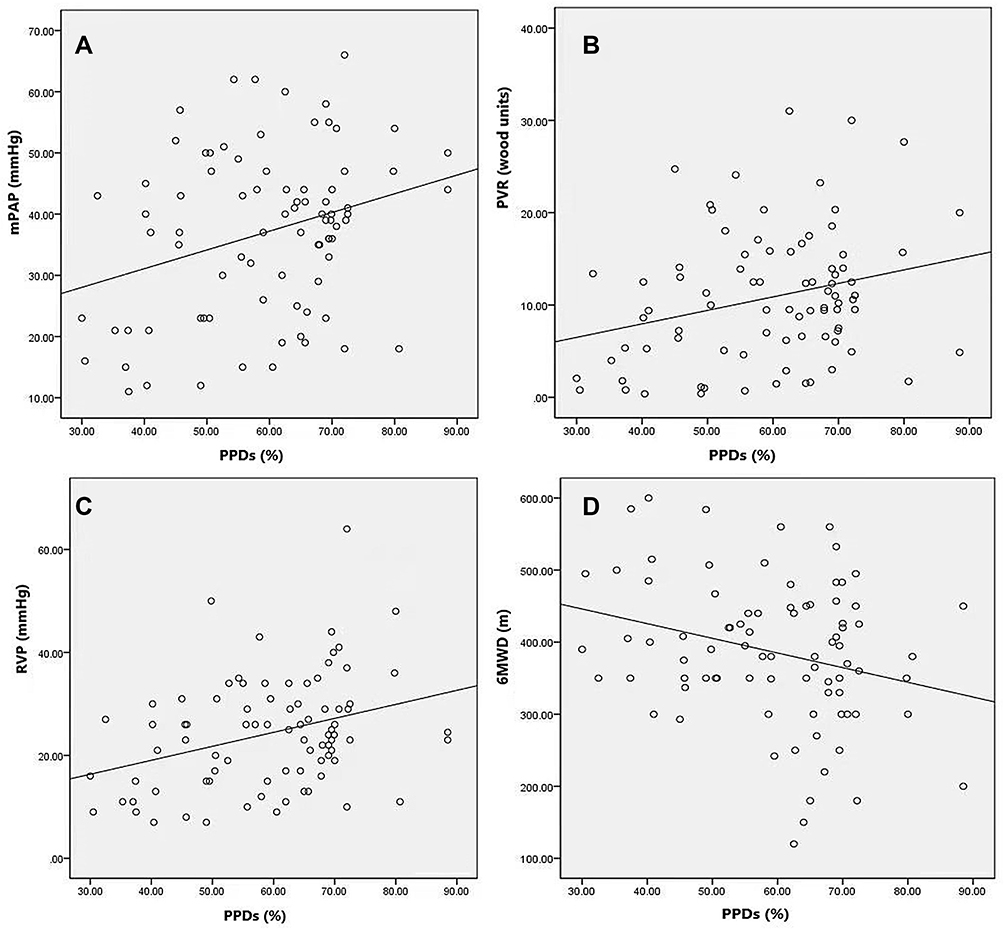 |
Figure 1 Correlation analysis of percentage of pulmonary perfusion defect score (PPDs%) and hemodynamic indexes. PPDs% presented a positive correlation with mean pulmonary artery pressure (mPAP), pulmonary vascular resistance (PVR), right ventricular pressure (RVP) (r=0.316, P=0.004, (A) r=0.318, P=0.003, (B) r=0.432, P<0.001, (C), and a negative correlation with six-minute walk distance (6MWD) (r=−0.309, P=0.004, (D). |
Differential Analysis of the V/Q and Hemodynamic Indices After CTEPH Risk Stratification
Of the 83 patients, 37 were in the low-risk group, and 46 were in the medium-high-risk group. The NPSPDs, PPDs%, mPAP, RVP, and PVR were higher in the medium-high-risk group than in the low-risk group (t = −6.721, −5.032, −2.727, −2.768, and −2.221, respectively; P < 0.05). In the low- and medium-high risk groups, the cut-off values for the NPSPDs (7.2 ± 2.1 and 10.2 ± 2.0, respectively) and PPDs% (51.9 ± 11.1% and 64.3 ± 11.1%, respectively) were 8.5% and 61.25%, respectively. The sensitivity and specificity for evaluating NPSPDs in the risk groups were 73.9% and 81.1%, respectively. The sensitivity and specificity for evaluating PPDs% in the risk groups were 76.1% and 83.8%, respectively. There was no significant difference in the diagnostic efficacy between the qualitative and semi-quantitative analysis (DeLong Z value = 1.504, P = 0.133; see Tables 2 and 3 and Figure 2).
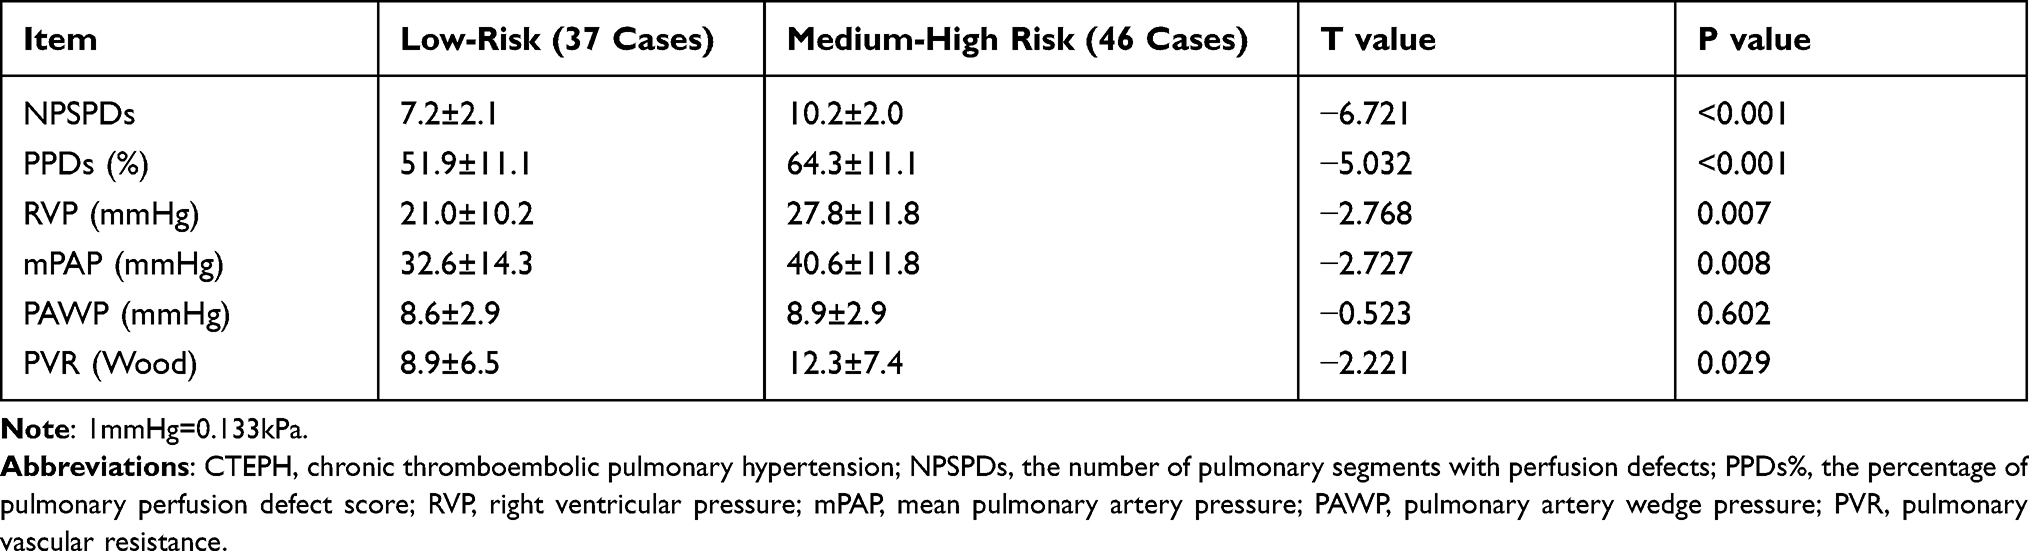 |
Table 2 Differential Analysis V/Q and Hemodynamic Indices After CTEPH Risk Grouping |
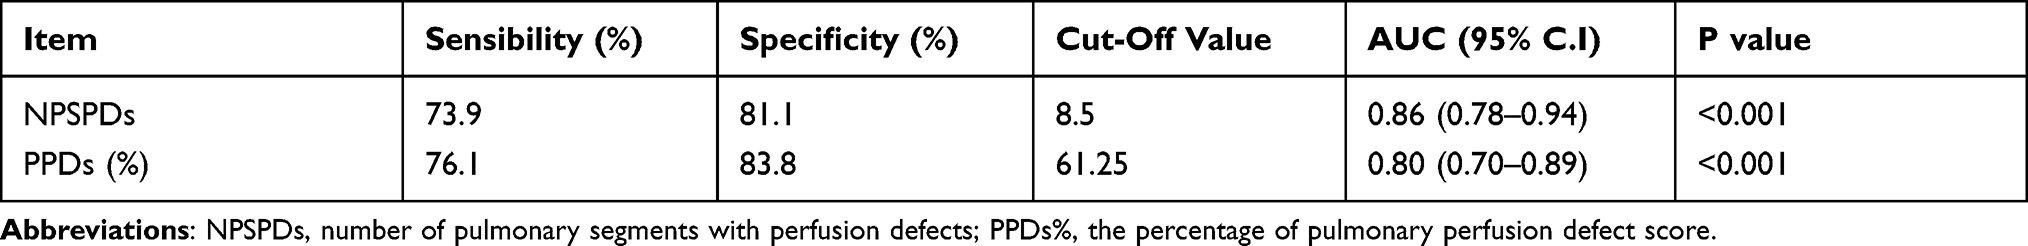 |
Table 3 ROC Curve Analysis After CTEPH Risk Grouping |
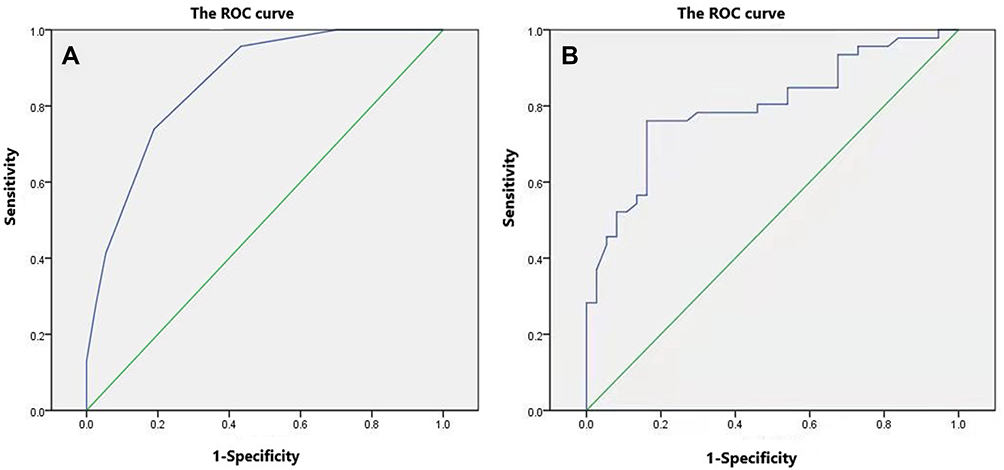 |
Figure 2 The receiving operating characteristic (ROC) curves for the number of pulmonary segments with perfusion defects (NPSPDs) and the percentage of pulmonary perfusion defect score (PPDs%) diagnosis of chronic thromboembolic pulmonary hypertension (CTEPH) risk stratification. The cut-off values of CTEPH risk stratification evaluated by a number of pulmonary perfusion segment defects were 8.5 (A) and 61.25% by PPDs% (B). |
Discussion
CTEPH is caused by the gradual development of chronic thrombosis in the pulmonary artery and the thickening of the pulmonary artery intima, resulting in pulmonary hypertension. China’s Guidelines for the Diagnosis and Treatment of Pulmonary Hypertension (2021) proposed that V/Q imaging had higher sensitivity than CT pulmonary angiography screening for CTEPH, and V/Q imaging showing a normal or low risk could exclude CTEPH (sensitivity 90–100% and specificity 94–100%).14 At present, V/Q imaging approaches mainly include planar, SPECT, and SPECT/CT imaging. Compared with planar imaging, as a 3D-imaging technology, SPECT can improve the sensitivity and specificity for the diagnosis of APE and reduce the percentage15 of uncertain diagnoses by avoiding the influence of peripheral radiation on the deep small lesions and the covering of tissue overlap. In this study, 83 patients with clinically suspected CTEPH were included. The average number of pulmonary segment defects was found to be 8.9 ± 2.5 using SPECT V/Q imaging and 8.3 ± 2.5 by pulmonary angiography, but these differences were not statistically significant. A consistency test was performed for each patient, and the chi-squared analysis revealed no significant difference in 73 of the patients and a significant difference in 10 of the patients (see Figure 3). This proves that the reasons for the differences mainly stem from two sources. First, in the diagnosis of PH using SPECT, there was no holistic view of PH, and perfusion defects caused by PH in the non-pulmonary segments may result in a certain number of false-positive pulmonary segments. Second, pulmonary angiography has limitations in displaying distal segmental defects, and some small lesions were not detected, resulting in differences between the two detection methods for some lesions. This opinion is supported by previous studies.5,16
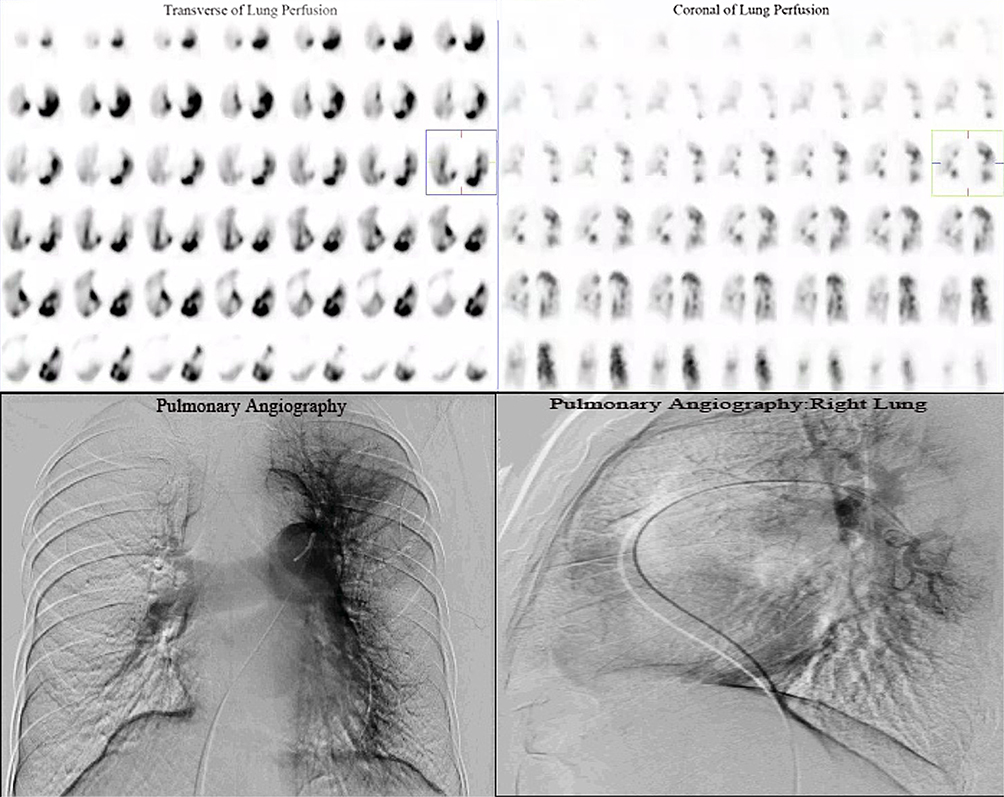 |
Figure 3 Pulmonary perfusion imaging of a patient (female, 68 years old) with chronic thromboembolic pulmonary hypertension (CTEPH). The imaging orientation of the left upper, right upper was in the transverse, coronal plane of lung perfusion imaging. The imaging orientation of the left lower and right lower was pulmonary angiography and pulmonary angiography of the right lung, respectively. A total of 11 pulmonary segment defects inclusive of the posterior segment, apical segment, and anterior segment of the right upper lobe, medial segment and lateral segment of middle lobe, posterior basal segment, lateral basal segment, and anterior basal segment of the lower lobe, as well as the anterior segment, superior lingular segment, and inferior lingular segment of the left upper lobe, were diagnosed using pulmonary perfusion imaging. A total of 12 pulmonary segment defects in all segments of the right lung and lingual segments of the left lung were diagnosed using pulmonary angiography. Using the chi-square test/Fisher’s exact test, P = 0.013, the difference was statistically significant. |
At the pulmonary segment level (a total of 1494 pulmonary segments in 83 patients), the sensitivity, specificity, accuracy, PPV, and NPV of the SPECT V/Q imaging diagnosis were 87.05%, 82.78%, 84.74%, 81.14%, and 88.24%, respectively. It showed a good level of diagnostic accuracy, which is consistent with a study by Özgüven et al.3
The average PPDs% of the 83 patients in this study was 58.8 ± 12.6%, which was positively correlated with hemodynamic indices (mPAP, PVR, and RVP) and negatively correlated with the clinical index (6MWD). PVR and mPAP are important hemodynamic parameters in patients with CTEPH. The elevation in PVR is primarily caused by endothelial dysfunction, vasoconstriction, vascular remodeling, pulmonary arteriole obstruction, and interleukin-1, interleukin-6, and tumor necrosis factors are all pro-inflammatory cytokines related to this disease.17 Dartevelle et al18 reported that in patients with CTEPH, the mortality rate in patients with PVR >900 dyn.s.cm−5 was higher than in patients with PVR <900 dyn.s.cm−5. The study also suggested that patients with PVR <300 dyn.s.cm−5 had a significantly better prognosis after PEA treatment than those with a higher PVR.19 In addition, the increase in mPAP may cause right ventricular dysfunction, which is associated with higher mortality.20,21 The relationship between hemodynamics and the severity of CTEPH disease has been described in relevant literature.22 The 6MWD is the most important index to evaluate patients’ motor ability with CTEPH, and its prognostic value has often been reported in the literature.21,23
Our results showed that PPDs% could reflect the hemodynamic status and the severity of the disease in patients. Özgüven et al24 believed that the range of perfusion defects in V/Q imaging was positively correlated with hemodynamic indices (mPAP and PVR), which is consistent with our study, but was not correlated with 6MWD, which differs from our results. Further studies with larger sample sizes may be required for confirmation.
Previous studies have shown that the PAH risk stratification is also applicable to patients with CTEPH and can reflect the risk of PAH in these patients.25 Based on the PAH risk stratification, of the 83 patients in this study, 37 patients were placed in the low-risk group, 36 in the medium-risk group, and 10 in the high-risk group. As there were few patients in the high-risk group, the medium- and high-risk groups were combined for the discussion, resulting in 46 patients in the medium-high-risk group. The number of pulmonary segments with perfusion defects, PPDs%, mPAP, RVP, and PVR in the medium-high-risk group was higher than in the low-risk group (P < 0.05). The cut-off values for the number of pulmonary segments with a perfusion defect and PPDs% in both groups were 8.5 and 61.25%, respectively. The sensitivity and specificity for evaluating pulmonary segments with a perfusion defect in both risk groups were 73.9% and 81.1%, respectively. The sensitivity and specificity for evaluating PPDs% in both risk groups were 76.1% and 83.8%, respectively. The semi-quantitative analysis of PPDs% was, to some extent, superior to the pulmonary segments with a perfusion defect in terms of sensitivity and specificity. Based on the results of our study, patients with CTEPH can be considered medium-high-risk patients if the number of pulmonary segments with a perfusion defect is >8.5 or the semi-quantitative analysis index of PPDs% is >61.2%. The ROC curves for the number of pulmonary segments with a perfusion defect and the semi-quantitative index of PPDs% were compared for analysis, and no significant difference was found. It was found that, based on existing research data, the traditional vision-based semi-quantitative analysis did not show significant advantages in CTPEH risk stratification when compared with the visual qualitative analysis.
In recent years, with the rapid development of artificial intelligence (AI), the recognition of the pulmonary segment level in nuclear medicine pulmonary perfusion imaging and the accurate registration of CT have come to the fore and are important subjects that require further investigation. With the development of imaging and image analysis technology, assessing the usefulness of AI-based quantitative analysis in diagnosing CTEPH is an important area for future studies to explore. Results in this part of the study have shown that SPECT V/Q imaging can be used for clinical risk stratification in patients with CTEPH and provided a noninvasive imaging reference index for evaluating the severity of the disease. This study has laid the first stone for subsequent prospective post-treatment efficacy evaluation and long-term prognosis clinical studies.
Study Limitations
First, although our study had a large sample size and was based on the gold standard, it was a retrospective, single-center study. Therefore, further prospective studies with larger sample sizes are required to confirm the conclusions. Second, in our study, we found that a few cases of patients with chronic obstructive pulmonary disease exhibited changes in V/Q matching, which may lead to an underestimation of the range of mismatched perfusion defects.
Conclusion
SPECT V/Q imaging has a good diagnostic capacity for CTEPH at the individual and pulmonary segment level compared with the gold standard pulmonary angiography. SPECT V/Q imaging has a high sensitivity, specificity, accuracy, PPV, and NPV in diagnosing CTEPH at the pulmonary segment level. The semi-quantitative analysis index (PPDs%) is positively correlated with the hemodynamic indices (mPAP, PVR, and RVP) and negatively correlated with 6MWD. SPECT V/Q can be used for preoperative risk assessment in patients with CTEPH, which will provide a noninvasive imaging reference index for the clinical assessment of patients.
Ethics Approval and Consent to Participate
This study was conducted with approval from the Ethics Committee of China-Japan Friendship Hospital. This study was conducted in accordance with the declaration of Helsinki. Written informed consent was obtained from all participants.
Acknowledgments
We would like to acknowledge the hard and dedicated work of all the staff that implemented the intervention and evaluation components of the study.
Funding
This study was supported by grant from the Ministry of Science and Technology of China(2018YFC1315100), CAMS Innovation Fund for Medical Sciences (CIFMS) (No. 2018-12M-1-003); China-Japan Friendship Hospital (No. 2019-2-Q/V-73, 2018-1-HL-1); the National Key Research and Development Program of China (No. 2016YFC0905600; 2016YFC0901104); National Natural Science Foundation of China (No. 81970058); and Beijing Natural Science Foundation (No. 7152062).
Disclosure
The authors declare that they have no competing interests.
References
1. Galiè N, Humbert M, Vachiery JL, et al. 2015 ESC/ERS guidelines for the diagnosis and treatment of pulmonary hypertension. The joint task force for the diagnosis and treatment of pulmonary hypertension of the European Society of Cardiology (ESC) and the European Respiratory Society (ERS). Eur Respir J. 2015;46:903–975. doi:10.1183/13993003.01032-2015
2. Pepke-Zaba J, Delcroix M, Lang I, et al. Chronic thromboembolic pulmonary hypertension (CTEPH): results from an international prospective registry. Circulation. 2011;124(18):
3. Ozguvena S, Onesa T, Bozkurtlar E, et al. Chronic thromboembolic pulmonary hypertension: evaluation of V/Q SPECT/CT and V/Q Quotient SPECT findings with postoperative results of pulmonary endarterectomy. Nucl Med Commun. 2021;42(4):369–377. doi:10.1097/MNM.0000000000001348
4. Gopalan D, Delcroix M, Held M. Diagnosis of chronic thromboembolic pulmonary hypertension. Eur Respir Rev. 2017;26:160108. doi:10.1183/16000617.0108-2016
5. Wang M, Wu D, Ma R, et al. Comparison of V/Q SPECT and CT angiography for the diagnosis of chronic thromboembolic pulmonary hypertension. Radiology. 2020;296(2):420–429. doi:10.1148/radiol.2020192181
6. Kylhammar D, Kjellström B, Hjalmarsson C, et al. A comprehensive risk stratification at early follow- up determines prognosis in pulmonary arterial hypertension. Eur Heart J. 2018;39(47):4175–4181. doi:10.1093/eurheartj/ehx257
7. Hoeper MM, Kramer T, Pan Z, et al. Mortality in pulmonary arterial hypertension: prediction by the 2015 European pulmonary hypertension guidelines risk stratification model. Eur Respir J. 2017;50(2):1700740. doi:10.1183/13993003.00740-2017
8. Boucly A, Weatherald J, Savale L, et al. Risk assessment, prognosis and guideline implementation in pulmonary arterial hypertension. Eur Respir J. 2017;50(2):1700889. doi:10.1183/13993003.00889-2017
9. Meyer G, Collignon MA, Guinet F. Comparison of perfusion lung scanning and angiography in the estimation of vascular obstruction in acute pulmonary embolism. Eur J Nucl Med. 1990;17(6–8):315–319. doi:10.1007/BF01268022
10. Derlin T, Kelting C, Hueper K, et al. Quantitation of perfused lung volume using hybrid SPECT/CT allows refining the assessment of lung perfusion and estimating disease extent in chronic thromboembolic pulmonary hypertension. Clin Nucl Med. 2018;43:170–177. doi:10.1097/RLU.0000000000002085
11. Renapurkar RD, Bolen MA, Shrikanthan S. Comparative assessment of qualitative and quantitative perfusion with dual-energy CT and planar and SPECT-CT V/Q scanning in patients with chronic thromboembolic pulmonary hypertension. Cardiovasc Diagn Ther. 2018;8:414–422. doi:10.21037/cdt.2018.05.07
12. Boyden EA. The nomenclature of the bronchopulmonary segments and their blood supply: (as revised by the Seventh International Congress of Anatomists, 1960). Chest. 1961;39:1–6.
13. Bajc M, Schümichen C, Grüning T, et al. EANM guideline for ventilation/perfusion single-photon emission computed tomography (SPECT) for diagnosis of pulmonary embolism and beyond. Eur J Nucl Med Mol Imaging. 2019;46(12):2429–2451. doi:10.1007/s00259-019-04450-0
14. Zhai Z, Wang C. Guidelines for diagnosis and treatment of pulmonary hypertension. National Med J China. 2021;101(1):11–51.
15. Laurence IJ, Redman SL, Corrigan AJ, et al. V/Q SPECT imaging of acute pulmonary embolus-a practical perspective. Clin Radiol. 2012;67(10):941–948. doi:10.1016/j.crad.2012.04.007
16. Wang L, Wang M, Yang T, et al. A prospective, comparative study of ventilation-perfusion planar imaging and ventilation-perfusion SPECT for chronic thromboembolic pulmonary hypertension. J Nucl Med. 2020;61(12):1832–1838. doi:10.2967/jnumed.120.243188
17. Humbert M, Monti G, Brenot F, et al. Increased interleukin-1 and interleukin-6 serum concentrations in severe primary pulmonary hypertension. Am J Respir Crit Care Med. 1995;151:1628–1631. doi:10.1164/ajrccm.151.5.7735624
18. Dartevelle P, Fadel E, Mussot S, et al. Chronic thromboembolic pulmonary hypertension. Eur Respir J. 2004;23:637–648. doi:10.1183/09031936.04.00079704
19. Yıldızeli B, Taş S, Yanartaş M, et al. Pulmonary endarterectomy for chronic thrombo-embolic pulmonary hypertension: an institutional experience. Eur J Cardiothorac Surg. 2013;44:219–227. doi:10.1093/ejcts/ezt293
20. Sandoval J, Bauerle O, Palomar A, et al. Survival in primary pulmonary hypertension. Validation of a prognostic equation. Circulation. 1994;89:1733–1744. doi:10.1161/01.CIR.89.4.1733
21. Saouti N, de Man F, Westerhof N, et al. Predictors of mortality in inoperable chronic thromboembolic pulmonary hypertension. Respir Med. 2009;103:1013–1019.
22. Leone MB, Giannotta M, Palazzini M, et al. A new CT-score as index of hemodynamic changes in patients with chronic thromboembolic pulmonary hypertension. Radiol Med. 2017;122:495–504. doi:10.1007/s11547-017-0750-x
23. Boxer R, Kleppinger A, Ahmad A, et al. The 6-minute walk is associated with frailty and predicts mortality in older adults with heart failure. Congest Heart Fail. 2010;16:208–213. doi:10.1111/j.1751-7133.2010.00151.x
24. Özgüven S, Kesim S, Öksüzoğlu K, et al. Correlation between perfusion abnormalities extent in ventilation/perfusion SPECT/CT with hemodynamic parameters in patients with chronic thromboembolic pulmonary hypertension. Mol Imaging Radionucl Ther. 2021;30(1):28–33. doi:10.4274/mirt.galenos.2020.31932
25. Sandqvist A, Kylhammar D, Bartfay S-E, et al. Risk stratification in chronic thromboembolic pulmonary hypertension predicts survival. Scand Cardiovasc J. 2021;55(1):43–49. doi:10.1080/14017431.2020.1783456
 © 2021 The Author(s). This work is published and licensed by Dove Medical Press Limited. The full terms of this license are available at https://www.dovepress.com/terms.php and incorporate the Creative Commons Attribution - Non Commercial (unported, v3.0) License.
By accessing the work you hereby accept the Terms. Non-commercial uses of the work are permitted without any further permission from Dove Medical Press Limited, provided the work is properly attributed. For permission for commercial use of this work, please see paragraphs 4.2 and 5 of our Terms.
© 2021 The Author(s). This work is published and licensed by Dove Medical Press Limited. The full terms of this license are available at https://www.dovepress.com/terms.php and incorporate the Creative Commons Attribution - Non Commercial (unported, v3.0) License.
By accessing the work you hereby accept the Terms. Non-commercial uses of the work are permitted without any further permission from Dove Medical Press Limited, provided the work is properly attributed. For permission for commercial use of this work, please see paragraphs 4.2 and 5 of our Terms.