")
Back to Journals » Diabetes, Metabolic Syndrome and Obesity » Volume 14
A Differential Study into Body Fat in Healthy and Hypertensive Populations Using Multiple Indexes
Received 16 September 2020
Accepted for publication 23 December 2020
Published 20 January 2021 Volume 2021:14 Pages 279—284
DOI https://doi.org/10.2147/DMSO.S267366
Checked for plagiarism Yes
Review by Single anonymous peer review
Peer reviewer comments 3
Editor who approved publication: Prof. Dr. Juei-Tang Cheng
Ran Wang,1 Qiuzhen Wang2
1Department of Clinical Nutrition, Weifang People’s Hospital, Weifang 261041, People’s Republic of China; 2Department of Public Hygiene, Qingdao University, Qingdao 266021, People’s Republic of China
Correspondence: Qiuzhen Wang
Department of Public Hygiene, Qingdao University, No. 38 of Dengzhou Road, Shibei District, Qingdao 266021, People’s Republic of China
Tel/Fax +86 0532 8299 1011
Email [email protected]
Objective: The present study aims to investigate the difference in body fat in healthy and hypertensive populations with the use of five evaluation indexes.
Methods: A total of 895 healthy subjects, who underwent physical examination and body composition analysis in the Physical Examination Center of Weifang People’s Hospital from January 2016 to January 2017, were selected as the study subjects. Among these subjects, 527 were male and 368 were female, and their age ranged from 18 to 60 years, with a mean age of 43.12 ± 9.34. They were divided into four groups, according to their blood pressure and biochemical examination results, a male healthy male group, a hypertensive male group, a healthy female group and a hypertensive female group. Their height, weight, waist and hip circumference were measured, and their body composition was analyzed to obtain data for body fat percentage and visceral fat area. The data and indexes were statistically analyzed using SPSS 18.0 statistical software, and P< 0.05 was considered to be statistically significant.
Results: The difference in body mass index (BMI) between the healthy population and the hypertensive population was statistically significant (P< 0.05). The difference in waist circumference between the healthy male group and the hypertensive male group was statistically significant (P< 0.05). The difference in waist-to-hip ratio between the healthy population and hypertensive population was statistically significant (P< 0.05). The difference in body fat percentage and visceral fat area between the healthy population and hypertensive population was statistically significant (P< 0.05).
Conclusion: The five indexes, namely the BMI, waist circumference, waist-to-hip ratio, body fat percentage, and visceral fat area, demonstrated statistically significant differences between the healthy population and the hypertensive population. However, since the evaluation results of some of the indexes also differed from available critical values, further validation is necessary.
Keywords: body mass index, waist circumference, waist-hip ratio, body fat percentage, visceral fat area, bioimpedance
Introduction
With the development of the economy, people’s eating habits and lifestyles have changed.1 The intake of sugar has generally increased, while the consumption of high-fat food has significantly risen, resulting in a significant increase in average body fat.1 This has become an important factor in the notable growth in the incidence of chronic diseases, such as hypertension, in recent years.1–3 However, the evaluation methods and evaluation indexes for fat mass in vivo have not improved, which seriously affects the options available for intervention and their effects. It also has an impact on the timing of any intervention and can even result in it being excessive as well.3 Therefore, this study aims to determine whether there is a statistically significant difference between the healthy population and the hypertensive population in the anthropometric indexes widely used at present. These include the BMI, waist circumference, waist-to-hip ratio and bioelectric impedance (body fat percentage and visceral fat area).
Methods
Study Subjects
Between January 2016 and January 2017, a total of 895 people, who were all Han Chinese, were screened and selected as study subjects, according to certain inclusion and exclusion criteria. These subjects then visited the Physical Examination Center in Weifang, Shandong, China, for physical examinations and body composition analyses. According to the blood pressure and biochemical examination results, these study subjects were divided into four groups: a healthy male group, a hypertensive male group, a healthy female group, and a hypertensive female group.
The study was conducted in accordance with the Declaration of Helsinki (as revised in 2013). The study was approved by the Ethics Committee of Weifang Peoples’ Hospital and informed consent was given by all the patients.
Inclusion and Exclusion Criteria
Inclusion Criteria
Subjects were 18 to 60 years of age, with a mean age of 43.12 ± 9.34 years. Those from the healthy male group and the healthy female group received a biochemical examination after >6 hours of fasting. The results revealed that their fasting blood glucose, triglyceride, blood pressure, uric acid and other indexes were normal, and no fatty liver was reported. Subjects who met the criteria for the diagnosis of hypertension were divided into the male hypertensive group and the female hypertensive group. Transient elevated blood pressure was ruled out by their medical history.
Exclusion Criteria
The exclusion criteria were as follows: subjects who were <18 years old and >60 years old, and received a physical examination; subjects suffering from endocrine obesity and diabetes; pregnant women; subjects who were undergoing endocrine therapy; professional athletes; subjects who were losing weight with sizeable and rapid changes in body fat.
Diagnostic Criteria
The criteria used for the diagnosis of hypertension were those recommended in the Guidelines for the Prevention and Treatment of Hypertension 2005, and were as follows: systolic blood pressure ≥140 mmHg and/or diastolic blood pressure ≥90 mmHg.
Methods
Physical Examination and Blood Pressure Measurement
On the day of the physical examination, the subjects were required to wear light clothing and have an empty stomach. Their height, weight, waist circumference and hip circumference were measured, and their blood pressure was taken after a five-minute rest. The right arm alone was measured with an Omron electronic sphygmomanometer, and the measurement was not repeated that day. The subjects of the experimental groups were those who were diagnosed with hypertension.
Detection of Body Composition
The body composition analyzer Inbody720 of Biospace was used to obtain the body fat percentage and visceral fat area of the subjects by importing 100 μA and 500 μA of constant current at five frequencies (5, 50, 250 and 500 kHz), in order to detect the electrical impedance of each part of the body, obtain the body fat mass, and automatically calculate the body fat percentage and visceral fat area data.
Statistical Analysis
A comparison was made between the results of the healthy male group and the hypertensive male group, the healthy female group and the hypertensive female group, the healthy male group and the healthy female group, and the hypertensive male group and the hypertensive female group. The results were statistically analyzed using a t-test and SPSS 18.0 statistical software, and P<0.05 was considered statistically significant.
Results
Basic Information
These subjects were divided into four groups, according to the blood pressure and biochemical examination results: healthy male group (n=273), hypertensive male group (n=254), healthy female group (n=308), and hypertensive female group (n=60). The healthy male group was 41.30±9.48 years old, the hypertensive male group was 45.48±7.99 years old, the healthy female group was 41.26±9.36 years old, and the hypertensive female group was 50.97±7.11 years old.
A Comparison of the Evaluation Results for Body Fat by Index
As presented in Tables 1 and 2, the study results showed that the difference in waist circumference between the healthy male group and the hypertensive male group was the only statistically significant difference (P<0.05). The difference in waist-to-hip ratio was statistically significant (P<0.05) between the healthy male group and the healthy female group, and the healthy female group and the hypertensive female group. The difference in BMI was only statistically significant (P<0.05) between the healthy female group and the hypertensive female group. The difference in body fat area was not statistically significant (P>0.05) between any of these groups. The difference in visceral fat area was statistically significant (P<0.05) between the healthy male group and the hypertensive male group, the healthy female group and the hypertensive female group, and the healthy male group and the healthy female group.
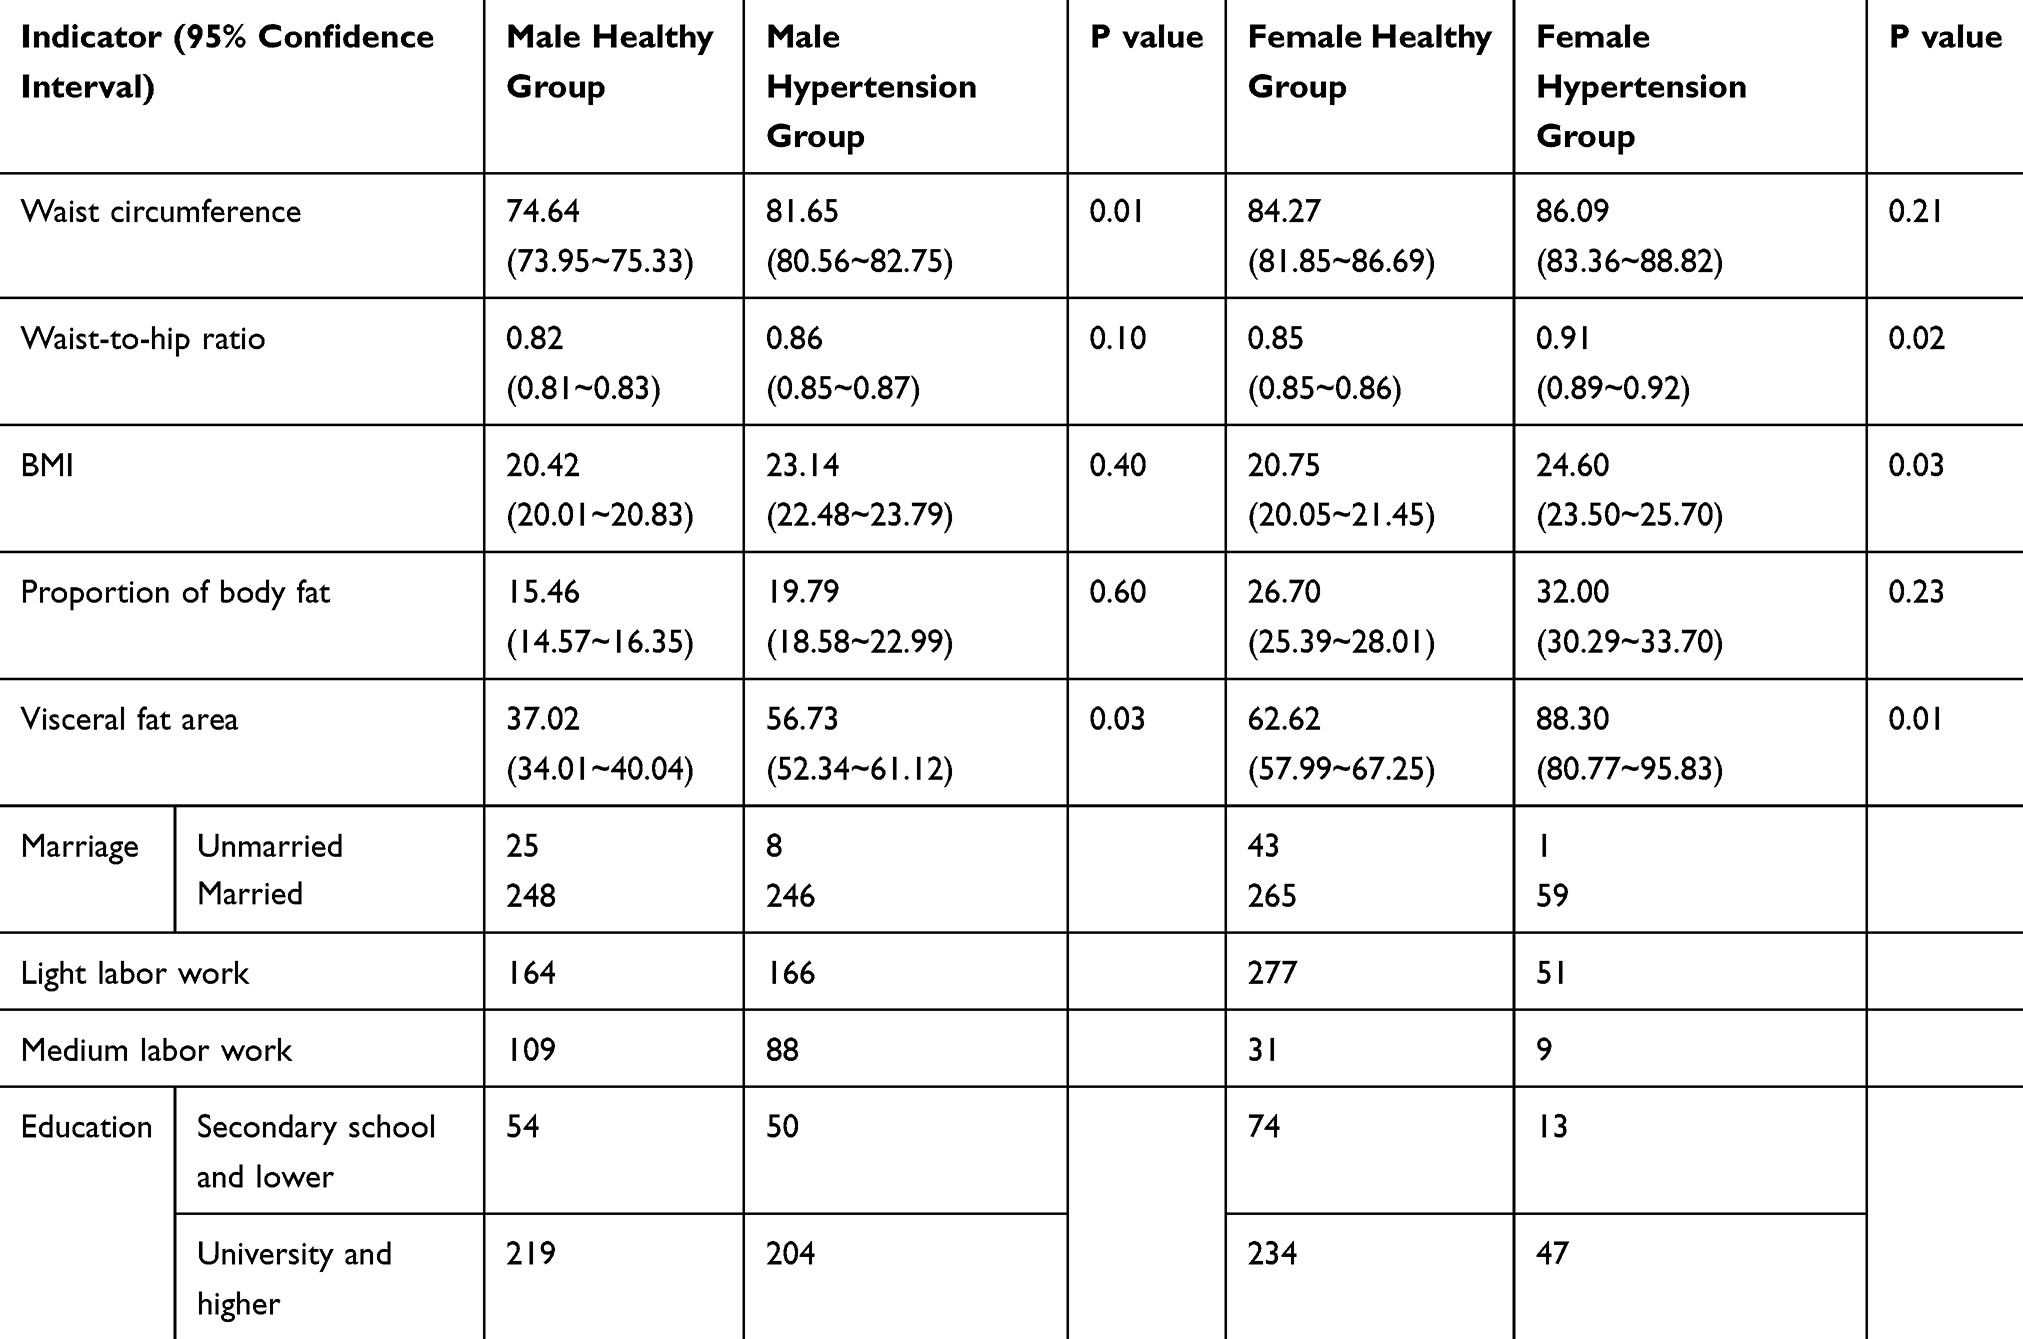 |
Table 1 The Means of the Indexes and the 95% Confidence Intervals of the Different Gender Groups |
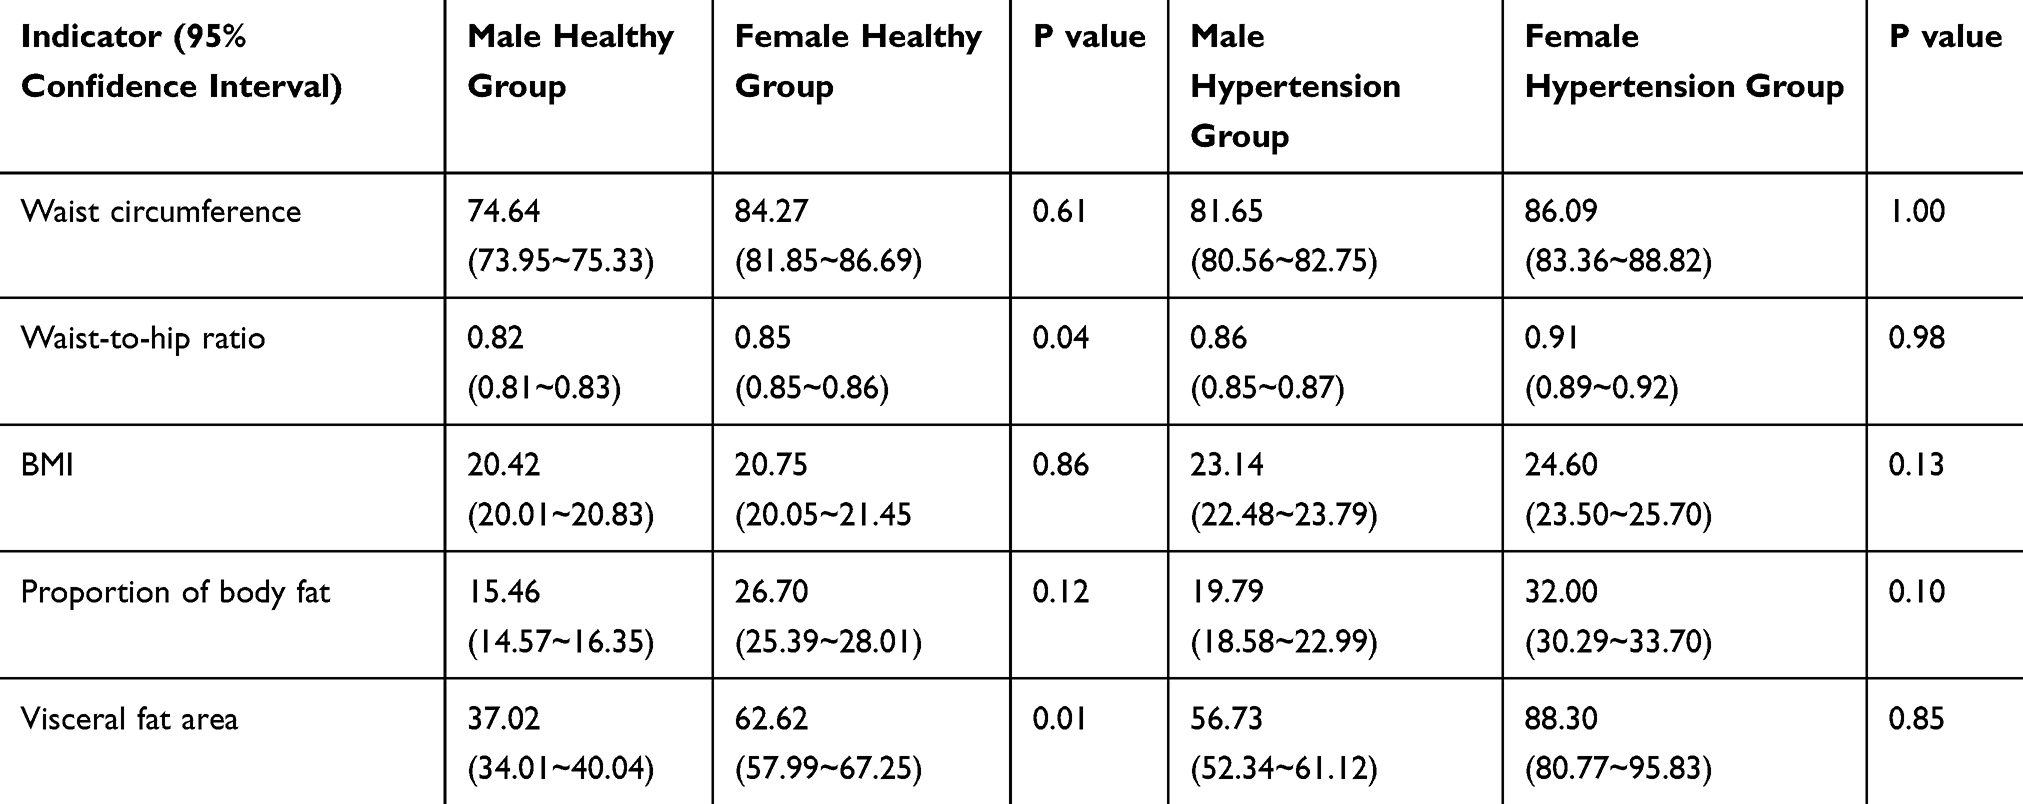 |
Table 2 The Means of the Indexes and the 95% Confidence Intervals of the Different Healthy Groups |
Discussion
With the development of the social economy and the improvement of living standards, people’s diets and lifestyles have changed a great deal, and their body fat mass has sharply increased, followed by a significant increase in the incidence of various chronic diseases represented by hypertension. Therefore, the early detection of excessive body fat and the use of effective intervention can significantly reduce the incidence of chronic diseases, such as hypertension. This is why in clinical practice medical staff often ask patients to reduce their body fat. However, to make a difference it is necessary to have appropriate methods to assess body fat levels and changes. Whilst the total body fat mass of the population has risen, the evaluation methods and evaluation indexes for fat mass in vivo still remain in the past, which seriously affects the options for intervention, the timing of intervention, and the evaluation of intervention effects. Therefore, this study is investigating the anthropometric indexes widely used at present, the BMI, waist circumference, waist-to-hip ratio and bioelectric impedance (body fat percentage and visceral fat area), in order to provide some basis for the application of relevant indexes in the future.
The waist circumference, waist-to-hip ratio and visceral fat area mainly reflect the distribution of fat in the abdomen. In the present study, the difference in waist circumference was statistically significant (P<0.05) only between the healthy male group and the hypertensive male group. The difference in waist-to-hip ratio was statistically significant (P<0.05) between the healthy male group and the healthy female group, and the healthy female group and the hypertensive female group. This indicates that waist circumference has considerable significance in the evaluation of male abdominal fat, while the waist-to-hip ratio has great significance in the evaluation of female abdominal fat. Previous studies have suggested that abdominal obesity is more likely to lead to chronic diseases, such as hypertension,4–7 and the results of the present study also support this point of view. However, it has also been found that the evaluation results for waist circumference and waist-to-hip ratio are not consistent. Further studies are also needed to determine the critical values of waist circumference, in order to differentiate them according to gender.
BMI is the most commonly used index to judge overweight or obesity. However, the difference was statistically significant (P<0.05) only between the healthy female group and the hypertensive female group, which indicates that BMI has a weak significance in assessing body fat in different populations.8–10 In addition, it has been noted that BMI cannot distinguish muscle from fat, which may lead to misjudging subjects with well-developed muscles as obese, or with muscle-reducing obesity as normal.11–13 Other indicators need to be used in combination to avoid misjudgment. The present study has also revealed that most of the study subjects with hypertension had a BMI within 24–28 kg/m2. Determining whether the differentiation of available BMI as being overweight or obese would affect the education and prevention of chronic diseases, such as hypertension, is worthy of further discussion.
The body fat percentage measured by the proportion of body fat, and the difference of the index was not statistically significant (P>0.05) between the groups in the present study, which is not completely consistent with previous studies.14,15 Furthermore, the difference in gender was not statistically significant in the present study. This may be because the sample size of the present study is not large enough, or because the previous study data were slightly different from the actual physical condition of these subjects at the present stage. Thus, the significance of body fat percentage in the evaluation of body fat in different populations needs to be further studied.
The fat condition of abdominal organs was assessed by measuring the visceral fat area, and the differences were statistically significant (P<0.05) between the healthy male group and the hypertensive male group, the healthy female group and the hypertensive female group, and the healthy male group and the healthy female group. This is basically consistent with previous studies,16 indicating its usefulness in assessing fat conditions in different populations. In addition, the present study showed that there were differences in the visceral fat area between healthy men and healthy women, indicating that it may be necessary to distinguish a separate critical value for each gender.
The present study has a number of limitations. The ages of the subjects in the present study ranged from 18 to 60 years so further studies are needed to determine whether the conclusions are also applicable to the young (<18 years old) and the elderly (>60 years old). In addition, local diet and customs may have some impact on these research results. Therefore, a multi-center study in different regions should be considered to further determine whether these five indexes can be used to evaluate the difference in body fat, and reconfirm the normal range and gender differentiation.
Conclusions
The analysis of the results of the present study shows a number of findings. First, the visceral fat area and waist circumference were not exactly the same, indicating that waist circumference cannot replace visceral fat area for evaluation. Second, the visceral fat area of men was consistent with the result for waist circumference, while that of women was inconsistent, indicating that the waist circumference of men may be more affected by the visceral fat condition than the waist circumference of women. In addition, the difference in fat distribution among men is greater than the total fat. It would also seem that evaluating the fat condition of the population using a single index showed less significance, and therefore the combined use of two or more indexes is preferable. Lastly, the available normal range and gender differentiation of the five indicators may no longer apply to the actual situation of the population under present socio-economic conditions.
Acknowledgments
We are particularly grateful to all the people who have given us help on our article.
Funding
There is no funding to report.
Disclosure
The authors declare that they have no competing interests.
References
1. Kolanowski J. Obesity and hypertension: from pathophysiology to treatment. Int J Obes Relat Metab Disord. 1999;23:142–146. doi:10.1038/sj.ijo.0800794
2. Seravalle G, Grassi G. Obesity and hypertension. Pharmacol Res. 2017;122:1–7. doi:10.1016/j.phrs.2017.05.013
3. Mikhail N, Golub MS, Tuek ML. Obesity and hypertension. Prog Cardiovasc Dis. 1999;42:39–58. doi:10.1016/S0033-0620(99)70008-3
4. Neovius M, Linné Y, Rossner S. BMI, waist-circumference and waist-hip-ratio as diagnostic tests for fatness in adolescents. Int J Obes (Lond). 2005;29:163–169. doi:10.1038/sj.ijo.0802867
5. Zhan G, Dong L, Huayu H, et al. Body mass index, waist circumference, and waist-to-height ratio for prediction of multiple metabolic risk factors in Chinese elderly population. Sci Rep. 2018;10(8):385. doi:10.1038/s41598-017-18854-1
6. Savva SC, Lamnisos D, Kafatos AG. Predicting cardiometabolic risk: waist-to-height ratio or BMI: a meta-analysis. Diabetes Metab Syndr Obes. 2013;24:403–419. doi:10.2147/DMSO.S34220
7. Yu Q, Pang B, Liu R, et al. Appropriate body mass index and waist-hip ratio cutoff points for overweight and obesity in adults of Northeast China. Iran J Public Health. 2017;46:1038–1045.
8. Romero-Corral A, Somers VK, Sierra-Johnson J, et al. Diagnostic performance of body mass index to detect obesity in patients with coronary artery disease. Eur Heart J. 2007;28:2087–2093. doi:10.1093/eurheartj/ehm243
9. Weatherald J, Huertas A, Boucly A, et al. The association between body mass index and obesity with survival in pulmonary arterial hypertension. Chest. 2018;154:872–881. doi:10.1016/j.chest.2018.05.006
10. Zhang ZQ, Deng J, He LP, et al. Comparison of various anthropometric and body fat indices in identifying cardiometabolic disturbances in Chinese men and women. PLoS One. 2013;12. doi:10.1371/journal.pone.0070893
11. Stenholm S, Harris TB, Rantanen T, et al. Sarcopenic obesity: definition,cause and consequences. Curr Opin Clin Nutr Metab Care. 2008;11693–11700.
12. Di Monaco M, Vallero F, Di Monaco R, et al. Prevalence of sarcopenia and its association with osteoporosis in 313 older women following a hip fracture. Arch Gerontol Geriatr. 2011;52:71–74. doi:10.1016/j.archger.2010.02.002
13. Ruiz JR, Sui X, Lobelo F, et al. Association between muscular strength and mortality in men: prospective cohort study. BMJ. 2008;337:92–95. doi:10.1136/bmj.a439
14. Van Gaal LF, Maggioni AP. Overweight, obesity, and outcomes: fat mass and beyond. Lancet. 2014;383:935–936. doi:10.1016/S0140-6736(13)62076-0
15. Lavie CJ, De Schutter A, Patel DA, et al. Body composition and survival in stable coronary heart disease: impact of lean mass index and body fat in the “obesity paradox”. J Am Coll Cardiol. 2012;60:1374–1380. doi:10.1016/j.jacc.2012.05.037
16. Chandra A, Neeland IJ, Berry JD, et al. The relationship of body mass and fat distribution with incident hypertension: observations from the Dallas Heart Study. J Am Coll Cardiol. 2014;64:997–1002. doi:10.1016/j.jacc.2014.05.057
 © 2021 The Author(s). This work is published and licensed by Dove Medical Press Limited. The full terms of this license are available at https://www.dovepress.com/terms.php and incorporate the Creative Commons Attribution - Non Commercial (unported, v3.0) License.
By accessing the work you hereby accept the Terms. Non-commercial uses of the work are permitted without any further permission from Dove Medical Press Limited, provided the work is properly attributed. For permission for commercial use of this work, please see paragraphs 4.2 and 5 of our Terms.
© 2021 The Author(s). This work is published and licensed by Dove Medical Press Limited. The full terms of this license are available at https://www.dovepress.com/terms.php and incorporate the Creative Commons Attribution - Non Commercial (unported, v3.0) License.
By accessing the work you hereby accept the Terms. Non-commercial uses of the work are permitted without any further permission from Dove Medical Press Limited, provided the work is properly attributed. For permission for commercial use of this work, please see paragraphs 4.2 and 5 of our Terms.