")
Back to Journals » Diabetes, Metabolic Syndrome and Obesity » Volume 12
A Differential Diagnosis Model For Diabetic Nephropathy And Non-Diabetic Renal Disease In Patients With Type 2 Diabetes Complicated With Chronic Kidney Disease
Authors Yang Z, Feng L , Huang Y, Xia N
Received 14 July 2019
Accepted for publication 16 September 2019
Published 30 September 2019 Volume 2019:12 Pages 1963—1972
DOI https://doi.org/10.2147/DMSO.S223144
Checked for plagiarism Yes
Review by Single anonymous peer review
Peer reviewer comments 3
Editor who approved publication: Prof. Dr. Juei-Tang Cheng
Zhenhua Yang,1 Luhuai Feng,2 Yu Huang,3 Ning Xia4
1Department of Nephrology, The First Affiliated Hospital of Guangxi Medical University, Nanning, People’s Republic of China; 2Department of General Internal Medicine, The Affiliated Tumor Hospital of Guangxi Medical University, Nanning, People’s Republic of China; 3Department of Nephrology, The People’s Hospital of Wuzhou, Wuzhou, People’s Republic of China; 4Department of Endocrinology and Metabolism, The First Affiliated Hospital of Guangxi Medical University, Nanning, People’s Republic of China
Correspondence: Ning Xia
Department of Endocrinology and Metabolism, The First Affiliated Hospital of Guangxi Medical University, Nanning 530021, Guangxi Zhuang Autonomous Region, People’s Republic of China
Tel +8613707714058
Fax +860771-5356707
Email [email protected]
Purpose: Differentiating between diabetic nephropathy (DN) and non-diabetic renal disease (NDRD) is difficult and inefficient. The aim of the present study was to create a model for the differential diagnosis of DN and NDRD in patients with type 2 diabetes mellitus (T2DM).
Patients and methods: We consecutively screened 213 patients with T2DM complicated with chronic kidney disease, who underwent renal biopsy at The First Affiliated Hospital of Guangxi Medical University (Nanning, China) between 2011 and 2017. According to the pathological results derived from the renal biopsy, the patients were divided into three groups (74, 130, and nine in the DN, NDRD, and NDRD superimposed with DN group, respectively). Clinical and laboratory data were compared and a diagnostic model was developed based on the following logistic regression model: logit(P)=β0+β1X1+β2X2+ … +βmXm.
Results: We observed a high incidence of NDRD (61.0% of all patients), including various pathological types; the most common type was idiopathic membranous nephropathy. By comparing clinical variables, we identified a number of differences between DN and NDRD. Logistic regression analyses showed that the following variables were statistically significant: the absence of diabetic retinopathy (DR), proteinuria within the non-nephrotic range, the absence of anemia and an estimated glomerular filtration rate (eGFR) ≥90 mL/min/1.73 m2. We subsequently constructed a diagnostic model for predicting NDRD, as follows: PNDRD=1/[1+exp(−17.382–.339×DR−1.274×Proteinuria−2.217×Anemia-1.853×eGFR−0.993×DM+20.892Bp)]. PNDRD refers to the probability of a diagnosis of NDRD (a PNDRD≥0.5 predicts NDRD while a PNDRD<0.5 predicts DN); while DM refers to the duration of diabetes. This model had a sensitivity of 95.4%, a specificity of 83.8%, and the area under the receiver operating characteristic curve was 0.925.
Conclusion: Our diagnostic model may facilitate the clinical differentiation of DN and NDRD, and assist physicians in developing more effective and rational criteria for kidney biopsy in patients with T2DM complicated with chronic kidney disease.
Keywords: type 2 diabetes mellitus, diabetic nephropathy, non-diabetic nephropathy, puncture biopsy, formula, logistic regression
Introduction
Diabetes is a growing global health problem. According to data published by the International Diabetes Federation, there are 425 million diabetic patients (aged 20–79 years) worldwide; by 2045, this number is expected to rise to 693 million.1 Diabetic nephropathy (DN) is a common complication of diabetes and is becoming increasingly more prevalent as the incidence of diabetes increases. DN has become the leading cause of chronic kidney disease (CKD) and end-stage renal disease (ESRD).1,2 Even in the early stages of DN, the risk for cardiovascular events is significantly increased. This is a major problem as cardiovascular events are the main drivers of a decline in human longevity and quality of life.3,4 Historically, the diagnosis of DN relied predominantly on clinical diagnosis. However, following developments in renal biopsy technology, it became apparent that some patients with a clinical diagnosis of DN, particularly those with type 2 diabetes mellitus (T2DM), did not conform to the expected results from the pathological diagnosis. Patients with diabetes may also develop non-diabetic renal disease (NDRD), which may be present alone or in combination with DN. Interestingly, the presence of NDRD in diabetic patients is known to differ according to geographic location and ethnicity.5–7 According to statistical data, approximately 50% of diabetic patients worldwide have CKD; however, only 20–40% of the patients have DN.1–9
DN has a clear natural course and develops in patients who have had diabetes for >10 years. These patients develop microalbuminuria after initial glomerular hyperperfusion, which gradually develops into dominant proteinuria and finally progresses to ESRD.10 However, most of these studies were conducted in populations of patients with T1DM. This process is not typical in patients with T2DM, owing to the insidious onset of T2DM. In recent years, epidemiological studies of T2DM patients with DN reported some significant changes. For example, a series of studies observed a decreasing incidence of proteinuria and diabetic retinopathy (DR) in patients with DN.11–14 Another study reported a trend showing that T2DM and DN is increasingly being reported in younger patients.8
A number of studies found that, compared with patients with DN, those with NDRD or DN+NDRD showed significant improvements in proteinuria and renal function following systemic treatment with glucocorticoids, immunosuppressive agents, cytotoxic drugs, drugs controlling blood pressure, and lipids. Furthermore, despite the involvement of different causative factors and timely treatment, patients with DN did not show significant improvements in renal function compared with patients with NDRD or DN+NDRD; renal survival was also reported to be lower in patients with DN.15–17 Consequently, there is an urgent need for clinicians to develop a detailed understanding of the pathophysiology of DN and to be able to accurately distinguish between diabetic patients with NDRD and DN.
At present, the gold standard for the diagnosis of DN is through the pathological examination of renal biopsies. However, renal biopsy is an invasive procedure characterized by a range of limitations. Notably, renal biopsy is difficult to perform in non-specialist hospitals. In the present study, we determined the pathological renal types and clinical features of 213 patients with T2DM complicated with CKD and created a model for the differential diagnosis of DN and NDRD in patients with T2DM. This model may serve as reference material for medical staff in institutions, in which kidney biopsy technology is not available.
Materials And Methods
Inclusion And Exclusion Criteria
This study was approved by the Ethics Committee of the First Affiliated Hospital of Guangxi Medical University (approval number: 2019(KY-E-066)). All patients and authorized signatories provided written informed consent. This study was conducted in accordance with the tenets of the Declaration of Helsinki. We consecutively screened patients with T2DM complicated with CKD who had undergone renal biopsy at the First Affiliated Hospital of Guangxi Medical University between November 2011 and September 2017. Subsequently, we retrospectively analyzed the clinicopathological features of these patients. The diagnosis of T2DM in our institution complies with the criteria established by the American Diabetes Association.18 The diagnostic criteria for CKD were renal structural impairment and dysfunction caused by a variety of factors for at least 3 months, including normal and abnormal glomerular filtration rate (GFR), pathological damage, blood or urine components, abnormalities, and imaging abnormalities, or an unexplained GFR <60 mL/min/1.73 m2 that persisted for 3 months. We excluded patients with infections or kidney stones, and those who underwent renal replacement therapy prior to biopsy. The inclusion criteria were as follows: for all patients diagnosed with T2DM complicated with CKD not undergoing renal replacement therapy (eg, hemodialysis, peritoneal dialysis, and kidney transplantation), we recommended renal biopsy pathological examination for a clear diagnosis, after excluding contraindications for renal biopsy (ie, inability to correct an obvious bleeding tendency, inability to correct severe hypertension, active kidney infection, etc).
Clinical Parameters
We collated all baseline clinical parameters collected at the time of renal biopsy, including gender, age, body mass index, the presence/absence of hypertension, the duration of DM (which refers to the time of hospitalization from first diagnosis to renal biopsy), the presence/absence of DR, level of hemoglobin A1c, hematuria, proteinuria over 24 h, albumin, estimated GFR (eGFR), level of serum creatinine, etc. Approximately one-third of the patients were referred to other laboratories for the detection of anti-phospholipase A2 receptor antibodies. Therefore, we performed tumor marker analysis for each patient (eg, CA199, CA153, CA125, alpha fetoprotein, carcino-embryonic antigen, etc), as well as chest computed tomography, abdominal color Doppler ultrasound or computed tomography to identify membranous nephropathy caused by occult malignancy.
The diagnosis and measurement of hypertension in our institution complies with the 2010 Chinese guidelines for the management of hypertension.19 Hypertension was defined as systolic blood pressure ≥140 mmHg and/or diastolic blood pressure ≥90 mmHg in the absence of antihypertensive drugs. Clinicians could select calcium antagonists, angiotensin-converting enzyme inhibitors or angiotensin II receptor antagonists, diuretics, β-blockers, etc. Depending on the condition of the patient, a fixed low-dose combination of multiple antihypertensive agents could be used. The duration of DM refers to the time of hospitalization from first diagnosis to renal biopsy. The estimated GFR (eGFR) was calculated using the Chronic Kidney Disease Epidemiology Collaboration (CKD—EPI) equation.20
Renal Pathology
All kidney specimens were fixed, dehydrated, embedded in wax, and sectioned. Histological sections were then used for staining, light microscopy, immunofluorescence, and electron microscopy. These procedures were performed by the same group of pathologists and clinical pathology discussion was conducted by the same group of experienced nephrologists. The pathological diagnosis of DN was based on the pathological criteria for DN, as published by the Renal Pathology Society in 2010: mild or nonspecific changes observed through light microscopy along with electron microscopy-proven glomerular basement membrane thickening, mesangial expansion, nodular sclerosis, or advanced diabetic glomerulosclerosis.21 According to the pathological results of the renal biopsy, the patients were divided into a DN group, a NDRD group, and a NDRD superimposed with DN (NDRD+DN) group.
Statistical Analysis
Statistical analysis was performed using the SPSS version 24.0 (IBM Corp., Armonk, NY, USA). For continuous variables, data are presented as median and range [M (P25, P75)] or mean ± standard deviation. For categorical variables, differences between groups were assessed using the chi-squared test. Continuous variables were analyzed using the two sample t-test or by analysis of variance. Univariate and multivariate logistic regression analyses were used to screen factors that were significantly associated with the diagnosis of NDRD. A P<0.05 denoted statistical significance. Significant factors were subsequently included in a differential diagnostic model, which we developed from the logistic regression model: logit(P)= +
+ +
+ + … +
+ … + 22 (where xm is a clinical predictor, β0 is a constant, β1-m is an estimator, and P is the probability of NDRD diagnosis).
Results
Clinicopathological Characteristics Of The Study Population
The pathological analysis of renal biopsies showed that 74 patients (34.7%) had DN alone, 130 patients (61.0%) had NDRD, and nine patients (4.2%) had DN+NDRD. In total, there were 16 types of NDRD, including primary and secondary glomerular diseases. Idiopathic membranous nephropathy (IMN) was the most common type of lesion, accounting for 46% of all patients with NDRD. The second and third most common lesions were focal segmental glomerular sclerosis and IgA nephropathy, accounting for 15% and 14% of cases, respectively. The most common type of lesion in the DN+NDRD group was also IMN, accounting for 77.8% of the cases. The types and proportions of lesions detected across our cohort are shown in Table 1.
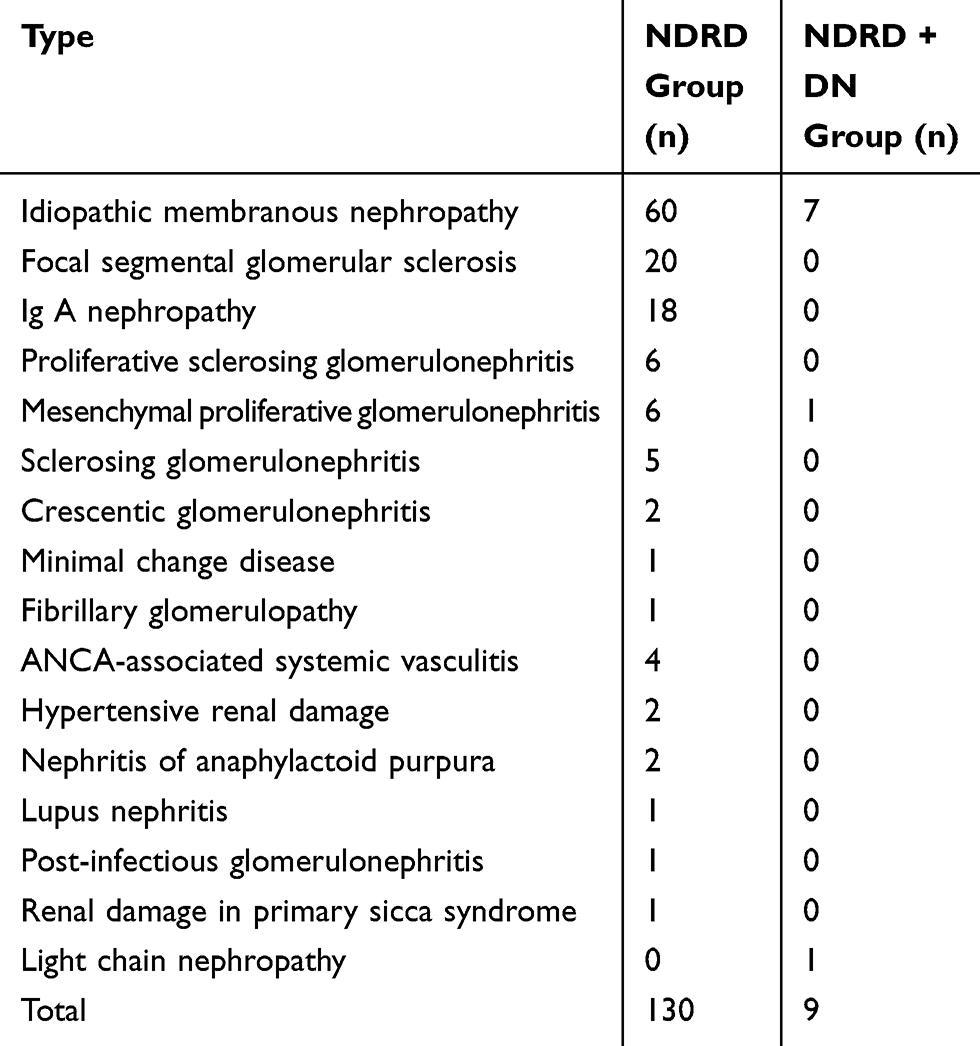 |
Table 1 Pathological Findings Regarding The Type Of Glomerular Lesions In The NDRD And NDRD+DN Groups |
The baseline clinical characteristics in the DN, NDRD, and NDRD+DN groups are shown in Table 2. Of the 213 patients, 138 (64.8%) were males and 75 (35.2%) were females; therefore, the ratio of males to females was 1.8:1. The age of patients ranged from 48 to 62 years (median: 56 years). The duration of diabetes ranged from 0 to 276 months (median: 48 months). In total, 65.4% of the patients had DR, while 81.2% of the patients were hypertensive. eGFR ranged from 29.5 to 87.0 mL/min/1.73 m2 with a median of 61.6 mL/min/1.73 m2. In total, 101 patients (49.3%) had nephrotic proteinuria (urinary protein over 24 h >3.5 g/d); only three patients were negative for urinary protein. Of the patients, 103 (48.3%) had hypoalbuminemia (plasma albumin <30 g/L), and 130 (61%) had microscopic hematuria. Moreover, 116 patients (54.5%) showed varying degrees of anemia, and 109 patients (64.9%) had hemoglobin A1c levels ≥6.5%. Finally, 94.9% of the patients showed varying degrees of 25-hydroxyvitamin D3 deficiency.
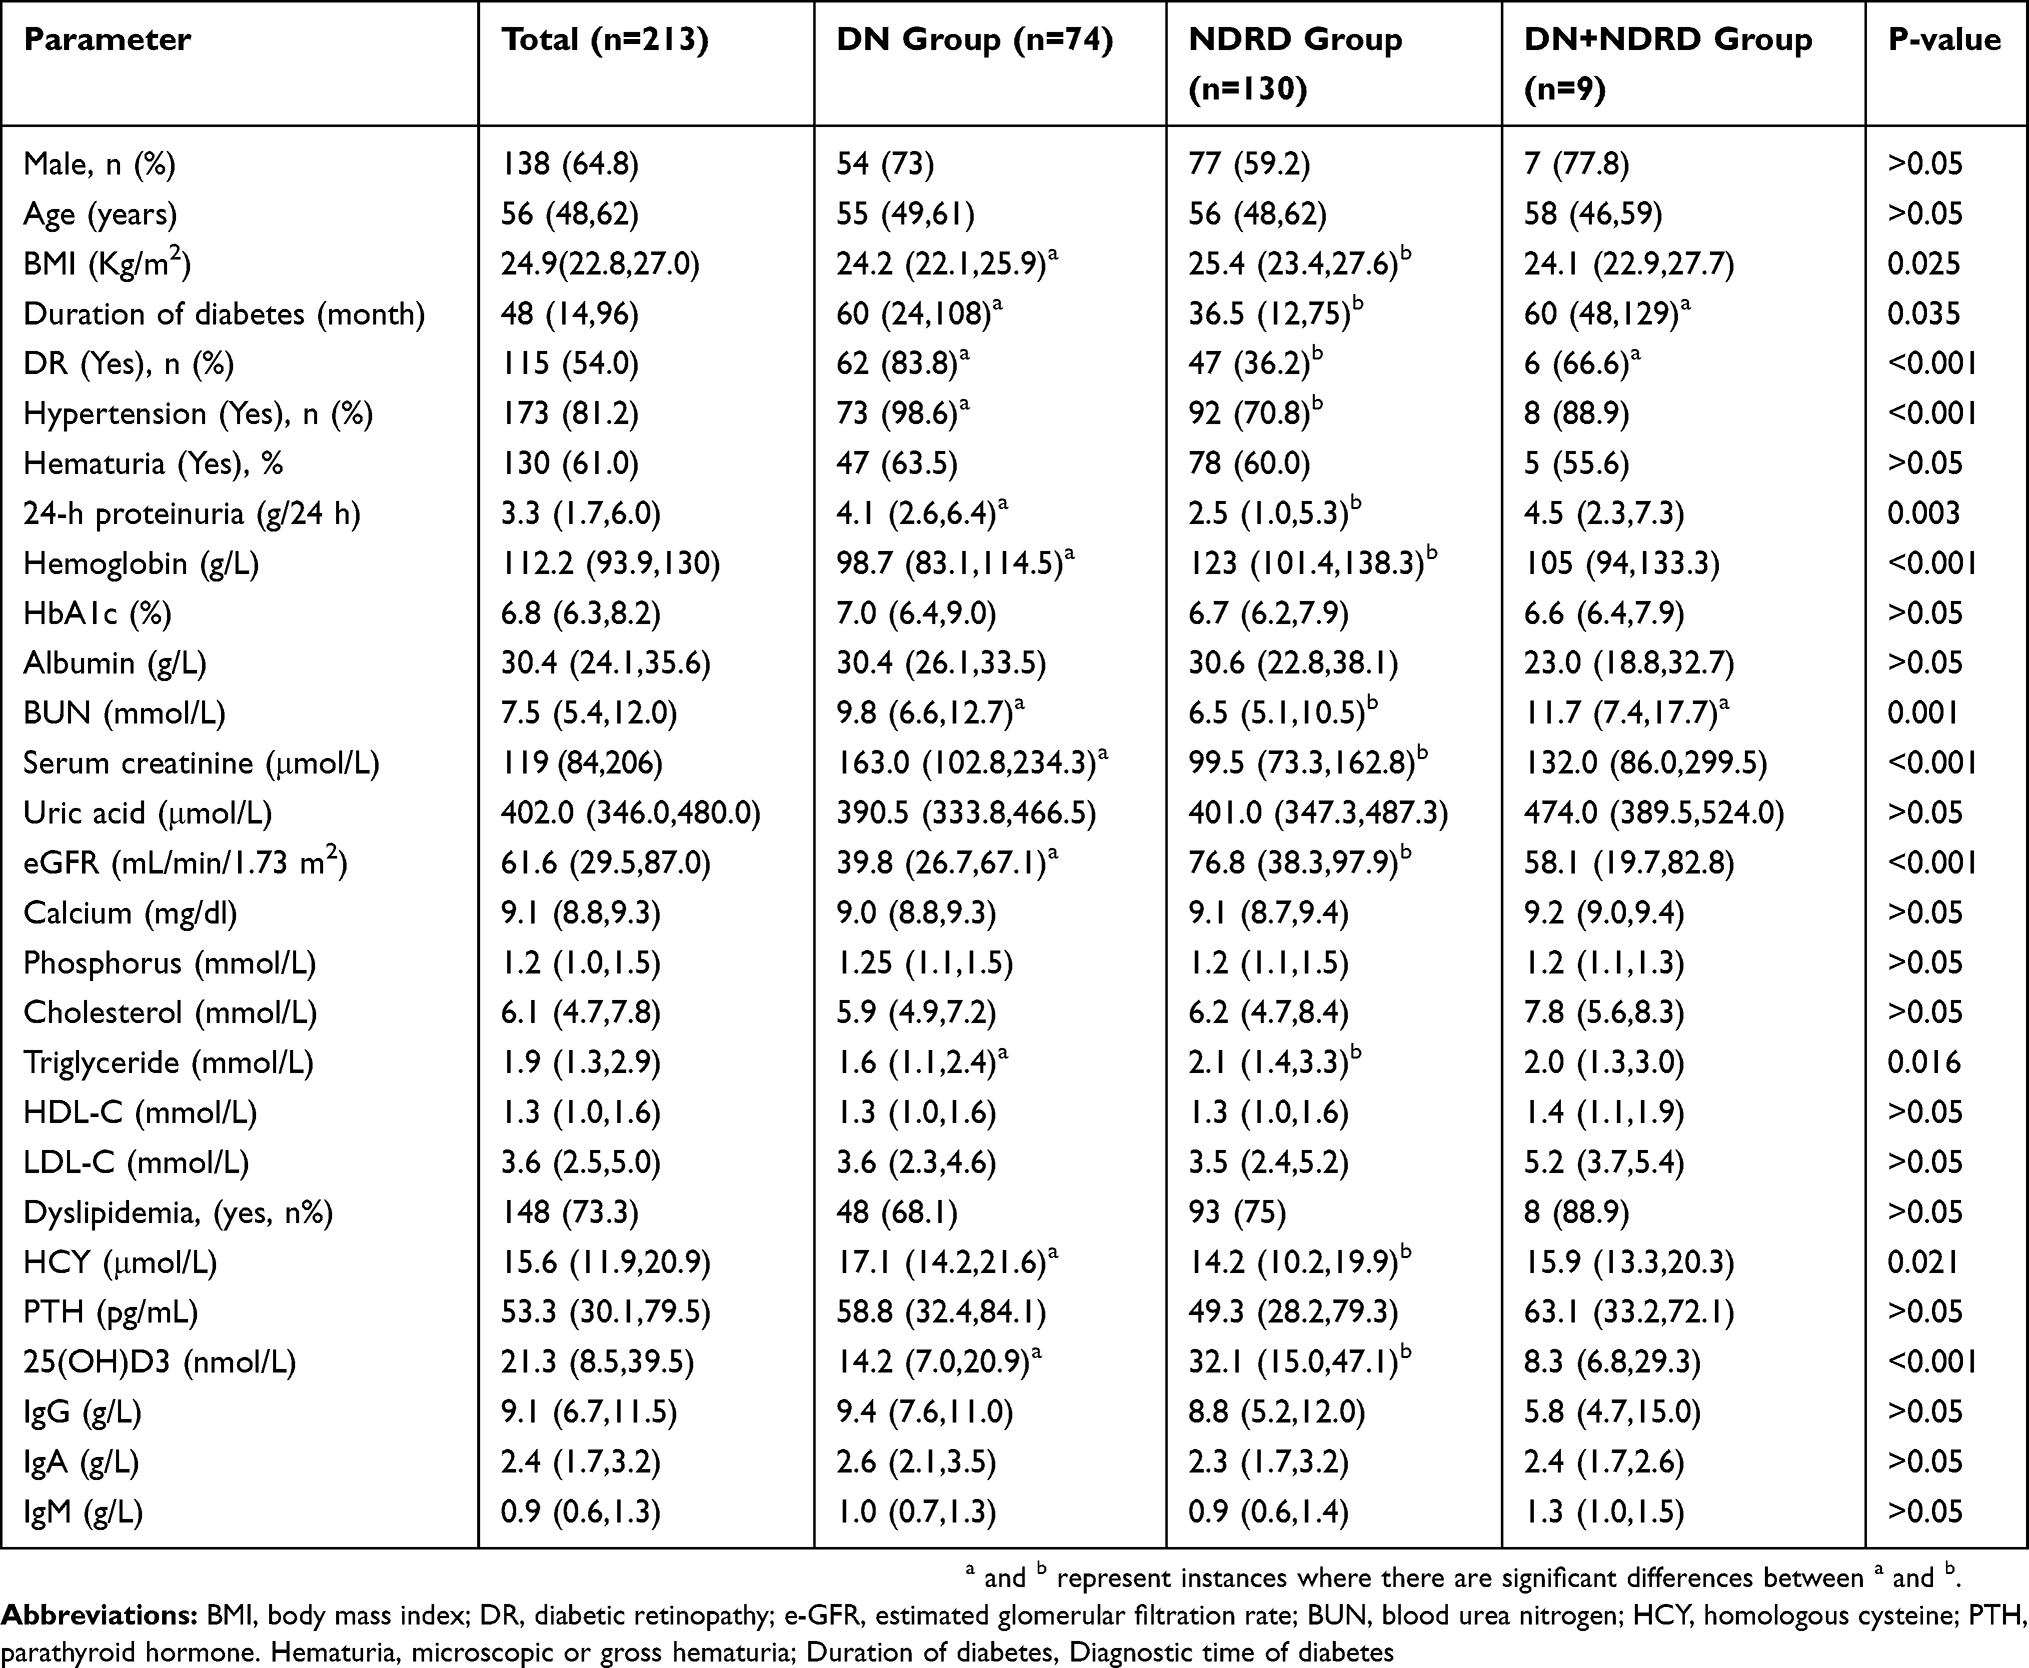 |
Table 2 Baseline Clinical Features Of Patients In The DN, NDRD, And NDRD+DN Groups |
Compared with the DN group, patients in the NDRD group were overweight or obese, and the degree of anemia was mild (predominantly moderate in the DN group and mild in the NDRD group). Furthermore, the NDRD group had shorter duration of diabetes, a lower incidence of DR and hypertension, lower levels of urinary protein, lower levels of urea nitrogen and serum creatinine, higher levels of eGFR, a lower incidence of hyperhomocysteinemia, and higher levels of 25-hydroxyvitamin D3 (P<0.05) than the DN group. The DN+NDRD group had a longer duration of diabetes, higher incidence of DR, and higher levels of urea nitrogen than the NDRD group (P<0.05).
There was no significant difference between the DN+NDRD group and the DN group, although this may be related to the small number of patients in the DN+NDRD group.
Clinicopathological Characteristics Of The Patient Population Diagnosed With DN
Of the 213 patients involved in this retrospective study, 74 were diagnosed with pure DN (54 males [73%] and 63 females [27%]). At baseline, the median age was 55 years and the median duration of DM was 60 months. The median baseline level of serum creatinine was 1.84 mg/dL and the median eGFR was 39.8 mL/min/1.73 m2. The median baseline level of 24-h proteinuria was 4.1 g/d; 45 patients (60.8%) had proteinuria within the nephrotic range (≥3.5 g/d). However, there were exceptions in some specific cases involving mild glomerulopathy with proteinuria in the nephrotic range. Interestingly, only 35 patients (47.3%) and 47 patients (63.5%) had DR and hematuria, respectively. As the pathologic classification of glomerular lesion increased, the eGFR declined accordingly (P<0.05), although there were no significant differences in terms of 24-h proteinuria and hematuria. The baseline clinical and biochemical parameters of patients with DN according to different glomerular classifications are summarized in Table 3.
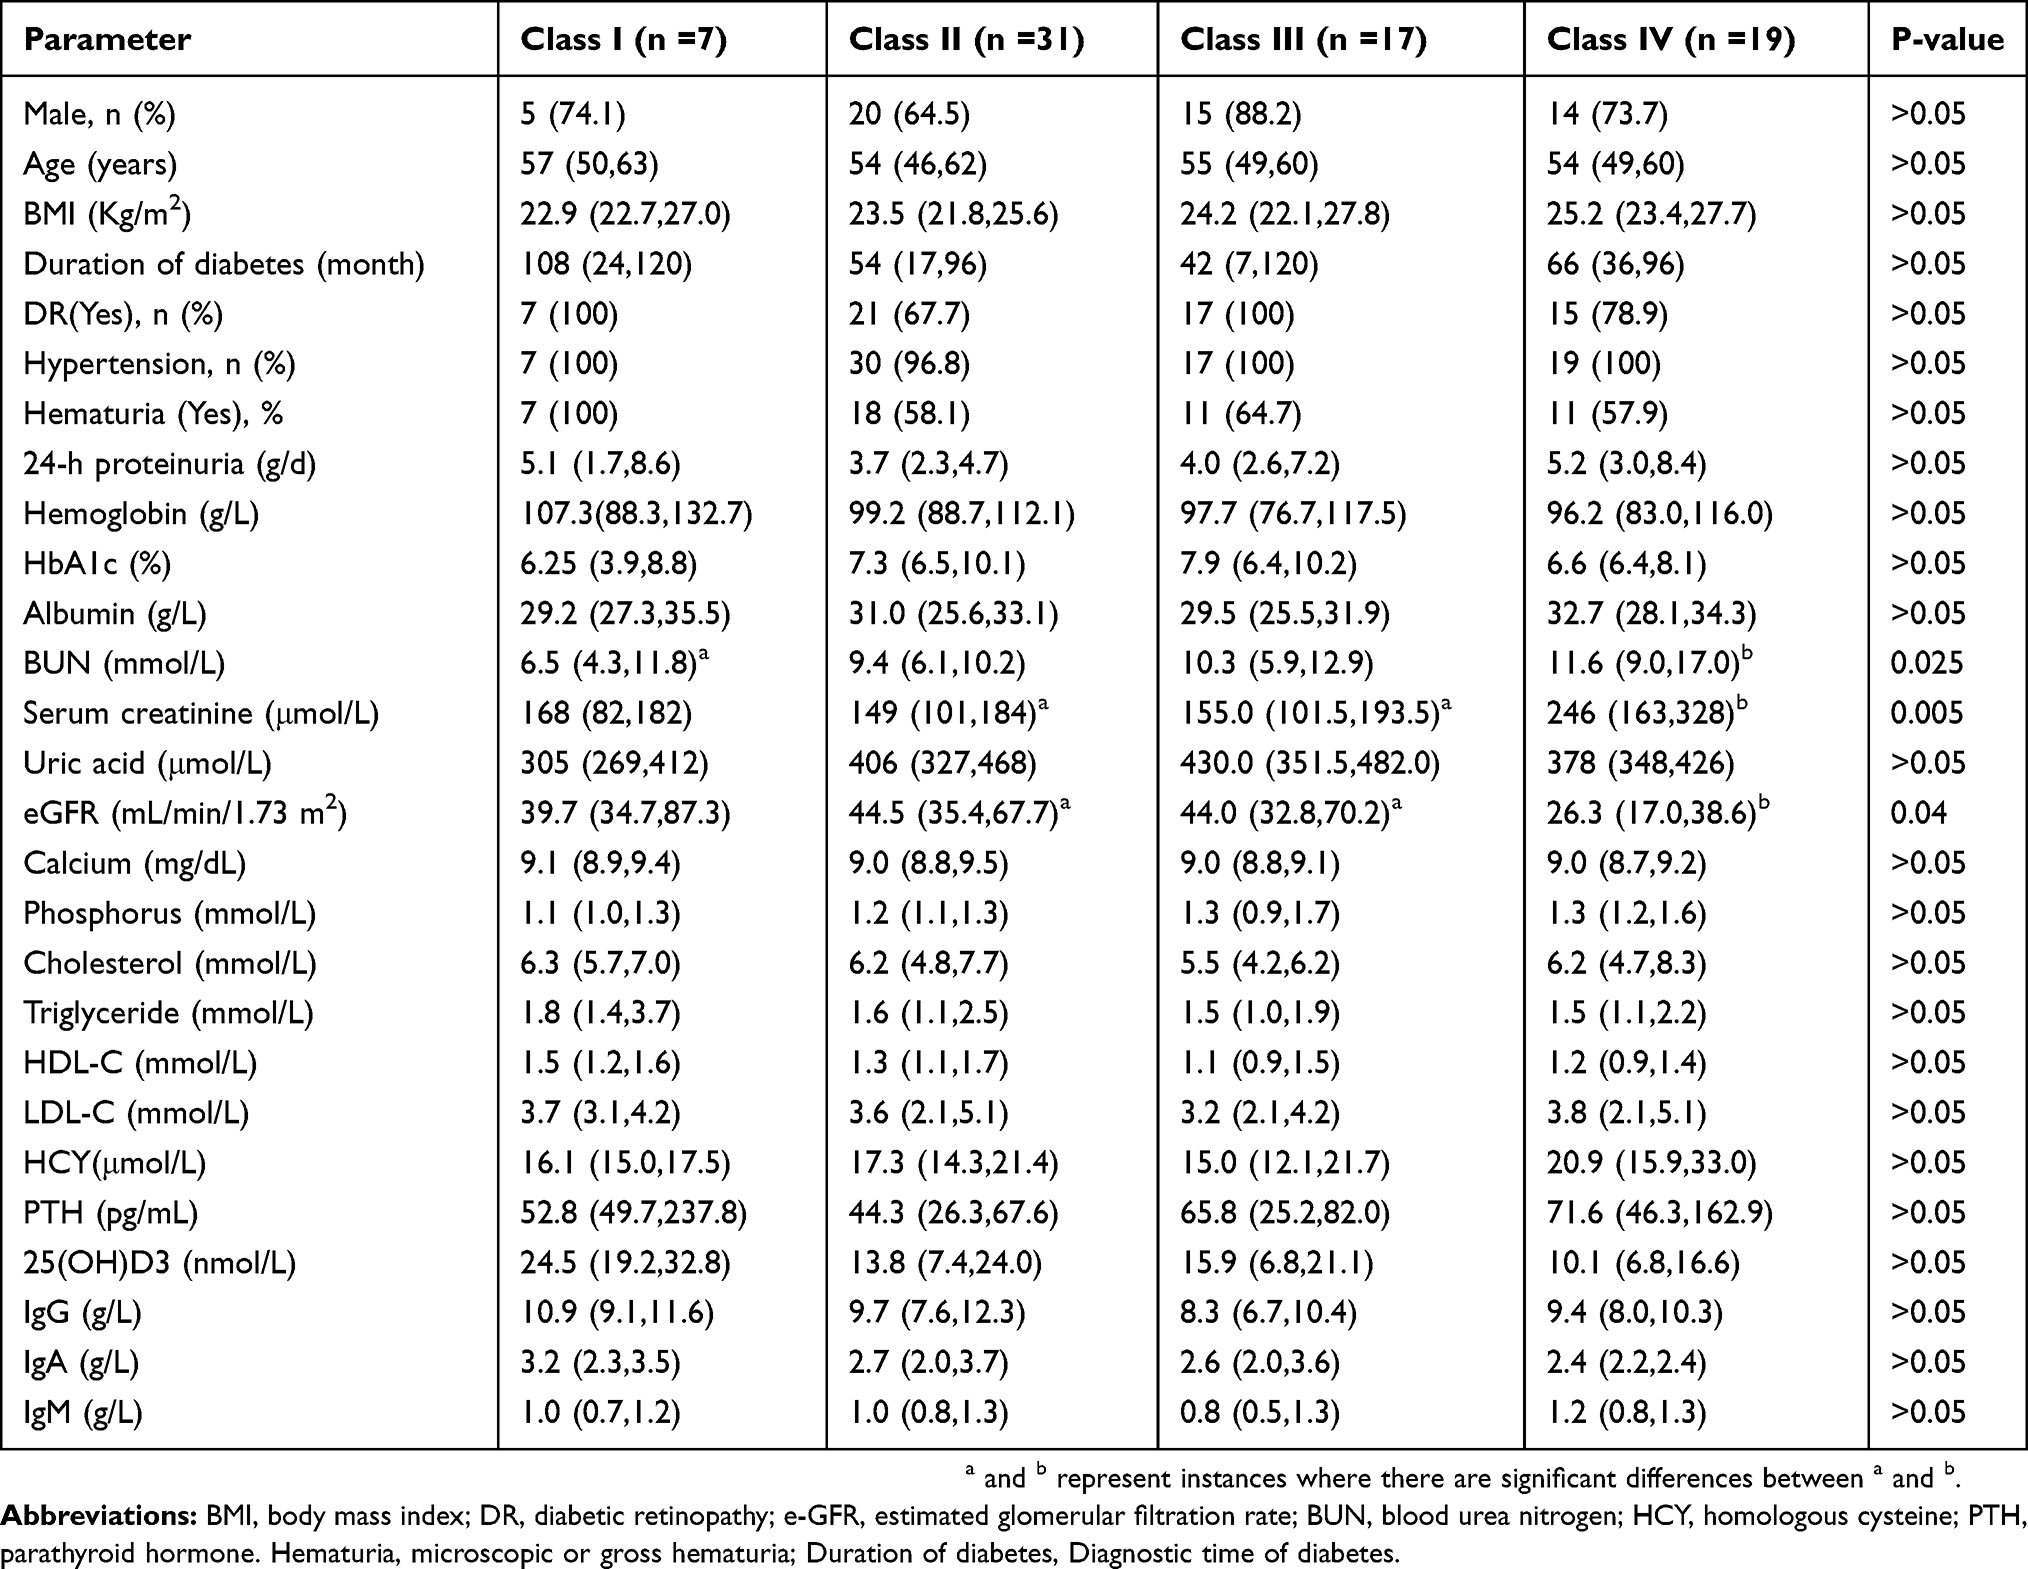 |
Table 3 Baseline Clinical Features Of Patients According To The Glomerular Classification Of Diabetic Nephropathy |
Factors Associated With The Diagnosis Of NDRD
Univariate regression analysis identified that a number of parameters were significantly correlated with the diagnosis of NDRD, including the duration of DM (odds ratio [OR]: 0.475; 95% confidence interval [CI]: 0.246–0.919; P=0.027), DR (OR: 0.119; 95% CI: 0.059–0.242; P<0.001), proteinuria in the nephrotic range (OR: 0.415; 95% CI: 0.229–0.750; P=0.004), anemia (OR: 0.198; 95% CI: 0.103–0.378; P<0.001), eGFR (OR: 0.197; 95% CI: 0.079–0.489; P<0.001), and hypertension (OR: 0.035; 95% CI: 0.005–0.262; P=0.001).
Further multivariate regression analysis showed that the following were statistically significant indicators for the diagnosis of NDRD: the absence of DR (OR: 28.198; 95% CI: 8.657–91.842; P<0.001), proteinuria in the non-nephrotic range (≤3.5 g/d) (OR: 9.654; 95% CI: 1.323–9.654; P=0.012), the absence of anemia (OR: 9.181; 95% CI: 2.986–28.228; P<0.001) and an eGFR≥90 mL/min/1.73 m2 (OR: 6.379; 95% CI: 1.584–25.686; P=0.009) (Table 4). However, our analysis was unable to demonstrate that the duration of diabetes and hypertension was statistically different between the DN and NDRD groups. This was attributed to the small number of patients in the NDRD+DN group; hence, we excluded the NDRD+DN patients from our analysis).
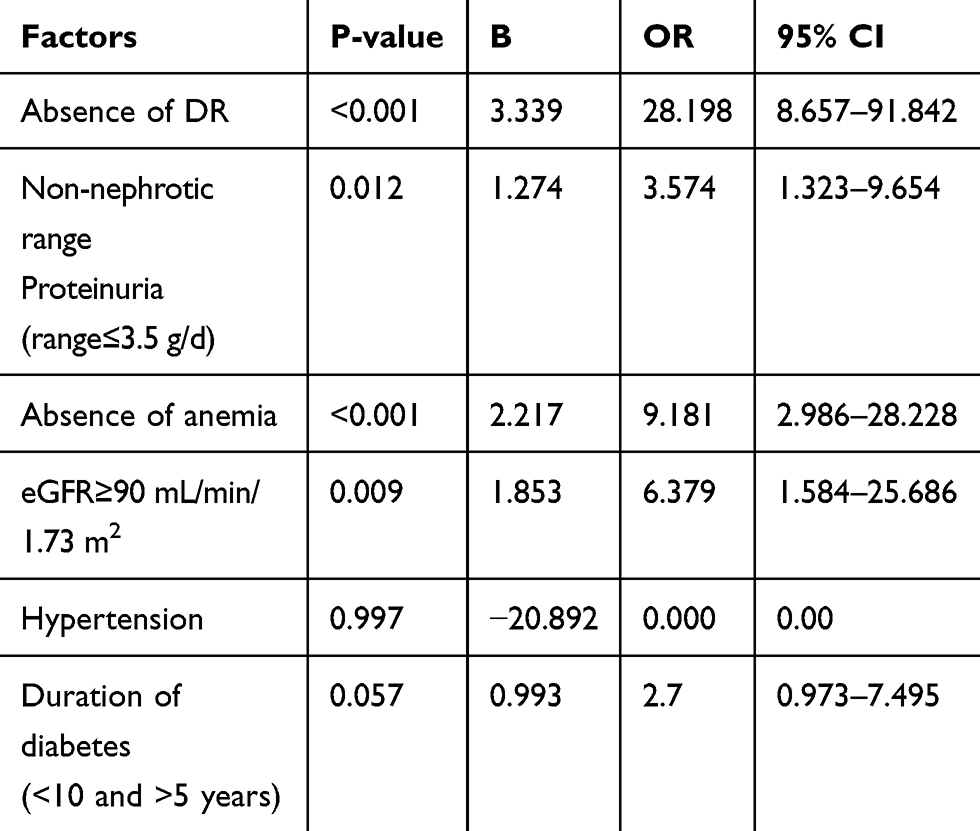 |
Table 4 Multivariate Regression Analysis Of Factors Relating To The Diagnosis Of NDRD |
A Model For The Differential Diagnosis Of DN And NDRD
Our differential diagnostic model was based on the following logistic regression model: logit(P)= +
+ +
+ + … +
+ … + , after transformation; that is, P=
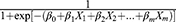 , where P represents probability, e represents a mathematical constant (e=2.71828 … ), xm represents the predictors, β0 is a constant, βm is an estimator, and P is the probability of NDRD diagnosis (PNDRD). Based on this analysis, we created the following diagnostic model: PNDRD=
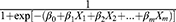 =1/[1+exp(−17.382−3.339×DR−1.274×Proteinuria−2.217×Anemia−1.853×eGFR−0.993×DM+20.892Bp)] [DR (0 yes, 1 no); proteinuria in the nephropathic range (0 yes, 1 no); anemia (0 yes, 1 no); eGFR (0 eGFR<90 mL/min/1.73 m2, 1 eGFR≥90 mL/min/1.73 m2); DM (1, DM<5 or >10 years; 0, 5≤ DM ≤10 years); and presence/absence of hypertension (1 yes, 0 no)]. In this model, PNDRD represents the probability of NDRD diagnosis; we used 0.5 as a cutoff level. If PNDRD≥0.5, the diagnosis should be NDRD; if PNDRD<0.5, then the diagnosis should be DN.
Diagnostic Performance Of The Four Predictors And A Diagnostic Model For Predicting The Development Of NDRD
A back-substitution test showed that our diagnostic model had a good sensitivity of 95.4%, a specificity of 83.8%, a negative predictive value of 91.2%, a positive predictive value of 89.9%, and a total consistency rate of 91.2%. We created this model and subsequently applied it over a 2-year period (October 2017–May 2019) to predict the diagnosis of all T2DM patients with CKD who were biopsied at our hospital. During this period, and based on the same inclusion criteria, 96 patients were screened through biopsy. Our diagnostic model predicted that 24 and 72 of these patients would have DN and NDRD, respectively. Subsequently, a kidney biopsy confirmed that 19 and 68 patients had DN and NDRD, respectively; the total consistency rate was 90.6% (Table 5).
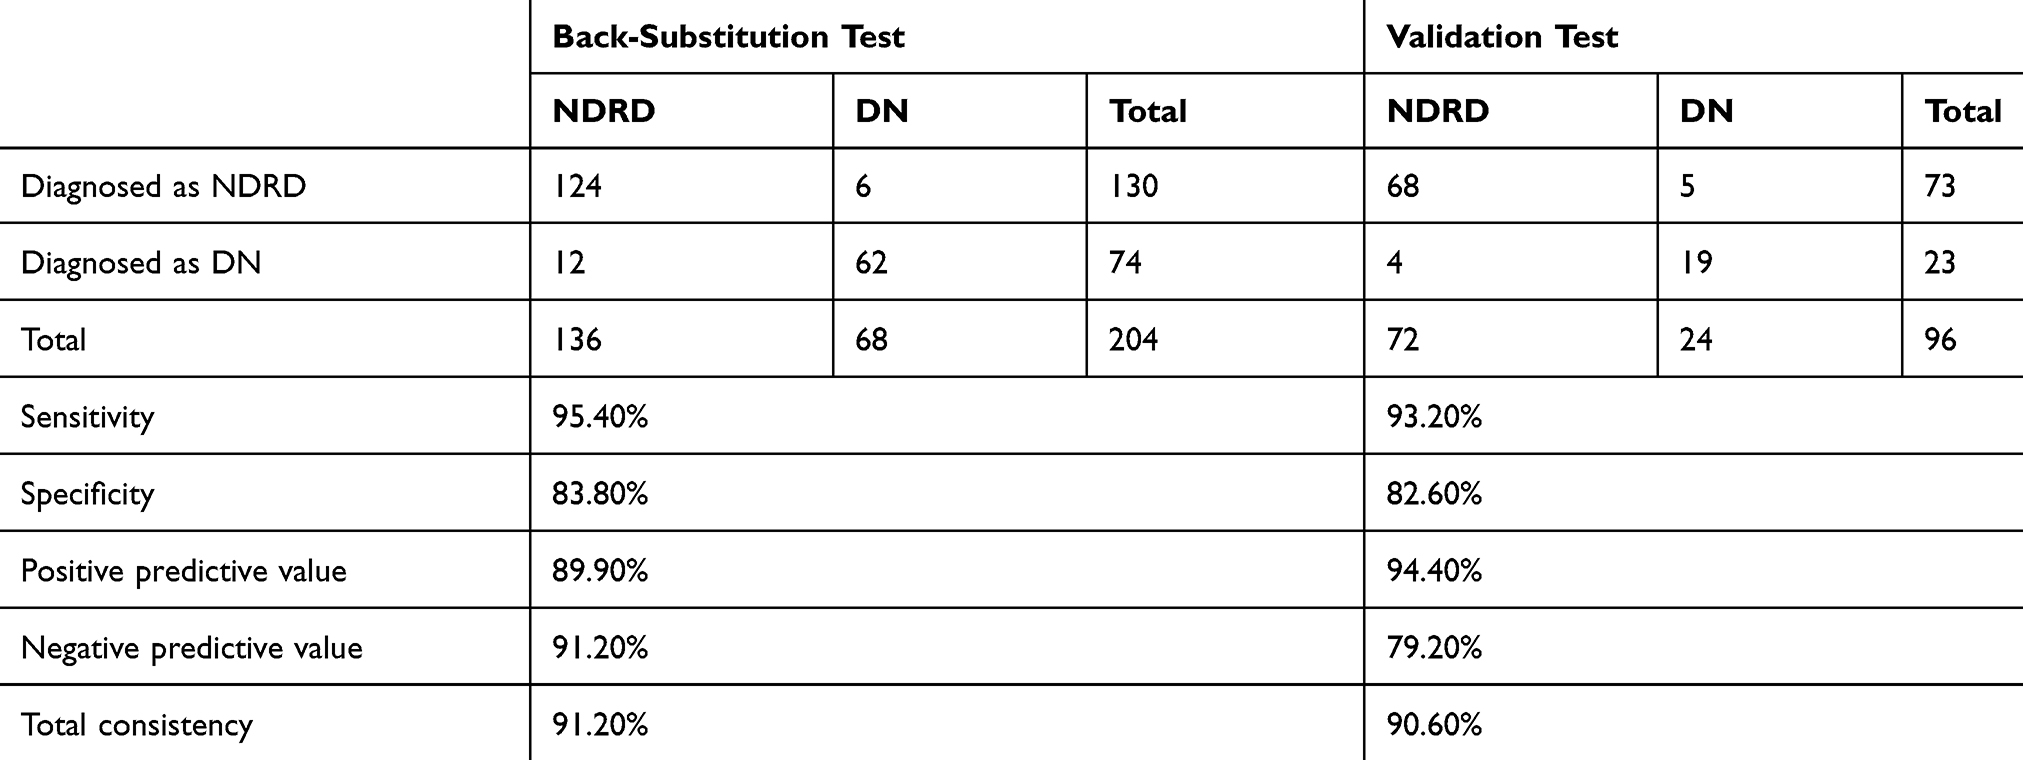 |
Table 5 Predictive Value Of The New Diagnostic Model In The Validation And Back-Substitution Tests |
The receiver operating curve analysis yielded predictive values of 0.73, 0.61, 0.69, 0.62, and 0.93 for the absence of DR, proteinuria in the non-nephrotic range, the absence of anemia, an eGFR≥90 mL/min/1.73 m2, and the diagnostic model, respectively (Table 6, Figure 1). Collectively, these data indicated that the predictive value of our model was good. In comparison with other simpler algorithms, our new diagnostic model, which featured six predictors, was more efficient in terms of clinical prediction.
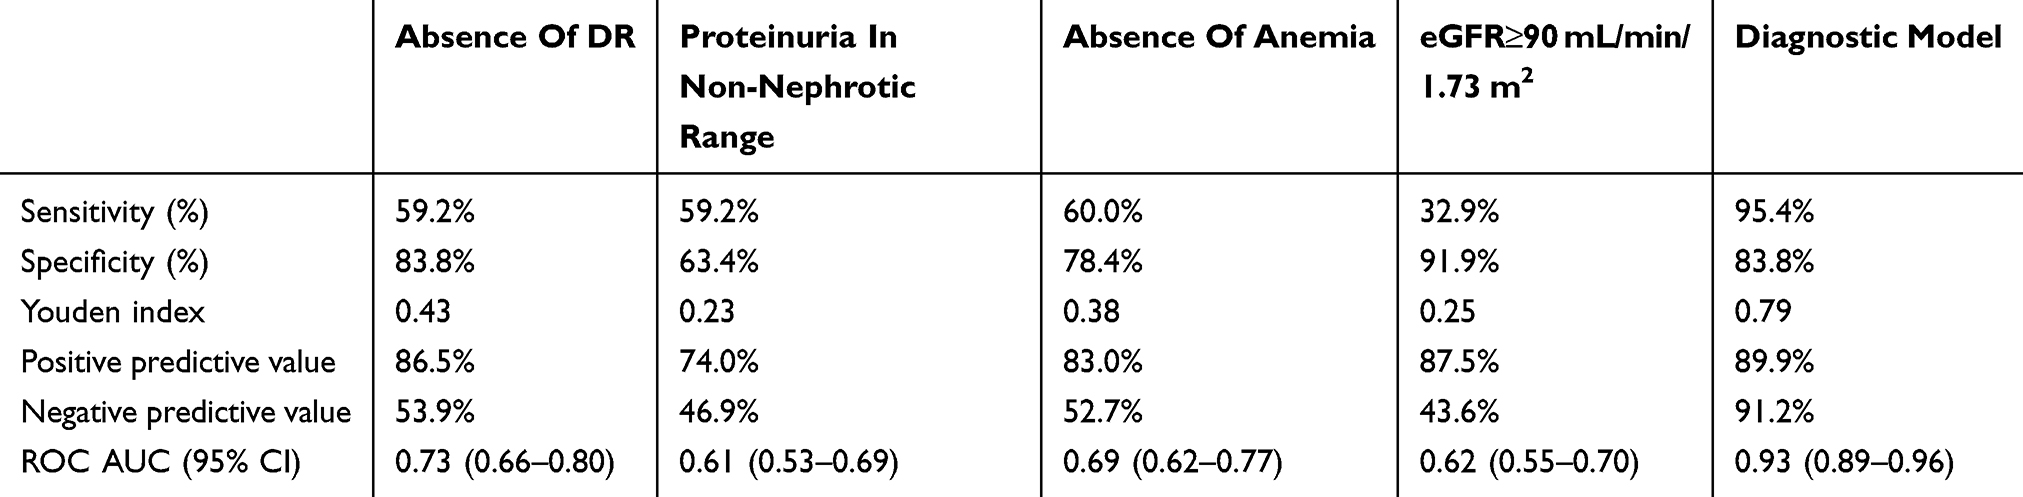 |
Table 6 Diagnostic Performance Of Four Variables And Our Diagnostic Model For Predicting The Development Of NDRD In T2DM |
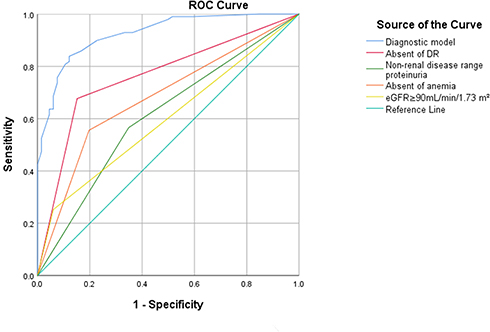 |
Figure 1 ROC curve for our new diagnostic model, the absence of DR, the absence of anemia, proteinuria in the non-nephrotic range and eGFR≥90mL/min/1.73 m2. |
Discussion
Of the 213 T2DM patients included in this study, 34.7% had DN, 61.0% had NDRD, and 4.2% had DN+NDRD. In total, there were 16 types of NDRD, including primary and secondary glomerulonephritis. The most common form of primary glomerulonephritis was IMN, which accounted for 46% of the cases. This incidence was similar to that reported in other Asian studies.23–25 Previously, Shan et al reported that the most common pathological type of NDRD was focal segmental glomerular sclerosis,26 while Ja et al reported that the most common type was IgA nephropathy.27 This suggests that we should pay more attention to the possibility of NDRD in T2DM patients, particularly IMN. In the present study, there was only one case of fibroid glomerulopathy and one case of virus-associated nephritis that were diagnosed through electron microscopy. To our knowledge, the present study is the first to report such findings.
In this study, patients were divided into three groups according to renal pathology. For clarity, we have omitted the superimposed group from this discussion (4.2% of cases) because the number of patients in this particular group was small and the predictive value showed limited influence. We found that patients with NDRD showed a milder degree of anemia, higher eGFR levels, and a lower incidence of DR and proteinuria within the nephropathy range. However, there were no significant differences in terms of hematuria and the duration of diabetes.
DR is a common microvascular complication of T2DM. It is generally believed that in patients with T2DM, the occurrence of DR is often accompanied by the development of DN, and that patients who lack DR are likely to have NDRD.28 Some studies have shown that the incidence of DR in NDRD patients ranges from 6.9% to 57.4%,25,29,30 and that the positive predictive value ranges from 72% to 94%.23,31 These previously published data are consistent with those described in the present study. Notably, the absence of DR was a significant predictor for the development of NDRD but was not an exclusion criterion for DN.
In the 1970s, Mogensen and Christensen were the first to describe the important role of proteinuria in the development of DN,32 noting that the appearance of microalbuminuria is an early specific marker of DN. A number of subsequent studies showed that proteinuria increases with the progression of kidney disease during the natural course of type 1 DN, and that 10–15% of patients with T2DM develop proteinuria within the nephropathy range and ESRD while being diagnosed with diabetes.33 Studies found that proteinuria resolved spontaneously in a proportion of patients.34,35 Consequently, the clinical value of proteinuria in patients with DN and NDRD remains controversial. Previous papers suggested that proteinuria in the nephropathy range is an independent risk factor for DN.24,36 In another article, Mak et al reported that diabetic patients with proteinuria within the nephropathy range tended to have NDRD.29 Other investigators reported that the incidence of proteinuria within the nephropathy range was not significantly different between DN and NDRD.23,25 The results of the present study showed that the 24-h urinary protein level was higher in the DN group versus the NDRD group, and that proteinuria in the non-nephropathy range was associated with the diagnosis of NDRD. However, the 24-h urinary protein test only yields general levels of diagnostic performance. These differences may be related to the selection of indications for renal biopsy, area, and race. On the other hand, the living standards and awareness regarding health have improved, and patients undergo physical examinations more regularly. The early treatment and active diagnosis of early-stage kidney disease may also be an underlying reason for these differences.
Erythropoietin (EPO) is mainly synthesized in the kidney by interstitial cells. CKD can lead to renal anemia, one of the most common and most overlooked complications of DN. Previously, Bosman et al reported that EPO-related anemia can occur early in patients with DN, but usually does not occur in patients with NDRD of similar severity.37 A multicenter cross-sectional study, performed in Campania, Italy, further showed that anemia is an independent risk factor for the progression of renal function in patients with DN;38 these findings concur with our present data. Another study found that DN patients have a high incidence of early anemia, and that the occurrence of anemia in these patients is related to the renal function, metabolic abnormalities, and nutritional status of the patient.39 Early lesions in patients with DN mainly involve diffuse thickening of the glomerular basement membrane and mesangial matrix hyperplasia. Consequently, the reduction of EPO occurs earlier in DN patients. This may be one of the reasons for the observed differences in the levels of hemoglobin between DN and NDRD patients.
We found that the baseline eGFR in the NDRD group was higher than that recorded in the DN group (39.8 [26.7, 67.1)] vs 76.8 [38.3, 97.9], respectively; P<0.001). During the natural course of DN, and if not actively treated, eGFR will continue to decrease by approximately 2–20 mL/min/1.73 m2 per year. However, this can be effectively treated by controlling the blood pressure and level of sugar in the blood, improving the lifestyle of patients, and blocking the activation of the renin–angiotensin system. In fact, treatment can retard the rate of decline to 2–5 mL/min/1.73 m2. DN is a chronic complication of diabetes associated with a slow onset. The obvious symptoms of nephropathy are likely to include a long duration of disease and significant damage to kidney function. However, most patients with NDRD, IMN, and IgA with an acute onset are more likely to seek assistance in identifying potential causes, such as hematuria, proteinuria, and edema. Therefore, in our study, the baseline eGFR in the NDRD group was higher than that observed in the DN group. Furthermore, we found that a baseline eGFR ≥90 mL/min/1.73 m2 tended to be associated with the diagnosis of NDRD.
Although the differential diagnosis of DN and NDRD has been explored in numerous previous studies, the effective, safe, and scientific identification of NDRD and DN remains a major challenge. Although renal biopsy is the current gold standard for diagnosis, this examination method cannot be routinely used due to the risk of active bleeding, anticoagulation, or an unwillingness to undergo biopsy. Moreover, specific criteria for performing renal biopsy in patients with T2DM have yet to be defined.40 Studies have investigated the specific characteristics of NDRD and DN; however, the results varied. Differences in ethnicity and the inclusion criteria applied may underlie the conflicting conclusions described in the current literature.
We found that NDRD and DN showed different clinical characteristics. We also found that important clinical indicators and laboratory results can be used as efficient indicators for differential diagnosis. Using logistic regression analysis, we identified six differential indicators for DN and NDRD: (ie, anemia, eGFR levels, DR, proteinuria, hypertension, and DM) in accordance with previous studies. We included these six indicators in an equation and developed a differential diagnostic model that yields a numerical probability for the diagnosis of NDRD. A back-substitution test further showed that this differential diagnostic equation had good sensitivity (95.4%) and specificity (83.8%), and was clearly able to distinguish between NDRD and DN. Figure 1 shows an AUC of 0.968, thus indicating a perfect predictive value. Our model also showed perfect sensitivity (93.2%) and specificity (82.6%), when used as a prospective test over a 2-year period. Therefore, the predictive value of this model appeared to be good. We compared the diagnostic performance for predicting the development of NDRD using our new diagnostic model or a simpler algorithm involving one important indicator (eg, eGFR, DR, proteinuria, or anemia). Unfortunately, the simpler algorithms were not as accurate as the model featuring the six key variables. Thus, our diagnostic model showed the best diagnostic performance for discriminating between DN and NDRD.
This diagnostic model was based on logistic regression, an important method for discriminant analysis. This methodology has been previously applied to the diagnosis of various other diseases.41,42 In our study, we developed a differential diagnostic model using six clinical variables, which was able to yield a numerical probability for the diagnosis of NDRD. Therefore, this model may be valuable to physicians. However, this was a single-center study performed at the First Affiliated Hospital of Guangxi Medical University. Moreover, the epidemiology of NDRD shows dramatic global variation, particularly across different ethnicities and regions. Consequently, we recommend that this diagnostic model should be applied only within the same ethnic region until more extensive applications of this model have been investigated. Despite these limitations, our model performs in discriminating between DN and NDRD.
Conclusion
In the present study, we developed a diagnostic model based on logistic regression featuring six variables, which can effectively discriminate between DN and NDRD. We believe that this model will be useful to physicians and allow the development of more rational and effective criteria for performing kidney biopsy in patients with T2DM and CKD.
Acknowledgments
Access to all data used in this research was authorized by The First Affiliated Hospital of Guangxi Medical University. This research did not receive any specific grant from funding agencies in the public, commercial, or not-for-profit sectors.
Disclosure
The authors declare that there are no conflicts of interest in this work.
References
1. Cho N, Shaw J, Karuranga S, et al. IDF diabetes atlas: global estimates of diabetes prevalence for 2017 and projections for 2045. Diabetes Res Clin Pract. 2018;138:271–281. doi:10.1016/j.diabres.2018.02.023
2. Ritz E, Rychlík I, Locatelli F, Halimi S. End-stage renal failure in type 2 diabetes: a medical catastrophe of worldwide dimensions. Am J Kidney Dis. 1999;34(5):795–808. doi:10.1016/S0272-6386(99)70035-1
3. Yokoyama H, Araki S, Haneda M, et al. Chronic kidney disease categories and renal–cardiovascular outcomes in type 2 diabetes without prevalent cardiovascular disease: a prospective cohort study (JDDM25). Diabetologia. 2012;55(7):1911–1918. doi:10.1007/s00125-012-2536-y
4. Walker J, Colhoun H, Livingstone S, et al. Type 2 diabetes, socioeconomic status and life expectancy in Scotland (2012–2014): a population-based observational study. Diabetologia. 2018;61(1):108–116. doi:10.1007/s00125-017-4478-x
5. Young BA, Maynard C, Boyko EJ. Racial differences in diabetic nephropathy, cardiovascular disease, and mortality in a national population of veterans. Diabetes Care. 2003;26(8):2392–2399. doi:10.2337/diacare.26.8.2392
6. Soni SS, Gowrishankar S, Kishan AG, Raman A. Non diabetic renal disease in type 2 diabetes mellitus. Nephrology. 2006;11(6):533–537. doi:10.1111/j.1440-1797.2006.00681.x
7. Huang F, Yang Q, Chen L, Tang S, Liu W, Yu X. Renal pathological change in patients with type 2 diabetes is not always diabetic nephropathy: a report of 52 cases. Clin Nephrol. 2007;67(5):293–297. doi:10.5414/cnp67293
8. Thomas MC, Cooper ME, Zimmet P. Changing epidemiology of type 2 diabetes mellitus and associated chronic kidney disease. Nat Rev Nephrol. 2016;12(2):73–81. doi:10.1038/nrneph.2015.173
9. Atkins CR, Zimmet P. Diabetic kidney disease: act now or pay later. Nephrol Dial Transplant. 2010;25(2):331–333. doi:10.1093/ndt/gfp757
10. McCrary RF, Pitts TO, Puschett JB. Diabetic nephropathy: natural course, survivorship and therapy. Am J Nephrol. 1981;1(3–4):206–218. doi:10.1159/000166541
11. Afkarian M, Zelnick LR, Hall YN, et al. Clinical manifestations of kidney disease among US adults with diabetes, 1988–2014. JAMA. 2016;316(6):602–610. doi:10.1001/jama.2016.10924
12. Kramer HJ, Nguyen QD, Curhan G, Hsu C-Y. Renal insufficiency in the absence of albuminuria and retinopathy among adults with type 2 diabetes mellitus. JAMA. 2003;289(24):3273–3277. doi:10.1001/jama.289.24.3273
13. Molitch ME, Steffes M, Sun W, et al. Development and progression of renal insufficiency with and without albuminuria in adults with type 1 diabetes in the diabetes control and complications trial and the epidemiology of diabetes interventions and complications study. Diabetes Care. 2010;33(7):1536–1543. doi:10.2337/dc09-1098
14. Mottl A, Kwon K, Garg S, Mayer-Davis E, Klein R, Kshirsagar A. The association of retinopathy and low GFR in type 2 diabetes. Diabetes Res Clin Pract. 2012;98(3):487–493. doi:10.1016/j.diabres.2012.09.041
15. Byun JM, Lee CH, Lee SR, et al. Renal outcomes and clinical course of nondiabetic renal diseases in patients with type 2 diabetes. Korean J Intern Med. 2013;28(5):565. doi:10.3904/kjim.2013.28.5.565
16. Lee YH, Kim K-P, Kim YG, et al. Clinicopathological features of diabetic and nondiabetic renal diseases in type 2 diabetic patients with nephrotic-range proteinuria. Medicine. 2017;96(36):e8047. doi:10.1097/MD.0000000000008047
17. Li L, Zhang X, Li Z, et al. Renal pathological implications in type 2 diabetes mellitus patients with renal involvement. J Diabetes Complications. 2017;31(1):114–121. doi:10.1016/j.jdiacomp.2016.10.024
18. Association AD. Classification and diagnosis of diabetes: standards of medical care in diabetes—2018. Diabetes Care. 2018;41(Supplement 1):S13–S27. doi:10.2337/dc18-S002
19. Hypertension WGoCGftMo. 2010 Chinese guidelines for the management of hypertension. Chin J Cardiol. 2011;39(7):579–616.
20. Levey AS, Stevens LA, Schmid CH, et al. A new equation to estimate glomerular filtration rate. Ann Intern Med. 2009;150(9):604–612. doi:10.7326/0003-4819-150-9-200905050-00006
21. Tervaert TWC, Mooyaart AL, Amann K, et al. Pathologic classification of diabetic nephropathy. J Am Soc Nephrol. 2010;21(4):556–563. doi:10.1681/ASN.2010010010
22. Liu G, Liu Y, Chou L. Medical Statistics.
23. Dong Z, Wang Y, Qiu Q, et al. Clinical predictors differentiating non-diabetic renal diseases from diabetic nephropathy in a large population of type 2 diabetes patients. Diabetes Res Clin Pract. 2016;121:112–118. doi:10.1016/j.diabres.2016.09.005
24. Soleymanian T, Hamid G, Arefi M, et al. Non-diabetic renal disease with or without diabetic nephropathy in type 2 diabetes: clinical predictors and outcome. Ren Fail. 2015;37(4):572–575. doi:10.3109/0886022X.2015.1007804
25. Liu S, Guo Q, Han H, et al. Clinicopathological characteristics of non-diabetic renal disease in patients with type 2 diabetes mellitus in a northeastern Chinese medical center: a retrospective analysis of 273 cases. Int Urol Nephrol. 2016;48(10):1691–1698. doi:10.1007/s11255-016-1331-y
26. Mou S, Wang Q, Liu J, et al. Prevalence of non-diabetic renal disease in patients with type 2 diabetes. Diabetes Res Clin Pract. 2009;87(3):354–359. doi:10.1016/j.diabres.2009.11.012
27. Ja Min B, Cheol Hyun L, Ra L S, et al. Renal outcomes and clinical course of nondiabetic renal diseases in patients with type 2 diabetes. Korean J Intern Med. 2013;28(5):565–572. doi:10.3904/kjim.2013.28.5.565
28. Initiative KDOQ. Clinical practice guidelines and clinical practice recommendations for diabetes and chronic kidney disease. Am J Kidney Dis. 2007;49:S62–S73.
29. Mak SK, Gwi E, Chan KW, et al. Clinical predictors of non-diabetic renal disease in patients with non-insulin dependent diabetes mellitus. Nephrol Dial Transplant. 1997;12(12):2588–2591. doi:10.1093/ndt/12.12.2588
30. Bi H, Chen N, Ling G, Yuan S, Huang G, Liu R. Nondiabetic renal disease in type 2 diabetic patients: a review of our experience in 220 cases. Ren Fail. 2011;33(1):26–30. doi:10.3109/0886022X.2010.536292
31. Wong TYH, Choi PCL, Szeto CC, et al. Renal outcome in type 2 diabetic patients with or without coexisting nondiabetic nephropathies. Diabetes Care. 2002;25(5):900–905. doi:10.2337/diacare.25.5.900
32. Mogensen CE, Christensen CK. Predicting diabetic nephropathy in insulin-dependent patients. N Engl J Med. 1984;311(2):89–93. doi:10.1056/NEJM198407123110204
33. Wang H, Zhao M, Zhang H, et al. Clinical Nephrology Pocket Book. Beijing: Peking University Medical Press; 2010.
34. Perkins BA, Ficociello LH, Silva KH, Finkelstein DM, Warram JH, Krolewski AS. Regression of microalbuminuria in type 1 diabetes. N Engl J Med. 2003;348(23):2285–2293. doi:10.1056/NEJMoa021835
35. Peter G, Lise T, Pernille V, Hans-Henrik P, Oluf P. Remission to normoalbuminuria during multifactorial treatment preserves kidney function in patients with type 2 diabetes and microalbuminuria. Dial Transplant. 2004;19(11):2784–2788. doi:10.1093/ndt/gfh470
36. Retnakaran R, Cull CA, Thorne KI, Adler AI, Holman RR. Risk factors for renal dysfunction in type 2 diabetes: U.K. prospective diabetes study 74. Diabetes. 2006;55(6):1832–1839. doi:10.2337/db05-1620
37. Bosman DR, Winkler AS, Marsden JT, Macdougall IC, Watkins PJ. Anemia with erythropoietin deficiency occurs early in diabetic nephropathy. Diabetes Care. 2001;24(3):495. doi:10.2337/diacare.24.2.350
38. Sasso FC, Nicola LD, Carbonara O, et al. Cardiovascular risk factors and disease management in type 2 diabetic patients with diabetic nephropathy. Diabetes Care. 2006;29(3):498–503. doi:10.2337/diacare.29.03.06.dc05-1776
39. Jinfeng ZHAN, Zhihong LIU, Honglang XIE, et al. Anemiain patients with diabetic nephropathy. J Nephrol Dialy Transplant. 2007;16(6):516–521.
40. Serra A, Romero R, Bayés B, Lopez D, Bonet J. Is there a need for changes in renal biopsy criteria in proteinuria in type 2 diabetes? Diabetes Res Clin Pract. 2002;58(2):149–153. doi:10.1016/s0168-8227(02)00131-6
41. Raab SS, Lenel JC, Cohen MB. Low grade transitional cell carcinoma of the bladder. Cytologic diagnosis by key features as identified by logistic regression analysis. Cancer. 2015;74(5):1621–1626. doi:10.1002/1097-0142(19940901)74:5<1621::AID-CNCR2820740521>3.0.CO;2-E
42. SZPUREK RAFAL, AGATA STEFAN. Using logistic regression analysis in preliminary differential diagnosis of adnexal masses. Int J Gynecol Cancer. 2010;15(5):817–823. doi:10.1111/j.1525-1438.2005.00142.x
 © 2019 The Author(s). This work is published and licensed by Dove Medical Press Limited. The full terms of this license are available at https://www.dovepress.com/terms.php and incorporate the Creative Commons Attribution - Non Commercial (unported, v3.0) License.
By accessing the work you hereby accept the Terms. Non-commercial uses of the work are permitted without any further permission from Dove Medical Press Limited, provided the work is properly attributed. For permission for commercial use of this work, please see paragraphs 4.2 and 5 of our Terms.
© 2019 The Author(s). This work is published and licensed by Dove Medical Press Limited. The full terms of this license are available at https://www.dovepress.com/terms.php and incorporate the Creative Commons Attribution - Non Commercial (unported, v3.0) License.
By accessing the work you hereby accept the Terms. Non-commercial uses of the work are permitted without any further permission from Dove Medical Press Limited, provided the work is properly attributed. For permission for commercial use of this work, please see paragraphs 4.2 and 5 of our Terms.