")
Back to Journals » Cancer Management and Research » Volume 13
A CT-Based Tumoral and Mini-Peritumoral Radiomics Approach: Differentiate Fat-Poor Angiomyolipoma from Clear Cell Renal Cell Carcinoma
Authors Ma Y , Xu X, Pang P, Wen Y
Received 23 December 2020
Accepted for publication 20 January 2021
Published 12 February 2021 Volume 2021:13 Pages 1417—1425
DOI https://doi.org/10.2147/CMAR.S297094
Checked for plagiarism Yes
Review by Single anonymous peer review
Peer reviewer comments 3
Editor who approved publication: Professor Rudolph Navari
Yanqing Ma,1 Xiren Xu,1 Peipei Pang,2 Yang Wen1
1Department of Radiology, Zhejiang Provincial People’s Hospital, People’s Hospital of Hangzhou Medical College, Hangzhou, 310000, People’s Republic of China; 2Department of Pharmaceuticals Diagnosis, GE Healthcare, Hangzhou, 310000, People’s Republic of China
Correspondence: Yanqing Ma
Department of Radiology, Zhejiang Provincial People’s Hospital, People’s Hospital of Hangzhou Medical College, Hangzhou, 310000, People’s Republic of China
Email [email protected]
Objective: This study aimed to evaluate the role of tumor and mini-peritumor in the context of CT-based radiomics analysis to differentiate fat-poor angiomyolipoma (fp-AML) from clear cell renal cell carcinoma (ccRCC).
Methods: A total of 58 fp-AMLs and 172 ccRCCs were enrolled. The volume of interest (VOI) was manually delineated in the standardized CT images and radiomics features were automatically calculated with software. After methods of feature selection, the CT-based logistic models including tumoral model (Ra-tumor), mini-peritumoral model (Ra-peritumor), perirenal model (Ra-Pr), perifat model (Ra-Pf), and tumoral+perirenal model (Ra-tumor+Pr) were constructed. The area under curves (AUCs) were calculated by DeLong test to evaluate the efficiency of logistic models.
Results: The AUCs of Ra-peritumor of nephrographic phase (NP) were slightly higher than those of corticomedullary phase (CMP). Furthermore, the Ra-Pr showed significant higher efficiency than the Ra-Pf, and relative more optimal radiomics features were selected in the Ra-Pr than Ra-Pf. The Ra-tumor+Pr combined tumoral and perirenal radiomics analysis was of most significant in distinction compared with Ra-tumor and Ra-peritumor.
Conclusion: The validity of NP to differentiate fp-AML from ccRCC was slightly higher than that of CMP. To the NP analysis, the Ra-Pr was superior to the Ra-Pf in distinction, and the lesions invaded to the perirenal tissue more severely than to the perifat tissue. It is important to the individual therapeutic surgeries according to the different lesion location. The pooled tumoral and perirenal radiomics analysis was the most promising approach in distinguishing fp-AML and ccRCC.
Keywords: computed tomography, angiomyolipoma, clear cell renal cell carcinoma, peritumor, radiomics
Introduction
Angiomyolipoma (AML) and clear cell renal cell carcinoma (ccRCC) are the most common benign and malignant renal neoplasms, which composed heterogeneous entities with variable pathology, imaging characteristics,1 and clinical behaviors.2 The detection of macroscopic fat in computed tomography (CT) or magnetic resonance imaging (MRI) is considered virtually pathognomonic for typical AMLs. While approximately 5% of AMLs had little to no fat, termed to be “fat-poor angiomyolipoma” (fp-AML).3 Reportedly, most ccRCCs are abundant in lipids and glycogens,4 and are highly vascular with heterogeneous enhancement pattern,5 which may mimic the manifestation of fp-AMLs. CT examination is the first-line noninvasive approach for evaluating renal masses and has achieved moderate sensitivity and satisfactory specificity in diagnosing fp-AML.6 Therefore, accurate differentiation by CT examinations between fp-AML and ccRCC is crucial to avoid unnecessary surgeries.
Radiomics has the potential to provide quantitative information of tumor heterogeneity by converting images into mineable data,7 regarding histogram, texture, form factor, gray level co-occurrence matrix (GLCM), gray level run-length matrix (GLRLM), and gray level size zone matrix (GLSZM).8 The radiomics signature has been of great interest over the last several years to diagnose fp-AML.9 Previous publications reported that CT-based radiomics signature demonstrated better performance in distinguishing fp-AMLs from ccRCCs.10 According to another result of CT texture analysis in previous literature, renal cell carcinomas (RCCs) showed lower homogeneity and higher entropy compared with fp-AMLs.11 Ideally, radiomics features performed promising results in evaluating the Fuhrman grades of the ccRCC.12 Meanwhile, the peritumoral radiomics has been analyzed in hepatocellular carcinoma,13 glioblastoma,14 and so on.
To the best of our knowledge, scarcely any study has assessed the mini-peritumoral radiomics features to differentiate fp-AML from ccRCC. We systematically explored the application of tumoral and mini-peritumoral radiomics contained perirenal and perifat analysis for the first time to distinguish fp-AML and ccRCC based on CT examinations.
Methods
Patients Selection
This retrospective study was approved by the institutional review board of Zhejiang Provincial People’s hospital (NO. 2020QT181). The ethics committee approved that this retrospective study can waive informed consent. This study covered patient data confidentially and complied with the Declaration of Helsinki. The patients were collected from January 2013 to May 2020 in Picture Archiving and Communication System (PACS) of the hospital. Inclusion criteria were as follows: (i) lesions were histopathologically confirmed by partial or total resection surgeries. (ii) patients carried on three-phase including unenhanced phase (UP), corticomedullary phase (CMP), and nephrographic phase (NP) CT scanning. (iii) lesions with invisible macroscopic fat and predominantly solid in CT images, decided by two radiologists on consensus by subjective evaluation. Exclusion criteria were as follows: (i) patients had multiple lesions. (ii) lesions were completely located in renal parenchyma since we divided the mini-peritumoral tissue into perirenal and perifat. (iii) patients underwent treatments including chemotherapy, radiotherapy, and so on before surgeries. The general characteristics contained gender, age, location (left/right), and the largest length of the lesion were recorded. Therefore, the final cohort included 230 patients with 58 fp-AML patients and 172 ccRCC patients.
CT Examination Protocols
A total of 230 patients took three-phase CT examinations (64 or 128 slice, Somaton Definition AS, Siemens). Enhanced CT was performed based on the technology of computer-assisted bolus tracking, with 90–100 milliliters lopromide being administrated via a power injector at a rate of 3.0mL/s. With a 100Hu threshold of the abdominal aorta at the celiac artery as the baseline, the scanning delay of CMP and NP was 15 seconds and 30 seconds, respectively. The imaging protocols were as follows: tube voltage, 120Kv; tube current, 200mA; collimation, 64*0.625mm; rotation time, 0.75s; field of view, 360mm; slice thickness/interval, 5mm; window width/level, 300Hu/40Hu.
Volume of Interest Segmentation
The preprocessing of image standardization was performed before segmenting volume of interest (VOI) including reconstructing images into 1.0mm/1.0mm/1.0mm voxel size at X/Y/Z spacing, denoising images by Gaussian and normalizing the gray level of images from 1 to 32 in the software of “A.K.” (Artificial Intelligence Kit, V 3.0.0, GE Healthcare).
The tumoral VOI (Figure 1A) was manually depicted in “ITK-SNAP” software (http://www.itksnap.org/, V3.4.0) by two radiologists with about ten years of abdominal experience. The manual defined smooth curve VOI was delineated along the margin of tumor with ITK software. Then the mini-peritumoral VOI (Figure 1B) was defined as a 2-mm margin outside the lesion, which was automatically depicted in “A.K.” software after loading the tumoral VOI to the software. Additionally, we divided the mini-peritumoral VOI into perirenal VOI (Pr-VOI, Figure 1C) and perifat VOI (Pf-VOI, Figure 1D), according to the tissue interface of lesions (Figure 1E and F).
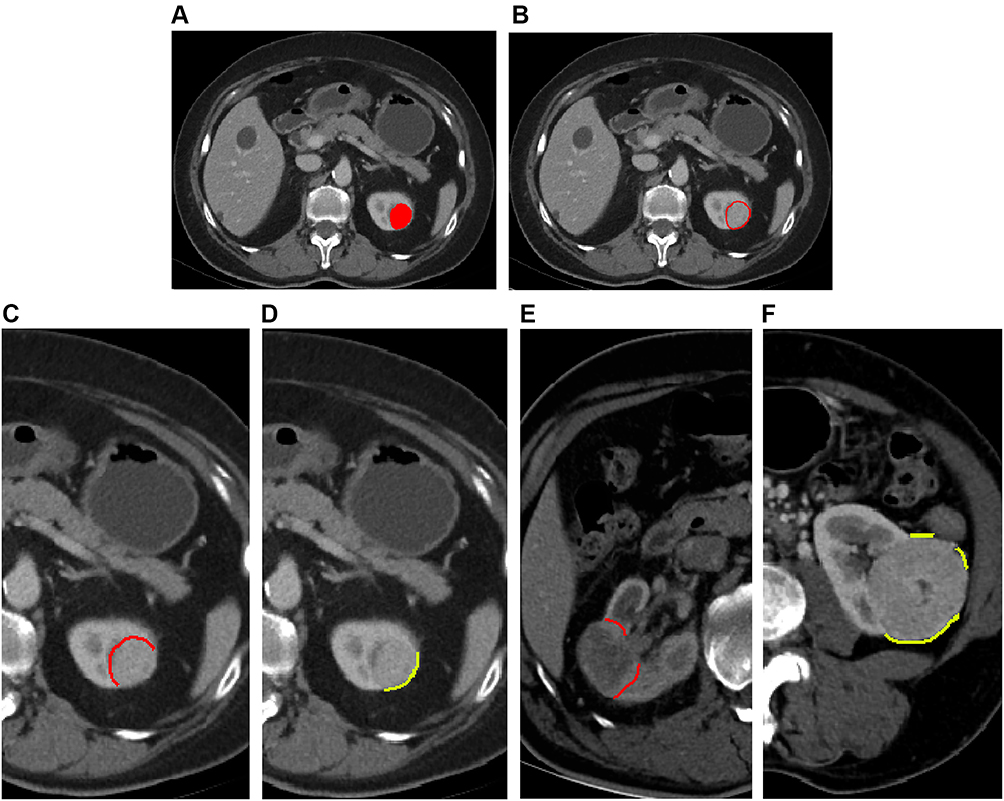 |
Figure 1 (A) showed the VOI of tumor. (B) was the VOI of mini-peritumor, which automatically expanded 2-mm from the margin of the lesion with “A.K.” software. (C and D) was the manually divided Pr/Pf-VOI based on the mini-peritumoral VOI. (E) demonstrated that the Pr-VOI did not include blood vessels and fat in renal hilar region. (F) illustrated that if the Pf-VOI affected by the surrounding structures (such as intestine, liver, adjacent muscle, and so on), this portion was manually removed. |
CT-Based Tumoral and Mini-Peritumoral Radiomics Analysis
A total of 396 radiomics features of each phase were calculated by A.K. software, automatically. The specific description of radiomics features is applied in supplement material. It took five steps to select optimal features. Firstly, after calculating the intra-class correlation coefficient (ICC) of radiomics features between two radiologists, features with ICC greater than 0.80 were chosen.15 And the mean value of the selected features was calculated for further analysis. Then, we replaced the abnormal values with mean values and convert features into non-dimensional values [non-dimensional values = (feature values-mean values)/standard deviation value] to normalize the selected features. Thirdly, the patients were partitioned into a training (40 fp-AML and 120 ccRCC patients) and validation (18 fp-AML and 52 ccRCC patients) set with a proportion of 7:3, randomly. And the logistic model was constructed in the training set and verified in the validation set. Fourthly, we performed the method of analysis of variance/Mann–Whitney U-test (ANOVA/MW), correlation analysis, and least absolute shrinkage and selection operator (LASSO) to select features. Finally, the CT-based tumoral model (Ra-tumor) and mini-peritumoral model (Ra-peritumor) contained perirenal and perifat models (Ra-Pr/Ra-Pf) were constructed based on the training set and were verified in the validation set to differentiate fp-AML from ccRCC. The specific process of CT-based radiomics analysis is shown in Figure 2 and supplement material.
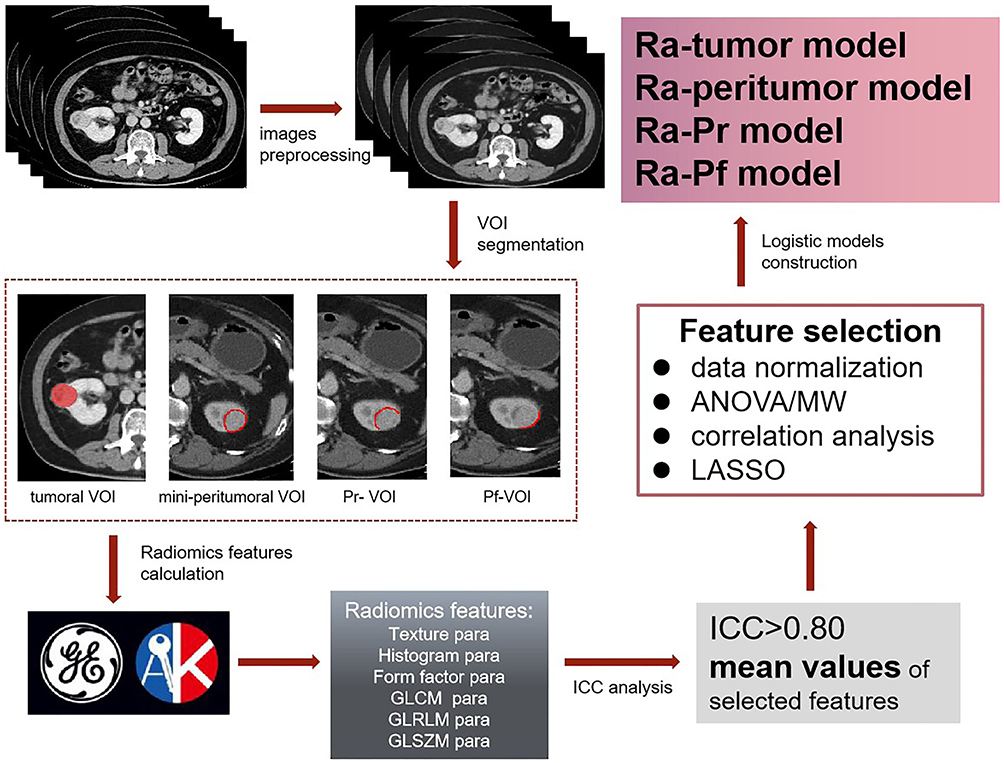 |
Figure 2 The program flowchart of CT-based radiomics analysis. |
Statistical Analysis
The methods of ANOVA/MW, correlation analysis, and LASSO were performed with R software (https://www.r-project.org/, V4.0.1). The clinical characteristics were analyzed using the Chi-square test or independent-samples t-test with SPSS software (V22.0). The calibration curve and Hosmer-Lemeshow test were used to test the agreement between the predicted and actual capability of distinguishing fp-AML from ccRCC with R software. The area under curve (AUC) of operating characteristic curve (ROC) was calculated and the DeLong test was made to evaluate the efficiency of CT-based logistic models with MedCalc (V18.2.1). A P-value <0.05 indicated to be statistical significance.
Results
Patients’ General Characteristics
Table 1 lists the clinical information of patients. A total of 230 patients included 58 fp-AMLs and 172 ccRCCs were identified in this study. There was statistical significance in gender (P<0.001), age (P<0.001), and lesion diameter (P<0.001). The fp-AML exhibited a female preponderance (65.5% vs 34.3%) and typically occurred during the 4th to 6th decade of life (48.4±11.9 years old), which was consistent with the previous study.16
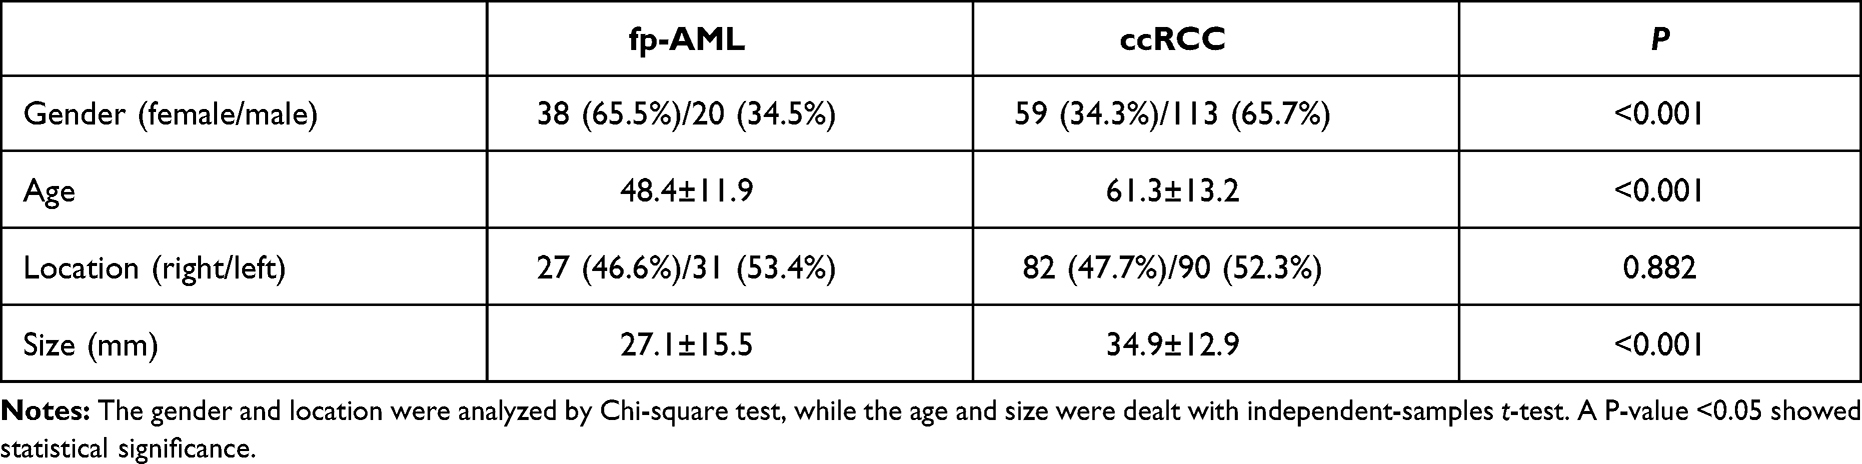 |
Table 1 Patients’ General Characteristics |
CT-Based Mini-Peritumoral Radiomics Analysis
On comparison of the AUCs of CT-based mini-peritumoral radiomics models of CMP and NP (Figure 3), we observed that NP (AUCs were 0.726 and 0.767 in the training and validation set, respectively) was more effective to distinguish fp-AML from ccRCC than CMP (AUCs were 0.694 and 0.754 in the training and validation set, respectively). Considering the higher diagnostic accuracy, we took the data of NP for future analysis in this study.
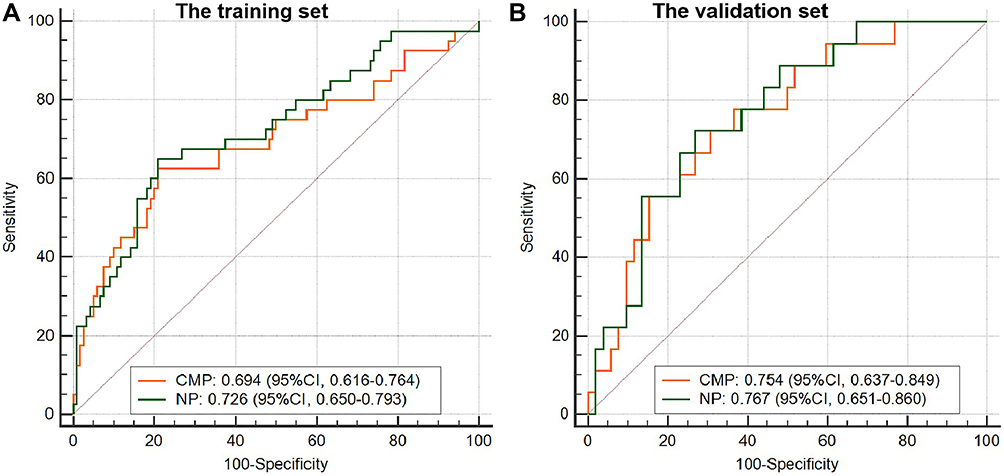 |
Figure 3 The ROC curves of mini-peritumoral radiomics models of CMP and NP. The AUCs of NP were higher than those of CMP in both the training (A) and validation (B) sets. |
To the NP mini-peritumoral radiomics analysis, the mini-peritumoral VOI was divided into Pr-VOI and Pf-VOI, and then the Ra-Pr and Ra-Pf were developed. The AUCs of Ra-Pr were 0.745 in the training set (P<0.001) and 0.700 in the validation set (P=0.007), which were significantly higher than those of Ra-Pf (Table 2). There were five optimal radiomics features including two GLCM parameters (entropy and sum variance), two GLRLM parameters (high gray level run emphasis and run length non-uniformity), and one form factor parameter (sphericity) left in Ra-Pr. While four features belonged to two GLRLM parameters (run length non-uniformity and short run emphasis), one form factor parameter (Maximum 3D Diameter), and one GLZSM parameter (size zone variability) were selected in Ra-Pf. The heat map of Ra-Pr to differentiate fp-AML from ccRCC is demonstrated in Figure 4. These results suggested that Ra-Pr was superior to Ra-Pf in distinguishing fp-AML and ccRCC, and showed more radiomics heterogeneity in adjacent perirenal tissue.
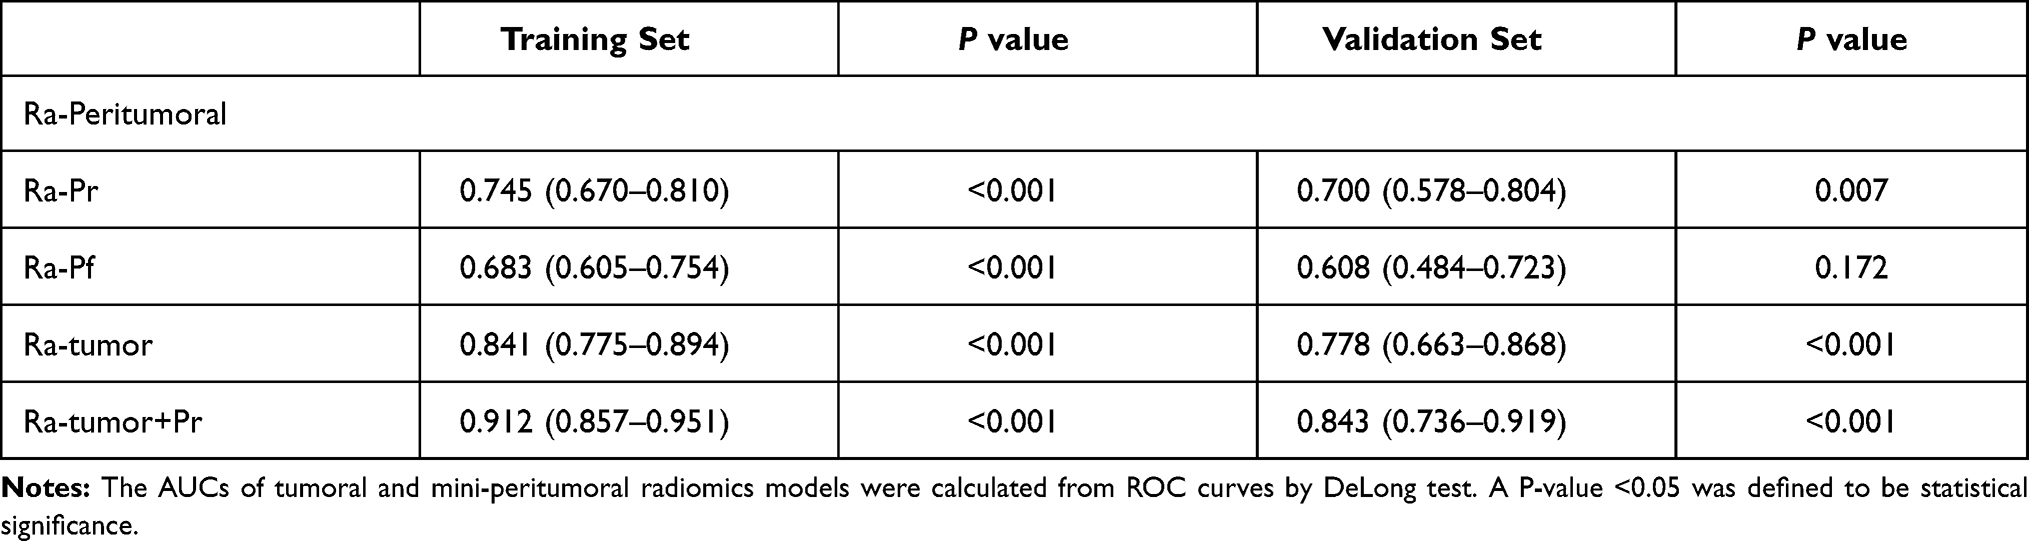 |
Table 2 The AUCs of Tumoral and Mini-Peritumoral Radiomics Models in NP |
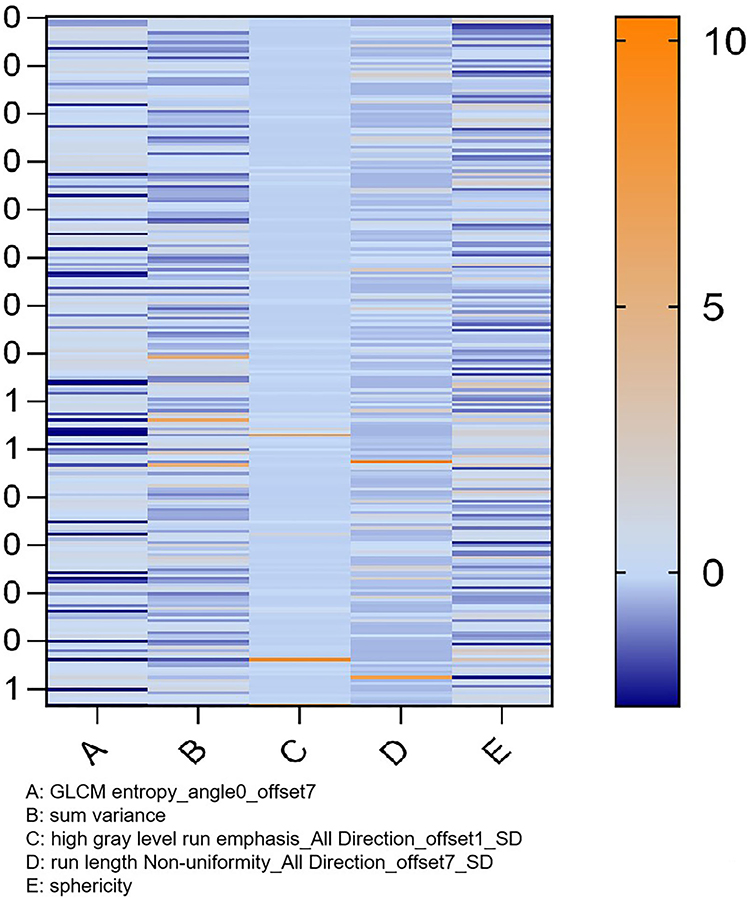 |
Figure 4 The heat map of Ra-Pr to distinguish fp-AML from ccRCC. There were five optimal radiomics features left in Ra-Pr. And zero presented the ccRCC, one presented the fp-AML. |
CT-Based Tumoral and Mini-Perirenal Radiomics Analysis
The logistic model contained tumoral and mini-perirenal radiomics features (Ra-tumor+Pr) was constructed. The AUCs of Ra-tumor+Pr in the training (0.912 vs 0.841, 0.745, and 0.683) and validation (0.843 vs 0.778, 0.700, and 0.608) set were higher than those of simple Ra-tumor and Ra-peritumor (Table 2). The non-significant Hosmer-Lemeshow tests (P>0.05) and calibration curves indicated a good consistency between the predicted and actual capacity in differentiating fp-AML from ccRCC (Figure 5). To the cohort, the AUC, sensitivity, and specificity of Ra-tumor+Pr were slightly higher than those of simple Ra-tumor and Ra-peritumor (Table 3). There were 17 optimal features left in the Ra-tumor+Pr, and the equation of this logistic model was applied in supplement material.
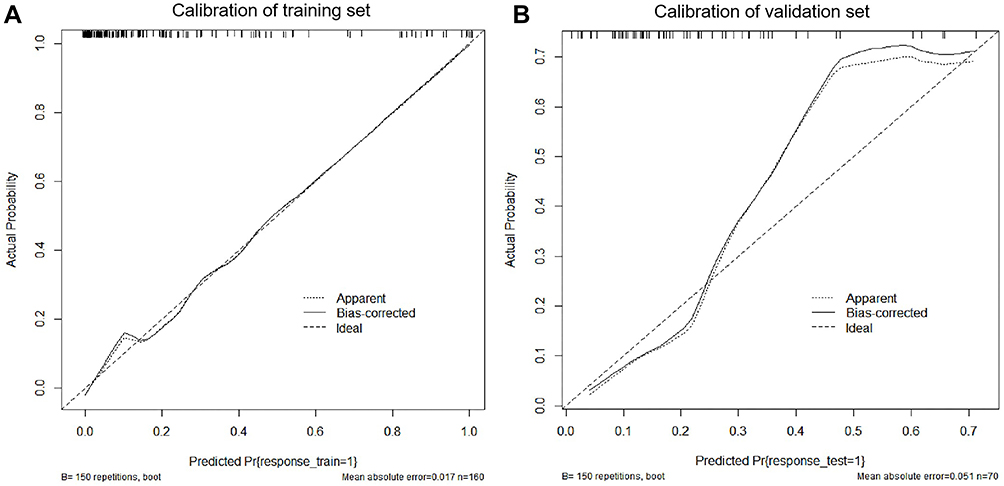 |
Figure 5 The calibration curves of training and validation set of Ra-tumor+Pr (A and B). |
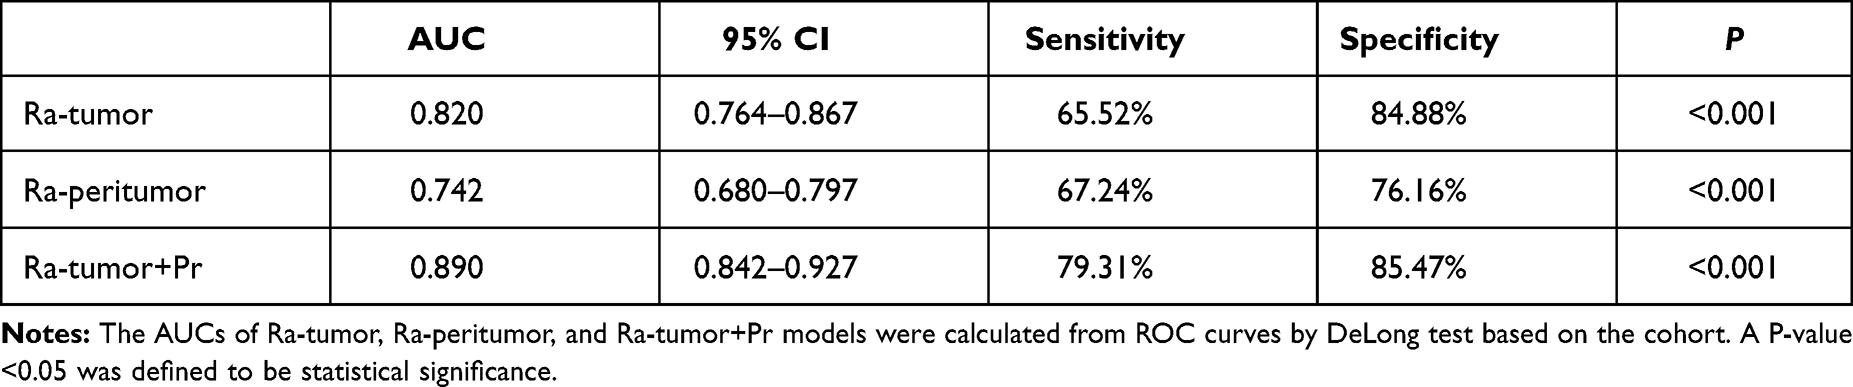 |
Table 3 The Cohort of Ra-Tumor, Ra-Peritumor, and Ra-tumor+Pr Models |
Discussion
In the preliminary stage, we found that it is difficult to accurately delineate the tumoral and mini-peritumoral VOI of UP images compared with CMP and NP. Notwithstanding, previous research comparing the diagnostic efficiency of UP, CMP, and NP has found that UP tumoral CT-radiomics analysis achieved better performance in differentiating fp-AML from ccRCC.17 With respect to the feasibility of VOI segmentation, we compared the CMP and NP images for analysis. Drawing upon two strands of research into the diagnostic accuracy of CMP and NP, the results suggest that the AUCs of NP were slightly higher than those of CMP in both training and validation sets. It provided statistical evidence for our subsequent studies on NP images.
The characteristics of peritumoral tissue provided the information of tumor infiltration and pathological stage,18 and determined patient surgery strategies.19 It has previously been observed that the width of the safety margin was 3.2±2.4mm in T1a renal tumors.20 Quanlin Li et al explored the surgical mini-margin status of T1 RCC and found the mean width of the margin was 2.2mm (range from 0 to 6 mm).21 Additionally, data from their recent studies reported that 83.0% of T1 RCC had margins less than 3mm, and 19.3% of them had margins of 0mm.22 As such, we depicted the mini-peritumoral VOI by automatically expanding 2-mm from the margin of the lesion. Moreover, the mini-peritumoral tissue was divided into perirenal and perifat margin according to the adjacent tissue of lesions. The current study explored, for the first time, the perirenal and perifat radiomics to distinguish fp-AML and ccRCC. The AUCs of Ra-Pr were statistically higher than those of Ra-Pf (0.745/0.700 vs 0.683/0.608 in the training and validation set), and more optimal radiomics features were selected in this logistic models (5 vs 4 optimal features). These results highlighted that the effect of the lesion on perirenal tissue was more obvious than that on perifat tissue. This may be due to the fact that the surface of the renal cortex is covered with a renal capsule composed of a tough fibrous layer.23 The fibrous capsule provided further protection from tumor spreading or seeding to perifat tissue.24 These results generated fresh insights into the different excision scopes according to the lesion location in surgeries.
The previous literature on CT-based radiomics classification revealed that tumoral texture analysis facilitated the differentiation of fp-AML from RCC.25 Therefore, a holistic approach integrating tumoral and perirenal radiomics features was utilized to establish a logistic classifier in differentiating fp-AML from ccRCC. Our results showed that the pooled Ra-tumor+Pr had promising discrimination compared with simple Ra-tumor or Ra-peritumor (AUCs: 0.890 vs 0.820, 0.742). Therefore, we should especially focus on the entire role of tumoral and peritumoral analysis in clinical routine.
There were certain limitations to the present study. Firstly, this was a single-center and retrospective study. Some potential selection bias and smaller unequal sample size may matter the results. Hence, larger studies and external validation should be performed for more accurate outcomes. Secondly, we took a width of 2-mm for mini-peritumoral analysis, with respect to minimizing the effects of normal kidney tissue and data from some previous studies. While the margin of peritumoral scope remains to be further analyzed. Thirdly, we merely chose CMP and NP for analysis because of the infeasibility of delineating tumoral and mini-peritumoral VOI. Fourthly, the tumoral VOI segmentation was depicted manually with “ITK” software, which may cause measurement error. Thus, an automatic segmentation approach was needed for further development.
Taken together, the validity of NP to differentiate fp-AML from ccRCC was slightly higher than that of CMP. To the mini-peritumoral analysis of NP, the Ra-Pr had a superiority over the Ra-Pf in distinction, and the lesions invaded to the perirenal tissue more than to the perifat tissue. It is of great significance for the individual therapeutic surgeries based on the different lesion location. The pooled tumoral and perirenal radiomics analysis was the most promising approach in distinguishing fp-AML and ccRCC.
Highlights
- The validity of NP to differentiate fp-AML from ccRCC was slightly higher than that of CMP. To the mini-peritumoral analysis of NP, the Ra-tumor+Pr analysis combined tumoral and perirenal radiomics features was of most significant in differentiating fp-AML from ccRCC compared with single Ra-tumor and Ra-peritumor.
- To the mini-peritumoral analysis of NP, the lesions invaded to the perirenal tissue more severely than to the perifat tissue.
Funding
This study is funded by the fund of Medical and Health Research Projects of Health Commission of Zhejiang Province (No.2018KY247).
Disclosure
The authors declare that they have no disclosures relevant to the subject matter of this article.
References
1. Kim JK, Park S, Shon J, Cho K. Angiomyolipoma with minimal fat: differentiation from renal cell carcinoma at biphasic helical CT. Radiology. 2004;230:677–684. doi:10.1148/radiol.2303030003
2. Sooriakumaran P, Gibbs P, Coughlin G, et al. Angiomyolipomata: challenges, solutions, and future prospects based on over 100 cases treated. BJU Int. 2010;105:101–106. doi:10.1111/j.1464-410X.2009.08649.x
3. Jinzaki M, Silverman SG, Akita H, Nagashima Y, Mikami S, Oya M. Renal angiomyolipoma: a radiological classification and update on recent developments in diagnosis and management. Abdom Imaging. 2014;39:588–604. doi:10.1007/s00261-014-0083-3
4. Prando A, Prando DP, Prando P. Renal cell carcinoma: unusual imaging manifestations. Radiographics. 2006;26:233–244. doi:10.1148/rg.261055060
5. Kim SH, Kim CS, Kim MJ, Cho JY, Cho SH. Differentiation of clear cell renal cell carcinoma from other subtypes and fat-poor angiomyolipoma by use of quantitative enhancement measurement during three-phase MDCT. Am J Roentgenol. 2016;2016:21–28. doi:10.2214/AJR.15.14666
6. Woo S, Suh CH, Cho JY, Kim SY, Kim SH. Diagnostic performance of CT for diagnosis of fat-poor angiomyolipoma in patients with renal masses: a systematic review and meta-analysis. AJR Am J Roentgenol. 2017;209:297–307. doi:10.2214/AJR.17.18184
7. Gillies RJ, Kinahan PE, Hricak H. Radiomics: images are more than pictures, they are data. Radiology. 2016;278:563–577. doi:10.1148/radiol.2015151169
8. Ma Y, Ma W, Xu X, Cao F. How does the delta-radiomics better differentiate pre-invasive GGNs from invasive GGNs? Front Oncol. 2020;10:1017. doi:10.3389/fonc.2020.01017
9. Li H, Li A, Zhu H, et al. Whole-tumor quantitative apparent diffusion coefficient histogram and texture analysis to differentiation of minimal fat angiomyolipoma from clear cell renal cell carcinoma. Acad Radiol. 2019;26:632–639. doi:10.1016/j.acra.2018.06.015
10. Ma Y, Cao F, Xu X, Ma W. Can whole-tumor radiomics-based CT analysis better differentiate fat-poor angiomyolipoma from clear cell renal cell carcinoma: compared with conventional CT analysis? Abdom Radiol (New York). 2020;45:2500–2507. doi:10.1007/s00261-020-02414-9
11. Hodgdon T, Mcinnes MD, Schieda N, Flood TA, Lamb L, Thornhill RE. Can quantitative CT texture analysis be used to differentiate fat-poor renal angiomyolipoma from renal cell carcinoma on unenhanced CT images? Radiology. 2015;276:787–796. doi:10.1148/radiol.2015142215
12. Shu J, Tang Y, Cui J, et al. Clear cell renal cell carcinoma: CT-based radiomics features for the prediction of Fuhrman Grade. Eur J Radiol. 2018;109:8–12. doi:10.1016/j.ejrad.2018.10.005
13. Quan Y. CT-based peritumoral radiomics signatures to predict early recurrence in hepatocellular carcinoma after curative tumor resection or ablation. Cancer Imaging. 2019;19:11.
14. Prasanna P, Patel J, Partovi S, Madabhushi A, Tiwari P. Radiomic features from the peritumoral brain parenchyma on treatment-naive multi-parametric MR imaging predict long versus short-term survival in glioblastoma multiforme: preliminary findings. Eur Radiol. 2017;27:4188–4197. doi:10.1007/s00330-016-4637-3
15. Kraemer HC. Correlation coefficients in medical research: from product moment correlation to the odds ratio. Stat Methods Med Res. 2006;15:525–545. doi:10.1177/0962280206070650
16. Sureka B, Khera PS. Radiologic classification and imaging features of renal angiomyolipomas according to the amount of fat. AJR Am J Roentgenol. 2018;210:136. doi:10.2214/AJR.17.19079
17. Yang R, Wu J, Sun L, et al. Radiomics of small renal masses on multiphasic CT: accuracy of machine learning–based classification models for the differentiation of renal cell carcinoma and angiomyolipoma without visible fat. Eur Radiol. 2020;30:1254–1263. doi:10.1007/s00330-019-06384-5
18. Lu Q, Ji C, Zhao X, et al. Histopathologic analysis of tumor bed and peritumoral pseudocapsule after in vitro tumor enucleation on radical nephrectomy specimen for clinical T1b renal cell carcinoma. Urol Oncol. 2017;35:
19. Cocca D, Cochetti G, Zingaro MD, Lepri E, Mearini E. Evaluation of peritumoral pseudocapsule characteristics: preliminary results. Eur Urol Suppl. 2019;18:e3156. doi:10.1016/S1569-9056(19)33482-7
20. Kim M, Choi WS, Jeong CW, et al. Differences in peritumoral pseudocapsule characteristics according to clinicopathological factors in clinical T1a renal tumors. Int J Clin Exp Pathol. 2015;8:11323–11331.
21. Li QL, Cheng L, Guan H-W, Zhang Y, Wang F-P, Song X-S. Safety and efficacy of mini-margin nephron-sparing surgery for renal cell carcinoma 4-cm or less. Urology. 2008;71:924–927. doi:10.1016/j.urology.2007.11.078
22. Li Q, Guan H, Qin J, Jiang T. Mini-Margin nephron sparing surgery for renal cell carcinoma 4 cm or less. Adv Urol. 2010;2010:145942. doi:10.1155/2010/145942
23. Ha US, Lee KW, Jung JH, Byun SS, Hong SH. Renal capsular invasion is a prognostic biomarker in localized clear cell renal cell carcinoma. Sci Rep. 2018;8:202. doi:10.1038/s41598-017-18466-9
24. Song T, Yin Y, Liao B, Zheng S, Wei Q. Capsular invasion in renal cell carcinoma: a meta-analysis. Urol Oncol. 2013;31:1321–1326. doi:10.1016/j.urolonc.2011.12.019
25. Feng Z, Rong P, Cao P, et al. Machine learning-based quantitative texture analysis of CT images of small renal masses: differentiation of angiomyolipoma without visible fat from renal cell carcinoma. Eur Radiol. 2018;28:1625–1633. doi:10.1007/s00330-017-5118-z
 © 2021 The Author(s). This work is published and licensed by Dove Medical Press Limited. The full terms of this license are available at https://www.dovepress.com/terms.php and incorporate the Creative Commons Attribution - Non Commercial (unported, v3.0) License.
By accessing the work you hereby accept the Terms. Non-commercial uses of the work are permitted without any further permission from Dove Medical Press Limited, provided the work is properly attributed. For permission for commercial use of this work, please see paragraphs 4.2 and 5 of our Terms.
© 2021 The Author(s). This work is published and licensed by Dove Medical Press Limited. The full terms of this license are available at https://www.dovepress.com/terms.php and incorporate the Creative Commons Attribution - Non Commercial (unported, v3.0) License.
By accessing the work you hereby accept the Terms. Non-commercial uses of the work are permitted without any further permission from Dove Medical Press Limited, provided the work is properly attributed. For permission for commercial use of this work, please see paragraphs 4.2 and 5 of our Terms.