")
Back to Journals » Journal of Pain Research » Volume 10
A cross-sectional study of factors associated with the number of anatomical pain sites in an actual elderly general population: results from the PainS65+ cohort
Authors Dragioti E , Larsson B , Bernfort L, Levin LÅ , Gerdle B
Received 1 June 2017
Accepted for publication 25 July 2017
Published 23 August 2017 Volume 2017:10 Pages 2009—2019
DOI https://doi.org/10.2147/JPR.S143060
Checked for plagiarism Yes
Review by Single anonymous peer review
Peer reviewer comments 2
Editor who approved publication: Dr Katherine Hanlon
Elena Dragioti,1 Britt Larsson,1 Lars Bernfort,2 Lars-Åke Levin,2 Björn Gerdle1
1Department of Medical and Health Sciences, Faculty of Health Sciences, Pain and Rehabilitation Centre, 2Division of Health Care Analysis, Department of Medical and Health Sciences, Linköping University, Linköping, Sweden
Background: Several studies have illustrated that multisite pain is more frequent than single pain site, and it is associated with an array of negative consequences. However, there is limited knowledge available about the potential factors associated with multisite pain in the elderly general population.
Objective: This cross-sectional study examines whether the number of anatomical pain sites (APSs) is related to sociodemographic and health-related factors in older adults including oldest-old ages using a new method (APSs) to assess the location of pain on the body.
Materials and methods: The sample came from the PainS65+ cohort, which included 6,611 older individuals (mean age = 76.0 years; standard deviation [SD] = 7.4) residing in southeastern Sweden. All the participants completed and returned a postal survey that measured sociodemographic data, total annual income, pain intensity and frequency, general well-being, and quality of life. The number of pain sites (NPS) was marked on a body manikin of 45 sections, and a total of 23 APSs were then calculated. Univariable and multivariable models of regression analysis were performed.
Results: Approximately 39% of the respondents had at least two painful sites. The results of the regression analysis showed an independent association between the APSs and the age group of 75–79 years, women, married, high pain intensity and frequency, and low well-being and quality of life, after adjustments for consumption of analgesics and comorbidities. The strongest association was observed for the higher frequency of pain.
Conclusion: Our results suggest that APSs are highly prevalent with strong relationships with various sociodemographic and health-related factors and concur well with the notion that multisite pain is a potential indicator of increased pain severity and impaired quality of life in the elderly. Our comprehensive method of calculating the number of sites could be an essential part of the clinical presentation, assessment, and treatment of multisite pain.
Keywords: pain spread, multisite pain, quality of life, well-being, elderly
Introduction
Pain is one of the most serious health concerns worldwide.1–4 Several studies have demonstrated an increasing pain prevalence, which in turn leads to a substantial accumulative global health and economic burden.1,2,5–8 In addition, a recent study determined that pain is one of the leading reasons of global years lived with disability.1 Therefore, it is reasonable to adopt the notion that as life expectancy increases, the impact of pain-related disability will increase.1,8 Hence, pinpointing factors associated with pain in older adults is indispensable for optimal pain clinical assessment, management, and treatment.
Currently, a paradigm shift in our understanding of pain has taken place. Pain is now regarded as a continuum of “spreadness” from single pain site to multisite pain,3,7,9–15 and there are no natural cutoff points between localized and widespread pain.11 It is increasingly evident that the existence of multisite pain is more frequent than the existence of the single pain site.3,7,11,16,17 Almost 60% of the individuals aged ≥65 years reported multisite pain;16 similar figures have been estimated in younger ages.7 Recently, it has been found that the manifestation of multisite pain increases four times the likelihood of health care consumption, sickness absence, and restricted work.7 Further evidence persistently demonstrates that multisite pain is one of the central components of pain-related disability.6,8,14,15,18–21 Principally, in patients aged ≥50 years, several studies highlight the strong association of multisite pain with an array of adverse consequences such as sleep problems,22,23 mental14,22,24,25 and physical comorbidities,9,22,24 poor psychical functioning,14,15,26 complaints on cognitive performance,27 low quality of life and well-being,21,28 and greater risk of falls and impaired balance.8,16,29 The functional consequences of pain depend on the number of painful sites on the body – the more spreading of pain, the lower psychical and social functionality.7,8,10,22 Results from a Norwegian study of multisite pain showed a linear relationship between several demographic characteristics, lifestyle, and health-related factors and the number of pain sites (NPS) in a general population, ranging from 24 to 86 years old.11 We have recently shown that female sex, pain duration, pain interference, anxiety, and insomnia are significantly related to the increase in the NPS in adult patients with chronic pain referred to a multidisciplinary pain center.30
Given the likely repercussions of multisite pain, more emphasis should be given to this research area with respect to older adults for two methodological reasons. First, the epidemiological evidence in relation to the prevalence and the potential factors of multisite pain in actual older adults is rather sparse. Most of these studies have merged adults and older adults,6,9,11,12,14,15,20–22,28,31,32 and to the best our knowledge, only a few of those studies included either solely elderly subjects (≥65 years) or old-old (i.e., 75–84 years) and oldest-old subjects (i.e., aged ≥85 years).8,24–26 Kamaleri et al,12 for example, excluded the oldest-old-age group from the analysis due to small sample size. Second, most of the studies only include 7–10 NPS based on the distribution of pain location on the body,7,10,11,17,33,34 a practice that may facilitate the methodological procedure but probably leads to an underestimation of the definite NPS, thus the burden of the pain. From a clinical point of view, pain can be present in four separate anatomical sections in an upper extremity (i.e., hand, forearm, upper arm, and shoulder) or in only one section (e.g., hand) or in a combination of these sections (e.g., hand and upper arm). This categorization means that in the first case, four pain sites can be calculated, and in the other cases, one to three pain sites can be calculated. As a result, the definition of an upper extremity as one pain site regardless of the anatomical section of pain may constitute a methodological flaw in the research area of the multisite pain. As Croft35 pointed out, the clinical question should not only include whether pain exists but also how much pain exists in the whole body. To address this need, this study investigated the prevalence of the number of anatomical pain sites (APSs) in a community sample of an actual aging population. This study also examines whether various sociodemographic characteristics and health-related factors are associated with the NPS based on a precise calculation of the anatomical distribution of pain on the body.
Materials and methods
Study design and sample
This cross-sectional study is a part of a health survey of a random sample of 10,000 older adults (defined as ≥65 years) residing in southeastern Sweden.24,36 A postal questionnaire was conducted between October 2012 and January 2013, and the data were collected by Statistics Sweden (SCB). Surveys were completed and returned by 6,739 individuals, with a response rate of 67.3%. Of these respondents, 128 were excluded because of missing data, so the final sample size was composed of 6,611 individuals (final response rate: 66.1%). The study was approved by the Regional Ethics Research Committee in Linköping, Sweden (Dnr: 2012/154-31). Patients’ informed consent was assumed through the completion and the return of the postal surveys.
Measurements
The NPS and the number of APSs
All the respondents marked their painful sites for the previous 7 days on a body manikin divided into 45 sections on the front and on the back (Figure 1).37 These sections were calculated and denoted as the NPS, ranging from 0 to 45. In a next step, based on these 45 sections, 23 APSs were determined and labeled as the number of APSs, ranging from 0 to 23 (Figure 2). High values indicated higher spreading of pain. An APS was defined as pain equally marked on the front and back of the manikin (e.g., knee, shoulder, and arm) or at least on one of them. In addition, our assessment considered, for example, that an upper extremity comprises four anatomical sites according to the distribution of sections on the manikin (i.e., hand, forearm, upper arm, and shoulder). This span of APSs constitutes the most pain possible to experience within an extremity. Hence, we localized pain to 23 body regions as follows: foot right, foot left, lower leg right, lower leg left, thigh right, thigh left, hand right, hand left, forearm right, forearm left, upper arm right, upper arm left, shoulder right, shoulder left, neck/throat, head right, head left, stomach, chest, gluteal, low back, upper back, and genitals (Figure 2).
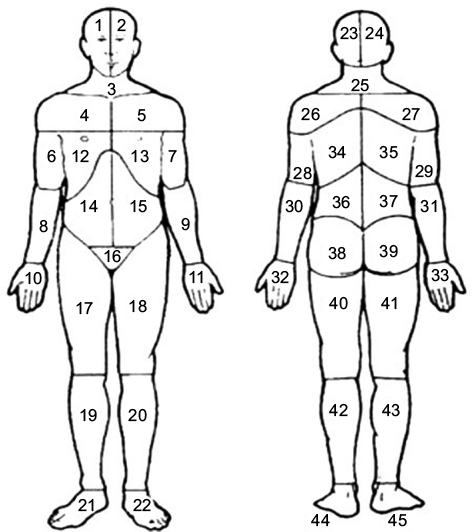 | Figure 1 Body manikins used to define the 45 pain sites in the front and the back Notes: Reproduced from Margolis RB, Tait RC, Krause SJ. A rating system for use with patient pain drawings. Pain. 1986;24(1):57–65. Available from: https://insights.ovid.com/pubmed?pmid=2937007. Promotional and commercial use of the material in print, digital or mobile device format is prohibited without the permission from the publisher Wolters Kluwer. Please contact [email protected] for further information.53. |
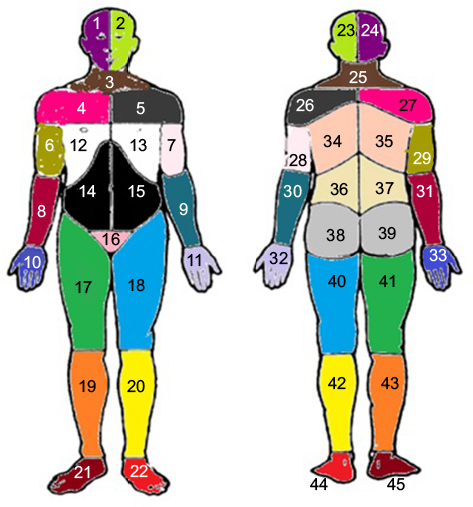 | Figure 2 Preshaded manikins used to define the 23 APSs; each area of the same color corresponds to the same APS in the front and the back of the body. Notes: Foot right (area 21 or 45 or both); foot left (area 22 or 44 or both); lower leg right (area 19 or 43 or both); lower leg left (area 20 or 42 or both); thigh right (area 17 or 41 or both); thigh left (area 18 or 40 or both); hand right (area 10 or 33 or both); hand left (area 11 or 32 or both); forearm right (area 8 or 31 or both); forearm left (area 9 or 30 or both); upper arm right (area 6 or 29 or both); upper arm left (area 7 or 28 or both); shoulder right (area 4 or 27 or both); shoulder left (area 5 or 26 or both); neck/throat (area 3 or 25 or both); head right (area 1 or 24 or both); head left (area 2 or 23 or both); stomach (area 14 or 15 or both); chest (area 12 or 13 or both); gluteal (area 38 or 39 or both); low back (area 36 or 37 or both); upper back (34 or 35 or both); genitals (area 16). Adapted from Margolis RB, Tait RC, Krause SJ. A rating system for use with patient pain drawings. Pain. 1986;24(1):57–65. Available from: https://insights.ovid.com/pubmed?pmid=2937007. Promotional and commercial use of the material in print, digital or mobile device format is prohibited without the permission from the publisher Wolters Kluwer. Please contact [email protected] for further information.53 Abbreviation: APSs, anatomical pain sites. |
Sociodemographic features
We assessed basic sociodemographic information including age, sex, civil status, educational level, and income. Age was categorized into the following age groups: 65–69, 70–74, 75–79, 80–84, and 85 years and above. Civil status was categorized as follows: single, married, divorced, and widowed. Educational level was classified into the following three groups: elementary school, secondary school (upper secondary or vocational), and university. The total annual income was assessed using Euro prices (2012).
Pain intensity
Pain intensity over the preceding 7 days was assessed using an 11-point numeric rating scale (NRS7d), ranging from 0 (no pain) to 10 (worst imaginable pain).38
Pain frequency
The pain frequency was assessed by a single question: “How often did you have pain during the previous 7 days?” The available answer options were 1) seldom, 2) sometimes, 3) often, or 4) always/nearly always.
Psychological well-being and distress
The General Well-being Schedule (GWBS) was used to capture individual’s subjective feelings of psychological well-being and distress. As developed by Fazio,39 the GWBS measures psychological well-being and distress over a month. GWBS consists of 18 items, and the first 14 items use a 6-point rating scale (ranging from 0 to 5), and the remaining four items use an 11-point rating scale (ranging from 0 to10). According to the scoring instructions, the items 1, 3, 6, 7, 9, 11, 13, 15, and 16 are reverse scored. The instrument yields a total score ranging from 0 to 110 with interval 0–60 reflecting severe distress, 61–72 moderate distress, and 73–110 positive well-being. The instrument has provided good internal consistency, test–retest reliability, and validity.39 The instrument can further be divided into six subscales: 1) GWBS – general health: items 10, 15; possible range: 0–15; 2) GWBS – anxiety: items 2, 5, 8, 16; possible range: 0–25; 3) GWBS – depression: items 4, 12, 18; possible range: 0–20; 4) GWBS – positive well-being: items 1, 6, 11; possible range: 0–15; 5) GWBS – self-control: items 3, 7, 13; possible range: 0–15; and 6) GWBS – vitality: items 9, 14, 17; possible range: 0–20.40 This study presents the results only for the total score treated as continuous variable.
Health-related quality of life
The health-related quality of life was measured using the Euro Quality of Life Vertical Visual Analog Scale (EQ-5D-VAS). The EQ-5D-VAS measures the respondent’s self-rated health on a vertical visual analog scale ranging from 0 to 100, where 0 represents the “worst imaginable health state” and 100 represents the “best imaginable health state.”40
Overall life satisfaction
The overall life satisfaction was measured by a single question: “Overall, how satisfied are you with your life as a whole these days?” The responses were recorded using an 11-point numeric rating scale with end points 0 (very dissatisfied) and 10 (very satisfied).
Confounding factors
The questionnaire also contained questions on potential confounding factors, such as consumption of prescribed and non-prescribed analgesics during the previous 7 days (no; yes, but occasionally; yes, on several occasions but not daily; and yes, daily) and the presence of current comorbidities. Comorbidities were measured using a self-reported questionnaire covering 12 physical and psychological disorders/conditions over the previous 2 weeks (i.e., traumatic injuries, rheumatoid arthritis and osteoarthritis, cardiovascular disorders, pulmonary disorders, depressive disorders, anxiety disorders, gastrointestinal disorders, disorders of the central nervous system, urogenital disorders, skin disorders, tumors and cancer, and metabolic disorders) with yes/no responses.24 These responses were further calculated, and a total number of comorbidities were determined, ranging from 0 to 12. High values indicate higher multicomorbidity.
Statistical analysis
The statistics were performed using the statistical package IBM SPSS Statistics (version 23.0; IBM Corporation, Armonk, NY, USA). In all tests, a p-value of ≤0.05 (two-tailed) was considered significant. Distributions and descriptive statistics were examined for all variables. Continuous data are reported as the mean and standard deviation (SD), and the categorical data are represented as n (%). The parametric independent Student’s t-test was used to examine possible bivariate differences between the APSs and sex. Multiple linear regression (MLR) analysis was used to regress the APSs (dependent variable) using the following explanatory factors: age groups (reference category: 65–69), females (reference category: males), civil status (reference category: single), education (reference category: elementary school), annual income, pain intensity, pain frequency (reference category: seldom), total score of GWBS, EQ-5D-VAS, and overall life satisfaction. Multicollinearity was assessed by examining the variance of inflation factor (VIF). A value of 10 has been recommended as the maximum accepted level of VIF.41 In general, lower levels of VIF are desirable, as higher levels of VIF are known to affect adversely the results associated with a multiple regression analysis.41 We presented three models: a univariable model with each explanatory factor one at a time (model 1); a multivariable unadjusted model with all the significant explanatory factors derived from the univariable model, in one model, simultaneously controlled for (model 2); and a model with all the significant explanatory factors derived from the univariable model adjusted for the consumption of analgesics and total number of comorbidities (model 3). However, the same MLR models were performed to regress the NPS (0–45 sites), and the results of both linear regression analyses were compared.
Results
Descriptive characteristics of the sample
Table 1 summarizes the sociodemographic features and all the examined variables. Details of the response rate and the general characteristics of the sample have been described elsewhere.36 Briefly, there were 3,057 males (46%) and 3,554 females (54%). The mean age of the total sample was 76 years (SD = 7.4). Women were older than men (p < 0.001). Most of the respondents were married (57%) with elementary education (52%). The mean pain intensity was 4.5 (SD = 2.3), and most of the respondents reported pain often (35%). The mean values for the total GWBS, EQ-5D-VAS, and the overall life satisfaction were generally high. Most of the respondents consumed analgesics (63%) on various occasions, and the mean total number of comorbidities was two (SD = 1.5).
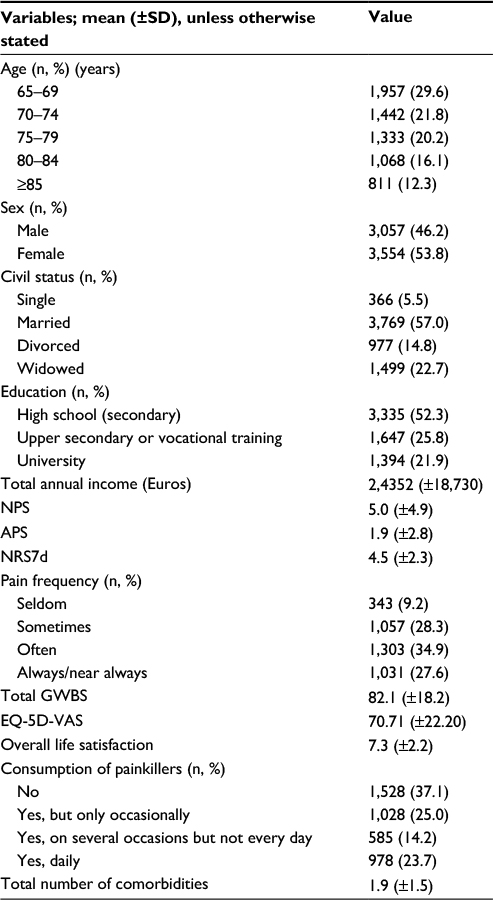 | Table 1 Distribution of sociodemographic characteristics and all studied variables in the whole sample (n = 6,611)a Note: aSome of these results have also been reported in the study by Bernfort et al.36 Abbreviations: APS, anatomical pain site; GWBS, General Well-Being Schedule; NPS, number of pain sites; SD, standard deviation; EQ-5D-VAS, the Euro Quality of Life Vertical Visual Analog Scale; NRS7d, pain intensity for the previous 7 days measured by numeric rating scale. |
Prevalence of the number of APSs, APS location, and sex differences
As listed in Table 1, the mean number of APSs was 1.9 (SD = 2.8). Figure 3 shows the distribution of the prevalence of APS reported for the previous 7 days in the total sample and between the two sexes categorized into 0, 1, and 2 for the 23 pain sites: 54% of the males reported zero painful sites compared to 44% of the females (p < 0.001). Approximately 13% of the respondents reported pain at one pain site (12.9% males, 12.4% females), and nearly 39% reported pain at two or more sites (32.9% males, 43.5% females). The distribution of the location of APSs is presented in Table 2. The most common anatomical painful sites (combined for lower and upper extremities) were the lower extremities, upper extremities, the gluteal area, and the low back (72%, 45%, 13%, and 14%, respectively). Females reported significantly higher proportions of pain in almost all anatomical pain regions compared to males (p < 0.001), whereas males reported significantly higher proportions of pain only in the genitals (p < 0.01; Figure 4).
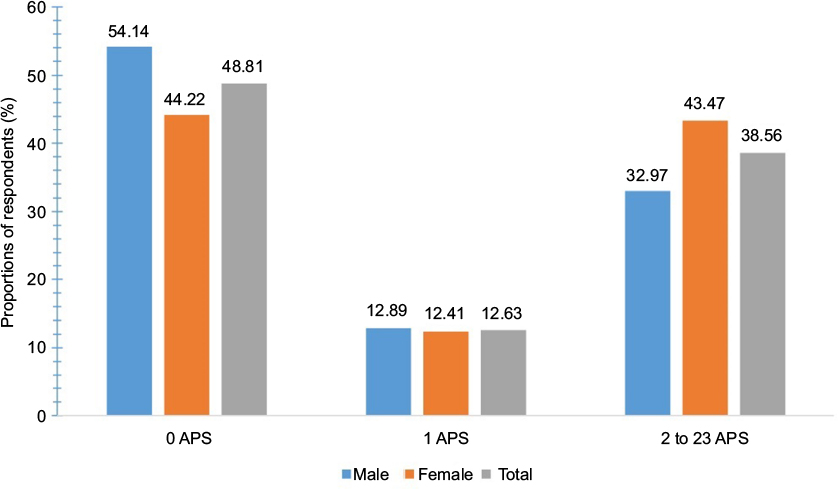 | Figure 3 Distributions of the number of APSs categorized into 0, 1, 2, to 23 pain sites in males, females, and the total sample. Notes: The y-axis represents the proportions of respondents (%). The x-axis represents the number of APSs categorized into 0, 1, 2 to 23 pain sites. Abbreviation: APSs, anatomical pain sites. |
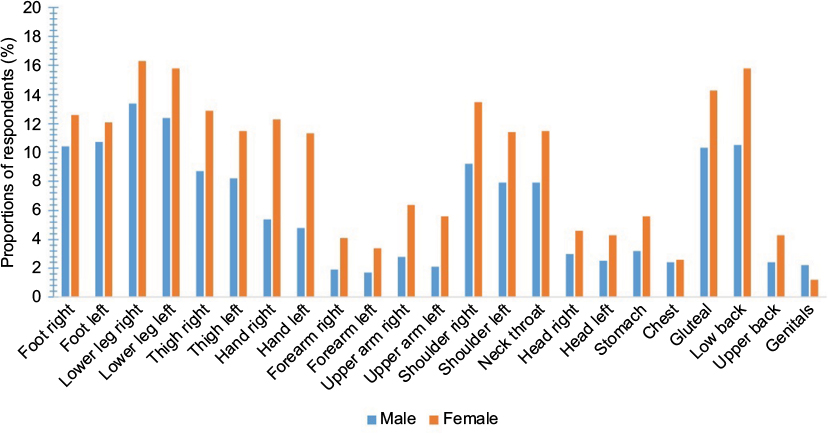 | Figure 4 Distributions of the location of the APSs in males and females. Notes: The y-axis represents the proportions of respondents (%). The x-axis represents the anatomical pain sites for both sexes. Abbreviation: APSs, anatomical pain sites. |
 | Table 2 The total number of APSs and the location of the APSs in the whole sample Abbreviation: APSs, anatomical pain sites. |
Univariable analysis of the relationship between the number of APSs and the examined variables
The results derived from the univariable regression analysis are presented in Table 3. A significant association between all the examined variables and the APSs (with the exception of education) was observed. Thus, education was not introduced into the multivariable models. Finally, only the age group of 75–79 years was also significantly associated with the APSs.
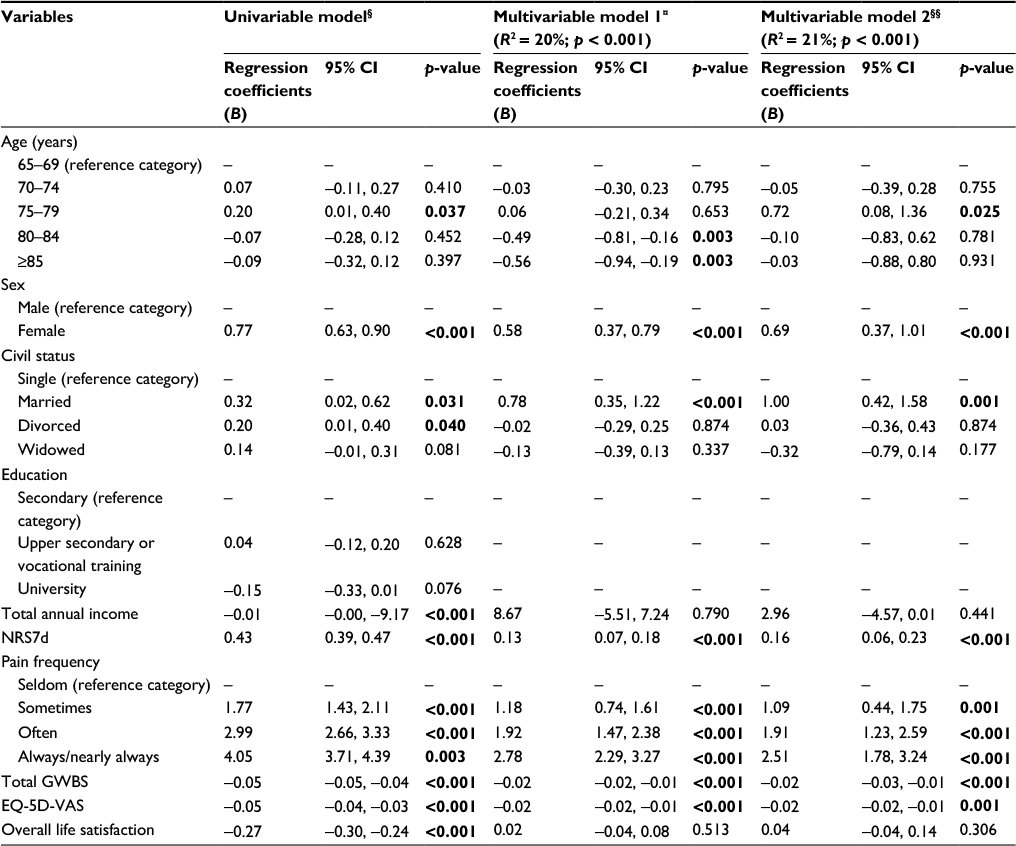 | Table 3 Results of regression analyses: cross-sectional associations of the factors associated with the number of APSs Notes: §Each independent factor one at a time. ¤Unadjusted multivariable analysis of all significant factors derived from univariable analysis together in one model, simultaneously controlled for. §§Multivariable analysis of the associations of multivariable model 1 adjusted for consumption of analgesics and the total number of comorbidities. Significant p-values are given in bold. Abbreviations: APSs, anatomical pain sites; NRS7d, pain intensity for the previous 7 days measured by numeric rating scale; EQ-5D-VAS, the Euro Quality of Life Vertical Visual Analog Scale; B, unstandardized regression coefficients; R2, multiple correlation coefficient squared; CI, confidence interval; GWBS, General Well-Being Schedule. |
Multivariable analysis of the relationship between the APSs and the examined variables
Table 3 demonstrates the results of the multivariable regression analysis. No serious problem of multicollinearity was observed; the mean VIF was <2 for all exploratory variables in both multivariable models.
Female sex (p < 0.001), being married (p < 0.001), pain intensity (p < 0.001), and pain frequency (all p < 0.001) were positively associated with the APSs, while the age groups of 80–84 and ≥85 years (p < 0.01), total GWBS (p < 0.001), and EQ-5D-VAS (p < 0.001) were negatively associated with the APSs (Table 3, multivariable model 1). The model explained 20% of the total variance (R2 = 0.20, p < 0.001). Adjustments for consumption of analgesics and the total number of comorbidities did not alter the strength and the number of the observed associations (Table 3, multivariable model 2). However, in the adjusted model, the negative association between the age groups of 80–84 and ≥85 years and NPS disappeared, while a positive association between the age group of 75–79 years and APSs emerged (as in univariable model). The observed univariable association between income, overall life satisfaction, and APSs was not retained in any of the multivariable models. In addition, we performed the same analysis with the old definition of NPS as the dependent variable (Table S1). The results did not support any significant association between the NPS and all the examined variables.
Discussion
In the current cross-sectional study, we examined the associations between the number of APSs, sociodemographic features, and health-related factors in a large sample of general population of older individuals including old-old and oldest-old ages. Using a new measurement tool (APS), we found a relatively high prevalence of multisite pain; more than one-third of the respondents noted pain in at least two pain sites. In the age group of 70–74 years, being a woman, married, higher pain intensity and frequency, and low well-being and quality of life were independently associated with the increase in the APSs. Our results are in accordance with the findings that patients with more generalized pain, such as those with widespread pain or fibromyalgia, report higher pain intensity and worse quality of life than those with no widespread pain or fibromyalgia.24,42,43 Our results also indicate that counting only the NPS without considering the anatomical location of pain may have minimal clinical and practical value in the assessment of the burden of pain and its consequences.
Our study provides additional support for the prevalence of multisite pain on the body as previously illustrated in various epidemiological studies not focused only on older adults,3,10,11,16,17,20,28 although we found a lower percentage compared to those studies.11,21,26 We estimated that 39% of older individuals had at least two painful sites compared to 13% who reported pain at one pain site, a finding relatively compatible with a Norwegian population-based study, which found that 53% of individuals aged 24–76 years reported multisite pain analogized to 17% who reported single pain site.10 A large population study from the UK also verified a high prevalence of multisite pain in persons aged ≥50 years; approximately 66% of the respondents reported pain at more than two sites.21 Despite the prevalence of differences, our results (Figure 3) agree well with the notion that the occurrence of multisite pain is more common than the occurrence of single site pain3,7,10,11,14,16,17,20 and confirms as well as updates our previous findings on the prevalence of spreading of pain in older adults.24 In our study, pain was most frequent in the lower extremities, a finding that previous reports have also observed.28 Other studies have reported that pain is most prevalent in the neck and in the back.3,34 Nonetheless, it is important to note that the variation in the NPS in our study in contrast to the other studies may well account for inconsistencies of several findings. Thus, we assessed three pain sites in the lower extremities instead of one site, which is the method used in some other studies.3,34 Although the majority of studies used the same pain measurement (i.e., body manikin), deviations in the examined total NPS based on the anatomical regions have been used.7,10,11,17,33,34
The regression analysis confirms that the increase in the number of APSs was more likely to be associated with female sex.11,12,20,24 A recent meta-analysis found that female-to-male prevalence ratios of widespread pain ranged from 1.06 to 4.80 in the general population.44 However, the association of multisite pain with the other sociodemographic features is still under consideration. Consistent with previous research on spreading of pain in the elderly,45,46 we found a positive association of the increase in the number of APSs with the middle 70s; however, other studies have found a negative association with advancing age.21,32,44 This difference might be because older people with possibly impaired health status including multisite pain were either dead, hospitalized, or otherwise unable to answer the questionnaire at the time of study. As with Kamaleri et al,11 we found that the increase in the number of APSs is more likely to occur in married individuals compared to single ones. A possible explanation could include physical demands related to housekeeping activities contributing to pain in married older adults. Emerging evidence also advocates that multisite pain is strongly related to high physical demands/workload in female populations.47,48 We did not observe any significant association between multisite pain and educational level, a finding that contradicts earlier findings.12,37 Unlike other research, we did not confirm the association between the number of APSs and income.34,49,50 Generally, these observed discrepancies across studies are difficult to interpret and methodological variations with regard to participants/samples and pain site definitions, age range, data analysis, and perhaps geo-linguistic–cultural differences may be responsible.44
Not surprisingly, pain characteristics such as pain intensity and pain frequency were positively associated with the increase in the number of APSs. Thus, higher pain intensity and more frequent pain reflected greater spreading of pain on the body in our general population of old-old and oldest-old individuals. These results are supported by previous studies that have shown stronger relationships between multisite pain and/or spreading of pain, pain intensity, and pain frequency than other factors.17,25,37,51 The results also emphasize that pain intensity, frequency, and the amount of APSs should be considered important parts of the underlying concept of the pain experience. Such relationships, however, warrant further research for solid interpretations in terms of causative relation. Furthermore, our results confirmed the definite and important relationship of the increase in the number of APSs with impaired well-being and health-related quality of life. Indeed, several reports provide evidence that multisite and/or spreading of pain are potential markers of a worse/bad health-related quality of life.5,11,17,21,28,31,36,37,52 Emerging data show that not only the conditions of multisite pain such as osteoarthritis, rheumatoid arthritis, and fibromyalgia syndrome31 but also pain conditions without any specific diagnosis11 are associated with the worst health-related quality of life levels. However, in our study, we found a relatively low association between general well-being, quality of life, and the number of APSs compared with other findings.5,11,17,21,28,31,36,37,52 This difference might be due to the fact that our sample reported well-preserved levels of both well-being and quality of life in comparison to other general populations including older adults.21 In addition, as previously described, our sample was recruited from the general population and may represent a less impaired pain population.
Strength and limitations
This is one of the few studies that examines the association between APSs, sociodemographic factors, and health-related factors within a large and representative population cohort of actual older-aged adults. Another strength is the assessment of an appropriate number of APSs along with the relatively high response rate. However, when we applied the same MLR models to regress the old measurement of NPS (0–45 sites), no significant associations were observed. Several potential shortcomings need to be considered. The most important limitations relate to the cross-sectional study design, reversed causation of the results, and the use of a postal survey rather than a clinical assessment. In addition, we did not control for certain lifestyle factors such as smoking, alcohol intake, and physical activity. However, in a previous cross-sectional study from the same cohort, we did not confirm any association between spreading of pain and these lifestyle factors.24 Finally, our study did not assess the spatial distribution of pain – i.e., pain in anatomical regions that are related to each other (e.g., neck, shoulder, and low back).
Conclusion
Our data provide satisfactory evidence that research and clinical agenda should focus on the concept of multisite pain rather than on the pain affecting one body site if the intent is to promote healthy aging without pain-related disability. Multisite or spreading of pain is a very common condition, affecting almost half of the general elderly population. Pain intensity and frequency are positively related to the increase in the number of APSs, indicating that these pain aspects should be routinely addressed in the clinical assessment of pain and especially in the case of multisite pain. The results of this study also show a negative relationship between health-related quality of life and the number of APSs; the results were similar for both GWBS and EQ-5D-VAS. On these grounds, we can conclude that therapeutic strategies for pain should consider these associations, and our comprehensive method of calculating the number of sites (i.e., the use of the APSs) could be an essential way of considering the clinical management of widespread pain in the elderly. However, further longitudinal research on this topic is required.
Acknowledgments
The current study was sponsored by a grant from Grünenthal Sweden AB. The sponsor of the study had no role in study design, data collection, data analysis, data interpretation, writing of the report, or the decision to submit for publication. The authors had full access to all the data in the study and had final responsibility for the decision to submit for publication.
Author contributions
L-ÅL, LB, BL, and BG were involved in study conception and study design. ED and BG performed the data analyses and drafted the manuscript. All authors contributed toward data analysis, drafting and critically revising the paper and agree to be accountable for all aspects of the work.
Disclosure
The authors report no conflicts of interest in this work.
References
Vos T, Flaxman AD, Naghavi M, et al. Years lived with disability (YLDs) for 1160 sequelae of 289 diseases and injuries 1990–2010: a systematic analysis for the Global Burden of Disease Study 2010. Lancet. 2012;380(9859):2163–2196. | ||
Monti S, Caporali R. Chronic pain: the burden of disease and treatment innovations. Reumatismo. 2015;67(2):35–44. | ||
Parot-Schinkel E, Descatha A, Ha C, Petit A, Leclerc A, Roquelaure Y. Prevalence of multisite musculoskeletal symptoms: a French cross-sectional working population-based study. BMC Musculoskelet Disord. 2012;13:122. | ||
Dueñas M, Ojeda B, Salazar A, Mico JA, Failde I. A review of chronic pain impact on patients, their social environment and the health care system. J Pain Res. 2016;9:457–467. | ||
Leadley RM, Armstrong N, Reid KJ, Allen A, Misso KV, Kleijnen J. Healthy aging in relation to chronic pain and quality of life in Europe. Pain Pract. 2014;14(6):547–558. | ||
Peat G, Thomas E, Wilkie R, Croft P. Multiple joint pain and lower extremity disability in middle and old age. Disabil Rehabil. 2006;28(24):1543–1549. | ||
de Fernandes RC, Burdorf A. Associations of multisite pain with healthcare utilization, sickness absence and restrictions at work. Int Arch Occup Environ Health. 2016;89(7):1039–1046. | ||
Patel KV, Phelan EA, Leveille SG, et al. High prevalence of falls, fear of falling, and impaired balance in older adults with pain in the United States: findings from the 2011 National Health and Aging Trends Study. J Am Geriatr Soc. 2014;62(10):1844–1852. | ||
Lacey RJ, Strauss VY, Rathod T, et al. Clustering of pain and its associations with health in people aged 50 years and older: cross-sectional results from the North Staffordshire Osteoarthritis Project. BMJ Open. 2015;5(11):e008389. | ||
Kamaleri Y, Natvig B, Ihlebaek CM, Bruusgaard D. Localized or widespread musculoskeletal pain: does it matter? Pain. 2008;138(1):41–46. | ||
Kamaleri Y, Natvig B, Ihlebaek CM, Benth JS, Bruusgaard D. Number of pain sites is associated with demographic, lifestyle, and health-related factors in the general population. Eur J Pain. 2008;12(6):742–748. | ||
Kamaleri Y, Natvig B, Ihlebaek CM, Benth JS, Bruusgaard D. Change in the number of musculoskeletal pain sites: a 14-year prospective study. Pain. 2009;141(1–2):25–30. | ||
Croft PR, Dunn KM, Raspe H. Course and prognosis of back pain in primary care: the epidemiological perspective. Pain. 2006;122(1–2):1–3. | ||
Croft P, Jordan K, Jinks C. “Pain elsewhere” and the impact of knee pain in older people. Arthritis Rheum. 2005;52(8):2350–2354. | ||
Keenan AM, Tennant A, Fear J, Emery P, Conaghan PG. Impact of multiple joint problems on daily living tasks in people in the community over age fifty-five. Arthritis Rheum. 2006;55(5):757–764. | ||
Stubbs B, Eggermont L, Patchay S, Schofield P. Older adults with chronic musculoskeletal pain are at increased risk of recurrent falls and the brief pain inventory could help identify those most at risk. Geriatr Gerontol Int. 2015;15(7):881–888. | ||
Carnes D, Parsons S, Ashby D, et al. Chronic musculoskeletal pain rarely presents in a single body site: results from a UK population study. Rheumatology (Oxford). 2007;46(7):1168–1170. | ||
Haukka E, Kaila-Kangas L, Ojajarvi A, et al. Multisite musculoskeletal pain predicts medically certified disability retirement among Finns. Eur J Pain. 2015;19(8):1119–1128. | ||
Kamaleri Y, Natvig B, Ihlebaek CM, Bruusgaard D. Does the number of musculoskeletal pain sites predict work disability? A 14-year prospective study. Eur J Pain. 2009;13(4):426–430. | ||
Coggon D, Ntani G, Palmer KT, et al. Patterns of multisite pain and associations with risk factors. Pain. 2013;154(9):1769–1777. | ||
Lacey RJ, Belcher J, Rathod T, Wilkie R, Thomas E, McBeth J. Pain at multiple body sites and health-related quality of life in older adults: results from the North Staffordshire Osteoarthritis Project. Rheumatology (Oxford). 2014;53(11):2071–2079. | ||
Mundal I, Bjørngaard JH, Nilsen TI, Nicholl BI, Gråwe RW, Fors EA. Long-term changes in musculoskeletal pain sites in the general population: the HUNT study. J Pain. 2016;17(11):1246–1256. | ||
Chen Q, Hayman LL, Shmerling RH, Bean JF, Leveille SG. Characteristics of chronic pain associated with sleep difficulty in older adults: the maintenance of balance, independent living, intellect, and zest in the elderly (MOBILIZE) Boston study. J Am Geriatr Soc. 2011;59(8):1385–1392. | ||
Dragioti E, Larsson B, Bernfort L, Levin LÅ, Gerdle B. Prevalence of different pain categories based on pain spreading on the bodies of older adults in Sweden: a descriptive-level and multilevel association with demographics, comorbidities, medications, and certain lifestyle factors (PainS65+). J Pain Res. 2016;9:1131–1141. | ||
Denkinger MD, Lukas A, Nikolaus T, Peter R, Franke S; ActiFE Study Group. Multisite pain, pain frequency and pain severity are associated with depression in older adults: results from the ActiFE Ulm study. Age Ageing. 2014;43(4):510–514. | ||
Eggermont LH, Bean JF, Guralnik JM, Leveille SG. Comparing pain severity versus pain location in the MOBILIZE Boston study: chronic pain and lower extremity function. J Gerontol A Biol Sci Med Sci. 2009;64(7):763–770. | ||
Westoby CJ, Mallen CD, Thomas E. Cognitive complaints in a general population of older adults: prevalence, association with pain and the influence of concurrent affective disorders. Eur J Pain. 2009;13(9):970–976. | ||
Phongamwong C, Mungkumpa A, Pawapootanon W, Saiyotha D, Duangtapha C. The impact of musculoskeletal pain on health-related quality of life in Fort Prajaksilapakom Hospital. J Med Assoc Thai. 2014;97(suppl 2):S181–S187. | ||
Leveille SG, Jones RN, Kiely DK, et al. Chronic musculoskeletal pain and the occurrence of falls in an older population. JAMA. 2009;302(20):2214–2221. | ||
Alföldi P, Dragioti E, Wiklund T, Gerdle B. Spreading of pain and insomnia in patients with chronic pain: results from a national quality registry (SQRP). J Rehabil Med. 2016;49(1):63–70. | ||
Picavet HS, Hoeymans N. Health related quality of life in multiple musculoskeletal diseases: SF-36 and EQ-5D in the DMC3 study. Ann Rheum Dis. 2004;63(6):723–729. | ||
Thomas E, Peat G, Harris L, Wilkie R, Croft PR. The prevalence of pain and pain interference in a general population of older adults: cross-sectional findings from the North Staffordshire Osteoarthritis Project (NorStOP). Pain. 2004;110(1–2):361–368. | ||
Saastamoinen P, Leino-Arjas P, Laaksonen M, Martikainen P, Lahelma E. Pain and health related functioning among employees. J Epidemiol Community Health. 2006;60(9):793–798. | ||
Rannestad T, Skjeldestad FE. Socioeconomic conditions and number of pain sites in women. BMC Womens Health. 2012;12:7. | ||
Croft P. The question is not “have you got it”? But “how much of it have you got”? Pain. 2009;141(1–2):6–7. | ||
Bernfort L, Gerdle B, Rahmqvist M, Husberg M, Levin LÅ. Severity of chronic pain in an elderly population in Sweden – impact on costs and quality of life. Pain. 2015;156(3):521–527. | ||
Grimby-Ekman A, Gerdle B, Björk J, Larsson B. Comorbidities, intensity, frequency and duration of pain, daily functioning and health care seeking in local, regional, and widespread pain – a descriptive population-based survey (SwePain). BMC Musculoskelet Disord. 2015;16:165. | ||
Ferreira-Valente MA, Pais-Ribeiro JL, Jensen MP. Validity of four pain intensity rating scales. Pain. 2011;152(10):2399–2404. | ||
Fazio AF. A concurrent validational study of the NCHS general well-being schedule. Vital Health Stat 2. 1977;73:1–53. | ||
McDowell I. Measuring Health: A Guide to Rating Scales and Questionnaires. 3rd ed. Oxford: Oxford University Press; 2006. | ||
O’brien RM. A caution regarding rules of thumb for variance inflation factors. Qual Quant. 2007;41(5):673–690. | ||
Nicholl BI, Macfarlane GJ, Davies KA, Morriss R, Dickens C, McBeth J. Premorbid psychosocial factors are associated with poor health-related quality of life in subjects with new onset of chronic widespread pain – results from the EPIFUND study. Pain. 2009;141(1–2):119–126. | ||
Salaffi F, Sarzi-Puttini P, Girolimetti R, Atzeni F, Gasparini S, Grassi W. Health-related quality of life in fibromyalgia patients: a comparison with rheumatoid arthritis patients and the general population using the SF-36 health survey. Clin Exp Rheumatol. 2009;27(5 suppl 56):S67–S74. | ||
Mansfield KE, Sim J, Jordan JL, Jordan KP. A systematic review and meta-analysis of the prevalence of chronic widespread pain in the general population. Pain. 2016;157(1):55–64. | ||
Jakobsson U, Klevsgård R, Westergren A, Hallberg IR. Old people in pain: a comparative study. J Pain Symptom Manage. 2003;26(1):625–636. | ||
Wolfe F, Ross K, Anderson J, Russell IJ, Hebert L. The prevalence and characteristics of fibromyalgia in the general population. Arthritis Rheum. 1995;38(1):19–28. | ||
Haukka E, Ojajärvi A, Takala EP, Viikari-Juntura E, Leino-Arjas P. Physical workload, leisure-time physical activity, obesity and smoking as predictors of multisite musculoskeletal pain. A 2-year prospective study of kitchen workers. Occup Environ Med. 2012;69(7):485–492. | ||
Solidaki E, Chatzi L, Bitsios P, et al. Work-related and psychological determinants of multisite musculoskeletal pain. Scand J Work Environ Health. 2010;36(1):54–61. | ||
Davies KA, Silman AJ, Macfarlane GJ, et al. The association between neighbourhood socio-economic status and the onset of chronic widespread pain: results from the EPIFUND study. Eur J Pain. 2009;13(6):635–640. | ||
Jackson T, Thomas S, Stabile V, Han X, Shotwell M, McQueen KA. Chronic pain without clear etiology in low- and middle-income countries: a narrative review. Anesth Analg. 2016;122(6):2028–2039. | ||
Bromley Milton M, Börsbo B, Rovner G, Lundgren-Nilsson A, Stibrant-Sunnerhagen K, Gerdle B. Is pain intensity really that important to assess in chronic pain patients? A study based on the Swedish Quality Registry for Pain Rehabilitation (SQRP). PLoS One. 2013;8(6):e65483. | ||
Kroenke K, Outcalt S, Krebs E, et al. Association between anxiety, health-related quality of life and functional impairment in primary care patients with chronic pain. Gen Hosp Psychiatry. 2013;35(4):359–365. | ||
Margolis RB, Tait RC, Krause SJ. A rating system for use with patient pain drawings. Pain. 1986;24(1):57–65. |
Supplementary material
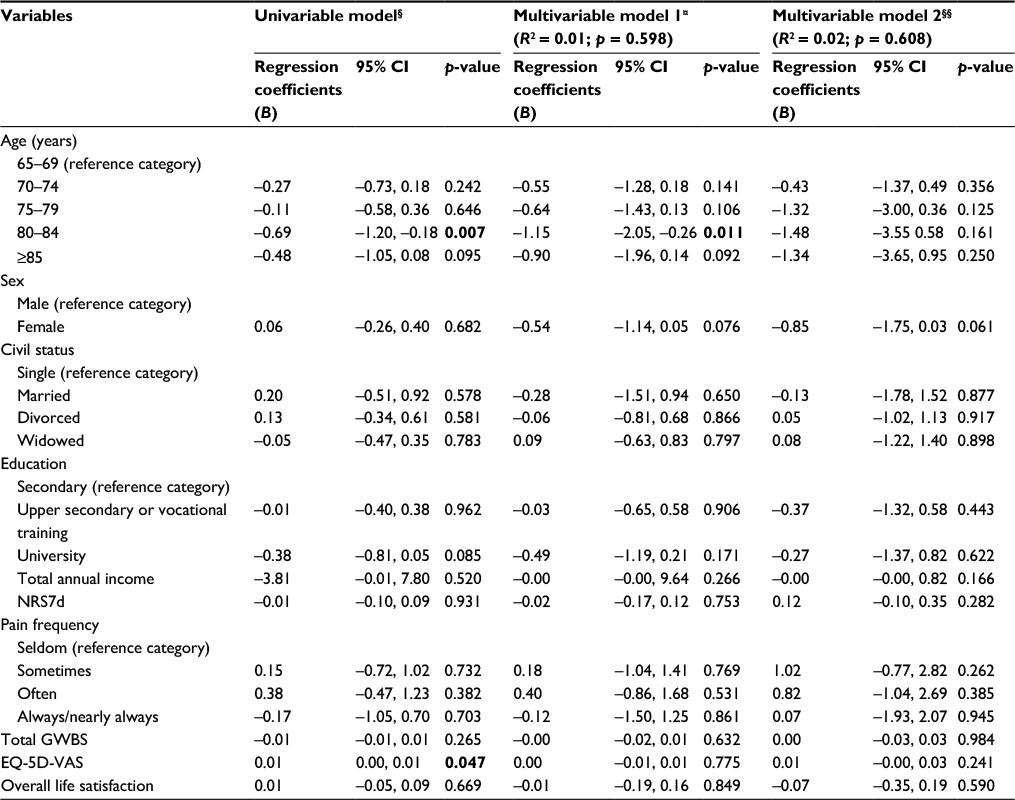 | Table S1 Results of regression analyses: cross-sectional associations of the factors associated with the NPS (0–45) Notes: §Each independent factor one at a time. ¤Unadjusted multivariable analysis of all factors together in one model, simultaneously controlled for. §§Multivariable analysis of the associations of multivariable model 1 adjusted for consumption of analgesics and the total number of comorbidities. Significant p-values are given in bold. Abbreviations: CI, confidence interval; EQ-5D-VAS, the Euro Quality of Life Vertical Visual Analog Scale; NRS7d, Pain intensity for the previous 7 days measured by numeric rating scale; B, unstandardized regression coefficients; R2, multiple correlation coefficient squared; GWBS, General Well-Being Schedule; NPS, number of pain sites. |
 © 2017 The Author(s). This work is published and licensed by Dove Medical Press Limited. The full terms of this license are available at https://www.dovepress.com/terms.php and incorporate the Creative Commons Attribution - Non Commercial (unported, v3.0) License.
By accessing the work you hereby accept the Terms. Non-commercial uses of the work are permitted without any further permission from Dove Medical Press Limited, provided the work is properly attributed. For permission for commercial use of this work, please see paragraphs 4.2 and 5 of our Terms.
© 2017 The Author(s). This work is published and licensed by Dove Medical Press Limited. The full terms of this license are available at https://www.dovepress.com/terms.php and incorporate the Creative Commons Attribution - Non Commercial (unported, v3.0) License.
By accessing the work you hereby accept the Terms. Non-commercial uses of the work are permitted without any further permission from Dove Medical Press Limited, provided the work is properly attributed. For permission for commercial use of this work, please see paragraphs 4.2 and 5 of our Terms.