")
Back to Journals » International Journal of Nanomedicine » Volume 15
A Correlative Imaging Study of in vivo and ex vivo Biodistribution of Solid Lipid Nanoparticles
Authors Mannucci S, Boschi F , Cisterna B , Esposito E , Cortesi R , Nastruzzi C, Cappellozza E, Bernardi P, Sbarbati A, Malatesta M , Calderan L
Received 6 November 2019
Accepted for publication 7 February 2020
Published 13 March 2020 Volume 2020:15 Pages 1745—1758
DOI https://doi.org/10.2147/IJN.S236968
Checked for plagiarism Yes
Review by Single anonymous peer review
Peer reviewer comments 3
Editor who approved publication: Prof. Dr. Anderson Oliveira Lobo
Silvia Mannucci,1 Federico Boschi,2,* Barbara Cisterna,1,* Elisabetta Esposito,3 Rita Cortesi,3 Claudio Nastruzzi,3 Enrica Cappellozza,1 Paolo Bernardi,1 Andrea Sbarbati,1 Manuela Malatesta,1 Laura Calderan1
1Department of Neurosciences, Biomedicine and Movement Sciences, University of Verona, Verona I-37134, Italy; 2Department of Computer Science, University of Verona, Verona I-37134, Italy; 3Department of Chemical and Pharmaceutical Sciences, University of Ferrara, Ferrara I-44121, Italy
*These authors contributed equally to this work
Correspondence: Manuela Malatesta
Department of Neurosciences, Biomedicine and Movement Sciences, University of Verona, Strada Le Grazie 8, Verona I-37134, Italy
Tel +39 045 8027569
Email [email protected]
Purpose: Solid lipid nanoparticles are largely used in biomedical research and are characterized by high stability and biocompatibility and are also able to improve the stability of various loaded molecules. In vitro studies demonstrated that these nanoparticles are low cytotoxic, while in vivo studies proved their efficiency as nanocarriers for molecules characterized by a low bioavailability. However, to our knowledge, no data on the systemic biodistribution and organ accumulation of solid lipid nanoparticles in itself are presently available.
Methods: In this view, we investigated the solid lipid nanoparticles biodistribution by a multimodal imaging approach correlating in vivo and ex vivo analyses. We loaded solid lipid nanoparticles with two different fluorophores (cardiogreen and rhodamine) to observe them with an optical imager in the whole organism and in the excised organs, and with fluorescence microscopy in tissue sections. Light and transmission electron microscopy analyses were also performed to evaluate possible structural modification or damage due to nanoparticle administration.
Results: Solid lipid nanoparticles loaded with the two fluorochromes showed good optic characteristics and stable polydispersity. After in vivo administration, they were clearly detectable in the organism. Four hours after the injection, the fluorescent signal occurred in anatomical districts corresponding to the liver and this was confirmed by the ex vivo acquisitions of excised organs. Brightfield, fluorescence and transmission electron microscopy confirmed solid lipid nanoparticles accumulation in hepatocytes without structural damage.
Conclusion: Our results support the systemic biocompatibility of solid lipid nanoparticles and demonstrate their detailed biodistribution from the whole organism to organs until the cells.
Keywords: lipid-based nanoparticles, systemic biodistribution, optical imaging, light microscopy, transmission electron microscopy, tissue accumulation
Introduction
Biocompatibility is a basic issue in nanotechnology, especially with regard to nanoconstructs intended for medical use. In this view, lipid-based nanoparticles have attracted great attention as versatile tools with a high potential of medical applications due to their natural components.1–3
Solid lipid nanoparticles (SLN) currently represent a great promise for drug delivery, clinical medicine and research since they are characterized by high stability and biocompatibility, and already for a long time the synthesis of these nanoconstructs sparked great interest.4,5 The lipid excipients used for their production have, in fact, well-established safety profiles and are largely employed in FDA approved products.6,7 In addition, due to the physicochemical properties of lipids (ie, low melting temperature), SLN can be easily obtained by direct emulsification of the molten lipids and subsequent recrystallization, avoiding the use of potentially toxic solvents. SLN are also able to improve the stability of various loaded molecules, increasing their bioavailability and assuring restrained release profile.2,8-14 SLN maintain their physical stability for a long time and can be administered by different routes, including the oral or intranasal one.15,16
The effects of SLN on living cells have been tested in many in vitro studies, confirming their low cytotoxicity.17,18 As for SLN administered in vivo, the large majority of studies focused on their efficiency as nanocarriers for molecules that have low bioavailability or poor water solubility, or high chemical and metabolic instability; SLN have been studied also for their capability to overcome biological barriers (eg, by functionalizing their surface with polysorbate 80).19–25
However, to our knowledge, no data on the systemic biodistribution and organ accumulation of SLN in itself are presently available.26 This is a basic information for their systemic use since, although SLN are made of fully biocompatible components, their in vivo fate may depend on a variety of factors related to the administration route and to the interactions with the complex and heterogeneous biological environment of a living organism.6,27
In this view, we investigated the biodistribution of SLN by a multimodal imaging approach correlating in vivo and ex vivo analyses. To this aim, we prepared fluorescent SLN loaded with two different fluorophores, namely cardiogreen (CG) detectable with an optical imager in the whole organism and in the excised organs, and rhodamine (RH) detectable in tissue sections with fluorescence microscopy. The fluorescent SLN were injected intraperitoneally in mice to analyse their biodistribution kinetics in vivo and their accumulation in key organs ex vivo. Histological and ultrastructural analyses were also performed in order to evaluate possible structural damage due to nanoparticle administration. Moreover, SLN uptake and intracellular fate were investigated in cultured cells to support the in vivo and ex vivo evidence.
Materials and Methods
Spectroscopical Analysis
Cardiogreen (indocyanine green, Sigma Aldrich, St Louis, MO, USA) (CG) and rhodamine (5(6)-carboxy-X-rhodamine, Sigma) (RH) were analyzed as ethanol solution or SLN dispersion. The UV–VIS spectra were recorded using a Josio V570® dual-beam spectrophotometer equipped with W/I2 and H2/D2 lamps, in NIR/VIS and UV, respectively. The emission and excitation fluorescence spectra were recorded with an ISA FLUOROMAX® spectrofluorimeter equipped with R1527P photomultiplier and xenon lamp.
Production of Solid Lipid Nanoparticles
SLN, constituted of tristearin (glyceryl tristearate, Fluka, Buchs, Switzerland) (5% w/w, with respect to the whole weight of the dispersion, were prepared by melt and ultra-sonication method, as reported in.28 Briefly, nanoparticles were produced by adding to the molten lipid Phase 4.75 mL of an aqueous poloxamer 188 solution (copolymer poly (ethylene oxide) (a) – poly (propylene oxide, BASF ChemTrade GmbH, Burgbernheim, Germany) (b) (a=80, b=27), 2.5% w/w) heated at 80°C. The mixture was then emulsified at 15,000 rpm, 80°C for 1 min, using a high-speed homogenizer (UltraTurrax T25, IKA-Werke GmbH & Co. KG, Staufen, Germany). Afterwards, the emulsion was subjected to ultra-sonication (Microson TM, Ultrasonic cell Disruptor) at 6.75 kHz for 15 min and then let cooling at room temperature. The obtained SLN dispersions were maintained at room temperature until used. Fluorescent nanoparticles were produced with the same procedure, adding the fluorophore (CG or RH or both, 0.02% w/w with respect to the weight of the lipids) to the molten tristearin (Fluka). SLN preparations were named as follows: SLN-E (empty, control SLN), SLN-RH (SLN-containing RH), SLN-CG (SLN-containing CG), SLN-RH/CG (SLN-containing both RH and CG).
Characterization of Solid Lipid Nanoparticles
In order to identify possible agglomeration or sedimentation phenomena, the SLN dispersions were visually inspected each day up to 30 days, from the preparation. SLN size analysis was performed using a Zetasizer Nano-S90 (Malvern Instr., Malvern, England) equipped with a 4 mW helium-neon laser with a wavelength output of 633 nm. The sample preparation procedure was carried out in a laminar airflow bench, using single-use syringes, needles, and pipette tips. Measurements were made at 25°C, placing the samples in the machine for 5 min prior to the start of measurements to eliminate temperature differences between the sample and the machine, at an angle of 90°. Data were interpreted using the “CONTIN” method.28 SLN morphology was investigated by means of cryogenic transmission electron microscopy (cryo-TEM). Samples were vitrified and transferred to a Zeiss EM922Omega transmission electron microscope for imaging using a cryoholder (CT3500, Gatan).29 Specimens were examined with doses of about 1000–2000 e/nm2 at 200 kV. A CCD camera (Ultrascan 1000, Gatan) was used to record the digital images. The separation of fluorescent nanoparticles from free fluorophores and the determination of fluorescence content of nanoparticles were made as previously reported.30 Briefly, 300 µl of nanoparticle samples were loaded in a centrifugal filter (Microcon unit YM-10 membrane, NMWCO 10 kDa, Sigma) and subjected to centrifugation at 8,000 rpm for 60 min using a Spectrafuge™ 24D Digital Microcentrifuge (Woodbridge NJ, USA). Afterwards, the fluorescence in the eluate was determined by fluorescence spectroscopy, taking as reference a previously made calibration curve allowing the determination of the encapsulation efficiency (EE) and loading capacity (LC). The association of fluorophores to lipid nanoparticle was verified by using thin-layer chromatography (TLC) silica gel 60 F254 (Merck KGaA, Darmstadt, Germany) with an imaging plate (BAS-SR2040, FujiFilm, Tokyo, Japan) and a fluorescence imaging system (photodynamic eye (PDE); Hamamatsu Photonics, Hamamatsu, Japan). TLC was performed eluting 5 μL of the fluorescent sample (either nanoparticle or solution) applied on the silica plate with mixtures of ethanol/water. Afterwards, the fluorescent spots were quantified putting the plates on the imaging plate and scanning them using a phosphor imager FLA-2000 (FujiFilm). Fluorescence levels were visualized from the display.
The zeta potential was measured by electrophoretic mobility of the particles using a ZetaSizer Nano ZS (Malvern Instruments, UK). Samples were diluted approximately 100 fold with ultrapure water resulting in a conductivity of 50 ± 5 μS cm−1.
In vivo and ex vivo Optical Imaging
For the biodistribution study, 18 male athymic nude mice (Harlan Laboratories, Italy), 4–5 weeks old and about 25 g in weight, were used. Athymic nude mice were chosen to allow the detection of faint light signals coming from deepest anatomical districts, thanks to the absence of fur and hair bulbs, which are both high absorbers and sources of light scattering. A limited but statistically significant number of animals were used for ethical reasons. Mice were housed in a temperature- and humidity-controlled environment, having free access to mouse chow and tap water. Light conditions were maintained on 12 h-cycle. Animals were handled according to the regulations of the Italian Ministry of Health (DL March, 4 2014, n. 26, directive implementation 2010/63/UE) and to the European Communities Council (Directive 63/2010/EU of the European Parliament and of the Council) directives. Project code approved by Italian Ministry of Health is Calderan 18,052. Mice were divided into three groups: the first one (n=6) was administered with an intraperitoneal (ip) 500 µL injection of fluorescent SLN labelled with CG (SLN-CG) (50mg/mL in lipid phase), the second one (n=6) was administered with an ip 500 µL injection of fluorescent SLN labelled with both CG and RH (SLN-RH/CG) (50 mg/mL in lipid phase), the third one (n=6, control group) was administered with an ip 500 µL injection of sole SLN dispersing phase composed of aqueous poloxamer 188 solution (2.5% w/w) (Sigma). The amount of the injected SLN was determined by preliminary experiments demonstrating that a lower amount was undetectable by optical imager (not shown). During injection and image acquisition, mice were kept under gas anesthesia (2% of isoflurane and 1 mL/min of oxygen). Mice were imaged 5, 15, 30, 60, 120, 180, and 240 min after SLN ip injection. These time points allowed to monitor the systemic biodistribution and tissue accumulation of SLN after administration. The time of SLN clearance depends on many parameters such as the nanoparticle composition, size and opsonization, and the route of administration. In particular, the adsorption of plasma proteins, which determines the ultimate fate of the SLNs in the organism (ie, phagocytosis, prolonged circulation or tissue targeting), is affected by both the plasma protein concentration and the surface properties of SLN. Anyway, it is likely that the complete elimination of lipid nanoparticles from the organism may take place in a few hours.
Optical images were acquired with IVIS Spectrum (Perkin Elmer, Waltham, MA, USA) in fluorescent modality with excitation filter 710 nm and emission filter 800 nm. Other parameters were exposure time 1 s, binning B=4, f/stop= 2. After nanoparticles injection, the biodistribution was monitored separately with regard to SLN-CG and SLN-CG/RH. Measurements were done tracing a Region of interest (ROI) on the fluorescent images in correspondence of the abdominal region of the animals. The results are reported as fold of increase of the mean radiance normalized to the pre-injection emitted radiance. Since the comparison of biodistribution revealed no difference between SLN-CG and SLN-CG/RH, all the subsequent analyses were performed using the double-labelled SLN. After the last step of acquisition, mice were sacrificed through an anesthetic overdose and then perfused with 4% paraformaldehyde (Sigma) in 0.1 M phosphate buffer saline (PBS), pH 7.4. After perfusion, liver, kidney, lungs (organs involved in the elimination process), spleen (located in the fluorescent abdomen area), brain (SLN hypothetical target organ), and interscapular brown adipose tissue (hypothetical target organ as a lipid accumulating tissue) were excised and imaged with the same parameters as for the in vivo acquisitions. Finally, the organs were processed for light microscopy and TEM analyses.
Light Microscopy ex vivo Analyses
Excised liver (where in vivo and ex vivo optical imaging analysis revealed an evident fluorescent signal) were cut into small fragments and processed for light (brightfield and fluorescence) microscopy. The samples were further fixed by immersion with 4% paraformaldehyde (Sigma) in 0.1 M PBS, pH 7.4, overnight at 4°C, rinsed in PBS, and put into 30% sucrose overnight. Subsequently, the tissues were embedded in OCT (Optimal Cutting Temperature) compound (DDK srl, Milan Italy), immediately frozen in isopentane (Sigma) cooled down in liquid nitrogen, and stored at −80°C until cutting. Seven-µm-thick cryostat sections were stained with 1 µg/mL Hoechst 33,342 (Sigma) in PBS to be observed at fluorescence microscopy. An Olympus BX51 microscope equipped with a 100 W mercury lamp (Olympus Italia Srl, Segrate, MI, Italy) was used under the following conditions: 540 nm excitation filter (excf), 580 nm dichroic mirror (dm), and 620 nm barrier filter (bf), for red fluorescence; 330–385 nm excf, 400 nm dm, and 420 nm bf, for Hoechst 33,342. Brightfield images of the same fields acquired at fluorescence microscopy were also taken. Images were recorded with a QICAM Fast 1394 digital camera (QImaging, Surrey, BC, Canada) and processed using Image-Pro Plus 7.0 software (Media Cybernetics Inc., Rockville, MD USA). Since SLN were found only in the liver, sections of this tissue were stained with 0.5% Oil Red O (Bio Optica, Milan, Italy) to visualized possible lipid accumulation, counterstained with Mayer’s hematoxylin solution (Sigma), and observed at brightfield microscopy (technical details in31).
Transmission Electron Microscopy ex vivo Analyses
In order to verify the high-resolution structural preservation of the hepatic tissue, a TEM analysis was performed. Small fragments (about 1 mm3) of the excised livers were further fixed with 2% paraformaldehyde (Sigma) and 2.5% glutaraldehyde (Electron Microscopy Sciences, Fort Washington, PA, USA) in 0.1 M PBS for 2 h at 4°C, post-fixed in 1% osmium tetroxide in aqueous solution for 2 h at 4°C, dehydrated in graded concentrations of acetone and embedded in an Epon-Araldite mixture (Electron Microscopy Sciences). Semithin 2-µm-thick sections were stained with 1% aqueous solution of toluidine blue (Sigma) and observed at brightfield microscopy to select centrilobular regions, where ultrathin 70-nm-thick sections were cut. The samples were observed in a Philips Morgagni transmission electron microscope (FEI Company, Thermo Fisher Scientific, Hillsboro, OR, USA), operating at 80 kV and equipped with a MegaView II camera (EMSIS GmbH, Muenster, Germany) for digital image acquisition.
In vitro Analysis
In order to monitor the intracellular fate of SLN under controlled conditions, an in vitro model was used. 3T3 cells, a fibroblast established cell line (ECACC, Sigma), were grown in Dulbecco’s modified Eagle’s medium nutrient mixture F12 containing 10% foetal bovine serum and 1% penicillin/streptomycin, at 37°C in a 5% CO2 humidified atmosphere. Cells were trypsinized (0.25% trypsin in PBS containing 0.05% EDTA) when about 70% confluent (all reagents for cell culture were from Celbio, Milan, Italy). For analyses at light microscopy and TEM, cells were seeded on glass coverslips placed in 6-multiwell plates (5×10⁴ cells per well) (Corning Inc., Corning, NY, USA). After 24 h, the medium was replaced with fresh medium containing 0.5 mg/mL of SLN (this concentration was chosen based on the biocompatibility data).32 The cells were incubated for 1 h, 4 h, and 24 h in order to verify the occurrence of a time-dependent effect. At each time point, for light microscopy the cells were fixed with 4% buffered paraformaldehyde (Sigma), and stained with Oil Red O (Bio Optica) and Mayer’s hematoxylin solution (Sigma), as described for tissue samples. For TEM, the cells were fixed, embedded and stained as described for liver samples.
Statistical Analysis
Statistical analysis was performed by the analysis of variance (ANOVA) considering P-values <0.05 as the level of significance.
Results
Spectroscopic Study
This investigation presents the systemic biodistribution and organ accumulation of SLN studied in vivo and ex vivo by fluorescent modality with two instruments, namely: an in vivo imaging system operating at 740 nm excitation and 800 nm emission wavelength and an in vitro system with 560 nm excitation and 590 emission filters (see details in the experimental section).
In this respect, it has become necessary an appropriate selection of fluorophores: the dyes should indeed possess specific properties, including a low molecular weight and lipophilic character (to be efficiently encapsulated in SLN), and spectral profiles compatible with the detection systems above reported. Specifically, the following fluorophores have been selected: RH (λexc = 540 nm and λabs = 565 nm) and CG (λexc= 690 nm and λabs = 787 nm). To test the chosen molecules, a preliminary study has been performed in order to verify interference phenomena after concomitantly loading both fluorophores into SLN. It is indeed known that when two or more fluorophores are co-solubilized (or co-embedded in the same particle), they may interfere each other by energy transfer that could lead to a shutdown of the one with the lower adsorption wavelength (ie, RH in our case). Therefore, the spectra of RH and CG as ethanol solutions either as single molecular species or in mixture solutions were recorded. Figure 1 (panels A and B) reports the absorption spectra of RH and CG, showing for RH a λmax(abs) = 787 nm and ε = 192,000 and for CG a λmax(abs) = 565 nm and ε = 100,000. In addition, the panel C of Figure 1 reports the emission spectra of both dyes, firstly measured as single molecules in solution: RH, λex= 540 nm (red line); CG, λex= 690 nm (black line) and later as 1:1 (w/w) mixture: RH+CG, λex= 540 nm (blue line); RH+CG, λex= 690 nm (green line). The reported data demonstrated that after excitation at the typical wavelengths of both molecules, the fluorophores maintain their spectral absorption/emission properties, notably RH is not shut down by the presence of CG thus no energy transfer between the fluorophores was observed. These preliminary results were followed by the design and preparation of SLN containing a single fluorophore (RH or CG) as well as SLN simultaneously containing both dyes, as described in the following paragraph.
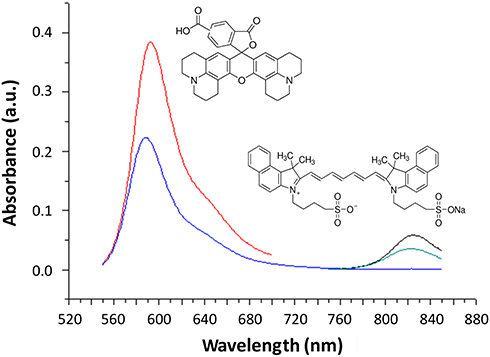 |
Figure 1 Absorption spectra of the fluorophore RH and CG ethanol solution. Emission spectra in ethanol solution of RH (red line, λex= 540 nm) and CG (black line, λex= 690 nm) and as 1:1 (w/w) mixture RH+CG measured at λex= 540 nm (blue line) and λex= 690 nm (green line). |
Preparation and Characterization of Fluorescent SLN
SLN were prepared by a two-step protocol based on the emulsification under high-speed stirring (15,000 rpm) of an aqueous solution of poloxamer 188 in the molten lipids, followed by probe ultrasonication. After preparation, all SLN dispersions display a homogeneous aspect free from agglomerates or sediment. SLN-RH and SLN-CG dispersions, due to the presence of the dyes, resulted slightly colored (ie, red or green depending on the encapsulated fluorophore). In the case of SLN-RH/CG, the color of the dispersion resulted from the sum of CG and RH colors. The emission spectra registered for SLN-RH and SLN-CG (reported in Figure 2A and B), confirm the behavior above described (ie, for the fluorophores in ethanol solution), interestingly the emission spectra of both RH and CG in SLN display the maximum at slightly higher value (both are shifted by 20–50 nm, toward the red region), in reason of the different environment in which the fluorophores are located, namely SLN dispersion and ethanol solution.
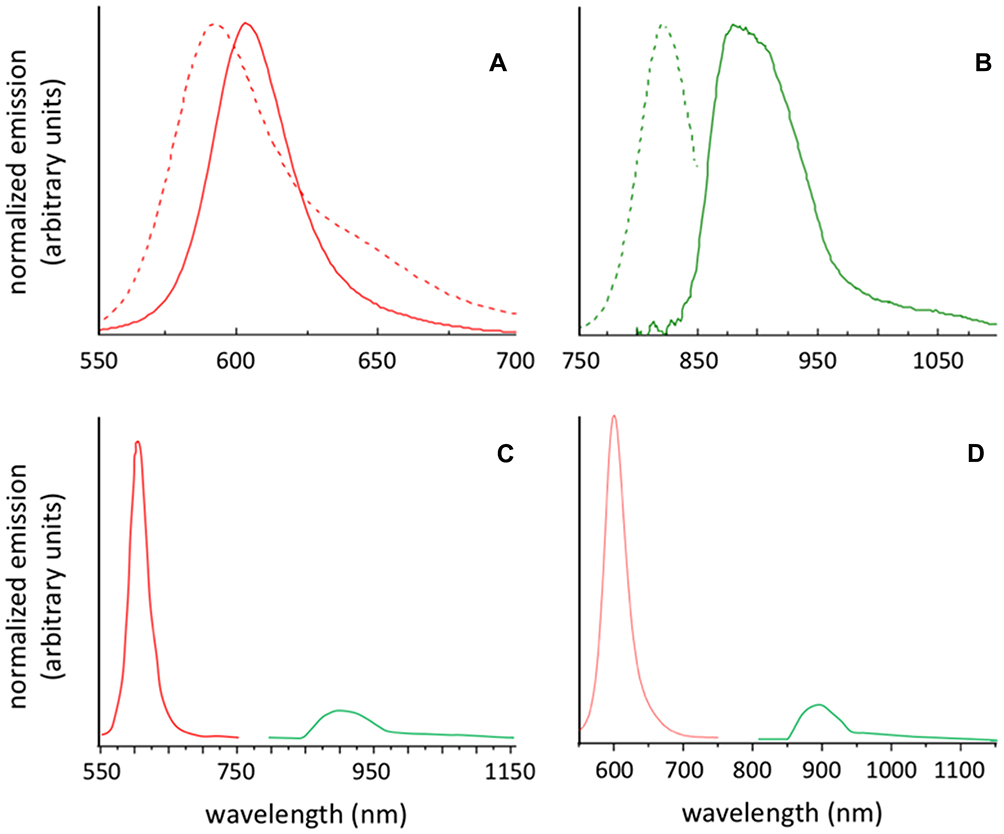 |
Figure 2 Emission spectra of SLN-RH (A), SLN-CG (B), mixture of SLN-RH and SLN-CG (C) and co-loaded SLN-RH/CG (D). Emission spectra are obtained at different excitation wavelength λex= 540 nm (dotted line) and λex= 690 nm (full line). RH spectra: red line; CG spectra: green line. |
Spectra reported in panels C and D of Figure 2, clearly indicate that there are no energy transfer/interference phenomena both in the case of SLN-RH and SLN-CG mixtures (panel C) nor for RH and CG co-embedded in SLN (panel D).
From a macroscopic point of view, the obtained fluorescent SLN have homogeneous and opaque appearance, even if differently colored, depending on the type of fluorophore loaded as clearly appreciable in Figure 3, showing SLN-CG (panel A), SLN-RH (panel B) and SLN-CG/RH (panel C).
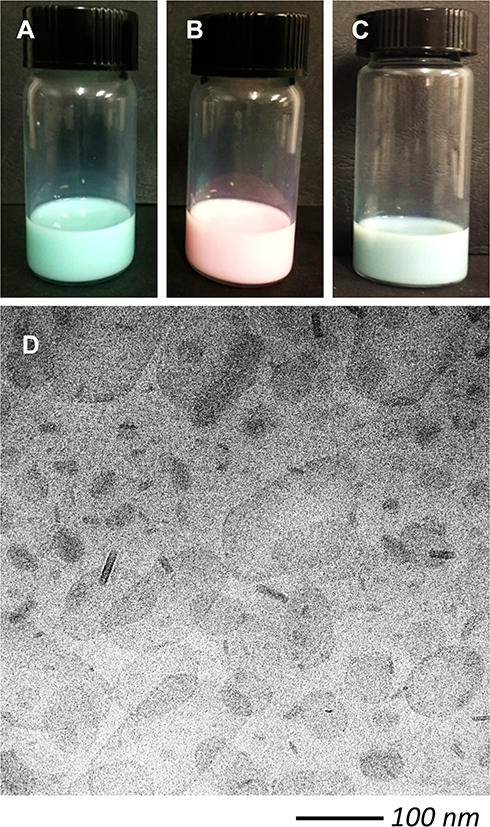 |
Figure 3 Macroscopic appearance of SLN-CG (A), SLN-RH (B), SLN-CG/RH (C) and cryo-TEM photomicrograph of SLN-CG/RH (D). |
Fluorescent SLN were morphologically examined by cryo-TEM. In Figure 3D SLN-CG/RH are shown as an example, since all SLN displayed a very similar morphology (data not shown).29 Nanoparticles show flat ovoid shapes, appearing as “wafer biscuits” when edge-on viewed. This aspect confirms previously results obtained for similar SLN loaded with single fluorophores.29 Notably, there is no evidence of agglomerates.
Table 1 reports the mean diameters, as Z-average, and polydispersity values of fluorescent SLN-CG/RH. A modest increase in the mean diameter has been found throughout 2 months. In addition, the polydispersity values remain steady, indicating a stable and homogeneous SLN population. Concerning zeta potential, SLN CG/RH display a negative value around −21 mV, almost unchanged within 2 months. Notably, the negative charge of nanoparticles could contribute to maintain the stability of SLN suspension.
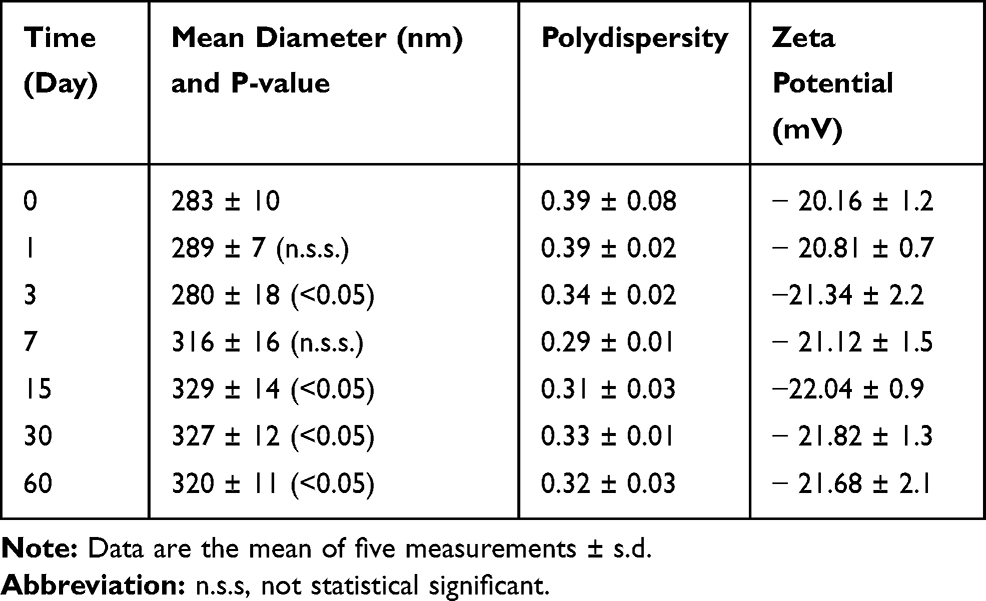 |
Table 1 Dimensional Size, Polydispersity and Zeta Potential of Fluorescent SLN-CG/RH |
In vivo and ex vivo Optical Imaging
Optical imaging acquisitions performed after ip administration of fluorescent SLN revealed their biodistribution in both the whole organism and single organs of athymic nude mice. By the ip route, SLN diffuse across the peritoneal membrane, which is lined with a capillary bed. The blood vessels supplying and draining the abdominal viscera, musculature and mesentery constitute a blood-filled compartment into which SLN can rapidly diffuse from the peritoneum. Figure 4A and B shows that, in the first 30 min after injection, the fluorescence emission of both SLN-CG and SLN-C/-RH rises rapidly with a similar kinetic curve profile from the whole animal body. After approximately 90 min, the fluorescence signal was detectable in more defined abdominal areas. After 120 to 180 min, we could observe both SLN-CG and SLN-CG/RH accumulation only in specific abdominal districts corresponding to the liver anatomical site (Figure 4C and D). After 180 to 240 min, the fluorescent emission reached a plateau (Figure 4A and B). The ex vivo acquisition of isolated organs confirmed the liver as the fluorescence accumulation site (Figure 4E and F). The other organs extracted did not show significant signal (Figure S1). It is worth noting that isolated organs were imaged after perfusion, which allowed us to remove fluorophore traces from the vasculature.
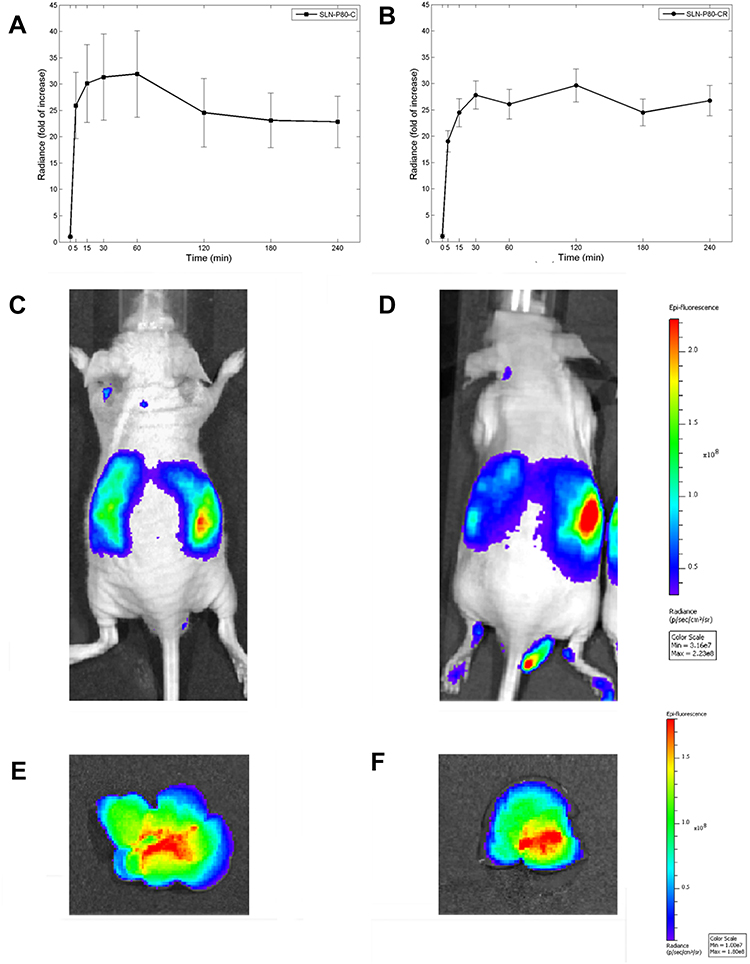 |
Figure 4 Plot of the kinetic uptake in the abdominal region (A, B) up to 4 h after injection; SLN biodistribution in living animals 3 h after ip injection (C, D), and fluorescent emission in excised and perfused liver (E, F). (A, C and E) refer to SLN-CG; (B, D and F) refer to SLN-CG/RH. |
The biodistribution of SLN-CG and SLN-CG/RH (Figure 4) was similar, thus demonstrating that the interactions with the biological environment did not induce alterations despite the similar spectroscopic features. Therefore, the microscopical analyses in the liver were performed using SLN-CG/RH only.
Light Microscopy ex vivo Analyses
Observations at fluorescence microscopy revealed an accumulation of RH signal in the cytoplasm of hepatocytes, especially in the centrilobular area (Figure 5E–H) in comparison with control samples (Figure 5A–D). No RH signal was observed in other cell types. Accordingly, a marked increase in hepatocytes lipid content was found in Oil Red O stained samples of treated mice, especially in hepatocytes located close to the centrilobular vein (Figure 6B) in comparison with control samples (Figure 6A).
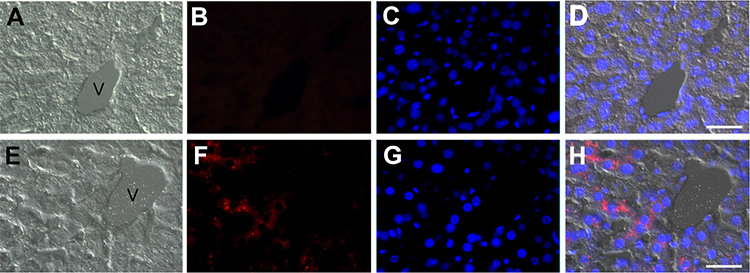 |
Figure 5 Light microscopy images of liver sections from control (A–D) and SLN-CG/RH-treated (E–H) mice. (A, E) brightfield images; (B, F) red signal from RH contained in SLN; (C, G) blue signal from DNA stained with Hoechst; (D, H) merge of brightfield image, red and blue fluorescence. Note the red fluorescence signal inside the hepatocytes of the treated mouse. V: centrilobular vein. Bars 50 µm. |
 |
Figure 6 Light microscopy images of liver sections from control (A) and SLN-treated (B) mice; note the large amounts of lipid droplets in B (Oil Red O staining). V: centrilobular vein. Bars, 100 µm. |
Transmission Electron Microscopy ex vivo Analyses
When liver samples were observed at TEM, an evident accumulation of lipid droplets, sometimes showing a finely granular electron-dense border, was found in hepatocytes of SLN-treated mice in comparison to controls (Figure 7A and B), where the intracellular lipid content was quite low. In SLN-treated mice, some lipid droplets were even found to be extruded from hepatocytes (Figure 7C). No lipid droplet accumulation was ever observed in other liver cells (eg, macrophages, endothelial cells).
 |
Figure 7 TEM images of liver from control (A) and SLN-treated (B–D) mice. Note the high number of lipid droplets (L) in the hepatocytes of SLN-treated mouse. Some lipid droplets showing a finely granular electron-dense border are extruded from the cell (arrow in (B); high magnification in (C). In addition, the hepatocyte in (B) shows a loosened appearance, with euchromatic nucleus (N), dispersed glycogen clusters (asterisks) and rough endoplasmic reticulum cisternae (ER) arranged in a less orderly pattern (D) in comparison to control (A). Bars 2500 nm (A, B); 1000 nm (C, D). |
In addition, hepatocytes from SLN-treated animals showed a general loosened appearance: the nuclei were almost devoid of heterochromatin clumps, the cisternae of the rough endoplasmic reticulum lost their typical parallel arrangement, and the glycogen clusters were rarefied; however, no marked organelle damage was observed (Figure 7B and D). No sign of cell death (eg, necrosis, apoptosis) was found. No clearly recognizable SLN were ever observed in any cell types of the examined liver samples.
In vitro Study
As shown by brightfield microscopy observation of samples stained with Oil Red O (Figure 8A–F), 3T3 cells treated with SLN progressively accumulated lipid droplets up to 24 h (Figure 8A–C), whereas no lipid increase was found in control cells (Figure 8D–F). TEM observations confirmed in SLN-treated cells the occurrence of large amounts of lipid droplets, which frequently showed moderate electron-dense and finely granular borders (Figure 8G). SLN were hardly detectable and only a very limited number were found after 1 h incubation. They showed an evident electron density and occurred free in the cytosol (Figure 8H); some of them were found in close proximity of lipid droplets (Figure 8G–H). After 4 h incubation, some lipid droplets were found to be extruded from the cells (Figure 8I).
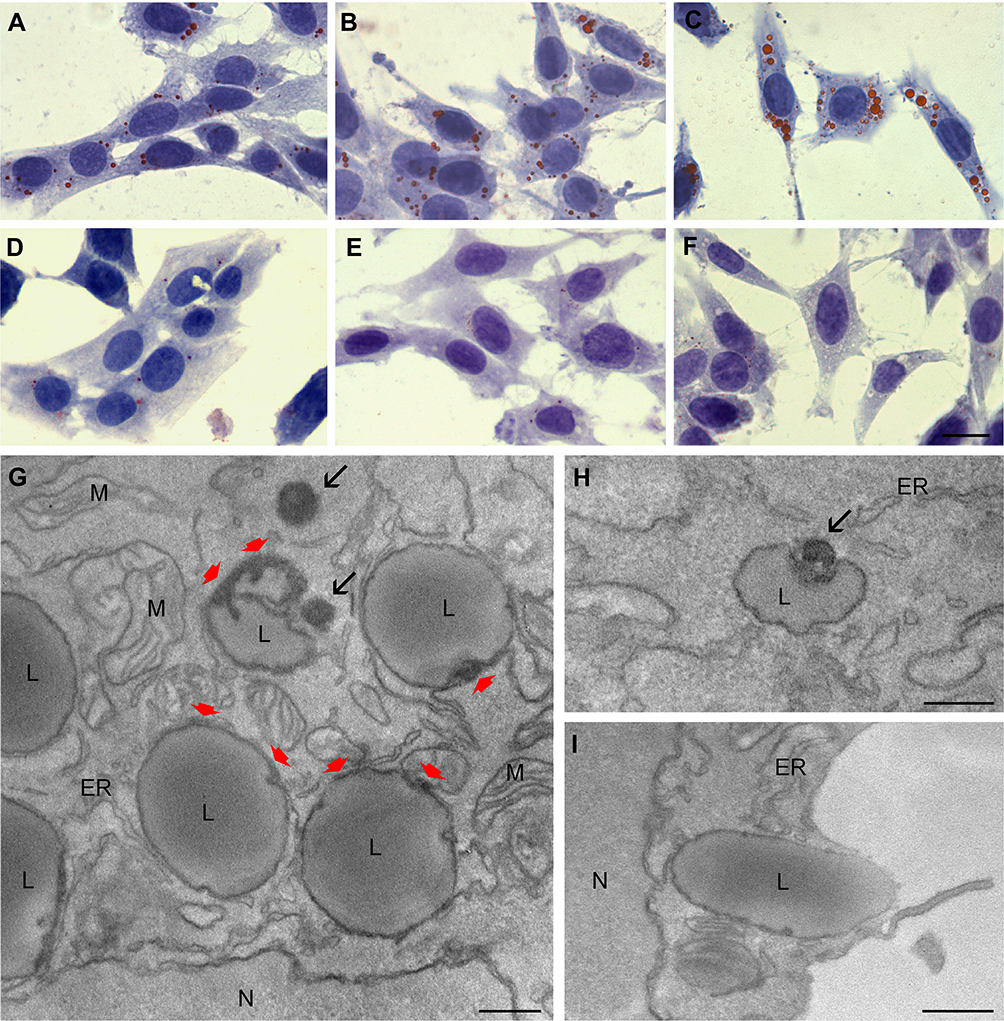 |
Figure 8 Light (A–F) and transmission electron (G–I) micrographs of 3T3 cells. 3T3 cells after 1 h (A), 4 h (B) and 24 h (C) treatment with SLN: lipid droplets (stained with Oil Red (O) progressively increase in number and size. 3T3 control cells after 1 h (D), 4 h (E) and 24 h (F) in medium without nanoparticles: only a few small lipid droplets are visible. 3T3 cells after 1 h treatment with SLN (G, H): many lipid droplets (L) are distributed in the cytoplasm, sometimes showing a finely granular border (red arrows). Three SLN (arrows) occur free in the cytoplasm, two of them very close to lipid droplets. After 4 h (I) treatment with SLN, some lipid droplets (L) were extruded from the cells. Note that cytoplasmic organelles such as mitochondria (M) and endoplasmic reticulum (ER), and cell nuclei (N) are well preserved after SLN treatment. Bars 50 µm (A–F); 500 nm (G–I). |
Discussion
SLN have attracted great attention in recent years as efficient and potentially well-tolerated drug carriers.33–35 However, at present only poor information is available on their systemic administration. In fact, to our knowledge, the available literature on SLN administration in vivo is based on nanoparticles loaded with active molecules and/or modified to target specific organs/tissues. In addition, no data on the SLN biodistribution in the whole organism are available but only studies on the short-term accumulation in the target organs have been performed (eg,36–40). In this view, our study represents a novel contribution to the evaluation of biocompatibility of blank SLN by i) providing information on their in vivo biodistribution after systemic (ip) administration in healthy mice up to 4 h (a time sufficient for the complete elimination of lipid nanoparticles from the organism); ii) evaluating ex vivo the accumulation of SLN in multiple organs; iii) analyzing the effects on histological and cytological features of organs that proved to accumulate nanoparticles. In addition, information on the intracellular fate of SLN supporting in vivo and ex vivo data has been provided by using an in vitro model.
These results correlating organismic and histologic data have been obtained thanks to the original dual labelling of SLN with CG and RH, two fluorophores detectable by optical imager and fluorescence microscopy, respectively. It should be underlined that both fluorophores were stably bound to SLN, indicating a firm association between fluorophore and nanoparticles, as found by ultracentrifugation experiments followed by thin layer chromatography.32
Fluorescence molecular tomography allows the evaluation of the in vivo and ex vivo biodistribution of fluorescently labelled nanoparticles by enabling non-invasive detection and quantification of fluorescence distributed throughout the whole body of living small animals as well as in isolated organs.41,42 The in vivo biodistribution of SLN was monitored up to 4 h after systemic administration and, at the last acquisition time, the fluorophore signal was almost exclusively located in the superior abdomen anatomical area, corresponding to liver and spleen. The fluorescence acquired from the isolated organs proved to come mostly from the liver. This was confirmed by the fluorescence microscopy analysis of liver tissue slices, where the fluorophore signal was observed inside hepatocytes, especially those located in the centrilobular area. After ip administration, the bloodstream transports the SLN in all anatomical districts where they can be either retained or removed by the venous and lymphatic circle, depending on the histological and functional characteristics of the tissues. The ip administration was selected because the peritoneal wall is rich in vessels, so the administered drugs can reach all tissues and organs following the systemic blood circulation in a few minutes. Specifically, by the ip route, a drug gets into the systemic circulation mostly through hepatic portal system. Moreover, due to lipid nature of SLN and the high dosage volume needed for our experimental conditions, ip administration ensures a systemic distribution while avoiding blood vessel obstruction (especially in the small tail vein of mice).
The hepatic accumulation observed for SLN is consistent with previous results obtained with Magnetic Resonance Imaging on the biodistribution of paramagnetic SLN.43 Liver is known to play a key role in the removal and detoxification of various metabolites from the bloodstream as well as in the processing of lipids. Accordingly, the histological analysis of liver by Oil Red O staining revealed that hepatocytes from SLN-treated mice contained large amounts of lipid droplets, especially close to the centrilobular vein. It may be therefore hypothesized that hepatocytes massively capture these lipid-based nanoparticles from the bloodstream, with a consequent accumulation of lipid droplets similar to what physiologically happens after an increased intake of fat.44–46 Consistently, no SLN signal was detected by optical imaging in organs not involved in lipid absorption via mesenteric vessels, such as the spleen and lymph nodes. TEM confirmed the occurrence of large amounts of lipid droplets in hepatocytes from treated mice; moreover, evidence of lipid extrusion was observed. Both histologic and ultrastructural evidence therefore supports the hypothesis that, under our experimental conditions, hepatocytes undergo a lipid overloading due to the nanoparticle administration. However, no sign of organelle damage or cell death (eg, necrosis, apoptosis) was found, despite we had to administer a relatively high concentration of SLN to allow their detection at the optical imager. As for the accumulation of the fluorophore signal close to the centrilobular vein, it is known that hepatocytes located in the centrilobular area are especially involved in detoxification, and accumulate toxic exogenous substances to be metabolized and eliminated through the biliary route.47–49 It is therefore likely that SLN coming from the bloodstream were internalized especially by the centrilobular hepatocytes.
Our in vitro cell model allowed us to elucidate the intracellular fate of SLN and provide an experimental explanation for the intracellular accumulation of lipid droplets. Since 3T3 cell line is able to differentiate into adipocyte-like cells, it is an appropriate in vitro model to investigate intracellular lipid accumulation. It was evident that 3T3 cells progressively accumulated - and also extruded - lipid droplets, while morphologically recognizable SLN were detected in the cytosol only in a very limited amount at the shortest incubation time. It may be hypothesized that, as observed for other lipid-based nanoparticles,50 SLN enter the cells by fusion with the plasma membrane,51,52 thus explaining the absence of endosomes, and then disaggregate in the cytoplasm. Their lipid components are probably responsible for the accumulation of lipid droplets, which are extruded by the cells when exceedingly abundant. Interestingly, lipid droplets showing the same fine granular electron-dense border as observed in 3T3 cells were found inside hepatocytes of treated mice, sometimes during their extrusion in the extracellular milieu, thus suggesting a similar intracellular fate. It is likely that both 3T3 cells and hepatocytes may undergo severe stress and even death when submitted to SLN/lipid concentrations overcoming their physiological capacity of accumulating lipid droplets. However, the SLN concentrations administered under our experimental conditions proved to be safe for both cell types.
Conclusion
Taken together, our results support the systemic biocompatibility and demonstrate the detailed biodistribution from the whole organism to organs until the cell of SLN under the experimental conditions applied in the present study. After 4 h from ip administration of 500 μL (50 mg/mL) of SLN the only organ accumulating the nanoparticles was the liver, probably due to its physiological role in lipid metabolism. This induces a lipid accumulation likely due to the intracellular disaggregation of nanoparticles that, however, does not imply evident cell damage. Since systemic administration of SLN proved to be nontoxic in the short term, long-term studies are in progress in order to evaluate the persistence of lipid accumulation in hepatocytes as well as possible damage to the liver or other organs involved in excretion (eg, kidney).
Abbreviations
CG, cardiogreen (indocyanine green); ip, intraperitoneal; PBS, phosphate buffer saline; RH, rhodamine (5(6)-carboxy-X-rhodamine); ROI, region of interest; SLN, solid lipid nanoparticles; SLN-CG, SLN-containing CG; SLN-E, empty, control SLN; SLN-RH, SLN-containing RH; SLN-RH/CG, SLN-containing both RH and CG; TEM, transmission electron microscopy.
Data Sharing Statement
All data generated or analyzed during this study are included in this published article and information about experimental sessions and results are available from the corresponding author on reasonable request.
Ethics Approval and Informed Consent
The animals were handled and used according to the regulations of the Italian Ministry of Health (DL March, 4 2014, n. 26, directive implementation 2010/63/UE) and of the European Communities Council (Directive 63/2010/EU of the European Parliament and of the Council) directives. The project code approved by Italian Ministry of Health is Calderan 18,052. For ethical reasons, this study involved a limited but statistically significant number of laboratory animals.
Acknowledgments
Authors thank Prof. Maria Teresa Indelli for performing spectroscopic analyses. Optical imaging was performed at the Centro Piattaforme Tecnologiche, University of Verona.
Author Contributions
All authors made substantial contributions to conception and design, acquisition of data, or analysis and interpretation of data; took part in drafting the article or revising it critically for important intellectual content; gave final approval of the version to be published; and agree to be accountable for all aspects of the work.
Funding
This work was supported by FUR-2018 from University of Verona, and by FAR-2018 and FIR-2018 from University of Ferrara.
Disclosure
The authors declare that they have no competing interests.
References
1. Wissing SA, Kayser O, Muller RH. Solid lipid nanoparticles for parenteral drug delivery. Adv Drug Delivery Rev. 2004;56:1257–1272. doi:10.1016/j.addr.2003.12.002
2. Battaglia L, Gallarate M. Lipid nanoparticles: state of the art, new preparation methods and challenges in drug delivery. Expert Opin Drug Deliv. 2012;9:497–508. doi:10.1517/17425247.2012.673278
3. Nyström AM, Fadeel B. Safety assessment of nanomaterials: implications for nanomedicine. J Controlled Rel. 2012;16:403–408. doi:10.1016/j.jconrel.2012.01.027
4. Masserini M. Nanoparticles for brain delivery. ISRN Biochem. 2013;18:238428.
5. Muller RH, Gohla S, Mader K. Solid lipid nanoparticles (SLN) for controlled drug delivery-a review of the state of the art. Eur J Pharm Biopharm. 2000;50:161–177.
6. Mehnert W, Mader K. Solid lipid nanoparticles, production, characterization and applications. Adv Drug Delivery Rev. 2001;47:165–196.
7. Saupe A, Wissing SA, Lenk A, et al. Solid lipid nanoparticles (SLN) and nanostructured lipid carriers (NLC) – structural investigations on two different carrier systems. Bio-Med Mater Eng. 2005;15:393–402.
8. Uner M, Yener G. Importance of solid lipid nanoparticles (SLN) in various administration routes and future perspectives. Int J Nanomedicine. 2007;2:289–300.
9. Joshi MD, Müller RH. Lipid nanoparticles for parenteral delivery of actives. Eur J Pharm Biopharm. 2009;71:161–172.
10. Pérez de la Ossa DH, Ligresti A, Gil-alegre ME, et al.. Poly-ε-caprolactone microspheres as a drug delivery system for cannabinoid administration: development, characterization and in vitro evaluation of their antitumoral efficacy. J Control Release. 2012;161(927–932).
11. Shidhaye SS, Vaidya R, Sutar S, et al. Solid lipid nanoparticles and nanostructured lipid carriers–innovative generations of solid lipid carriers. Curr Drug Deliv. 2008;5:324–331. doi:10.2174/156720108785915087
12. Yoon G, Park JW, Yoon IS. Solid lipid nanoparticles (SLNs) and nanostructured lipid carriers (NLCs): recent advances in drug delivery. J Pharm Invest. 2013;43:353–362. doi:10.1007/s40005-013-0087-y
13. Joshi M, Patravale V. Nanostructured lipid carrier (NLC) based gel of celecoxib. Int J Pharm. 2008;346:124–132. doi:10.1016/j.ijpharm.2007.05.060
14. Lim SB, Banerjee A, Önyüksel H. Improvement of drug safety by the use of lipid-based nanocarriers. J Control Release. 2012;163:34–45. doi:10.1016/j.jconrel.2012.06.002
15. Puri A, Loomis K, Smith B, et al. Lipid-based nanoparticles as pharmaceutical drug carriers: from concepts to clinic. Crit Rev Ther Drug Carrier Syst. 2009;26:523–580. doi:10.1615/CritRevTherDrugCarrierSyst.v26.i6.10
16. Esposito E, Cortesi R, Drechsler M, et al. Nanoformulations for dimethyl fumarate: physicochemical characterization and in vitro/in vivo behavior. Eur J Pharm Biopharm. 2017;115:285–296. doi:10.1016/j.ejpb.2017.04.011
17. Doktorovova S, Souto EB, Silva AM. Nanotoxicology applied to solid lipid nanoparticles and nanostructured lipid carriers – a systematic review of in vitro data. Eur J Pharm Biopharm. 2014;87:1–18. doi:10.1016/j.ejpb.2014.02.005
18. Lewinski N, Colvin V, Drezek R. Cytotoxicity of nanoparticles. Small. 2008;4(1):26–49. doi:10.1002/(ISSN)1613-6829
19. Li Q, Cai T, Huang Y, et al. A review of the structure, preparation, and application of NLCs, PNPs, and PLNs. Nanomaterials. 2017;7:122. doi:10.3390/nano7060122
20. Geszke-moritz M, Moritz M. Solid lipid nanoparticles as attractive drug vehicles: composition, properties and therapeutic strategies. Mater Sci Eng C Mater Biol Appl. 2016;68:982–994. doi:10.1016/j.msec.2016.05.119
21. Poovaiah N, Davoudi Z, Peng H, et al. Treatment of neurodegenerative disorders through the blood-brain barrier using nanocarriers. Nanoscale. 2018;10(36):16962–16983. doi:10.1039/C8NR04073G
22. Costa C, Moreira JN, Amaral MH, et al. Nose-to-brain delivery of lipid-based nanosystems for epileptic seizures and anxiety crisis. J Control Release. 2019;295:187–200. doi:10.1016/j.jconrel.2018.12.049
23. Cacciatore I, Ciulla M, Fornasari E, et al. Solid lipid nanoparticles as a drug delivery system for the treatment of neurodegenerative diseases. Expert Opin Drug Deliv. 2016;13(8):1121–1131. doi:10.1080/17425247.2016.1178237
24. Gastaldi L, Battaglia L, Peira E, et al. Solid lipid nanoparticles as vehicles of drugs to the brain: current state of the art. Eur J Pharm Biopharm. 2014;87:433–444. doi:10.1016/j.ejpb.2014.05.004
25. Sun W, Xie C, Wang H, et al. Specific role of polysorbate 80 coating on the targeting of nanoparticles to the brain. Biomaterials. 2004;25:3065–3071. doi:10.1016/j.biomaterials.2003.09.087
26. Doktorovová S, Kovacˇevic´ AB, Garcia ML, et al. Preclinical safety of solid lipid nanoparticles and nanostructured lipid carriers: current evidence from in vitro and in vivo evaluation. Eur J Pharm Biopharm. 2016;108:235–252. doi:10.1016/j.ejpb.2016.08.001
27. Del Pozo-Rodríguez A, Solinís MA, Rodríguez-gascón A. Applications of lipid nanoparticles in gene therapy. Eur J Pharm Biopharm. 2016;109:184–193. doi:10.1016/j.ejpb.2016.10.016
28. Esposito E, Fantin M, Marti M, et al. Solid lipid nanoparticles as delivery systems for bromocriptine. Pharm Res. 2008;25:1521–1530. doi:10.1007/s11095-007-9514-y
29. Pecora R. Dynamic light scattering measurement of nanometer particles in liquids. J Nanoparticle Res. 2000;2:123–131. doi:10.1023/A:1010067107182
30. Esposito E, De Vries HE, Van Der Pol SMA, et al. Production, physico-chemical characterization and biodistribution studies of lipid nanoparticles. J Nanomed Nanotechnol. 2015;6:1. doi:10.4172/2157-7439.1000256
31. Marinozzi MR, Pandolfi L, Malatesta M, et al. Innovative approach to safely induce controlled lipolysis by superparamagnetic iron oxide nanoparticles-mediated hyperthermic treatment. Int J Biochem Cell Biol. 2017;93:62–73. doi:10.1016/j.biocel.2017.10.013
32. Ramalingam P, Tag KY. Improved oral delivery of resveratrol from N-trimethyl chitosan-g-palmitic acid surface-modified solid lipid nanoparticles. Colloids Surf B Biointerfaces. 2016;139:52–61. doi:10.1016/j.colsurfb.2015.11.050
33. Khosa A, Reddi S, Saha RN. Nanostructured lipid carriers for site-specific drug delivery. Biomed Pharmacother. 2018;103:598–613. doi:10.1016/j.biopha.2018.04.055
34. Tapeinos C, Battaglini M, Ciofani G. Advances in the design of solid lipid nanoparticles and nanostructured lipid carriers for targeting brain diseases. J Control Release. 2017;28(264):306–332. doi:10.1016/j.jconrel.2017.08.033
35. Cunha S, Amaral MH, Lobo JMS, et al. Lipid nanoparticles for nasal/intranasal drug delivery. Crit Rev Ther Drug Carrier Syst. 2017;34(3):257282. doi:10.1615/CritRevTherDrugCarrierSyst.2017018693
36. Jose S, Anju SS, Cinu TA, et al. In vivo pharmacokinetics and biodistribution of resveratrol-loaded solid lipid nanoparticles for brain delivery. Int J Pharm. 2014;474(1–2):6–13. doi:10.1016/j.ijpharm.2014.08.003
37. Graverini G, Piazzini V, Landucci E, et al. Solid lipid nanoparticles for delivery of andrographolide across the blood-brain barrier: in vitro and in vivo evaluation. Colloids Surf B Biointerfaces. 2018;161:302–313. doi:10.1016/j.colsurfb.2017.10.062
38. Shazly GA, Alshehri S, Ibrahim MA, et al. Development of domperidone solid lipid nanoparticles: in vitro and in vivo characterization. AAPS PharmSciTech. 2018;19(4):1712–1719. doi:10.1208/s12249-018-0987-2
39. Arantes VT, Faraco AAG, Ferreira FB, et al. Retinoic acid-loaded solid lipid nanoparticles surrounded by chitosan film support diabetic wound healing in in vivo study. Colloids Surf B Biointerfaces. 2019;188:110749. doi:10.1016/j.colsurfb.2019.110749
40. El-gizawy SA, El-maghraby GM, Hedaya AA. Formulation of acyclovir-loaded solid lipid nanoparticles: 2. Brain targeting and pharmacokinetic study. Pharm Dev Technol. 2019;24(10):1299–1307. doi:10.1080/10837450.2019.1667386
41. Boschi F, Spinelli AE, D’ambrosio D, et al. Combined optical and single photon emission imaging: preliminary results. Phys Med Biol. 2009;54:L57–L62. doi:10.1088/0031-9155/54/23/L01
42. Zelmer A, Ward TH. Noninvasive fluorescence imaging of small animals. J Microsc. 2013;252:8–15.
43. Ghiani S, Capozza M, Cabella C, et al. In vivo tumor targeting and biodistribution evaluation of paramagnetic solid lipid nanoparticles for magnetic resonance imaging. Nanomedicine. 2017;13(2):693–700.
44. Engin A. Non-alcoholic fatty liver disease. Adv Exp Med Biol. 2017;960:443–467.
45. Brar G, Tsukamoto H. Alcoholic and non-alcoholic steatohepatitis: global perspective and emerging science. J Gastroenterol. 2019;54(3):218–225.
46. Hojland Ipsen D, Lykkesfeldt J, Tveden‑nyborg P. Molecular mechanisms of hepatic lipid accumulation in non‑alcoholic fatty liver disease. Cell Mol Life Sci. 2018;75(18):3313–3327.
47. Soto-gutierrez A, Gough A, Vernetti LA, et al. Preclinical and clinical investigations of metabolic zonation in liver diseases: the potential of microphysiology systems. Exp Biol Med (Maywood). 2017;242(16):1605–1616.
48. Saxena R, Theise ND, Crawford JM. Microanatomy of human liver-exploring the hidden interfaces. Hepatology. 1999;30(6):1339–1346.
49. Krishna M. Microscopic anatomy of the liver. Clin Liver Dis (Hoboken). 2013;2(Suppl 1):S4–S7.
50. Costanzo M, Carton F, Marengo A, et al. Fluorescence and electron microscopy to visualize the intracellular fate of nanoparticles for drug delivery. Eur J Histochem. 2016;60(2):2640.
51. Verma A, Stellacci F. Effect of surface properties on nanoparticle-cell interactions. Small. 2010;6(1):12–21.
52. Lanza R, Langer R, Vacanti JP. Principles of Tissue Engineering.
 © 2020 The Author(s). This work is published and licensed by Dove Medical Press Limited. The full terms of this license are available at https://www.dovepress.com/terms.php and incorporate the Creative Commons Attribution - Non Commercial (unported, v3.0) License.
By accessing the work you hereby accept the Terms. Non-commercial uses of the work are permitted without any further permission from Dove Medical Press Limited, provided the work is properly attributed. For permission for commercial use of this work, please see paragraphs 4.2 and 5 of our Terms.
© 2020 The Author(s). This work is published and licensed by Dove Medical Press Limited. The full terms of this license are available at https://www.dovepress.com/terms.php and incorporate the Creative Commons Attribution - Non Commercial (unported, v3.0) License.
By accessing the work you hereby accept the Terms. Non-commercial uses of the work are permitted without any further permission from Dove Medical Press Limited, provided the work is properly attributed. For permission for commercial use of this work, please see paragraphs 4.2 and 5 of our Terms.