")
Back to Journals » Diabetes, Metabolic Syndrome and Obesity » Volume 15
A Contemporary Insight of Metabolomics Approach for Type 1 Diabetes: Potential for Novel Diagnostic Targets
Received 17 January 2022
Accepted for publication 8 April 2022
Published 25 May 2022 Volume 2022:15 Pages 1605—1625
DOI https://doi.org/10.2147/DMSO.S357007
Checked for plagiarism Yes
Review by Single anonymous peer review
Peer reviewer comments 5
Editor who approved publication: Professor Ming-Hui Zou
Jiatong Chai, Zeyu Sun, Jiancheng Xu
Department of Laboratory Medicine, The First Hospital of Jilin University, Changchun, People’s Republic of China
Correspondence: Jiancheng Xu, Department of Laboratory Medicine, The First Bethune Hospital of Jilin University, 71 Xinmin Street, Changchun, 130021, People’s Republic of China, Tel +86-431-8878-2595, Fax +86-431-8878-6169, Email [email protected]
Abstract: High-throughput omics has been widely applied in metabolic disease, type 1 diabetes (T1D) was one of the most typical diseases. Effective prevention and early diagnosis are very important because of infancy and persistent characteristics of T1D. The occurrence and development of T1D is a chronic and continuous process, in which the production of autoantibodies (ie serum transformation) occupies the central position. Metabolomics can evaluate the metabolic characteristics of serum before seroconversion, the changes with age and T1D complications. And the addition of natural drug metabolomics is more conducive to the systematic and comprehensive diagnosis and treatment of T1D. This paper reviewed the metabolic changes and main pathogenesis from pre-diagnosis to treatment in T1D. The metabolic spectrum of significant abnormal energy and glucose-related metabolic pathway, down-regulation of lipid metabolism and up-regulation of some antioxidant pathways has appeared before seroconversion, indicating that the body has been in the dual state of disease progression and disease resistance before T1D onset. Some metabolites (such as methionine) are closely related to age, and the types of autoantibodies produced are age-specific. Some metabolites may jointly predict DN with eGFR, and metabolomics can further contribute to the pathogenesis based on the correlation between DN and DR. Many natural drug components have been proved to act on abnormal metabolic pathways of T1D and have a positive impact on some metabolic levels, which is very important for further finding therapeutic targets and developing new drugs with small side effects. Metabolomics can provide auxiliary value for the diagnosis of T1D and provide a new direction to reveal the pathogenesis of T1D and find new therapeutic targets. The development of T1D metabolomics shows that high-throughput research methods are expected to be introduced into clinical practice.
Keywords: type 1 diabetes, metabolomics, diabetic complications, metabolites, drug targets
Introduction
Type 1 diabetes (T1D) is one of the most common chronic diseases and increasing in prevalence with each passing year, particularly in westernized countries with incidences of 8−17 per 100,000 people in Northern Europe and the US.1,2 Aside from using insulin to maintain metabolic stability, there are currently no effective therapies for T1D. The traditional diagnosis of T1D, which includes measuring the levels of glucose, glycated molecules and autoantibodies, has been well established. However, these molecules often mark a late stage of the disease when ~90% of the pancreatic insulin-producing β-cells have already been lost.3 Hence, more attention has been given to early prediction and prevention. The diagnostic methods of T1D are well-established. However, how to monitor the metabolic changes in high-risk groups and intervene in the metabolic pathways involved in the progression to the advanced disease have always been challenging aspects of research. Moreover, acute or multiple organ complications, including diabetic ketoacidosis (DKA), diabetic retinopathy (DR), diabetic nephropathy (DN) and diabetic-induced peripheral neuropathy (DPN), are always found in patients with T1D, and these complications may lead to practical and emotional health concerns for patients and their families.4 In addition, abnormalities of circulatory metabolism that are caused by T1D will also affect the metabolic state of other organs. Lower levels of choline, betaine and methionine were found in the liver of patients with T1D, which indicates that hyperglycemia might eliminate their protective function against liver injury.5 More than 19 metabolites, such as choline, c-aminobutyric acid, glutamine, myo-inositol and lactate, have been found in six regions of the brain, such as the hippocampus, cortex and cerebellum. The location of these metabolites can be used to distinguish healthy people from patients with T1D.6 Impaired amino acid and tricarboxylic acid (TCA) cycle metabolism leads to cardiovascular autonomic neuropathy progression in T1D patients.7 Moreover, T1D can also cause lipid metabolism disorders of the meibomian gland.8 Most importantly, T1D often causes abnormal metabolic changes in the kidney, such as changes in the oxidative stress pathway and purine metabolic pathway.9 Therefore, in view of the great impact of T1D on various organs, it is important to closely monitor the metabolic state of high-risk patients before seroconversion occurs were considered more significant to implement effective intervention, especially in pediatric patients.
The early diagnosis and pathogenesis of this disease have attracted much attention and need to be fully understood. In this context, metabolomics may be a new strategy of choice. The purpose of metabolomics is to reveal the metabolic status of different organs or tissues and provide a metabolic profile based on the systemic metabolic cycle. T1D is a typical complex disease that is characterized by metabolic disorders, so metabolomics could be deemed a suitable method to study the changes in metabolites that are caused by changes in the circulatory pathways in T1D. New biological markers could help explain β-cell destruction and dysfunction and the ongoing immunological response mechanism in T1D. Based on this method of research, we can monitor the progress of T1D and explore the impact of diet or drugs based on changes in metabolites. This could therefore reduce the harm caused by T1D from the three aspects of prevention, monitoring and treatment. Studies that have examined patients before the onset of T1D have shown that many of the early metabolites in umbilical cord blood change at birth, and some metabolites can be combined to build a risk model to predict the progression to T1D.10,11 These findings indicate that metabolites could serve as new predictors for disease onset. In addition, abnormal lipid metabolism, decreased nutrient absorption capacity and intracellular reactive oxygen species (ROS) accumulation existed in children with a high genetic risk (finally progressing to T1D) before seroconversion.12 Hence, the metabolic changes caused by T1D did not occur overnight but were the result of a long process involving metabolic abnormalities. In this context, metabolomics, which can reflect dynamic physical conditions, was found to have potential value in predicting the risk of disease onset. In addition, in children, there are great changes in tissue cells or markers due to physical growth and development, and thus, many metabolites can be affected by age. Therefore, an in-depth understanding of the metabolic status of T1D patients at all ages in childhood is conducive to the layered monitoring and diagnosis of T1D patients by age. Pathway analysis in metabolomics can reveal altered metabolic pathways and indicate potential treatment options for the disease, which is very important for understanding the pathogenesis or improving treatment. Therefore, the need for reliable early diagnosis and progression monitoring indicates the great potential of high-throughput methods such as metabolomics. At present, there is a lack of systematic reviews to comprehensively summarize the research progress of the progression of T1D from the state before onset to treatment. Hence, this article reviewed the current research and progress on use of metabolomics in relation to T1D and its corresponding age-specific changes and complications. This review aims to provide a reference for the application of high-throughput methods combined with metabolic diseases in the clinic.
Metabolomics Approach for Qualitative and Quantitative Analysis of Endogenous Metabolites in T1D
The initiation and progression of T1D could lead to disturbances of the internal balance of biological systems and their components, such as cells, tissues, organs or whole organisms.13 Under this condition, metabolomics is considered a useful and promising tool for evaluating the slight variation in the pattern and quality of endogenous molecules. Thus, it could precisely indicate metabolic dysfunction secondary to T1D. Lipidomics, an extension of metabolomics, concentrates on the rapid analysis of intact lipids from a range of chemical classes (including triglycerides (TGs), diacylglycerols, phospholipids, free fatty acids (FFAs), cholesterol, cholesterol esters (CEs), and sphingolipids),14 which is of great value to T1D characterized by lipid imbalance. In addition, the change in serum metabolites existed in infancy for T1D patients, which will be discussed in detail later. Hence, preliminary metabolic screening could be regarded as an auxiliary diagnostic method for T1D. The protocol of the analytical process is shown in Figure 1. Mass spectrometry, ultra-performance liquid chromatography (UPLC) and nuclear magnetic resonance spectroscopy (NMR) are the main techniques used to profile the serum metabolic fingerprint of T1D. Proton (1H)-NMR spectroscopy technology features the recyclability of specimens, and good reproducibility of this technology has been found to be beneficial in the study of metabolomics for various diseases in recent years. However, the interpretation of the NMR peak is always an obstacle for omics analysis. Hence, mass spectrometry methods are commonly used to detect endogenous metabolites quantitatively because of their high sensitivity and low sample amount.
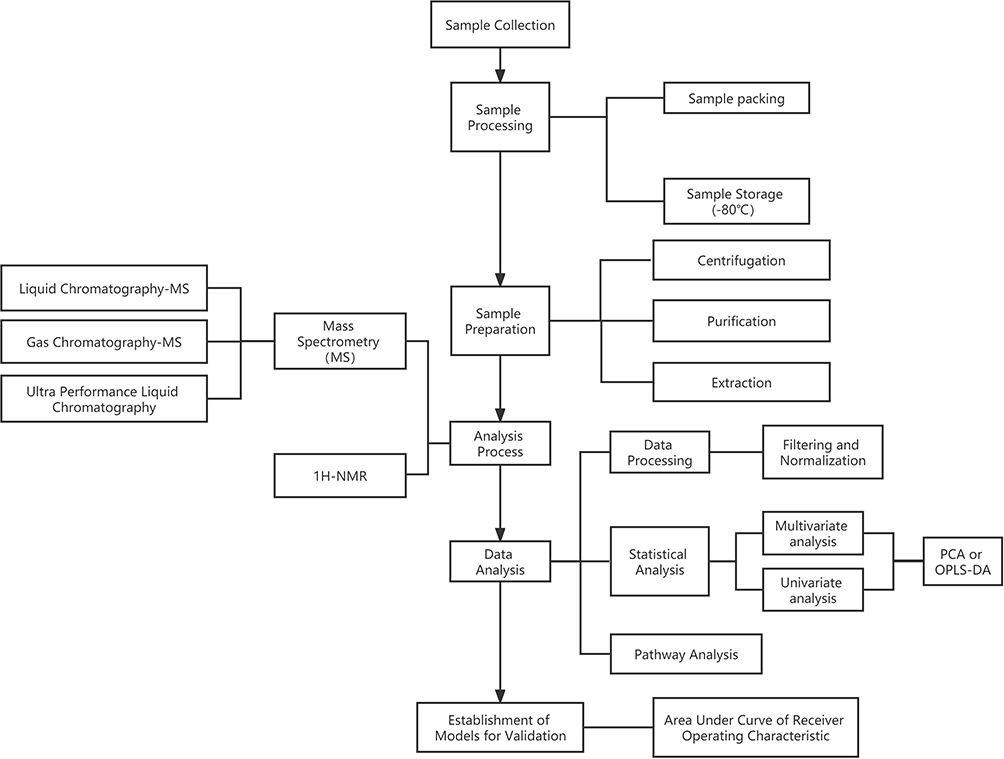 |
Figure 1 Schematic illustration of a typical metabolomic pipeline. Abbreviations: PCA, principal component analysis; OPLS-DA, orthogonal partial least squares discriminant analysis; NMR, nuclear magnetic resonance spectroscopy. |
Statistical analysis mainly involves univariate and multivariate analyses. Orthogonal partial least squares discriminant analysis (OPLS-DA) and principal component analysis (PCA) are used to analyze data, identify possible outliers or establish models for diagnosis. The availability of the established models is evaluated either by the total amount of variation between and within the groups explained by the model [denoted as R2Y (cum) and R2X (cum), respectively] or by the predictive ability of the model as determined by a sevenfold cross-validation [denoted as Q2(cum)].15 The metabolites with specific changes are screened by false discovery rate (FDR) or variable importance in the projection (VIP) with specific standards (eg FDR>0.5 or VIP>1), followed by the statistical methods to determine the biomarkers with significant differences between T1D group and control group. The area under the curve (AUC) is used to evaluate the availability of the established diagnosis model. Furthermore, pathway analysis could be helpful for the visualization of metabolic pathways and the explanation of the pathogenesis.
The Metabolomic Changes in the Progression of T1D
Human blood is mainly composed of metabolites and lipids. A fluctuating trend would be shown in these molecules when pathological conditions occur and show abnormal physical and chemical properties that may contribute to the pathophysiology of the disease.16 Although complex diseases such as T1D are mostly related to genetic factors, some biologists believe that the occurrence of this kind of disease is a dynamic process. The variation in disease-related genes or the change in metabolic pathways can be induced by many factors, which comprehensively leads to the occurrence of diseases. The metabolic changes before the occurrence of the disease can be comprehensively regarded as a phenotypic transformation state, which can transform the abstract metabolic concept into a tangible phenotypic concept. The formation of autoimmunity is the precursor symptom of T1D, and the metabolic state before and after the production of autoantibodies is markedly different. Metabolomics studies have suggested that changes in the levels of phospholipids, methionine, glutamate, and energy metabolites are present before seroconversion.17 Once autoantibodies are produced, the metabolic state of the body will be irreversibly damaged. If the patient can receive timely intervention, the progress of the disease can be slowed or stopped. However, the time node for antibody production is always difficult to define. Therefore, the metabolic condition before and after antibody production needs to be further explored. Such clarifications could benefit intervention throughout the progression of the disease and reduce the incidence rate of T1D.
Metabolomics analysis from children 0.5–13.5 years of age in the Finnish Type 1 Diabetes Prevention and Prediction Study (DIPP)10 showed that serum metabolites might be related to the progression to islet autoimmunity and from islet autoimmunity to diabetes. The umbilical cord-blood levels of phospholipids [especially phosphatidylcholines (PCs)] were reduced in children who progressed to T1D later,10,18 which was also proven in other studies.19,20 A prospective study, the Environmental Determinants of Diabetes in the Young (TEDDY) study, was designed to provide a better understanding of disease pathogenesis and result in new strategies to prevent, delay, or reverse T1D by identifying factors associated with a high risk for T1D in children.21 The metabolic pathway enrichment analysis in one of the metabolomics studies in this cohort showed that lipid-related pathways were mostly downregulated in the progression of autoantibodies to insulinoma-associated protein 2 (IA-2A).12 Phospholipids play an important role in the formation of the cell membrane in the process of pregnancy, and the lack of phospholipids may lead to incomplete immune cell function. PCs are important antioxidants in the human body whose reduction leads to the resistance of islet cells to oxidative damage. Furthermore, a large amount of docosahexaenoic acid (DHA) supplementation can reduce the risk of autoimmunity and T1D. This also indicates the important role of phospholipids in the pathogenesis of T1D22,23 and could also alert clinicians to the high risk of T1D in the future for newborns with low phospholipid levels. In addition, increasing levels of proinflammatory lyso-phosphatidylcholine (LPC), glutamate, branched chain amino acids (BCAAs) and several TCA cycle metabolites were found before the appearance of first islet autoantibodies, and these metabolite concentrations nearly normalized after positivity for glutamic acid decarboxylase antibody (GADA) was detected.24 The decreasing trend of BCAAs compared with the levels of pre-antibody production, which were proven to increase insulin secretion,25 indicated that islet cells were damaged in this period. In addition, some of the lipids in serum, such as sphingomyelins (SMs), also play an important role in regulating immune cell activity. Lower levels of SMs and LPC and higher levels of CEs24,25 were also found before the production of the first antibodies. Interestingly, the decline in sphingomyelin in infancy leads to the first production of the GADA antibody, and diglycerides (DG), LPC and TGs all showed a decreasing trend before the production of GADA.26 Hence, the liposome metabolome, which is involved in various metabolic pathways, has been confirmed to be an important factor affecting the formation of autoimmunity and the occurrence and development of T1D. Liposomes are closely related to nutrition and energy sources. Thus, the liposome metabolome can thoroughly indicate the nutritional status of children at high risk of T1D. Therefore, it can be used to explore the effects of nutritional intake on liposome metabolism and T1D progression to contribute to the development of dietary prevention. In addition, one study based on a mouse model of the early stages of human T1D also showed low LPC levels, the accumulation of ceramides and methionine deficits in pre-T1D mice.27 A variety of intracellular signaling events that are initiated by oxidized low-density lipoprotein are regulated by LPC, which is related to inflammatory and immune processes. One of the most important pathogenesis is oxidative stress and inflammation. Therefore, the imbalance of LPC occurred before the production of autoantibodies, which could also be regarded as an important factor that could promote the progression of T1D. Oxidative stress is also affected by glucose and energy metabolism, and glycolysis, pyruvate metabolism, oxidative phosphorylation and other pathways have been observed to be significantly upregulated before antibody production.12 These findings indicate that the body was in the process of ROS detoxification and DNA repair before the production of antibodies. The downregulation of aspartic acid, alanine and glutamic acid was accompanied by the production of islet autoantibodies,10 and a negative correlation was found between the levels of alanine and the risk of T1D.28 Furthermore, increasing levels of α-tocopherol, myo-inositolphosphate, and methionine and decreasing levels of various amino acids (glutamic acid, aspartic acid, etc.), malic acid and 3,4-dihydroxybutanoic acid were found after the first appearance of islet autoantibodies.29 These findings illustrate the effect of autoantibodies on T1D progression. In contrast, ascorbic acid, which can inhibit insulin secretion, decreases before seroconversion and then increases after the onset of diabetes.30,31 This phenomenon could be explained by the regulation of processes that protect against abnormal oxidative stress before seroconversion to improve the disordered insulin level in the body. There were differences in metabolism between patients with T1D (PT1D) and patients with only autoantibodies before and after antibody production (P1Ab). Methionine, an important metabolite in T1D, showed different trends in P1Ab and PT1D. The levels of multiple lipid species, including LPC and DG 34:1, at 6 months prior to the first detection of GADA were lower in T1D progressors than in nonprogressors.26 D-arabinose and D-(-)-lyxofuranose were also found to have opposite trends in the two groups. These findings indicate that these metabolites were affected by the metabolic pathways related to the pathogenesis of T1D rather than the production of autoantibodies. This may provide a new direction for the exploration of the pathogenesis of T1D. In addition, this opposite trend seems to be related to the severity of the metabolic changes. It may also benefit the identification of subsequent disease development because T1D represents a more serious state of oxidative stress and metabolic disorder. Some prediction models were constructed based on the abundance of metabolites before antibody production,32 and these models aimed to evaluate different metabolites in the early stages of disease progression. Metabolomics analyses that are related to the production time of autoantibodies will provide reference information and research data for the construction of high-quality models. The metabolite changes before and after islet autoantibody production in different disease groups are summarized in Table 1.
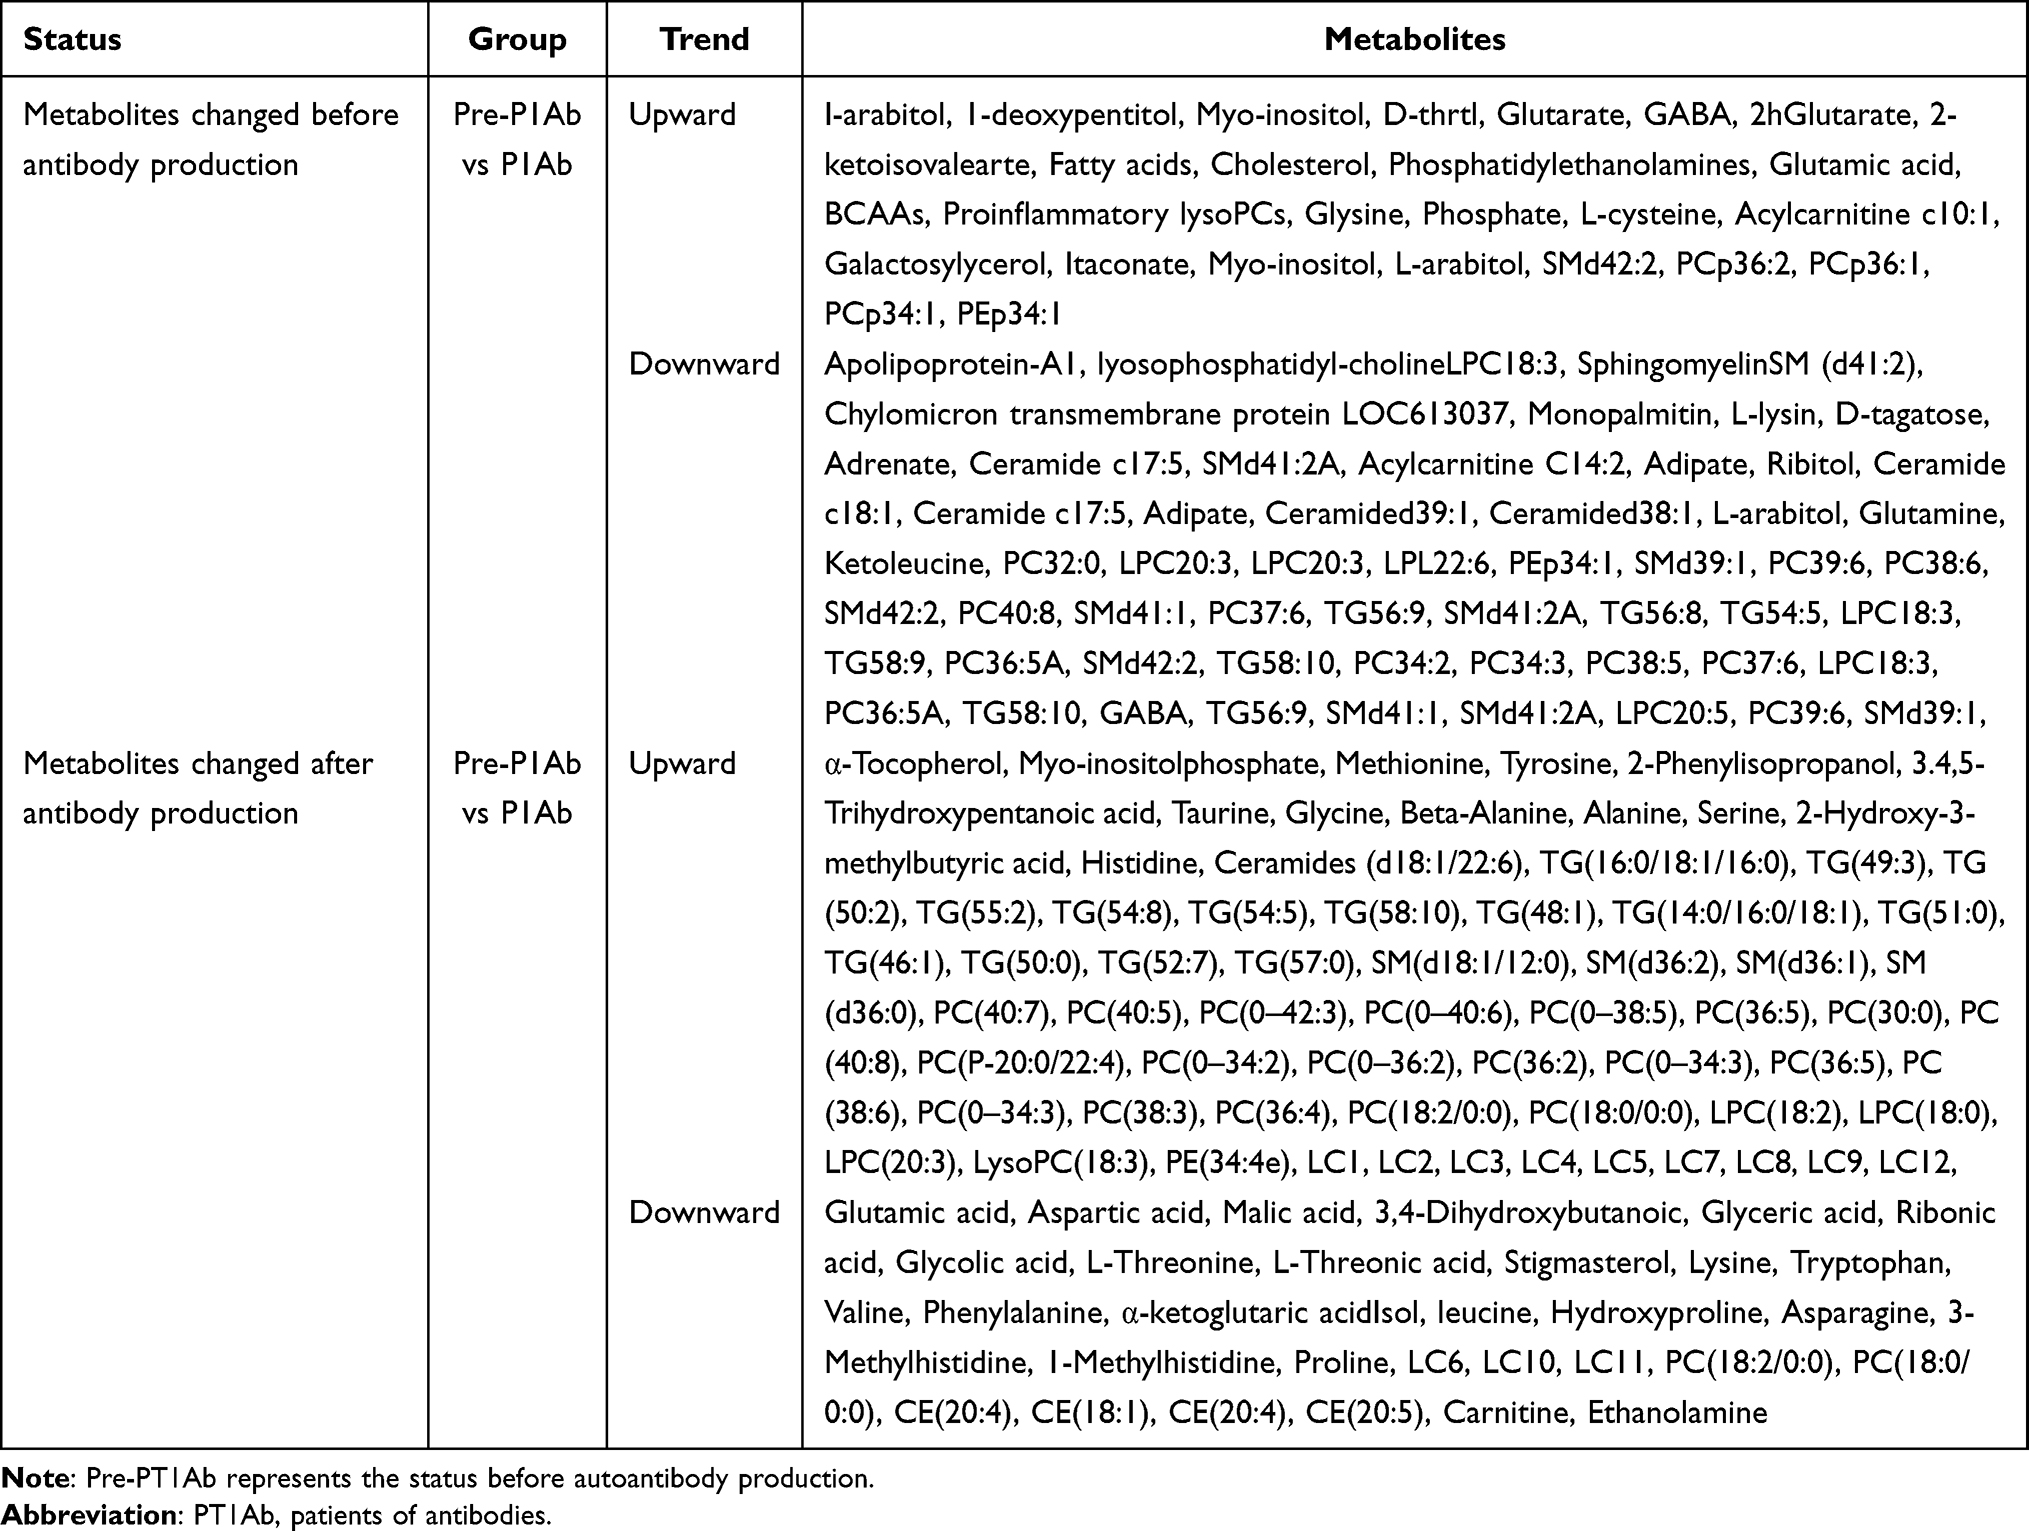 |
Table 1 Summary of Antibody Production and Metabolite Changes |
The abnormal metabolic changes that occur before the production of autoantibodies or before the onset of T1D can be regarded as a self-regulation of the body to adapt to the increased metabolic needs of islets and maintain its own metabolic homeostasis at the cost of reducing the threshold of reoccurrence, which was defined as allostatic load.33 Low levels of PCs are an important metabolic feature of T1D, and high levels of PCs were found in PT1Ab. Ascorbic acid, which can inhibit insulin secretion, decreases before seroconversion and then increases after diabetes.30,31 All of these findings indicate that the body attempts to regulate metabolism to maintain a normal state before progressing to T1D. This is also regarded as a negative feedback mechanism of self-protection. Although this abnormal metabolic condition could maintain metabolic stability in a short time, more imperceptible effects would appear in many metabolic pathways of the body. Thus, greater damage to energy functions would accumulate and cause further metabolic damage. Once exogenous or self-produced dangerous pathogenic factors appear, the body responds quickly. This rapid response causes irreversible serum transformations or the direct progression to T1D. This iterative process is presented in Figure 2. However, if this abnormal metabolism could be found and controlled in time, the risk of continuing the progression to T1D would be greatly reduced. Therefore, it is also important to regularly monitor the metabolic status of high-risk groups.
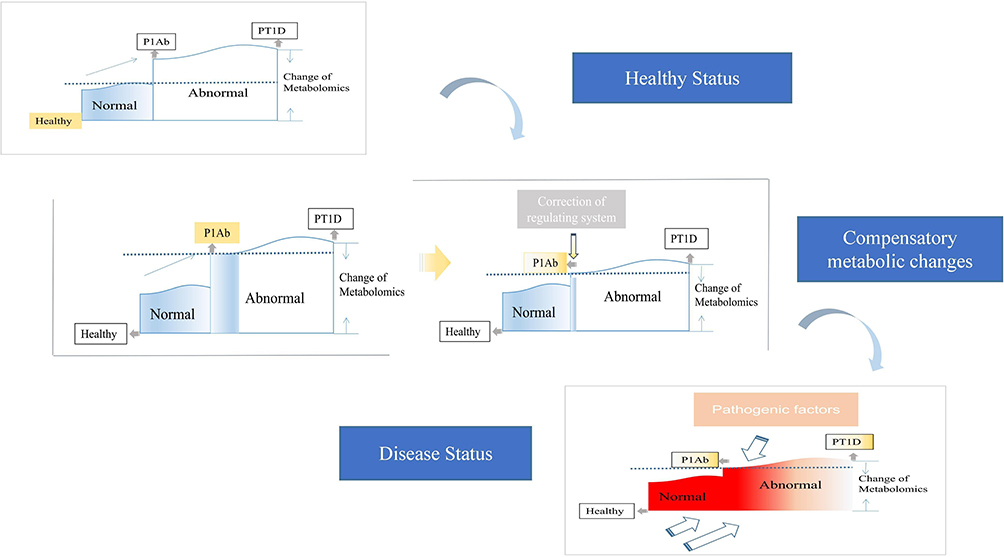 |
Figure 2 Speculation on the progress of T1DM from the perspective of metabolomics. When the body enters the abnormal metabolic state (ie serum transformation period) due to various factors, the body will not immediately appear disease characteristics, but take the lead in self-regulation to restore the metabolic state to relatively normal, but the subsequent cost is to reduce the onset threshold (shown by the dotted line in the figure). After that, when the risk factors reappear again, due to the reduction of the incidence threshold, the metabolic state of the body will progress to the abnormal level at a faster speed, even more serious than the first time (ie disease state). The disease threshold of the body had decreased after the first self-metabolic regulation. The red box represented more severe pathogenic intensity. Abbreviations: PT1D, patients of T1D; PT1Ab, patients of antibodies. |
In conclusion, the disturbances of some lipids, amino acids and other metabolites preceded the onset of T1D or even changed in the infancy of patients due to unknown congenital cell development problems or changes in islet metabolic capacity during growth. Some exogenous factors, such as environment, diet or lifestyle, play a key role in disease progression. An altered and disease-distinctive molecular phenotype is already established before seroconversion, and thus, it is possible to monitor the progression of diabetes. However, seroconversion is only an early warning of the occurrence of T1D, and seroconversion-positive patients might not develop T1D or are not always autoantibody-positive. The metabolomic analysis of the metabolic state before serum transformation undoubtedly proves that the occurrence of T1D is a process that extends with time. More importantly, it introduces a new concept for the prevention and treatment of T1D. Therefore, the assessment of metabolic changes needed further confirmation and research. Auxiliary diagnosis assays could be developed to measure the selected metabolites, which was necessary for monitoring the population with high morbidity.
Analysis of Age-Specific Differential Metabolites
Age has always been considered as a variation in concentrations of analytes, hence, it was not surprisingly that some metabolites were related to age. Antibodies produced by different age groups have been proven to be different in pediatric patients. In patients with T1D, insulin autoantibody (IAA) was shown to be preferentially produced in the body at the age of 15 months, while GADA was the primary antibody produced at the age of 24 months.34 The age of onset and the type of autoantibodies produced may reflect different genetic variations or immune responses to early environmental exposure. Studies investigating age-specific metabolites usually divide individuals into PT1D, PT1Ab and healthy population (HP), aiming to distinguish the metabolic characteristics of patients with T1D and patients with islet autoimmunity. In particular, the important role of methionine in T1D should be mentioned here. Methionine is involved in DNA methylation. Thus, methionine deficiency will increase the risk of T1D and is closely related to the emergence of autoantibodies. One study found that the concentration of methionine in children with autoantibodies before the age of two was twice as low as that in patients with autoantibodies after 2 years old or patients who were consistently negative for antibodies.35 Hence, a higher risk for progressing to T1D and a worse prognosis would be found in the former group. The earlier the antibody was produced, the longer the cycle of islet cell damage, which would ultimately lead to more serious metabolic changes. The age of two was a common critical point in metabolomics research of T1D, and the reason might be the increases in morbidity or metabolic disturbances that are caused by T1D at this age point. In addition, there were different optimal diagnostic indicators that are associated with age. Low levels of LPCs were deemed the best predictors before 2 years of age, while TGs were better than LPCs in predicting T1D before 4 years of age.36 The age of 2–4 years may be the key time for the formation of immune function. Phospholipids are a component of the immune cell membrane, and thus, the levels of phospholipids could better reflect the changes in immunity in the body. With the changes in dietary structure, physical development and the formation of basic immune functions at 4 years old, TG could be regarded as a more specific metabolite related to metabolic changes. This could increase the diagnostic efficiency for clinicians.
In addition, the month-age points, such as 3, 6, 18, 24, and 36 months, were also divided in previous studies, and a strong association was observed between the metabolites and age. A continuous downward trend of ether phospholipids, TGs, PCs and SMs was found in PT1D throughout disease progression, and 3 months seemed to be the age group with the most robust differences in lipids. SMs had a continuous decreasing trend in the T1D group or in the study population who later developed T1D.10,37,38 SMs, including the sphingomyelinase family, play an important role in T-cell regulation and are important for regulating immune cell activity.39 However, the metabolism of SMs was interrupted before the production of islet autoantibodies, and the levels of SMs were accompanied by a decreasing trend in the process of progression. These findings are also consistent with the metabolic research related to T1D progression mentioned above. Hence, SMs play an important role in the evaluation of disease progression and the monitoring of metabolism in children by age. In addition, although TGs had different trends in each age group, a downward trend was still shown overall. Of note, the individuals in these studies were basically young infants, and the diet was mainly breast milk. Thus, the resulting fluctuations in lipids could be due to the influence of diet. PCs mediate the synthesis of choline, which is closely related to the production of TGs. Therefore, once the synthesis or absorption of PCs is affected, the TG level of the body changes through a series of chain reactions. In addition, TGs are the main form of energy storage in the human body. The occurrence and development of T1D are accompanied by oxidative stress, resulting in the enhanced decomposition of TGs to meet the excessive energy needs of the body. Different trends were shown in various age groups for some TGs. These findings suggest that TGs were not only affected by oxidative stress but also affected by lipid changes caused by the development of cells with age. Excessive oxidative stress also significantly reduced fatty acids at the age of 3 months,40 which could be explained by the changes in linoleic acid and arachidonic acid metabolism. The levels of tryptophan derivatives (such as 3-indoleacetic acid) were higher in 3- and 6-month-old children with T1D, and the concentrations of LPC also showed the same increasing trend at 3, 6, and 12 months.29,37 BCAAs were significantly increased at 18, 24 and 36 months.29 In addition, another study on lipid metabolism indicated that CEs and phosphatidylethanolamines (PEs) were also increased in the above age groups.37 However, some metabolites showed different trends in various age groups, indicating that the metabolites were closely related to not only the growth and development of the body but also the development of the disease course. In addition, different results were shown in different studies even for the same metabolite. For example, one study35 showed that glutamine, a popular substance in the study of T1D metabolomics, had a strong correlation with age, which was different from another study.10 The same situation occurs in lipidomics, which is another branch of metabolomics. These phenomena indicate that there might be great differences in the metabolic status in various research environments and test populations. DIPP and BABYDIAB were two common cohorts in T1D studies, and there was a slight difference between the two cohorts. Although all individuals with a high risk of disease were recruited, DIPP recruited children with susceptibility genes. However, BABYDIAB recruited patients who had one parent with T1D, and thus, the risk of T1D was assumed to be increased. Moreover, it could be seen that human circulatory metabolism was affected by many aspects, including genes, environment, diet and external factors. However, these differences between different studies could help to improve the metabolomics of T1D and provide important information about whether metabolomic data could be widely applied or used in a region/cohort-specific manner. At present, there are few age-related metabolomics studies for T1D, and a summary of the age-specific metabolites is shown in Table 2.
 |
Table 2 Summary of the Age-Specific Metabolites |
Due to the rapid growth of children during development, metabolic changes in the body vary greatly with age. Understanding the metabolic pattern of age differences is helpful for a more accurate diagnosis of patients of different ages. However, previous studies found that although there were many different metabolites in different age groups, few of them had actual statistical significance. Therefore, the effect of age on the metabolism of T1D patients needs further study.
Metabolomics and Pathogenesis of DN
DN develops in approximately 30% of patients with T1D and is the leading cause of end-stage renal disease (ESRD). The albumin/creatinine ratio (ACR) and glomerular filtration rate (GFR) are commonly used to evaluate renal function decline. However, the abnormal results of ACR and GFR indicate that diabetic nephropathy has occurred and is unable to provide a deeper assessment of renal function. Hence, more metabolites associated with GFR should be detected to improve or even replace ACR for the diagnosis of DN.41 The fundamental source of metabolic pathways in humans is carbohydrate metabolism, which includes the pentose phosphate pathway, glycogenesis, glycogenolysis and the gluconeogenesis pathway. Glucose is converted into pyruvate by glycolysis, followed by conversion into acetyl coenzyme A (acetyl-CoA) under aerobic conditions and lactic acid under anaerobic conditions. These conversions pave the way for their subsequent entry into the TCA cycle. The fatty acid decomposition products that are produced by the glycolipid metabolism pathway in lipid metabolism are also ultimately related to the production of acetyl-CoA. In addition, choline is decomposed in the pathways of phospholipid metabolism and is related to high levels of dimethylamine (DMA) under hyperglycemic conditions. Hyperglycemia inhibits glycolysis (via pyruvate kinase), which leads to a significant decrease in pyruvate content.42 This decrease influences the production of malate, fumarate, citrate, succinate, and 2-oxoglutarate in the downstream TCA cycle. The low level of 2-ketoglutarate in the TCA cycle decreases the content of glutamate downstream, resulting in a decrease in the level of metabolites of the N-acetyl-glutamate pathway. The decomposition products affect the production of urea in the downstream ornithine cycle. In addition, purine metabolism is decomposed into hypoxanthine and then into xanthine. This is then decomposed into blood uric acid and allantoin, resulting in oxidative stress. This process is catalyzed by xanthine oxidase (XO), which indicates that XO is an important source of ROS in diabetes and an important metabolite to aggravate DN.9 Figure 3 shows the metabolic crossover network.
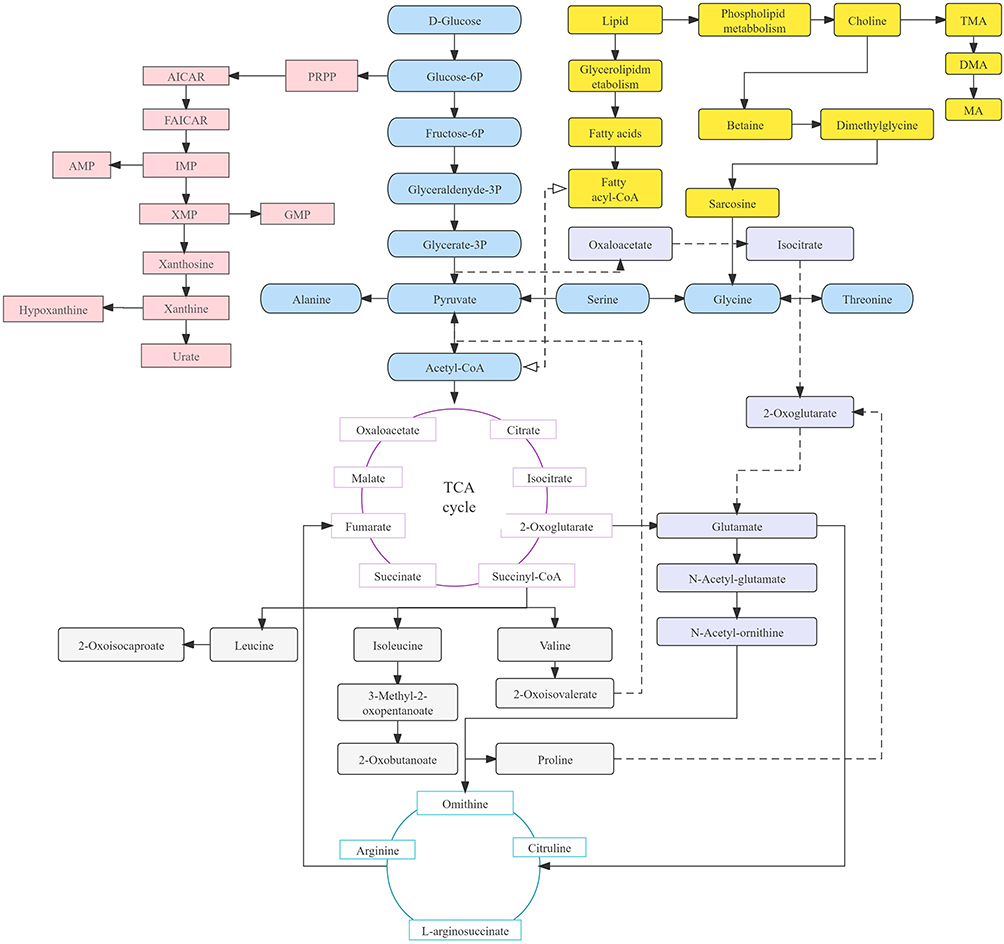 |
Figure 3 Schematic representation of the metabolic pathways in in the events of DN and T1DM. Abbreviations: PPRP, phosphoribosyl pyrophosphate; AMP, Adenosine monophosphate; IMP, inosinic acid; XMP, xanthine nucleotide; GMP, guanosine monophosphate. |
A study on the lipomics of DN showed that the GFR was negatively correlated with SMs and alkyl-acyl-phosphatidylcholines (PC-Os) but positively correlated with PCs, TGs and two short-chain LPCs.43 Higher levels of SMs and PC-Os were found in the population with poor prognosis. However, an inconsistent relationship was found between some biomarkers and the GFR or albumins. This finding might be attributed to glomerular hyperfiltration and should be considered in the early diagnosis of DN. One study identified 19 serum metabolites to distinguish DN patients from diabetic patients using metabolomics.44 In addition, a study based on rat models showed disturbances in lipid/ketone body synthesis, the TCA cycle and glycolysis in DN rats.45 The steady state of the purine metabolic pathway was likely to be disrupted in the pathogenesis of DN due to the increased levels of allantoin and uric acid (UA) that were reported in a study using NMR technology.9 Allantoin and UA were activated by xanthine oxidase (XO). This was followed by increased levels of ROS and excessive oxidative damage, which was caused by hyperglycemia. More evidence has indicated excessive oxidative stress inflammation, such as the elevated levels of 8-iso-prostaglandin F2α and 8-hydroxy-2ʹdeoxyguanosine (8-OHdG).46 The mechanism of renal injury caused by xanthine metabolic disorder was also described, which was a new discovery for the pathogenesis of DN. Other metabolites in urine that should have been reabsorbed mostly in renal tubules, such as citrate, fumarate and hippurate, all showed elevated trends. These findings indicate impaired renal parenchyma and glomerular filtration function related to the reduced activity of transport proteins (eg, solute carrier). However, in serum metabolomics, due to the obstruction of the TCA cycle, the levels of fumarate and other substances showed a downward trend. Urinary metabolomics and serum metabolomics are sometimes difficult to maintain. The most important reason is that kidney injury caused by diabetic nephropathy can cause dysfunction of glomeruli and renal tubular function. Some of the reduced serum markers also cause an increase in corresponding markers in urine due to impairment of renal filtration function. Hence, this would provide a new research direction in which some associations could be evaluated by combining the metabolites and the function of glomeruli and tubules to screen the degree of renal damage. In this context, the proper combination of metabolism in the serum and urine will benefit the evaluation of DN metabolic changes. With in-depth discussion and analysis, which may improve the research of DN pathogenesis. The abnormal microbiota in DN patients was also one of the reasons for the high level of hippurate because hippurate could be digested and decomposed by microorganisms in the intestine under normal circumstances.47 In addition, inflammation was found to be significantly correlated with DN, which was proven by elevated levels of N-acetylglycoprotein (NAG) and related biochemical molecules (such as interleukin-8). Amino acids were also increased in DN metabolic disorder. Leucine is considered an important metabolite for reducing blood glucose, regulating insulin levels and promoting liver protein synthesis in patients with renal injury.48,49 Hence, the decreasing trend of leucine indicated increased clearance of gluconeogenic metabolites by the liver.50 This not only provides researchers with a reference for the diagnosis of DN but also shows the significance of leucine supplementation in time for disease management. In addition, the production of ceramide was influenced by a decreasing trend in D-sphinganine, which would affect the changes in glucose ceramide. This would interfere with glucose metabolism and promote the development of DN. In addition, sphingolipid production could also be affected by decreased levels of D-sphinganine, which would result in a reduction in ability of the body to decompose TGs and cholesterol. Surprisingly, 3-hydroxybutyrate (3-HB) showed the opposite trend in different studies. This finding suggests that various factors could influence the level of 3-HB, including differences in individual selection, detection techniques or other reasons. Metabolomics analyzes the changes in amino acids, fatty acids and lipids in DN, which would help better diagnose and manage diabetic patients. However, due to the disunity of different substances in various studies, more extensive and reliable studies and conclusions are needed to apply metabolomics to the clinical diagnosis of DN, rather than just at the research level.
The occurrence and development of DN are accompanied by the disorder of multiple metabolic pathway. These pathway disorders not only represent the metabolic characteristics of the disease but also provide a new choice for the therapeutic target of the disease. The disturbed pathways are summarized in Figure 4. The increase in tricarboxylic acid cycle intermediates, such as 2-oxoglutarate, cis-aconitate and fumarate, reflect the effect on the damage to kidney tubular transport and mitochondrial function, as well as the activation of the stress response by hyperglycemia.51 Moreover, succinic acid showed a decreasing trend that was different from that of other tricarboxylic acid cycle intermediates, which might be related to changes in pathways other than TCA.52 2-Oxoisovarate, the downstream product of succinyl-CoA, is related to pyruvate, so the decrease in pyruvate may also be the reason for the weakening of the succinate cycle. The glycolytic metabolic balance was also broken, characterized by decreasing levels of lactate, glycine and glutamate, which has been proven in many studies.9,50,52 Inositol, a substance that can respond to renal tubular dysfunction and renal cell stress, showed an elevated trend. However, inositol was also proven to play a significant role in restoring damaged nerves,53 providing a reference for DN treatment. In addition, the disturbed pathways were correlated with ACR and could reflect the progression of DN. Moreover, the specific damage points in the pathways could be explored as candidate targets for the treatment of DN. Dimethylarginine dimethylaminohydrolase (DDAH) in the methylamine metabolic pathway could promote asymmetric dimethylarginine (nitric oxide synthase inhibitor) to produce DMA. DDAH could be used as a potential therapeutic target for maintaining vascular homeostasis because DDAH can effectively regulate the concentration of DMA and the production of nitric oxide. Other studies have also revealed that the metabolic changes in DN mainly involve lipid metabolism, the metabolic profiling of plasma esterified and nonesterified fatty acids, and citric acid cycle metabolites related to mitochondrial dysfunction.43,47,54
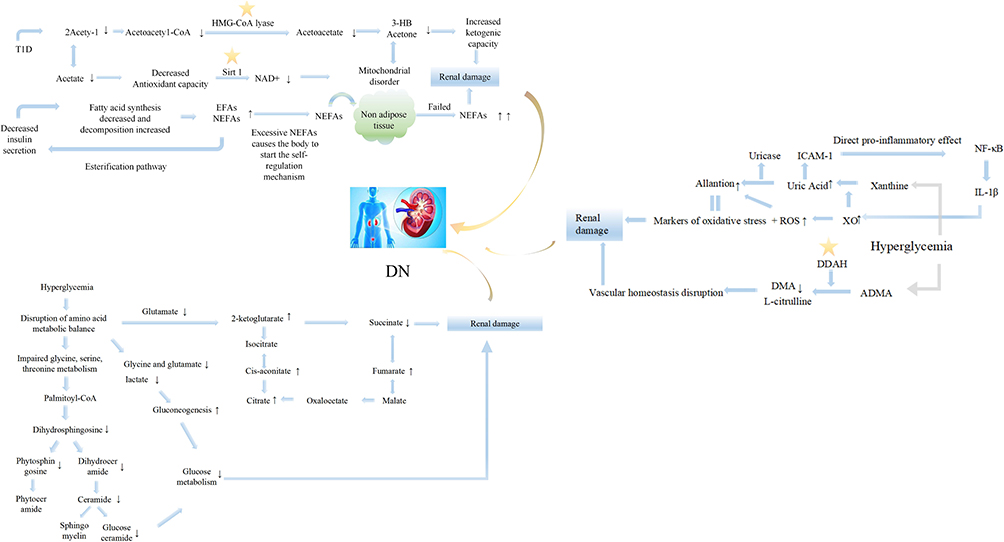 |
Figure 4 Metabolic pathways involved in the pathogenesis of DN. Star symbols represented potential therapeutic targets; ↑ or ↓ indicated the upward or downward trend of corresponding analytes. Abbreviations: HMG-CoA lyase, 3-hydroxy-3-methylglutaryl-CoA lyase; Sirt 1, silent information regulator; IL-1β, interleukin-1β; DDAH, dimethylarginine dimethylaminohydrolase; ADMA, asymmetric dimethylarginine; EFAs, esterified fatty acids; NEFAs, nonesterified fatty acids; NF-κB, nuclear factor-k-gene binding; XO, xanthine oxidase; DMA, dimethylamine; ROS, reactive oxidative stress; ICAM-1, intercellular cell adhesion molecule-1. |
However, diabetes complications are similar to those of diabetes, and prevention is far more meaningful than treatment. A study on the progression of diabetic nephropathy showed that butenoylcarnitine and histidine in serum and hexose, glutamine, and tyrosine in urine were highly associated with the progression of microalbuminuria to macroalbuminuria.55 Hyperlipidemia is also one of the risk factors for the progression of DN.56 A fatty acid metabolomics study on the pathogenesis and progression of DN divided the subjects into non-DN and different degrees of DN (DNIII, DNIV, DNV), which could better compare the changes in fatty acids in the pathogenesis and progression of DN.54 Arachidonic acids, inflammatory regulators involved in prostaglandin synthesis, showed obvious differential characteristics in the progression of DN. In addition, a decreasing trend in the levels of esterified fatty acids (EFAs) and an elevated trend in the levels of nonesterified fatty acids (NEFAs) were found at the beginning of T1D. However, a decreasing trend of NEFAs was shown in the DNIII group due to the self-repair of adipocytes. Unfortunately, self-adjustment fails because of the aggravated metabolic disorder and results in renal damage.54 This tendency of EFAs and NEFAs reflects the self-regulation of fatty acids at the cost of organ damage in the case of impaired metabolism and would lead to more severe organic changes. This is was similar to the human body’s regulation of its own metabolism at the cost of reducing the onset threshold during the progression of T1D mentioned above. Hence, the occurrence and development of diabetes and its complications showed a significant correlation with the excessive regulation of the body, and how to prevent this process and restore the body’s metabolism to a normal regulation state is always the goal of researchers. These studies indicate that metabolomics and the evaluation of biomarkers are truly potential tools for establishing the differentiation or diagnosis of DN in advance. The changes in metabolites in DN are shown in Table 3.
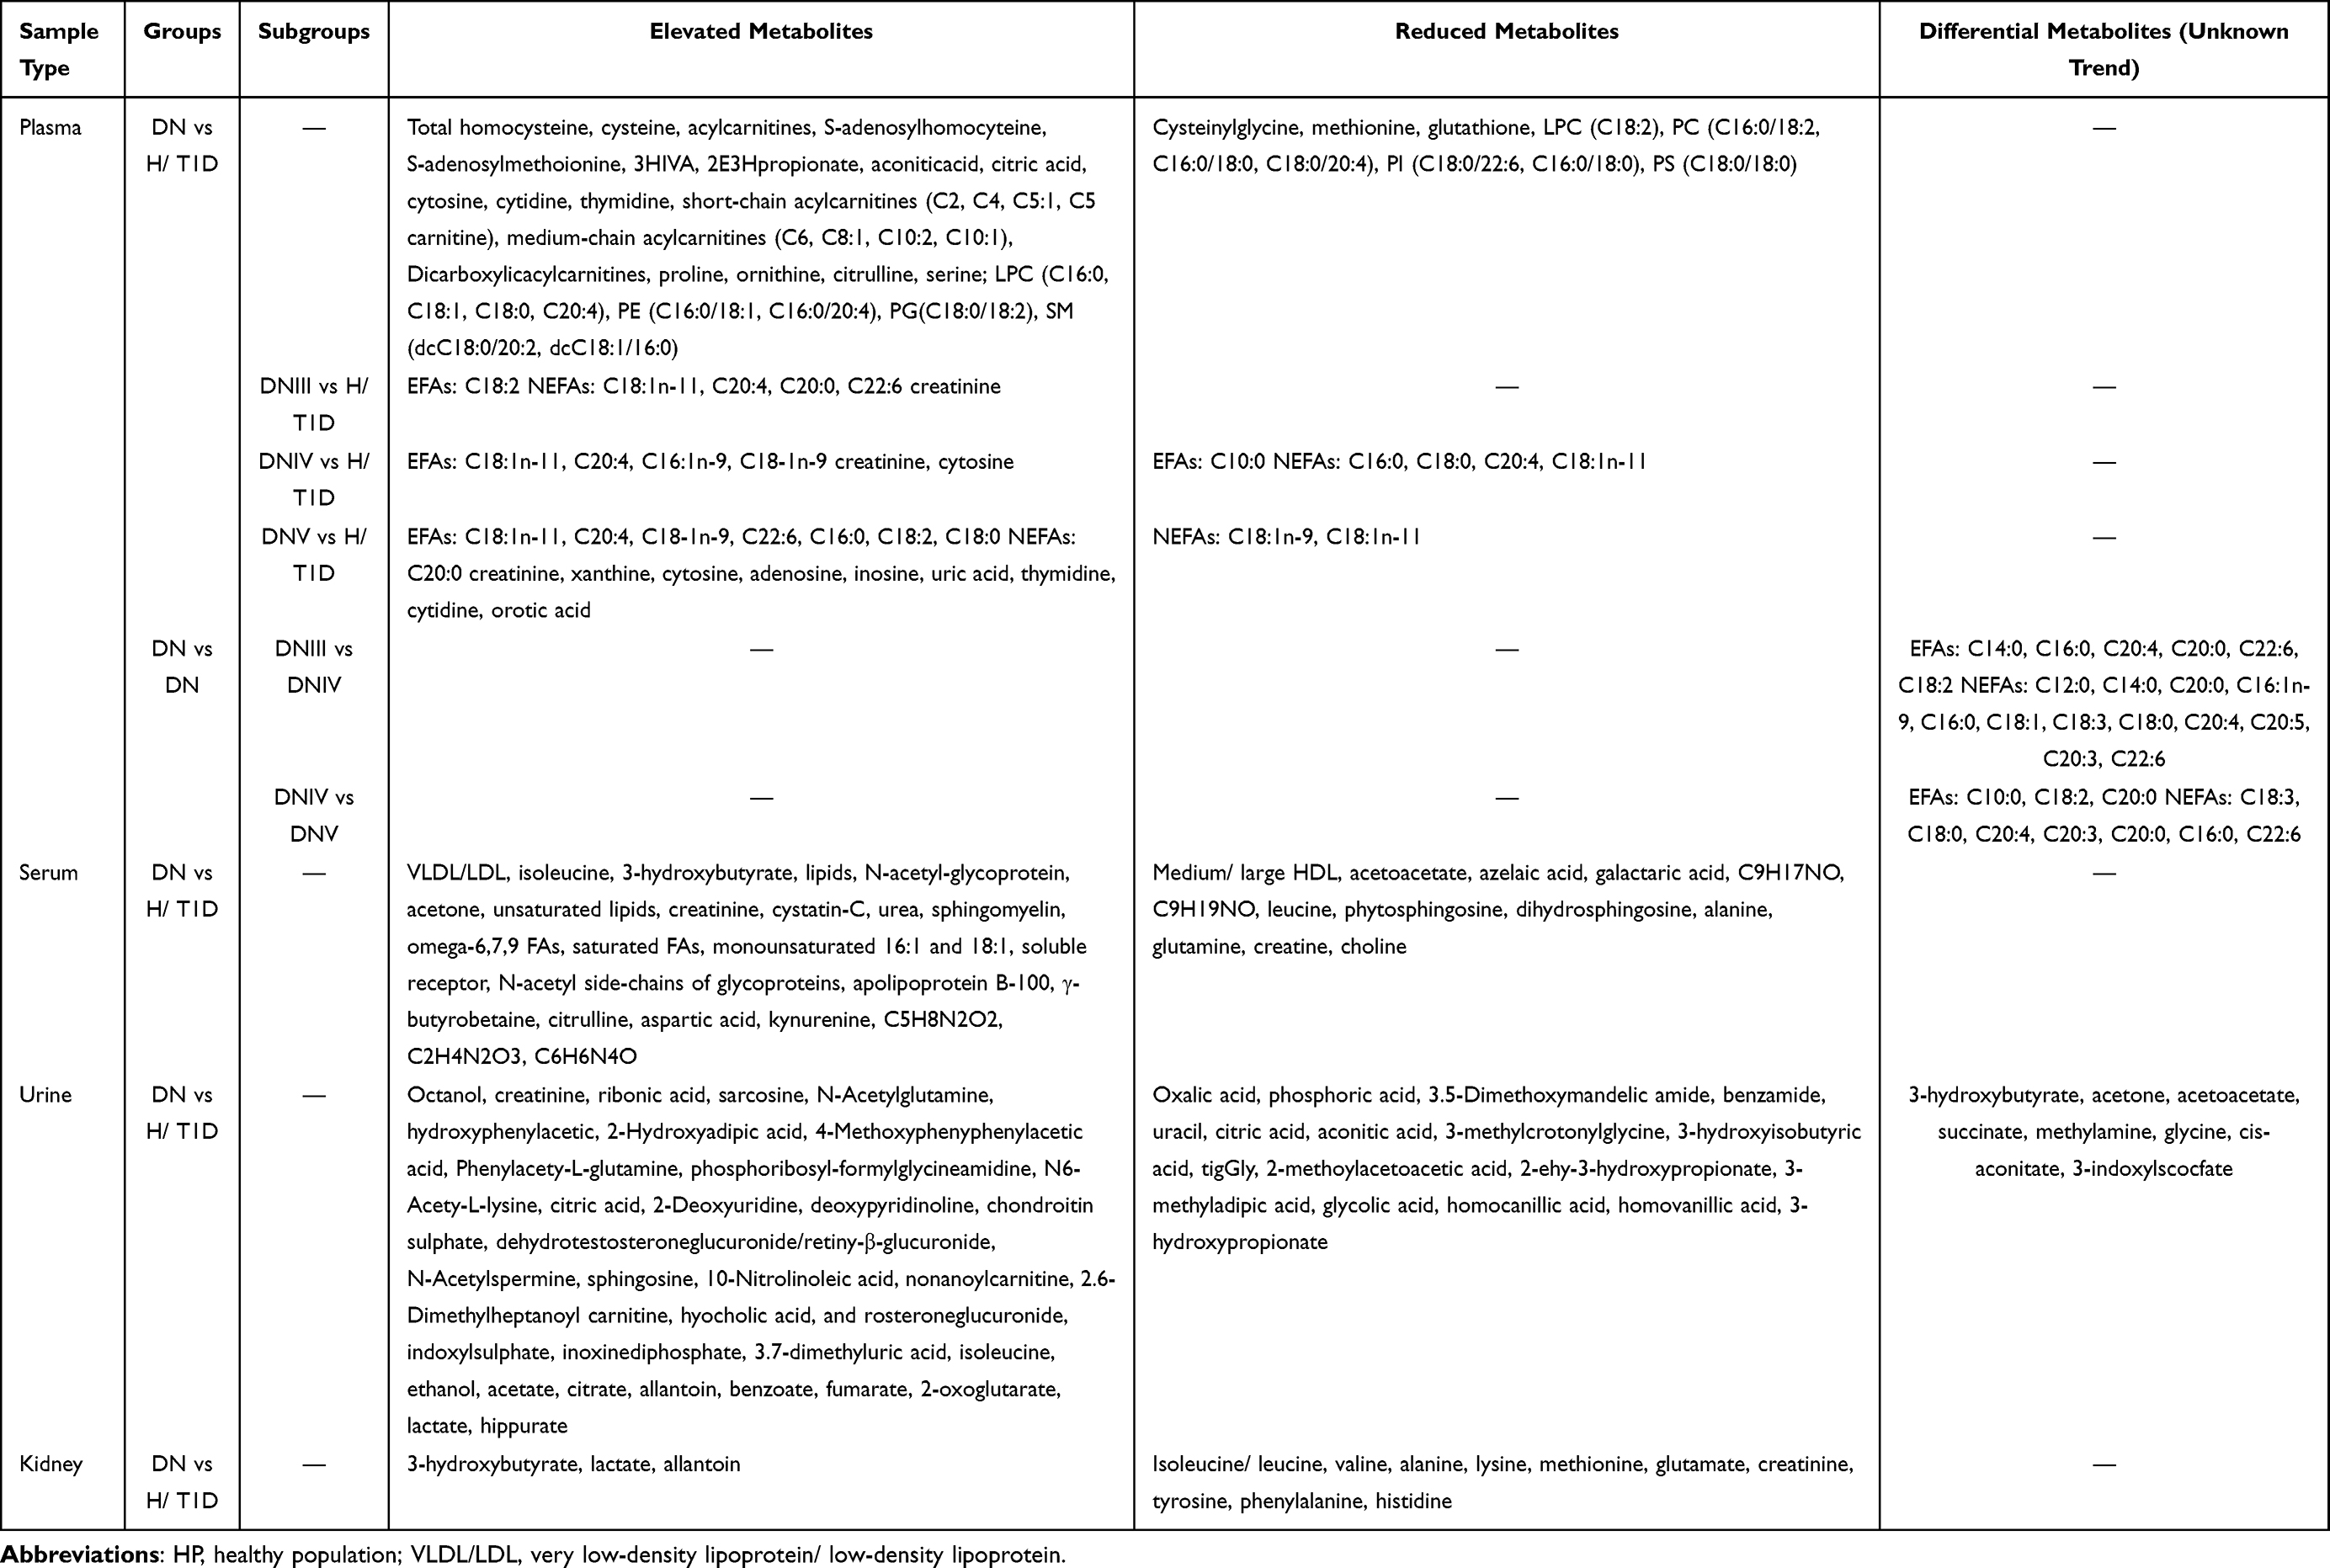 |
Table 3 Summary of Changes in Metabolites of DN |
Metabolomics and Pathogenesis of DR
DR is another common complication and is the main cause of blindness in T1D patients. The basic screening for DR is still deemed retinal fundus examination, which would miss very early functional and structural abnormalities.57 Hence, the screening of differential metabolites may play a significant role in the diagnosis of DR. However, sample collection of tissue fluid from the eyes was one of the difficulties in this study due to the invasive procedures. Hence, tears have received much attention as the analysis source for DR, which also provides a new direction for future research.16 In recent years, the exploration of biomarkers in serum and other specific fluids/tissues58,59 has been more common than metabolomics research. Research has shown that many systemic biomarkers (especially inflammatory molecules and endothelial dysfunction markers) are associated with DR, which emphasizes the significance of inflammation. Thus, more attention should be given to specific changes in the inflammatory metabolic pathway. A previous metabolomics study on DR highlighted abnormal pathways, such as tryptophan metabolites, indoleamine 2.3-dioxygenase, FFAs, and glucose metabolism.60 A significantly high level of lactate was found in DR patients, and this finding might be related to inflammation and the enhancement of anaerobic glycolysis.61 Moreover, amino acids, such as n-6 essential polyunsaturated fatty acids, were found to have a decreasing trend in many studies. The occurrence of this phenomenon is related to the pathogenesis of DR. Briefly, long-term hyperglycemia inhibits the transformation and production of amino acids in the body. This eventually leads to damage to antioxidant mechanisms in the retina, resulting in pathological changes. Therefore, on the surface, the decrease in amino acids is one of the metabolic characteristics of DR; however, the reduction in amino acids caused by hyperglycemia is the main cause of DR. It has been shown that the decrease in amino acids can be used as a predictive marker of DR. However, there were limitations in this regard because T1D patients had oxidative stress disorders in many organs. This means that the levels of some amino acids would show a downward trend in various regions, resulting in the lack of specificity. If researchers could screen out different amino acids that were different from other complications or T1D, it would be more conducive to the clinical diagnosis of DR. In addition, there are studies on the combination of traditional Chinese medicine and Western medicine for DR on the basis of metabolomics.62 Traditional Chinese medicine infers that Yang deficiency is a risk factor for DR. Thus, the study found that the metabolic changes of patients with Yang deficiency were similar to those of patients in the DR proliferation stage, which could explain why patients defined by different concepts of traditional Chinese medicine and Western medicine actually had similar metabolic characteristics. Because of this special metabolic characteristic, patients with Yang deficiency had the opportunity to develop from the nonproliferative to the proliferative phase. L-aspartic acid was the most representative of the many differential metabolites screened. In addition, tryptophan was also found to be an amino acid with large fluctuations before the onset of the disease, and the normal level of this substance is often closely related to the severity of the disease. Studies have highlighted the role of indoleamine 2,3-dioxygenase and kynurenine metabolites in DR. In fact, indoleamine 2,3-dioxygenase is closely related to the accumulation of tryptophan, and it thereby contributes to the occurrence of DR.63 In other words, the recovery of tryptophan levels was often accompanied by the remission of symptoms. Most metabolomic studies on DR mention the activation of the polyol pathway, and hyperglycemia plays a key role in the activation of this pathway. The activation of polyols leads to the accumulation of sorbitol, resulting in oxidative stress. This is followed by final functional changes in the retina. The different mechanisms of DR are shown in Figure 5. More interestingly, there was a close correlation between patients with Yang deficiency and patients with kidney deficiency. This means that patients with either DR or DN should be alert to the possibility of another complication. However, more metabolomics studies should be developed. Additionally, a combination of inflammatory factors and metabolomics changes could be performed to analyze the effect of inflammation on abnormal metabolic pathways in DR, which could provide new insights to clarify the pathogenesis of DR.
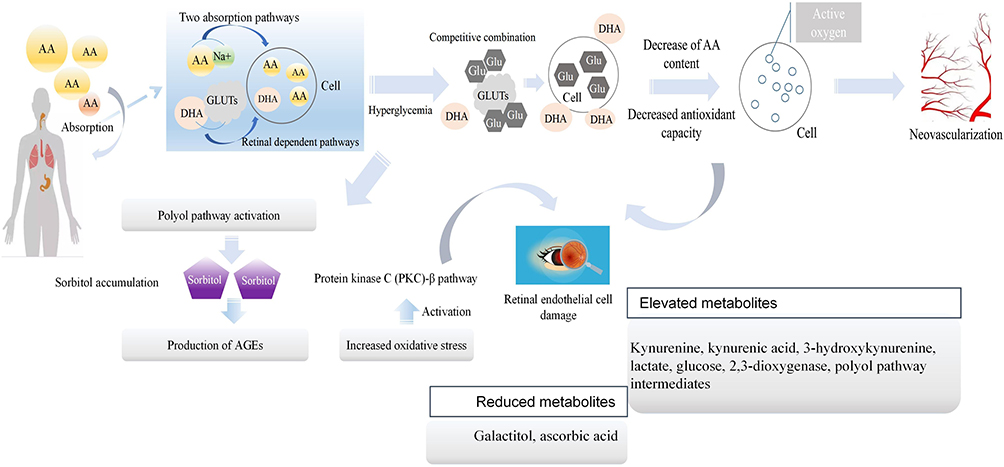 |
Figure 5 Metabolic pathways involved in the pathogenesis of DR. The purple box represented sorbitol. Abbreviations: AA, amino acid; GLUTs, glucose transporters; AGEs, advanced glycation end products. |
Metabolomics of Natural Drug Components and T1D
Based on the progress of research on multiple metabolic pathways involved in the pathogenesis of T1D, it is particularly important to explore specific drugs for these damaged metabolic pathways. Metabolomics can also provide new insights into the interpretation of drug and nutritional intervention behavior by identifying the differential metabolites caused by drugs between the treatment group and the control group.64,65 Metabolomics and drug-related research can also reveal the corresponding mechanism of the drug treatment for T1D by visualizing the metabolic pathways affected by drugs.
Traditional drugs for the treatment of diabetes include acarbose (inhibition of intestinal absorption) and gluconeogenesis (inhibition of metformin in the liver).66 In addition, some synthetic drugs can cause adverse reactions, such as gastrointestinal discomfort, weight gain, and cardiovascular risk.67–69 In recent years, natural ingredients in medicinal plants, such as carotenoids, flavonoids, terpenoids, alkaloids and glycosides, have been found to have anti-inflammatory and therapeutic effects and are used as new therapeutic targets for T1D.70,71 It was found that the levels of some metabolites (glucose, succinate, lactate, creatine, creatinine, urea and phenylacetylglycine) returned to normal after treatment with Momordica charantia. It is universally acknowledged that pyruvate is closely related to the glycolysis pathway, and the continuous high glucose environment in T1D patients will activate gluconeogenesis and reduce the level of pyruvate. This will indirectly lead to the reduction of TCA circulating substances (malic acid, fumaric acid, citric acid, succinic acid and glutaric acid, etc.) and cause the body to fall into an abnormal metabolic cycle. However, Gardenia jas minoides Ellis fruit and Rubus Suavissimus S. Lee could shift the levels of pyruvate, choline, arginine, glycerol, alanine, trimethylamine, 3-hydroxybutyric acid, n-acetylglycoprotein, succinic acid, acetone and glutamine and reduce the levels of glucose, valine, isoleucine, trimethylamine-N-oxide, glutamic acid, betaine and DMA. It would undoubtfully reduce gluconeogenesis and gradually restore the TCA cycle to normal to improve the metabolic state of T1D. In addition, more than 20 endogenous metabolites were identified with different trends after intervention with Rosmarinus officinalis, and some of the amino acids were closely related to intestinal flora that participated in T1D pathogenesis.71 Previous metabolic studies on intestinal flora have identified more than 36 metabolites related to T1D, including amino acids (leucine, valine, isoleucine, alanine, aspartic acid, etc.), energy metabolites (lactic acid, pyruvate, succinic acid, glutamine, citric acid, creatine β-glucose, α-glucose and fumaric acid) and choline metabolism (choline, o-phosphocholine and sn-glycero-3-phocholine).72 The metabolites affected by the natural drug components mentioned above have a high coincidence rate with the metabolic spectrum related to the onset of T1D. Hence, the study of emerging and effective drug components has good application prospects according to the metabolomic characteristics of T1D. The author believes that there is still a lack of natural drug metabolomics research that is needed to intervene in the metabolic state before serum transformation, which can be used as an important link in reducing the occurrence of T1D and prevention and health care.
Prospects and Conclusion
Prospects
T1D is a complex metabolic disease that involves many factors in the progression of the disease. Omics research is of great significance for the diagnosis and monitoring of disease progression due to its different metabolic changes in different stages. Additionally, the biomarkers used to predict T1D are still an important focus of research. In addition, the evaluation of the function of islet β-cells and appearance of antibodies also play an important role in the progression of T1D. Hence, determination of the differential metabolites that reflect the dynamic changes in β-cells and seroconversion should be emphasized and would benefit the monitoring and stratification of high-risk populations.73 Metabolomics technology should not only be limited to identifying healthy people and disease groups but also contribute to the detailed evaluation of different stages of disease. Moreover, some studies have proven that metabolic changes such as oxidative stress and inflammation occur in patients with T1D before islet autoimmunity. Therefore, more in-depth research should be performed at the cellular level. Analyses such as the metabolomics of immune cells may find unexpected surprises in revealing the underlying mechanisms of T1D. In addition to the current achievements and future prospects in the field of biomarkers, statistical modeling also contributes to the development of diagnoses options for T1D. For example, many researchers choose to establish diagnosis models and receiver operating characteristic curves to verify the efficiency of selected metabolites, which could provide practical application value for clinicians. Moreover, a study on a prediction model showed that two models of beta-cell loss (degenerative and protective competing immune pathways) were established to predict the occurrence of T1D.27,74 In addition, whether the combined diagnosis of oxidative stress markers or inflammatory markers and metabolites plays a better role in predicting the occurrence of T1D and its complications is also one of the directions that need to be explored in the future. The combination of clinical experiments and statistics will introduce new possibilities for the clinical application of metabolomics. Another newly proposed point of view is the effect of intestinal microbial metabolites on disease progression. The Blautia, Rikenellaceae, Ruminococcus and Streptococcus are highly correlated with the lipidome, and the metabolites of these microorganisms are different between patients with T1D and those with only seroconversion but not progression to T1D.75 Choline and succinic acid are metabolites produced by intestinal microorganisms.76 Changes in the diet and gastrointestinal microbiota of women during pregnancy have a certain impact on the levels of choline and other metabolites in newborns. This can affect the immune system and lead to changes in the systemic energy metabolism of offspring. A reference was also provided for future research on maternal health care and the prevention of neonatal diseases. Moreover, from the perspective of nutrition, the composition of a variety of nutrients in food may have an impact on metabolic pathways. Therefore, exploring the effects of the balance and combination of different nutrients on the metabolic phenotype of T1D before seroconversion and in offspring is conducive to preventing and delaying the progression of T1D.
Conclusion
The development of T1D is a long continuous process, and the period of serum transformation is key to this process. In the diabetes model, carbohydrate, TCA cycle, lipid, purine and amino acid metabolism are considered to be important metabolic pathways. The specific metabolic characteristics of amino acids, such as aspartate, alanine and glutamate, and the downregulation of most lipid pathways existed before serum transformation. Ascorbic acid and other substances that inhibit insulin production decrease before serum transformation, indicating a protective mechanism of the body. Therefore, the convergence of the two opposite metabolic states of promoting disease development and the self-protection regulation before serum transformation affects the development and outcomes of T1D. Moreover, there are significant differences in the concentration of metabolites, such as methionine, that correspond to serum transformation at different ages. Some metabolites, such as tryptophan derivatives (such as 3-indoleacetic acid), LPC, BCAAs and other substances, show different trends from 3 months to 36 months. This means there is an age-related risk of onset and prognostic characteristics of onset at different ages (children with metabolic changes in the early years have a worse prognosis in the later stage). In addition, the complex mechanisms involved in the occurrence and development of T1D complications have been widely explored in metabolomics. Purine metabolism, oxidative stress metabolism and the inflammatory response pathway were upregulated in DN. Some metabolites related to renal injury, such as citrate, fumarate and hippurate, were upregulated in urine. The combination of metabolomic research and the clinical diagnosis of renal injury indices, such as eGFR, is conducive to the improvement of DN diagnosis. Moreover, there is a certain correlation between DN and DR, which provides important guidance for the prevention and joint diagnosis of clinical complications. Based on the above results, the findings in the field of combined therapy show that altered metabolic pathways (such as glycolysis or lipid metabolism) can be improved by natural drug components. Although natural pharmaceutical ingredients cannot return all metabolite levels to normal, they have a significant impact on some altered metabolic pathways, such as metabolites involved in the TCA cycle. Therefore, metabolomics is helpful to study the influence of medicinal plants on metabolism and explore new drugs for T1D treatment. The concise diagram of T1D progression provided in this review is shown in Figure 6. Metabolomics has made considerable contributions to the prevention, diagnosis and treatment of T1D, hence, with the further development of omics technology, high-throughput methods which could reflect the pre-onset and progressive state of the disease are expected to be applied in clinic in the future, and benefit the identification of potential therapeutic targets through the combination of impaired metabolic pathways and differential metabolites.
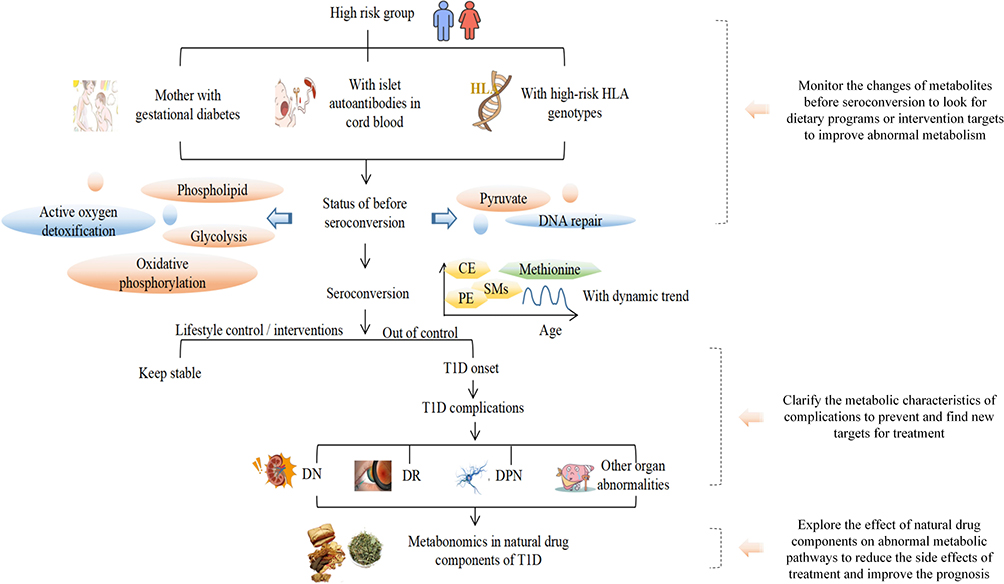 |
Figure 6 The diagram on the T1D progress in metabolomics. |
Author Contributions
All authors made a significant contribution to the work reported, whether that is in the conception, study design, execution, acquisition of data, analysis and interpretation, or in all these areas; took part in drafting, revising or critically reviewing the article; gave final approval of the version to be published; have agreed on the journal to which the article has been submitted; and agree to be accountable for all aspects of the work.
Funding
This work was supported by grants from the First Hospital Translational Funding for Scientific & Technological Achievements (no. CGZHYD202012-005 to Dr. Jiancheng Xu).
Disclosure
The authors have no conflicts of interest.
References
1. Arneth B, Arneth R, Shams M. Metabolomics of Type 1 and Type 2 diabetes. IJMS. 2019;20(10):2467. doi:10.3390/ijms20102467
2. Murfitt SA, Zaccone P, Wang X, et al. Metabolomics and lipidomics study of mouse models of Type 1 diabetes highlights divergent metabolism in purine and tryptophan metabolism prior to disease onset. J Proteome Res. 2018;17(3):946–960. doi:10.1021/acs.jproteome.7b00489
3. Yi L, Swensen AC, Qian WJ. Serum biomarkers for diagnosis and prediction of type 1 diabetes. Transl Res. 2018;201:13–25. doi:10.1016/j.trsl.2018.07.009
4. Kobos E, Imiela J. Factors affecting the level of burden of caregivers of children with type 1 diabetes. Appl Nurs Res. 2015;28(2):142–149. doi:10.1016/j.apnr.2014.09.008
5. Chen M, Zheng H, Xu M, et al. Changes in hepatic metabolic profile during the evolution of STZ-induced diabetic rats via an 1H NMR-based metabonomic investigation. Biosci Rep. 2019;39(4):BSR20181379. doi:10.1042/BSR20181379
6. Jiang Q, Xu H, Yan J, et al. Sex-specific metabolic alterations in the type 1 diabetic brain of mice revealed by an integrated method of metabolomics and mixed-model. Comput Struct Biotechnol J. 2020;18:2063–2074. doi:10.1016/j.csbj.2020.07.019
7. Mathew AV, Jaiswal M, Ang L, Michailidis G, Pennathur S, Pop-Busui R. Impaired amino acid and TCA metabolism and cardiovascular autonomic neuropathy progression in Type 1 diabetes. Diabetes. 2019;68(10):2035–2044. doi:10.2337/db19-0145
8. Wang H, Zhou Q, Wan L, et al. Lipidomic analysis of meibomian glands from type-1 diabetes mouse model and preliminary studies of potential mechanism. Exp Eye Res. 2021;210:108710. doi:10.1016/j.exer.2021.108710
9. Liu J, Wang C, Liu F, Lu Y, Cheng J. Metabonomics revealed xanthine oxidase-induced oxidative stress and inflammation in the pathogenesis of diabetic nephropathy. Anal Bioanal Chem. 2015;407(9):2569–2579. doi:10.1007/s00216-015-8481-0
10. Orešič M, Simell S, Sysi-Aho M, et al. Dysregulation of lipid and amino acid metabolism precedes islet autoimmunity in children who later progress to type 1 diabetes. J Exp Med. 2008;205(13):2975–2984. doi:10.1084/jem.20081800
11. Lamichhane S, Ahonen L, Dyrlund TS, et al. Cord-blood lipidome in progression to islet autoimmunity and Type 1 diabetes. Biomolecules. 2019;9(1):33. doi:10.3390/biom9010033
12. Balzano-Nogueira L, Ramirez R, Zamkovaya T, et al. Integrative analyses of TEDDY Omics data reveal lipid metabolism abnormalities, increased intracellular ROS and heightened inflammation prior to autoimmunity for type 1 diabetes. Genome Biol. 2021;22(1):39. doi:10.1186/s13059-021-02262-w
13. Bujak R, Struck-Lewicka W, Markuszewski MJ, Kaliszan R. Metabolomics for laboratory diagnostics. J Pharm Biomed Anal. 2015;113:108–120. doi:10.1016/j.jpba.2014.12.017
14. Roberts LD, McCombie G, Titman CM, Griffin JL. A matter of fat: an introduction to lipidomic profiling methods. J Chromatography B. 2008;871(2):174–181. doi:10.1016/j.jchromb.2008.04.002
15. Bervoets L, Massa G, Guedens W, Louis E, Noben JP, Adriaensens P. Metabolic profiling of type 1 diabetes mellitus in children and adolescents: a case–control study. Diabetol Metab Syndr. 2017;9(1):48. doi:10.1186/s13098-017-0246-9
16. Marcovecchio ML. Importance of identifying novel biomarkers of microvascular damage in Type 1 diabetes. Mol Diagn Ther. 2020;24(5):507–515. doi:10.1007/s40291-020-00483-6
17. Frohnert BI, Rewers MJ. Metabolomics in childhood diabetes: metabolomics in childhood diabetes. Pediatr Diabetes. 2016;17(1):3–14. doi:10.1111/pedi.12323
18. Wiklund S, Johansson E, Sjöström L, et al. Visualization of GC/TOF-MS-based metabolomics data for identification of biochemically interesting compounds using OPLS class models. Anal Chem. 2008;80(1):115–122. doi:10.1021/ac0713510
19. Knip M. Environmental triggers and determinants of beta-cell autoimmunity and Type 1 diabetes. Rev Endocr Metab Disord. 2003;4:213–223.
20. Wilson C. A lipidomic profile for the prediction of type 1 diabetes mellitus. Nat Rev Endocrinol. 2013;9(7):378. doi:10.1038/nrendo.2013.101
21. Hagopian WA, Lernmark A, Rewers MJ, et al. TEDDY-the environmental determinants of diabetes in the young: an observational clinical trial. Ann N Y Acad Sci. 2006;1079(1):320–326. doi:10.1196/annals.1375.049
22. Norris JM, Yin X, Lamb MM, et al. Omega-3 polyunsaturated fatty acid intake and islet autoimmunity in children at increased risk for Type 1 diabetes. JAMA. 2007;298(12):1420. doi:10.1001/jama.298.12.1420
23. Stene LC, Joner G; Norwegian Childhood Diabetes Study Group. Use of cod liver oil during the first year of life is associated with lower risk of childhood-onset type 1 diabetes: a large, population-based, case-control study. Am J Clin Nutr. 2003;78(6):1128–1134. doi:10.1093/ajcn/78.6.1128
24. Oresic M. Metabolomics in the studies of islet autoimmunity and Type 1 diabetes. Rev Diabet Stud. 2012;9(4):236–247. doi:10.1900/RDS.2012.9.236
25. Zhang Y, Kobayashi H, Mawatari K, et al. Effects of branched-chain amino acid supplementation on plasma concentrations of free amino acids, insulin, and energy substrates in young men. J Nutr Sci Vitaminol. 2011;57(1):114–117. doi:10.3177/jnsv.57.114
26. Li Q, Liu X, Yang J, et al. Plasma metabolome and circulating vitamins stratified onset age of an initial islet autoantibody and progression to Type 1 diabetes: the TEDDY Study. Diabetes. 2021;70(1):282–292. doi:10.2337/db20-0696
27. Overgaard AJ, Weir JM, De Souza DP, et al. Lipidomic and metabolomic characterization of a genetically modified mouse model of the early stages of human type 1 diabetes pathogenesis. Metabolomics. 2016;12(1):13. doi:10.1007/s11306-015-0889-1
28. Miller MR, Yin X, Seifert J, et al. Erythrocyte membrane omega-3 fatty acid levels and omega-3 fatty acid intake are not associated with conversion to type 1 diabetes in children with islet autoimmunity: the Diabetes Autoimmunity Study in the Young (DAISY). Pediatr Diabetes. 2011;12(8):669–675. doi:10.1111/j.1399-5448.2011.00760.x
29. Lamichhane S, Kemppainen E, Trošt K, et al. Circulating metabolites in progression to islet autoimmunity and type 1 diabetes. Diabetologia. 2019;62(12):2287–2297. doi:10.1007/s00125-019-04980-0
30. Mattila M, Erlund I, Lee H-S, et al. Plasma ascorbic acid and the risk of islet autoimmunity and type 1 diabetes: the TEDDY study. Diabetologia. 2020;63(2):278–286. doi:10.1007/s00125-019-05028-z
31. Behrens WA, Madere R. Vitamin C and vitamin E status in the spontaneously diabetic BB rat before the onset of diabetes. Metabolism. 1991;40(1):72–76. doi:10.1016/0026-0495(91)90195-3
32. Tapia G, Suvitaival T, Ahonen L, et al. Prediction of Type 1 diabetes at birth: cord blood metabolites vs genetic risk score in the Norwegian mother, father, and child cohort. J Clin Endocrinol Metab. 2021;106(10):e4062–e4071. doi:10.1210/clinem/dgab400
33. Korte SM, Koolhaas JM, Wingfield JC, McEwen BS. The Darwinian concept of stress: benefits of allostasis and costs of allostatic load and the trade-offs in health and disease. Neurosci Biobehav Rev. 2005;29(1):3–38. doi:10.1016/j.neubiorev.2004.08.009
34. Krischer JP, Lynch KF, Schatz DA, et al. The 6 year incidence of diabetes-associated autoantibodies in genetically at-risk children: the TEDDY study. Diabetologia. 2015;58(5):980–987. doi:10.1007/s00125-015-3514-y
35. Pflueger M, Seppänen-Laakso T, Suortti T, et al. Age- and islet autoimmunity–associated differences in amino acid and lipid metabolites in children at risk for Type 1 diabetes. Diabetes. 2011;60(11):2740–2747. doi:10.2337/db10-1652
36. La Torre D, Seppanen-Laakso T, Larsson HE, et al. Decreased cord-blood phospholipids in young age-at-onset Type 1 diabetes. Diabetes. 2013;62(11):3951–3956. doi:10.2337/db13-0215
37. Lamichhane S, Ahonen L, Dyrlund TS, et al. Dynamics of plasma lipidome in progression to islet autoimmunity and Type 1 diabetes – type 1 diabetes prediction and prevention study (DIPP). Sci Rep. 2018;8(1):10635. doi:10.1038/s41598-018-28907-8
38. Sorensen CM, Ding J, Zhang Q, et al. Perturbations in the lipid profile of individuals with newly diagnosed type 1 diabetes mellitus: lipidomics analysis of a diabetes antibody standardization program sample subset. Clin Biochem. 2010;43(12):948–956. doi:10.1016/j.clinbiochem.2010.04.075
39. Beyersdorf N, Müller N. Sphingomyelin breakdown in T cells: role in activation, effector functions and immunoregulation. Biol Chem. 2015;396(6–7):749–758. doi:10.1515/hsz-2014-0282
40. la Marca G, Malvagia S, Toni S, Piccini B, Di Ciommo V, Bottazzo GF. Children who develop type 1 diabetes early in life show low levels of carnitine and amino acids at birth: does this finding shed light on the etiopathogenesis of the disease? Nutr Diabetes. 2013;3(10):e94–e94. doi:10.1038/nutd.2013.33
41. Colombo M, Valo E, McGurnaghan SJ, et al. Biomarker panels associated with progression of renal disease in type 1 diabetes. Diabetologia. 2019;62(9):1616–1627. doi:10.1007/s00125-019-4915-0
42. Mediani A, Abas F, Maulidiani M, et al. Metabolic and biochemical changes in streptozotocin induced obese-diabetic rats treated with Phyllanthus niruri extract. J Pharm Biomed Anal. 2016;128:302–312. doi:10.1016/j.jpba.2016.06.003
43. Tofte N, Suvitaival T, Ahonen L, et al. Lipidomic analysis reveals sphingomyelin and phosphatidylcholine species associated with renal impairment and all-cause mortality in type 1 diabetes. Sci Rep. 2019;9(1):16398. doi:10.1038/s41598-019-52916-w
44. Hirayama A, Nakashima E, Sugimoto M, et al. Metabolic profiling reveals new serum biomarkers for differentiating diabetic nephropathy. Anal Bioanal Chem. 2012;404(10):3101–3109. doi:10.1007/s00216-012-6412-x
45. Zhao L, Gao H, Lian F, Liu X, Zhao Y, Lin D. 1H-NMR-based metabonomic analysis of metabolic profiling in diabetic nephropathy rats induced by streptozotocin. Am J Physiol-Renal Physiol. 2011;300(4):F947–F956. doi:10.1152/ajprenal.00551.2010
46. Tabak O, Gelisgen R, Erman H, et al. Oxidative lipid, protein, and DNA damage as oxidative stress markers in vascular complications of diabetes mellitus. CIM. 2011;34(3):163. doi:10.25011/cim.v34i3.15189
47. Liu J, Wang D, Chen Y, et al. 1H NMR-based metabonomic analysis of serum and urine in a nonhuman primate model of diabetic nephropathy. Mol BioSyst. 2013;9(11):2645. doi:10.1039/c3mb70212j
48. Anello M, Ucciardello V, Piro S, et al. Chronic exposure to high leucine impairs glucose-induced insulin release by lowering the ATP-to-ADP ratio. Am J Physiol-Endocrinol Metab. 2001;281(5):E1082–E1087. doi:10.1152/ajpendo.2001.281.5.E1082
49. Wijekoon EP, Skinner C, Brosnan ME, Brosnan JT. Amino acid metabolism in the Zucker diabetic fatty rat: effects of insulin resistance and of type 2 diabetes. Can J Physiol Pharmacol. 2004;82(7):506–514. doi:10.1139/y04-067
50. Zhang J, Yan L, Chen W, et al. Metabonomics research of diabetic nephropathy and type 2 diabetes mellitus based on UPLC–oaTOF-MS system. Anal Chim Acta. 2009;650(1):16–22. doi:10.1016/j.aca.2009.02.027
51. Salek RM, Maguire ML, Bentley E, et al. A metabolomic comparison of urinary changes in type 2 diabetes in mouse, rat, and human. Physiol Genomics. 2007;29(2):99–108. doi:10.1152/physiolgenomics.00194.2006
52. Wei T, Zhao L, Jia J, et al. Metabonomic analysis of potential biomarkers and drug targets involved in diabetic nephropathy mice. Sci Rep. 2015;5(1):11998. doi:10.1038/srep11998
53. Prabhu KS, Arner RJ, Vunta H, Reddy CC. Up-regulation of human myo-inositol oxygenase by hyperosmotic stress in renal proximal tubular epithelial cells. J Biol Chem. 2005;280(20):19895–19901. doi:10.1074/jbc.M502621200
54. Han LD, Xia JF, Liang QL, et al. Plasma esterified and non-esterified fatty acids metabolic profiling using gas chromatography–mass spectrometry and its application in the study of diabetic mellitus and diabetic nephropathy. Anal Chim Acta. 2011;689(1):85–91. doi:10.1016/j.aca.2011.01.034
55. Pena MJ, Lambers Heerspink HJ, Hellemons ME, et al. Urine and plasma metabolites predict the development of diabetic nephropathy in individuals with Type 2 diabetes mellitus. Diabet Med. 2014;31(9):1138–1147. doi:10.1111/dme.12447
56. Tolonen N, Forsblom C, Thorn L, et al. Lipid abnormalities predict progression of renal disease in patients with type 1 diabetes. Diabetologia. 2009;52(12):2522–2530. doi:10.1007/s00125-009-1541-2
57. American Diabetes Association. Addendum 10. Cardiovascular disease and risk management: standards of medical care in diabetes—2020. Dia Care. 2020;43(Supplement 1):S111–S134. doi:10.2337/dc20-S010
58. Ting DSW, Tan KA, Phua V, Tan GSW, Wong CW, Wong TY. Biomarkers of diabetic retinopathy. Curr Diab Rep. 2016;16(12):125. doi:10.1007/s11892-016-0812-9
59. Kwan CC, Fawzi AA. Imaging and biomarkers in diabetic macular edema and diabetic retinopathy. Curr Diab Rep. 2019;19(10):95. doi:10.1007/s11892-019-1226-2
60. Wu T, Qiao S, Shi C, Wang S, Ji G. Metabolomics window into diabetic complications. J Diabetes Investig. 2018;9(2):244–255. doi:10.1111/jdi.12723
61. Barba I, Garcia-Ramírez M, Hernández C, et al. Metabolic fingerprints of proliferative diabetic retinopathy: an 1H-NMR–based metabonomic approach using vitreous humor. Invest Ophthalmol Vis Sci. 2010;51(9):4416. doi:10.1167/iovs.10-5348
62. Li X, Luo X, Lu X, Duan J, Xu G. Metabolomics study of diabetic retinopathy using gas chromatography–mass spectrometry: a comparison of stages and subtypes diagnosed by Western and Chinese medicine. Mol BioSyst. 2011;7(7):2228. doi:10.1039/c0mb00341g
63. Munipally PK, Agraharm SG, Valavala VK, Gundae S, Turlapati NR. Evaluation of indoleamine 2,3-dioxygenase expression and kynurenine pathway metabolites levels in serum samples of diabetic retinopathy patients. Arch Physiol Biochem. 2011;117(5):254–258. doi:10.3109/13813455.2011.623705
64. Hasanpour M, Iranshahy M, Iranshahi M. The application of metabolomics in investigating anti-diabetic activity of medicinal plants. Biomed Pharmacother. 2020;128:110263. doi:10.1016/j.biopha.2020.110263
65. Kaddurah-Daouk R, Weinshilboum R. Metabolomic signatures for drug response phenotypes: pharmacometabolomics enables precision medicine. Clin Pharmacol Ther. 2015;98(1):71–75. doi:10.1002/cpt.134
66. Hundal RS, Krssak M, Dufour S, et al. Mechanism by which metformin reduces glucose production in type 2 diabetes. Diabetes. 2000;49(12):2063–2069. doi:10.2337/diabetes.49.12.2063
67. Thulé PM, Umpierrez G. Sulfonylureas: a new look at old therapy. Curr Diab Rep. 2014;14(4):473. doi:10.1007/s11892-014-0473-5
68. Ahmadian M, Suh JM, Hah N, et al. PPARγ signaling and metabolism: the good, the bad and the future. Nat Med. 2013;19(5):557–566. doi:10.1038/nm.3159
69. Gerstein HC, Miller ME, Byington RP, Effects of intensive glucose lowering in Type 2 diabetes. N Engl J Med. 2008;358(24):2545–2559. doi:10.1056/NEJMoa0802743
70. Shen X-L, Liu H, Xiang H, Qin X-M, Du G-H, Tian J-S. Combining biochemical with 1 H NMR-based metabolomics approach unravels the antidiabetic activity of genipin and its possible mechanism. J Pharm Biomed Anal. 2016;129:80–89. doi:10.1016/j.jpba.2016.06.041
71. Godzien J, Ciborowski M, Angulo S, et al. Metabolomic approach with LC-QTOF to study the effect of a nutraceutical treatment on urine of diabetic rats. J Proteome Res. 2011;10(2):837–844. doi:10.1021/pr100993x
72. Dedrick S, Sundaresh B, Huang Q, et al. The role of gut microbiota and environmental factors in Type 1 diabetes pathogenesis. Front Endocrinol. 2020;11:78. doi:10.3389/fendo.2020.00078
73. Sen P, Dickens AM, López-Bascón MA, et al. Metabolic alterations in immune cells associate with progression to type 1 diabetes. Diabetologia. 2020;63(5):1017–1031. doi:10.1007/s00125-020-05107-6
74. Marinković T, Sysi-Aho M, Orešič M. Integrated model of metabolism and autoimmune response in β-cell death and progression to Type 1 diabetes. PLoS One. 2012;7(12):e51909. doi:10.1371/journal.pone.0051909
75. Chow J, Mazmanian SK. Getting the bugs out of the immune system: do bacterial microbiota “Fix” intestinal T cell responses? Cell Host Microbe. 2009;5(1):8–12. doi:10.1016/j.chom.2008.12.006
76. Dumas ME, Barton RH, Toye A, et al. Metabolic profiling reveals a contribution of gut microbiota to fatty liver phenotype in insulin-resistant mice. Proc Nat Acad Sci. 2006;103(33):12511–12516. doi:10.1073/pnas.0601056103
 © 2022 The Author(s). This work is published and licensed by Dove Medical Press Limited. The full terms of this license are available at https://www.dovepress.com/terms.php and incorporate the Creative Commons Attribution - Non Commercial (unported, v3.0) License.
By accessing the work you hereby accept the Terms. Non-commercial uses of the work are permitted without any further permission from Dove Medical Press Limited, provided the work is properly attributed. For permission for commercial use of this work, please see paragraphs 4.2 and 5 of our Terms.
© 2022 The Author(s). This work is published and licensed by Dove Medical Press Limited. The full terms of this license are available at https://www.dovepress.com/terms.php and incorporate the Creative Commons Attribution - Non Commercial (unported, v3.0) License.
By accessing the work you hereby accept the Terms. Non-commercial uses of the work are permitted without any further permission from Dove Medical Press Limited, provided the work is properly attributed. For permission for commercial use of this work, please see paragraphs 4.2 and 5 of our Terms.