")
Back to Journals » Journal of Inflammation Research » Volume 14
A Comparison Between 1 Day versus 7 Days of Sepsis in Mice with the Experiments on LPS-Activated Macrophages Support the Use of Intravenous Immunoglobulin for Sepsis Attenuation
Authors Makjaroen J, Thim-Uam A , Dang CP, Pisitkun T, Somparn P, Leelahavanichkul A
Received 16 September 2021
Accepted for publication 11 December 2021
Published 22 December 2021 Volume 2021:14 Pages 7243—7263
DOI https://doi.org/10.2147/JIR.S338383
Checked for plagiarism Yes
Review by Single anonymous peer review
Peer reviewer comments 3
Editor who approved publication: Professor Ning Quan
Jiradej Makjaroen,1 Arthid Thim-Uam,2 Cong Phi Dang,3 Trairak Pisitkun,1 Poorichaya Somparn,1,4 Asada Leelahavanichkul4– 6
1Center of Excellence in Systems Biology, Faculty of Medicine, Chulalongkorn University, Bangkok, Thailand; 2Division of Biochemistry, School of Medical Sciences, University of Phayao, Phayao, Thailand; 3Medical Microbiology, Interdisciplinary and International Program, Graduate School, Chulalongkorn University, Bangkok, Thailand; 4Translational Research in Inflammation and Immunology Research Unit (TRIRU), Department of Microbiology, Chulalongkorn University, Bangkok, Thailand; 5Immunology Unit, Department of Microbiology, Faculty of Medicine, Chulalongkorn University, Bangkok, Thailand; 6Division of Nephrology, Department of Medicine, Faculty of Medicine, Chulalongkorn University, Bangkok, Thailand
Correspondence: Asada Leelahavanichkul; Poorichaya Somparn
Immunology Unit, Department of Microbiology, Faculty of Medicine, Chulalongkorn University, Bangkok, 10330, Thailand
Tel +666 2256 4132
Email [email protected]
Background: Because survival and death after sepsis are partly due to a proper immune adaptation and immune dysregulation, respectively, survivors and moribund mice after cecal ligation and puncture (CLP) sepsis surgery and in vitro macrophage experiments were explored.
Methods: Characteristics of mice at 1-day and 7-days post-CLP, the representative of moribund mice (an innate immune hyper-responsiveness) and survivors (a successful control on innate immunity), respectively. In parallel, soluble heat aggregated immunoglobulin (sHA-Ig), a representative of immune complex, was tested in lipopolysaccharide (LPS)-activated macrophages together with a test of intravenous immunoglobulin (IVIG), a molecule of adaptive immunity, on CLP sepsis mice.
Results: Except for a slight increase in alanine transaminase (liver injury), IL-10, endotoxemia, and gut leakage (FITC-dextran assay), most of the parameters in survivors (7-days post-CLP) were normalized, with enhanced adaptive immunity, including serum immunoglobulin (using serum protein electrophoresis) and activated immune cells in spleens (flow cytometry analysis). The addition of sHA-Ig in LPS-activated macrophages reduced supernatant cytokines, cell energy (extracellular flux analysis), reactive oxygen species (ROS), several cell activities (proteomic analysis), and Fc gamma receptors (FcgRs) expression. The loss of anti-inflammatory effect of sHA-Ig in LPS-activated macrophages from mice with a deficiency on Fc gamma receptor IIb (FcgRIIb-/-), the only inhibitory signaling of FcgRs family, when compared with wild-type macrophages, implying the FcgRIIb-dependent mechanism. Moreover, IVIG attenuated sepsis severity in CLP mice as evaluated by serum creatinine, liver enzyme (alanine transaminase), serum cytokines, spleen apoptosis, and abundance of dendritic cells in the spleen (24-h post-CLP) and survival analysis.
Conclusion: Immunoglobulin attenuated LPS-activated macrophages, partly, through the reduced cell energy of macrophages and might play a role in sepsis immune hyper-responsiveness. Despite the debate over IVIG’s use in sepsis, IVIG might be beneficial in sepsis with certain conditions.
Keywords: sepsis, CLP, proteomics, IVIG
Introduction
Sepsis, a syndrome of organ failure caused by a disruption in the host’s response to a systemic infection, is a leading cause of death in individuals with clinically serious conditions and has been identified as a major global healthcare issue.1 Anti-inflammation is an attractive supplementary treatment for sepsis, especially during the pro-inflammatory state.1 As such, the imbalance of pro- and anti-inflammatory immune responses leads to multi-organ failure, which is one of the major causes of death in sepsis.2–4 Additionally, substantial data suggests that sepsis pathophysiology is primarily caused by vigorous innate immune responses, particularly macrophages.5 Accordingly, macrophages are heterogeneous immune cells with pleiotropic functions, including pro- and anti-inflammatory properties6,7 and the harness of macrophage functions into a proper direction (immunoadjuvant or immunosuppression alleviation) for the specific individual condition might be beneficial.8 Although macrophage pro-inflammatory responses during sepsis hyper-inflammatory state are too profound, the well-controlled responses during sepsis recovery in patients who have survived sepsis might be due to a proper immune adjustment.9 In sepsis, innate immunity causes hyper-inflammation for initial organism control, but adaptive immunity slows down the overwhelming innate immune responses with more effective antibody-mediated microbial eradication,10 implying that adaptive immunity plays a role in controlling the sepsis-induced over-responsiveness of innate immunity.11 Because adaptive immune responses develop later than innate responses in sepsis, exploration of adaptive and innate immunity in sepsis has to be performed in moribund mice and sepsis survivors, respectively. Indeed, one of the responsible factors to determine the outcomes of sepsis, survivors versus deceased mice, might be a function of adaptive immunity to control sepsis-induced innate hyper-immune responses in an appropriate immune adaptation versus an inappropriate (or less effective) immune adjustment, respectively.
Hence, an exploration of immune responses of the sepsis survivors or the late phase of sepsis might provide an effective pattern of the control of innate immune responses by adaptive immunity. We hypothesize that induction of adaptive immune responses in a proper direction might be one of the interesting strategies to control sepsis hyper-inflammatory responses. Subsequently, cecal ligation and puncture (CLP) sepsis mice at 1-day and 7-days post-surgery were explored as the representatives of sepsis with predominant innate immune responses and adaptive immune activation, respectively, followed by in vitro experiments on the activated macrophages, including cell energy (extracellular flux determination) and proteomic analysis. Furthermore, the control of sepsis innate immunity by induction of adaptive immunity using intravenous immunoglobulin (IVIG) administration in CLP mice was also performed as a proof-of-concept experiment.
Materials and Methods
Animals and Animal Model
The Institutional Animal Care and Use Committee of the Faculty of Medicine, Chulalongkorn University, Bangkok, Thailand, certified the animal care and use procedure (SST 012/2563) in accordance with the US National Institutes of Health guidelines. The 8-week-old male C57BL/6 mice (purchased from the National Laboratory Animal Center, Nakhon Pathom, Thailand) had free access to water and chow before and after surgery. Additionally, Fc gamma receptor IIb-deficient (FcgRIIb-/-) mice on a C57BL/6 background were provided by Dr Silvia Bolland (NIAID, NIH, Maryland, USA) for the preparation of FcgRIIb-/- macrophages. For sepsis induction, cecal ligation and puncture (CLP) was performed according to the previous publications.12–15 Briefly, the cecum was ligated at 12 mm from the cecal tip, punctured twice with a 21-gauge needle, and gently pressed to express a small amount of fecal material before being placed into the abdominal cavity. In sham mice, the cecum was only identified through abdominal incision before suturing layer by layer with 6–0 nylon sutures. Then, 1 mL of prewarmed normal saline solution (NSS) was given intraperitoneally and antibiotics (imipenem/cilastatin) 14 mg/kg in 0.5 mL NSS was subcutaneously administered at 6 h and 18 h post-CLP for 1-day CLP mice and administered once daily for survival analysis and 7 days CLP mice. Antibiotics were not administered in sham mice. Blood was collected through tail vein nicking at 4 days before surgery for the baseline value of the parameters (0 time-point). At 1 day after surgery during survival observation, the moribund CLP mice, as indicated by labored respiration and non (or less) moving after touch stimulation, were counted as death and euthanized by cardiac puncture under isoflurane anesthesia with sample collection (organs and blood) (Figure 1A). In parallel, 1 day post sham mice from another set of experiments were used for avoiding an impact on the survival analysis. At 7 days of surgery, all mice were sacrificed through cardiac puncture under isoflurane anesthesia with sample collection. Another set of mice were used for the 1-day post-surgery time-point for fluorescein isothiocyanate dextran (FITC-dextran) assay (detail later). For intravenous immunoglobulin (IVIG) experiments, IVIG at 2.5 g/kg, using 10% IVIG (Thai Red Cross Society, Chulalongkorn University, Thailand) or NSS control, were intraperitoneally administered at 30 min after CLP surgery under isoflurane anesthesia before sacrifice at 1 day post surgery. In the survival analysis, IVIG (Thai Red Cross Society) at 2.5 g/kg or NSS was administered once daily started at 30 min after CLP until euthanized at 96 h post-CLP.
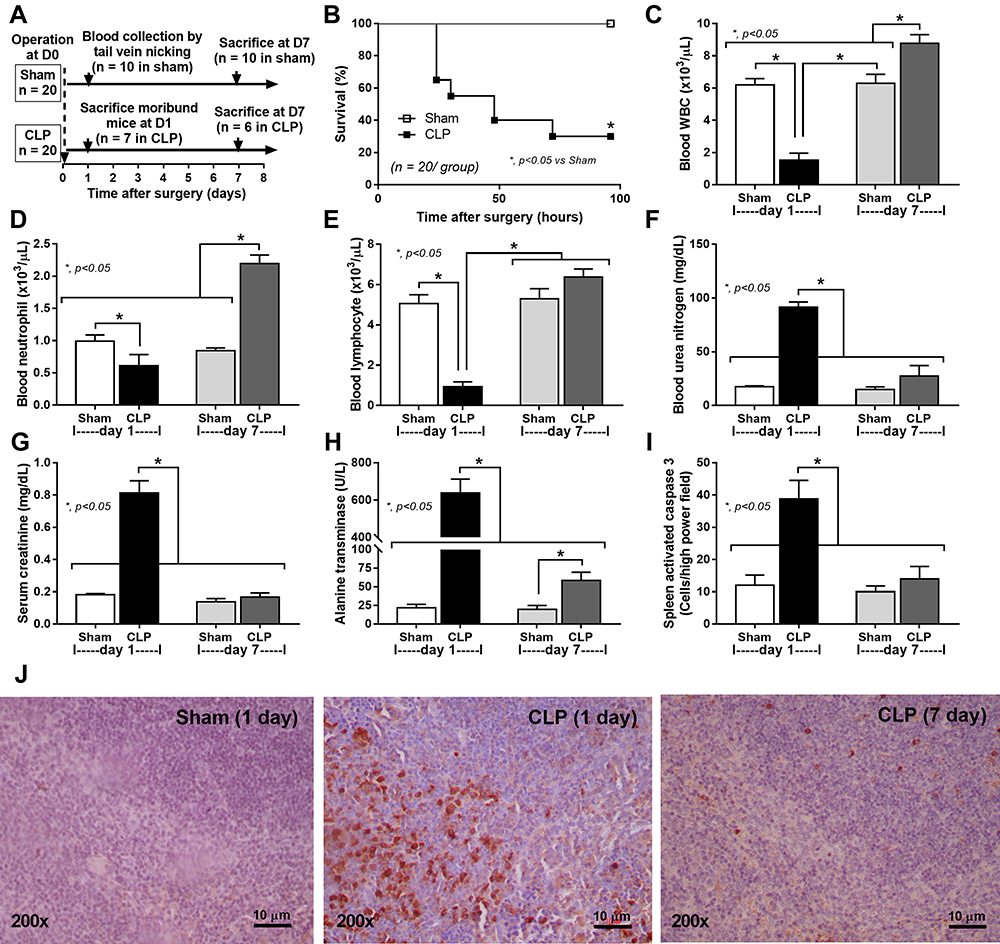 |
Figure 1 Schematic experiment and sepsis parameters of CLP mice at 1 and 7 days after surgery. Schema of the experiments (A) demonstrates mice with sham or CLP surgery (n = 20 in each group). Then, survival analysis (B), peripheral WBC, neutrophils, and lymphocytes (C–E) and organ injury parameters, including kidney (blood urea nitrogen and serum creatinine) (F and G), liver (alanine transaminase) (H), and spleen (activated caspase 3 apoptosis cells) with the representative caspase 3 immunohistochemistry pictures (I and J) are demonstrated. The picture from mice at 7-days post-sham is not shown due to the similarity to the presented 1-day post-sham. Notably, the number of analyzed samples in each time-point is 10 per group (n = 10/group) at baseline (4 days before surgery), n = 7 for moribund mice at 1-day post-CLP, n = 6 for survived CLP mice at 7 days and n = 10/group for the post-sham surgery (1 day and 7 days). Columns represent mean values ± SEM (*p < 0.05). Abbreviations: CLP, cecal ligation and puncture; WBC, white blood cells. |
Mouse Blood Sample Analysis
Kidney injury was determined by blood urea nitrogen (BUN) and serum creatinine using QuantiChrom (DIUR-500 and DICT-500; BioAssay, Hayward, CA, USA). Liver damage and serum cytokines were determined by EnzyChrom Alanine Trans-aminase assay (EALT-100, BioAssay, Hayward, CA, USA) and enzyme-linked immunosorbent assays (ELISA) for mouse cytokines (Invitrogen, Carlsbad, CA, USA), respectively. In addition, blood leukocyte determination was performed3 by mixed blood with 3% acetic acid, a hemolytic solution, with a ratio of blood:acetic acid at 6:100 by volume before counting with a hemocytometer. In parallel, a Wright-stained blood smear was examined for the percentage of polymorphonuclear cells (PMNs), and lymphocytes and the total cell numbers were calculated by the total count from the hemocytometer multiplied by the percentage of cells from the Wright-stained slide. Serum endotoxin (LPS) was measured by HEK-Blue LPS Detection (InvivoGen, San Diego, CA, USA), and the data were recorded as 0 when LPS values were less than 0.01 EU/mL because of the limited lower range of the standard curve. For the evaluation of antibody responses, mouse serum was analyzed for total immunoglobulin by capillary protein electrophoresis (MINICAP-2 Sebia, Evry Cedex, France) as previously published.16 The percentage of protein in the gamma zone of protein electrophoresis was recorded and converted into total immunoglobulin level by multiplying the ratio of gamma zone protein by serum total protein that was measured by Bradford protein assay.
Gut Leakage Measurement and Spleen Immunohistochemistry
Gut permeability was determined by FITC-dextran assay12,17,18 using an oral administration of FITC-dextran, a nonabsorbable molecule with 4.4 kDa molecular mass (Sigma-Aldrich, St. Louis, MO, USA), at 12.5 mg at 3 h before the detection in serum by Fluorospectrometer (NanoDrop 3300; ThermoFisher Scientific, Wilmington, DE, USA). On the other hand, immunohistochemical staining of 4-µm paraffin sections was performed with an anti-active caspase-3 antibody (Cell Signaling Technology, Beverly, MA), a marker of apoptosis, and examined in 10 randomly selected 200x magnified fields as previously described.19 The score was expressed as positive cells per high-power field.
Flow Cytometry Analysis Analyses of Spleen
For the comparison between 1 and 7 days after CLP surgery, all mice were operated for 2 times at day 0 and day 6 and sacrificed at day 7 of the experiments. For 1 day post CLP, sham and CLP surgery were performed at day 0 and day 6, respectively. In parallel, CLP and sham operations were conducted at day 0 and day 6, respectively. The sham control mice were performed by sham at both time points. Then, mouse spleens in these groups were analyzed by flow cytometry analysis following a previous standard protocol16 using separated splenocytes in supplemented RPMI-1640 (Roswell Park Memorial Institute media) and were resuspended in staining buffer (0.5% BSA and 10% FBS in PBS). Red blood cells were removed by lysis buffer (ACK buffer: NH4Cl, KHCO3, and EDTA). After that, splenocytes (1 × 10⁶ cells) were stained with fluorochrome-conjugated antibodies against different mouse immune cells including anti-CD4 (clone: GK1), CD8 (clone: 53–6.7), CD62L (clone: MEL-14), CD44 (clone: IM7), CD3ε (clone: 145–2C11), CD19 (clone: 6D5), CD11c (clone: N418), B220 (clone: RA3-6B2), CD11b (clone: M1/70), I-Ab (clone: AF6-120.1), CD80 (clone: 16–10A1), GL7 (clone: GL7), CD138 (clone: 281–2), Ly-6G (clone: A8), Ly-6C (clone: HK1.4), F4/80 (clone: BM8) and apoptosis markers using APC Annexin V and propidium iodide (PI) (Bioegend), the cells were resuspended in the binding buffer at a concentration of 1×10⁶ cells/100 uL for 15 min at room temperature in the dark before analysis with BD LSR-II (BD Biosciences) using FlowJo software (version 10).
Macrophage Cytokines, Phagocytosis Activity, and Polymerase Chain Reaction
To determine the influence of immunoglobulin (Ig) on macrophage function, soluble heat-aggregated immunoglobulin (sHA-Ig) was used as the representative immunoglobulin (Ig) on macrophages (RAW264.7 cells, ATCC®, Manassas, VA, USA). For the preparation of soluble heat aggregated gamma globulin (sHA-Ig), mouse IgG (Sigma-Aldrich) was diluted to 1 mg/mL in phosphate buffer solution (PBS) and heat-aggregated at 63°C for 60 min before centrifugation at 13,000 x g for 10 min. The supernatant was taken to measure the concentration using Cytation 5 (Biotek, Winooski, VT, USA). Then, RAW264.7 cells (5×10⁶ cells) were maintained in Dulbecco’s Modified Eagle Medium (DMEM) (Hyclone, Logan, UT, USA) supplemented with 10% Fetal Bovine Serum (FBS) (Gibco, Waltham, MA, USA) and grown for 24 h in a humidified incubator at 37°C with 5% CO2. RAW264.7 cells were stimulated with either 100 ng/mL lipopolysaccharide (LPS) (Escherichia coli 026: B6; Sigma-Aldrich) or LPS plus 100 µg/mL sHA-Ig for 24 h treatment before measurement of supernatant cytokines (TNF-α, IL-6, and IL-10) by ELISA (Invitrogen).
For phagocytosis, macrophages at 1×10⁵ cells were stimulated from 24 h as previously described and opsonized by 30 min incubation with 2.5% mouse serum in DMEM before the 1 h incubation with zymosan conjugated with 40 kDa FITC-dextran (Sigma-Aldrich) at 200 ug/mL in 37 °C with 5% CO2. Then, the cells were fixed by 1% paraformaldehyde in 2% fetal bovine serum (FBS) in PBS for 15 min and detached by a cell scraper. The number of cells with phagocytosis (fluorescent FITC-positive cells) was measured with a FACS LSRII (BD Biosciences, San Jose, CA, USA) flow cytometer using FlowJo software (Tree Star, Inc., Ashland, OR, USA).
Additionally, Fc gamma receptors (FcgRs), both activating and inhibitory receptors, in macrophages were evaluated using real-time polymerase chain reaction (PCR). After 24 h of the stimulation, an RNA easy mini kit (Qiagen, Hilden, Germany) and a high-capacity reverse transcription assay (Applied Biosystems, Warrington, UK) were used to prepare total RNA and reverse transcription, respectively. The comparative threshold (delta-delta Ct) approach (2−ΔΔCt) was used to establish relative quantification using an Applied Biosystems 7500 Real-Time PCR System with SYBR® Green PCR Master Mix (Applied Biosystems) as normalized by Beta-2 microglobulin (β2M, an endogenous housekeeping gene). A list of primers for PCR is including FcgRI forward 5ʹ-CACAAATGCCCTTAGACCAC-3ʹ reverse 5ʹ-ACCCTAGAGTTCCAGGGATG-3ʹ; FcgRIIb forward 5ʹ-TTCTCAAGCATCCCGAAGCC-3ʹ reverse 5ʹ-TTCCCAATGCCAAGGGAGAC-3ʹ; FcgRIII forward 5ʹ-AGGGCCTCCATCTGGACTG-3ʹ reverse 5ʹ-GTGGTTCTGGTAATCATGCTCTG-3ʹ; FcgRIV forward 5ʹ-AACGGCAAAGGCAAGAAGTA-3ʹ reverse 5ʹ-CCGCACAGAGAAATACAGCA-3ʹ and β2 microglobulin (β2M) forward 5ʹ-CCACTGAAAAAGATGAGTATGCCT-3ʹ reverse 5ʹ-CCAATCCAAATGCGGCATCTTCA-3ʹ.
Bone Marrow–Derived Macrophages from Wild-Type and Fc Gamma Receptor IIb–Deficient (FcgRIIb-/-) Mice
Because of the previous information on a better engagement of sHA-Ig to inhibitory Fc gamma receptor IIb (FcgRIIb), an only inhibitory receptor of Fc gamma receptor (FcgR) family, over the other activating FcgRs,26 macrophages from FcgRIIb-deficient (FcgRIIb-/-) mice were used.
As such, macrophages were derived from the bone marrow of 8 wk-old mice (wild type and FcgRIIb-/-) as previously described.12–15 Briefly, bone marrow from femurs and tibias were collected by centrifugation at 6000 rpm for 4 °C and incubated for 7 days with Dulbecco’s Modified Eagle Medium (DMEM) supplemented with 10% fetal bovine serum (FBS), 1% penicillin/streptomycin, 4-(2-hydroxyethyl)-1-piperazineethanesulfonic acid (HEPES) with sodium pyruvate in a humidified 5% CO2 incubator at 37 °C. Conditioned media of the L929 cell line, containing macrophage-colony stimulating factor, at 20% weight by volume (w/v) were used to induce macrophages from the pluripotent stem cells. After that, the bone marrow-derived macrophages were stimulated with LPS with or without sHA-Ig before the determination of supernatant cytokines in similar to RAW264.7 cells as previously mentioned.
Extracellular Flux Analysis and Intracellular Reactive Oxygen Species (ROS)
Because cell energy status is important for LPS-induced cytokine production20 and both inflammatory cytokines and LPS are potent ROS inducers,21,22 sHA-Ig might affect cell energy and ROS. The energy metabolism profiles, using Seahorse XF Analyzers (Agilent, Santa Clara, CA, USA), are estimated by glycolysis and mitochondrial oxidative phosphorylation based on extracellular acidification rate (ECAR) and oxygen consumption rate (OCR), respectively, as previously published.23 As such, macrophages (RAW264.7) at 1×10⁶ cells/well were stimulated, as described above, in a Seahorse cell culture plate before replacing by Seahorse media (DMEM complemented with glucose, pyruvate, and L-glutamine) (Agilent, 103575–100) in pH 7.4 at 37°C for 1 h prior to the challenge with different metabolic interference compounds of mitochondrial and glycolysis stress test. Briefly, for the mitochondrial stress test, the samples in Seahorse media (Agilent, 103575–100) were sequentially incubated by oligomycin, carbonyl cyanide 4-(trifluoromethoxy) phenylhydrazone (FCCP), and rotenone/antimycin A. In parallel, glycolysis stress tests were performed in samples with Seahorse XF DMEM medium supplemented with 2 mM Seahorse XF L glutamine. Then, several agents, including glucose, oligomycin, and 2-deoxy-D-glucose (2-DG) were sequentially added. The results in the Seahorse analysis were normalized by applying the total protein abundance in the Wave program before measuring all parameters. On the other hand, the intracellular reactive oxygen species (ROS) was determined by DHE (dihydroethidium) assay (ab236206; Abcam, Cambridge, MA, USA), according to the manufacturer’s instructions as previously described.24
Quantitative Proteomic Analysis
Stimulated RAW246.7 cells after 24 h of LPS or LPS + sHA-Ig incubation were washed 3 times with ice-cold PBS, lysed in 8 M urea in 100 mM triethylammonium bicarbonate (TEAB, Sigma) containing 1X protease inhibitor cocktail (ThermoFisher), and sonicated at 40% amplitude for 1 min. Cell debris was pelleted by centrifugation at 12,000 × g at 4 °C for 10 min. Protein concentration was measured by BCA assay (ThermoFisher). Then, 100 µg of each sample were processed with 10 mM dithiothreitol (DTT) (Merck, Kenilworth, NJ, USA) at 37°C for 30 min, followed by alkylation with 40 mM iodoacetamide (GE Healthcare, Chicago, IL, USA) at room temperature for 30 min in the dark. These samples were further quenched with 40 mM DTT at least 15 minutes at room temperature and diluted with 100 mM TEAB to lower urea concentration to <1 M followed by incubation with trypsin (Promega) at a ratio of 1:50 (w/w) at 37 °C overnight. The tryptic peptides were labeled with TMTsixplexTM Isobaric Label Reagent Set (ThermoFisher) following the manufacturer’s protocols. Peptides derived from cells stimulated with LPS plus sHA-Ig or LPS were labeled with 128 and 130 TMT reagent, respectively. After labeling, the samples were incubated for 1 h at room temperature and quenched with 5% hydroxylamine (Sigma-Aldrich) for 15 minutes. Each labeled sample was combined and dried in a vacuum centrifugation. Then, the pooled labeled peptides were separated into 20 fractions and concatenated into 10 fractions using the Pierce High pH Reversed-Phase Peptide Fractionation Kit (ThermoFisher) with minor modified instruction. Then, all fractions were dried in vacuo and dissolved in 0.1% formic acid (Sigma) before MS analysis.
After that, liquid chromatography–mass spectrometry (LC-MS/MS) analysis of samples was performed on an EASY-nLC1000 system coupled to a Q-Exactive Orbitrap Plus mass spectrometer equipped with a nano-electrospray ion source (ThermoFisher). The peptides were eluted with the following acetonitrile gradients in 0.1% FA: 5–8% for 3 min 8–15% for 60 min, 15–40% for 23 min, 40–95% for 2 min, and 95% for 5 min at a flow rate of 300 nL/min. The MS methods included a full MS scan at a resolution of 70,000 followed by 10 data-dependent MS2 scans at a resolution of 35,000. The normalized collision energy of HCD fragmentation was set at 32%. An MS scan range of 200 to 2000 m/z was selected and precursor ions with unassigned charge states, a charge state of +1, or a charge state of greater than +8 were excluded. A dynamic exclusion of 30 s was used. Peaklist-generating software of Thermo Xcalibur 3.0.63 (August 27, 2013) with Proteome Discoverer™ Software 2.1.1.21 (ThermoFisher) was used. The MS raw data files were searched against a composite database containing the forward and reversed peptide sequences of the Mouse Swiss-Prot Database (17,051 proteins, December 2020) with a list of common protein contaminants (www.thegpm.org/crap/). The search parameters were set for the following fixed modifications: carbamidomethylation of cysteine (+57.02146 Da), as well as TMT 6 plex of N-termini and lysine (+229.162932 Da). For variable modifications, the search parameters were set as follows: oxidation of methionine (+15.99491 Da) with a maximum of four modifications and two missed cleavages allowed per peptide. Parent and fragment monoisotopic mass errors were set at 10 ppm and 0.02 Da, respectively. A target–decoy approach was used to limit a false discovery rate of the identified peptides to less than 1%. The reporter ion intensity ratios of R+IC/R were transformed to log2 (LPS+sHA-Ig/LPS). P-values were calculated with Student’s t-test based on the triplicate log2 (LPS+sHA-Ig/LPS) against 0. The proteins with p-value ≤ 0.05 were considered as significantly altered proteins and these proteins were subjected to the online resource PANTHER Classification System (V. 16.0) to investigate the enriched biological process.
Statistical Analysis
Mean ± standard error (SE) was used for data presentation. The differences between groups were examined for statistical significance by one-way analysis of variance (ANOVA) followed by Tukey’s analysis of multiple groups comparison. The time-point experiments were analyzed by the repeated measures ANOVA. Survival analysis was determined by a Log rank test. All statistical analyses were performed with SPSS 11.5 software (SPSS, IL, USA) and GraphPad Prism version 7.0 software (La Jolla, CA, USA). A p-value of <0.05 was considered statistically significant.
Data Availability
The mass spectrometry proteomics data, including annotated spectra for all modified peptides and proteins identified on the basis of a single peptide, have been deposited to the ProteomeXchange Consortium via the PRoteomics IDEntifications (PRIDE) partner repository with the data set identifier PXD027471.
Results
The Characteristics of Survived Mice After Cecal Ligation and Puncture
A comparison of two different groups of mice, a moribund group studied in the acute phase of sepsis (1-day post-CLP) and a selected group of survivors (survived mice at 7-days post-CLP), studied in the prolonged/recovery phase of sepsis, was demonstrated. As such, several parameters at 1-day post-CLP from moribund mice, which were counted as death, in the survival analysis (n = 7), and the survived mice at 7 days after CLP (n = 6) are presented (Figure 1A). Sepsis severity in our CLP model was demonstrated at 1-day post-CLP by several parameters, including mortality rate (Figure 1B) with leukopenia (neutropenia and lymphopenia) (Figure 1C–E), renal injury (Figure 1F and G), liver enzyme (alanine transaminase) (Figure 1H), spleen apoptosis (Figure 1I and J), serum cytokines (Figure 2A–C), gut leakage (Figure 2D) and endotoxemia (Figure 2E and F). Despite leukopenia, neutropenia, and lymphopenia at 1-day post-CLP, leukocyte count (neutrophils and lymphocytes) in peripheral blood of the survived mice at 7 days after CLP was increased (Figure 1C–E). In parallel, there was a normalization of nearly all sepsis parameters, except for a slight elevation in liver enzyme, IL-10, gut leakage, and endotoxemia (Figure 1B–J and Figure 2A–F). On the other hand, sepsis-induced adaptive immune responses were indicated through antibody production (serum gamma globulin) that was higher in mice at 7-days post-CLP compared with at 1-day CLP (Figure 2G) supporting the time-dependent characteristics of adaptive immunity. Notably, the increased serum gamma globulin at 1-day post-CLP compared with the sham control mice supported an impact of the natural antibody against systemic bacterial infection.25
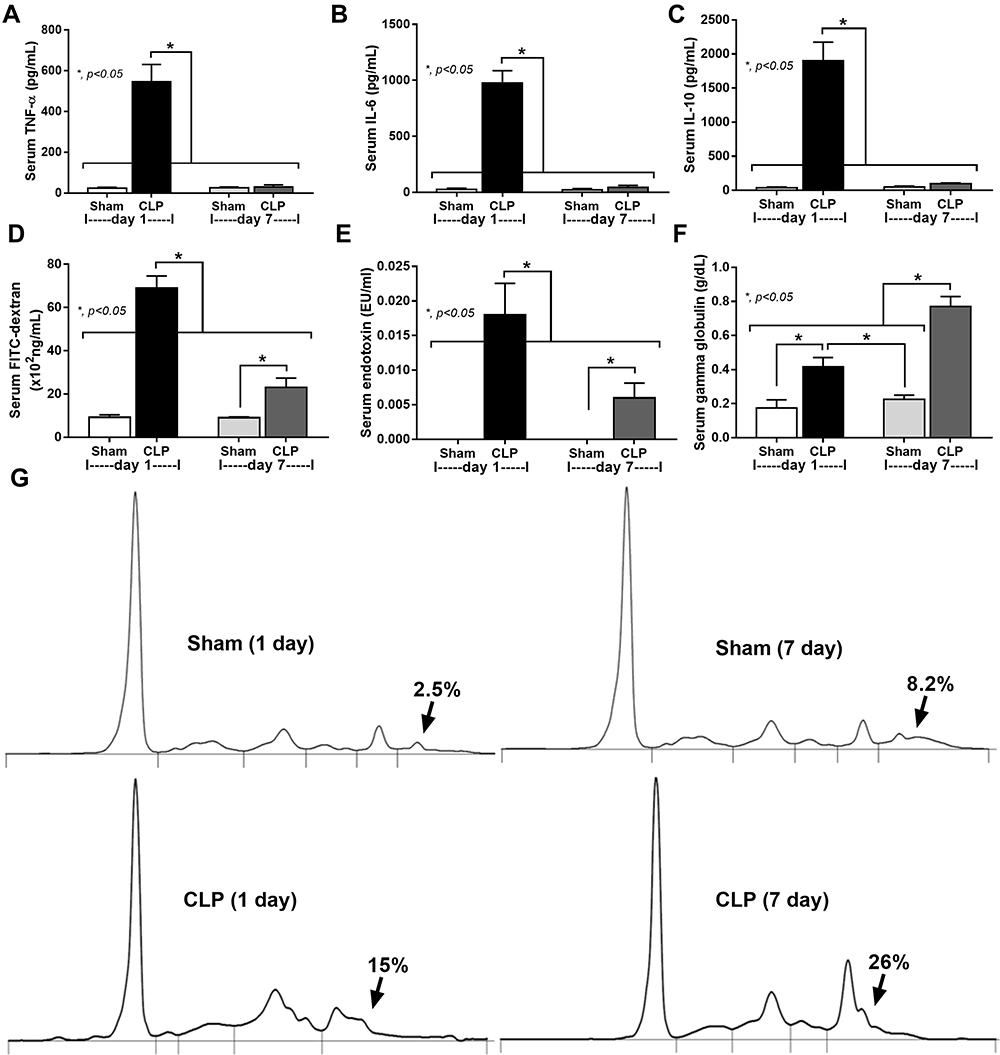 |
Figure 2 Serum cytokines, gut leakage, and serum gamma globulin of CLP mice at 1 and 7 days after surgery. Characteristics of mice at baseline (n = 10/group; blood collection at 4 days before surgery), moribund mice at 1 day after CLP (n = 7), 7-days post-CLP (n = 6), 1 days and 7-days post-sham (n = 10/group) as indicated by serum cytokines (TNF-α, IL-6, and IL-10) (A–C), gut permeability defect (FITC-dextran assay) (D), endotoxemia (E), and serum gamma globulin (an indicator of immunoglobulin production) with the representative pictures of serum protein electrophoresis (F and G) are demonstrated. Columns represent mean values ± SEM (*p < 0.05). Abbreviation: CLP, cecal ligation and puncture. |
To explore sepsis immune responses between 1-day and 7-days post-CLP, an experimental design with 2 times operation in all mice was conducted to control the duration of surgery among groups (Figure 3A, as described in the Animals and Animal Model section). The profound activity of immune responses in sepsis was crudely demonstrated by increased spleen weight and total splenocytes in both 1-day and 7-days post-CLP (more prominent at 7-days post-CLP), implying an active adaptive immunity in survived CLP mice (Figure 3B and C). Although several B cell populations (B cells, activated B cells, and germinal center B cells) initially increased at 1-day post-CLP, these B cells, plasma cells, and effector memory T cells were more prominent at 7-days post-CLP (Figure 3D–I). On the other hand, total dendritic cells (myeloid and plasmacytoid dendritic cells), but not total myeloid cells, macrophages, and neutrophils, were increased at 1-day post-CLP when compared with the sham group (Figure 4A–G). At 7-days post-CLP, all of these cells, except for plasmacytoid dendritic cells, were higher than 1-day post-CLP (Figure 4A–G). These findings suggested that adaptive immunity began 1 day after CLP and rapidly increased five days later.
 |
Figure 3 Schematic experiment and spleen analysis of CLP mice at 1 and 7 days after surgery. Schema of the experiments indicates the time of the operation (day 0 and day 6) in mice with sham, after CLP surgery for 1-day (1-day CLP) and 7-days post-CLP (7-day CLP) (n = 6–10/group) (A) is demonstrated. Characteristic of spleen analysis as indicated by spleen weight (B) and flow cytometry analysis of splenocytes with several parameters, including total splenocytes, B cells (CD19 positive), activated B cells (CD19 and CD80 positive), germinal center B cells (CD19 and GL-7 positive), plasma cells (CD138 positive), effector memory T cells (CD4 and CD44 positive with negative for CD62L) (C–H) with the representative flow pattern of plasma cells (I) are demonstrated. Columns represent mean values ± SEM. #p < 0.05 compared to the control group (Sham). *p < 0.05 compared to the CLP group. Abbreviation: CLP, cecal ligation and puncture. |
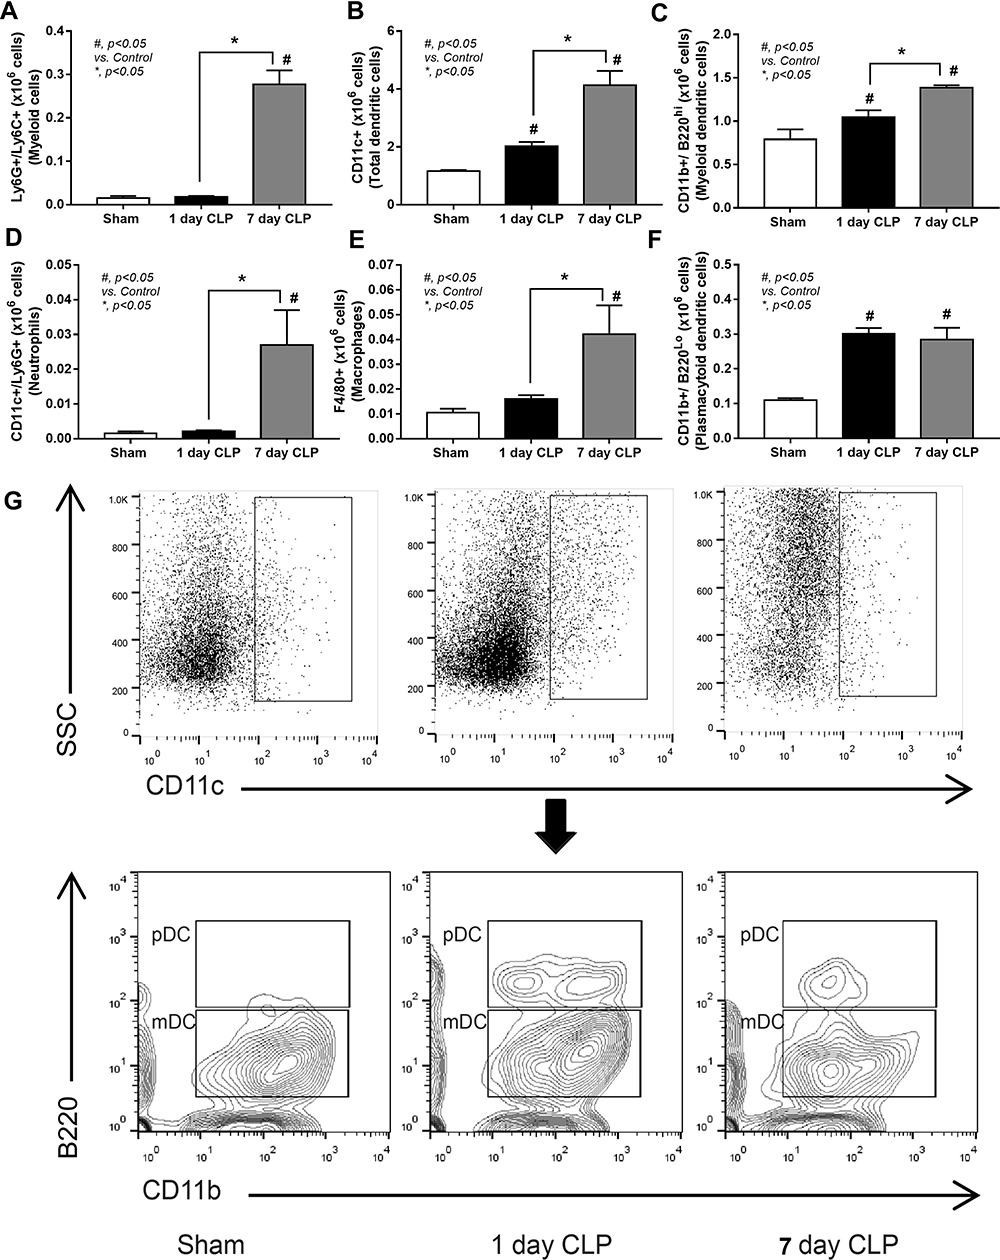 |
Figure 4 Flow cytometry analysis of myeloid cells in CLP mice at 1 and 7 days after surgery. Characteristic of spleen analysis from mice with sham, after CLP surgery for 1-day (1-day CLP) and 7-days post-CLP (7-day CLP) (n = 6–10/group) as indicated by flow cytometry analysis of splenocytes with several parameters, including myeloid cells (Ly6G and Ly6C-positive cells), dendritic cells (CD11c positive), myeloid dendritic cells (CD11c, CD11b positive and B220 negative), neutrophils (CD11c and Ly6G positive), macrophages (F4/80 positive), and plasmacytoid dendritic cells (CD11c, CD11b, and B220 positive) (A–F) with the representative flow pattern of dendritic cells (G) are demonstrated. Columns represent mean values ± SEM. #p < 0.05 compared to the control group (Sham). *p < 0.05 compared to the CLP group. Abbreviation: CLP, cecal ligation and puncture. |
The Immune Complex Attenuated Lipopolysaccharide-Activated Macrophage Responses Through Several Mechanisms
Due to the possible influence of adaptive immunity, especially immune complex, on macrophages, several experiments on lipopolysaccharide (LPS)-activated macrophages (RAW246.7 cells) with or without administration of immune complex, using soluble heat aggregated immunoglobulin (sHA-Ig), were conducted. Accordingly, sHA-Ig alone induced a slight increase in macrophage supernatant cytokines but lower than LPS activation (Figure 5A–C), implying an impact of immunoglobulin-activated Fc gamma receptors (FcgRs) on cytokine production.26 The reduction in supernatant cytokines of LPS+sHA-Ig macrophages when compared with LPS activation alone (Figure 5A–C) supported the anti-inflammation property of immunoglobulin. Likewise, both sHA-Ig and LPS alone similarly induced phagocytosis while LPS+sHA-Ig decreased phagocytosis activity (Figure 5D). Due to the influence of FcgRs on sHA-Ig activation,26 the expression of several FcgRs was explored. As such, both sHA-Ig and LPS stimulation alone up-regulated FcgRIIb, FcgRIII, and FcgRIV, but not FcgRI (Figure 5E–H) (higher expression with LPS than sHA-Ig). However, LPS+sHA-Ig activation did not alter FcgRs expression in macrophages when compared with LPS stimulation alone (Figure 5E–H), despite the lower cytokine production than LPS activation alone (Figure 5A–C). Because of the preferential engagement of sHA-Ig26 with the higher affinity binding to inhibitory FcgRIIb27,28 than toward activating FcgRs (FcgRIII and FcgRIV), FcgRIIb-/- macrophages were further tested. Indeed, the anti-inflammatory effect of sHA-Ig could be demonstrated only in wild-type bone marrow-derived macrophages but not in FcgRIIb-/- macrophages as indicated by supernatant cytokines (Figure 5I–K). Notably, macrophage cytokine responses against LPS and sHA-Ig were more prominent in FcgRIIb-/- macrophages than the wild-type cells (Figure 5I–K) possibly due to the loss of the inhibitory receptor as previously described.23
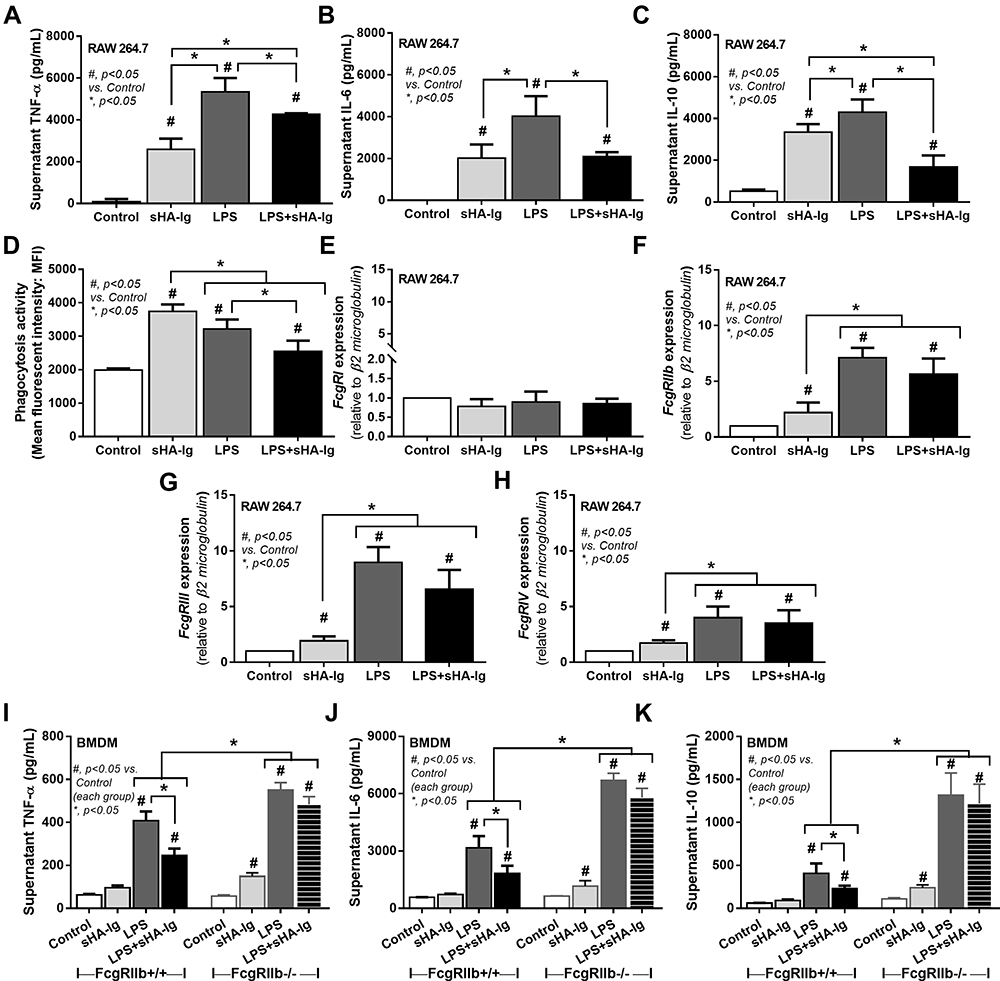 |
Figure 5 Analysis of cytokine production, phagocytosis activity, and FcgRs expression in macrophages (RAW264.7 cells) treated with different conditions. Characteristic of macrophages after activation by media control, sHA-Ig, LPS and LPS with sHA-Ig (LPS+sHA-Ig) as indicated by supernatant cytokines (TNF-α, IL-6, and IL-10) (A–C), phagocytic activity (D) and gene expression of several FcgRs, including FcgRI, FcgRIIb, FcgRIII and FcgRIV (E–H), are demonstrated. To determine an influence of inhibitory Fc gamma receptor IIb (FcgRIIb) on IVIG, bone marrow–derived macrophages (BMDM) from wild-type (FcgRIIb+/+) and FcgRIIb-deficient (FcgRIIb-/-) mice after stimulation by these activators as indicated by supernatant cytokine responses (TNF-α, IL-6, and IL-10) (I–K) are also demonstrated. Triplicated independent experiments were performed for all experiments. Columns represent mean values ± SEM. #p < 0.05 compared to the control group. *p < 0.05 compared to the treatment group. Abbreviations: sHA-Ig, soluble heat aggregated immunoglobulins; LPS, lipopolysaccharide; FcgR, Fc gamma receptor; TNF, tumor necrosis factor; IL, interleukin; BMDM, bone marrow–derived macrophages. |
Due to the possible association between cytokine-producing activity and several cell characteristics, including cell energy status and reactive oxygen species (ROS) generation,2–4 these parameters were evaluated. Accordingly, 24 h of LPS stimulation reduced mitochondrial activity in macrophages as indicated by a decrease in basal respiration and maximal respiratory capacity, while the mitochondrial functions of sHA-Ig activation alone were not different from the control group (Figure 6A, C and D). However, basal respiration and maximal respiratory capacity in LPS+sHA-Ig macrophages were lower than LPS activation alone (Figure 6A–D), perhaps due to the use of some energy for FcgRs activation. In parallel, LPS or sHA-Ig alone increased glycolysis, glycolysis capacity, and glycolysis reserve when compared with control (Figure 6B and E–G) and the activation by sHA-Ig alone induced the most prominent glycolysis parameters among all groups (Figure 6E–G). The enhanced glycolysis activity by sHA-Ig without an increase in cytokine production (Figure 5A–C) implies an energy utilization after FcgRs activation for the non-cytokine producing proposes. With sHA-Ig+LPS, glycolysis activities were decreased similarly to the levels of the control group (Figure 6E–G) that possibly be responsible for the reduced cytokine production (Figure 5A–C) supporting the association between glycolysis and cytokine production.2–4
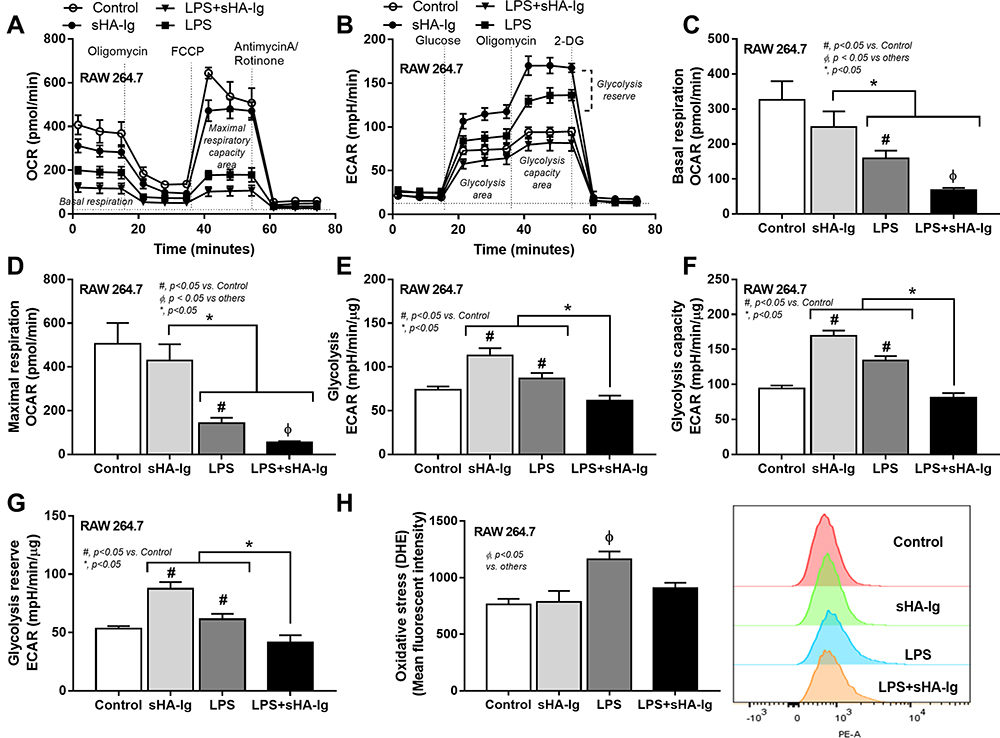 |
Figure 6 Analysis of cellular energy metabolism and ROS production in macrophages (RAW264.7 cells) treated with different conditions. Characteristic of macrophages after 24 h activation by media control, sHA-Ig, LPS and LPS with sHA-Ig (LPS+sHA-Ig) as indicated by the pattern of extracellular flux analysis on mitochondrial stress test using OCR (A) and glycolysis stress test by ECAR (B) with the graph presentation of several cell-energy parameters (C–H) and the intracellular ROS using DHE fluorescent dye (neutralized by Hoechst nuclear staining dye) with the representative flow cytometry patterns (H) are demonstrated (three independent experiments were performed). Columns represent mean values ± SEM. # p < 0.05 compared to the control group. * p < 0.05 compared to the indicated group. ɸ p < 0.05 compared to others. Abbreviations: OCR, oxygen consumption rate; ECAR, extracellular acidification rate; ROS, reactive oxygen species; DHE, dihydroethidium. |
Additionally, the excessive cytokine production and the increased energy utilization after LPS activation enhance reactive oxygen species (ROS) that worsen cell injury.20,29,30 Indeed, LPS induced higher cytokines than sHA-Ig activation (Figure 5A–C) and only LPS, but not sHA-Ig, increased ROS production (Figure 6H). Hence, the anti-inflammatory effect of sHA-Ig against LPS-activated macrophages was demonstrated by the reduction in several cell processes, including cytokine production, phagocytosis, and cell energy status (Figures 5A–D and 6A–G), that might be associated with a decrease in intracellular oxidative stress (Figure 6H). With proteomic analysis, the reduced activities of LPS+sHA-Ig macrophages compared with LPS activation alone were demonstrated by prominent down-regulation of the proteins in several biological processes with a higher number of the down-regulated proteins than the up-regulated groups (Volcano plot and heat-map analysis), especially the proteins in “macrophage metabolism” and “glycolysis (with antigen presentation process)” (Figure 7A–C). As such, there were several down-regulated proteins (green color in Figure 8A) in several energy-producing pathways, such as i) glycolysis; hexokinase 3 (Hk3) and glucose 6 phosphate dehydrogenase (G6pdx), ii) fatty acid synthesis; lipoprotein lipase (Lpl) and Acylglycerol kinase (Agk), iii) fatty acid oxidation; acyl-COA dehydrogenase long chain (Acadl) and acetyl-CoA acyltransferase 2 (Acaa2), and iv) tricarboxylic acid (TCA) cycle; citrate synthase (Cs) and mitochondrial malate dehydrogenase (Mdh2). Likewise, the presence of sHA-Ig in LPS-activated macrophages also down-regulated several proteins of phagocytosis activity (Figure 8B), including proteins in actin modeling (Fnbp1l and Acta1), MHC class II processing (Ctsb, Ctsd, Ctsz, V-ATPase genes, and NADPH oxidase complex genes) and MHC class I utilization (Tap2, Erap1, Calr, H2-K1 and proteasome genes). These data supported control of LPS activation in macrophages by immunoglobulin through several pathways. The information of identified proteins, significantly altered proteins, and biological process analysis are presented in Supplement Table S1-S3.
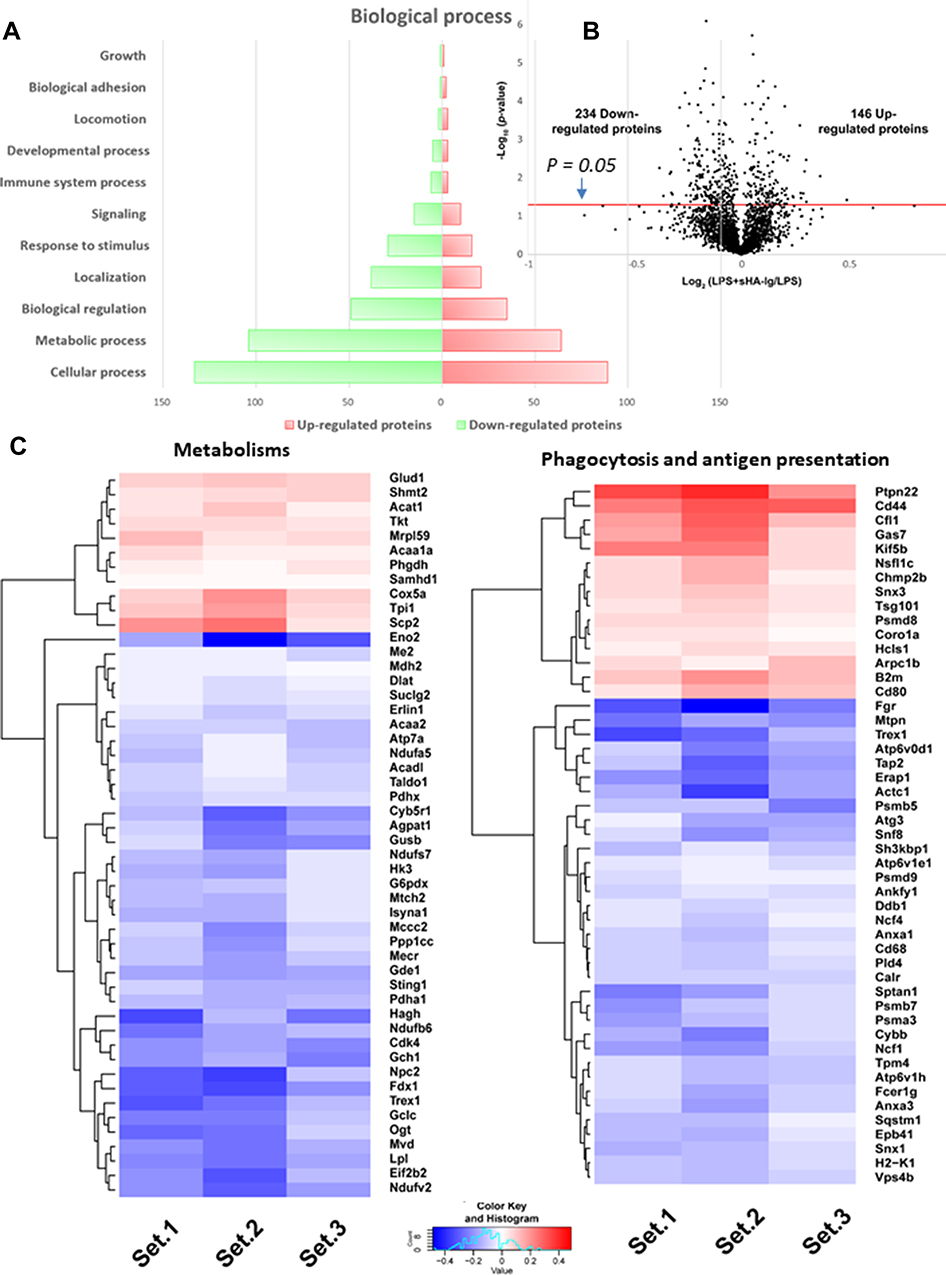 |
Figure 7 Proteomic analysis of LPS with or without sHA-Ig in macrophages (RAW264.7 cells). Characteristic of proteomic analysis of macrophages after stimulation with LPS plus sHA-Ig (LPS+sHA-Ig) compared with LPS-activated macrophages as indicated by biological process (A), volcano plot (B), and the heat-map of protein abundance for proteins that associated with metabolism (left) or phagocytosis and antigen presentation (right) (C) are demonstrated. Set 1–3 are the triplication of the protein expression experiments from LPS+sHA-Ig group relative to LPS-activated macrophages. |
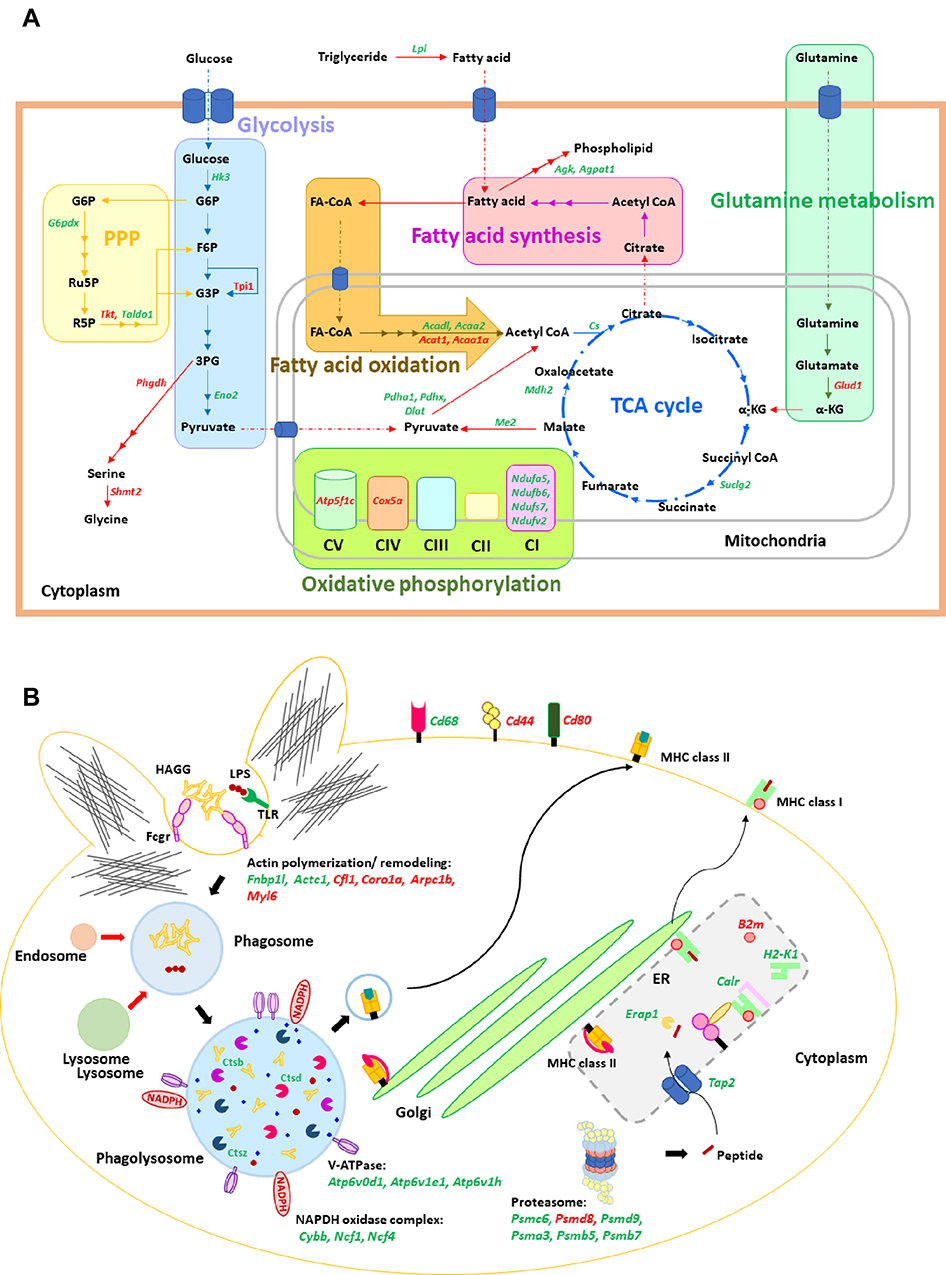 |
Figure 8 Illustration of cellular energy metabolism and phagocytosis pathway. Illustrations of cellular energy metabolism (A) and phagocytosis pathway (B) mapped the proteins from the proteomic analysis of macrophages after stimulation with LPS plus sHA-Ig (LPS+sHA-Ig) compared with LPS activation alone are demonstrated. Proteins in red and green-colored texts represent the up- and down-regulated proteins from the proteomic analysis, respectively. Abbreviations: PPP, pentose phosphate pathway; TCA, tricarboxylic acid; CI, complex I; TLR, toll-like receptor; HAGG, heat-aggregated gamma globulin; MHC, major histocompatibility complex. |
Intravenous Immunoglobulin Attenuated Severity of Cecal Ligation and Puncture Mice, An Adaptive Immunity Control
Because of 1) the prominent adaptive immunity in survived CLP mice, 2) the anti-inflammatory property of sHA-Ig on LPS-activated macrophages and 3) the debate on clinical utilization of intravenous immunoglobulin (IVIG) in sepsis31,32 with limited rodent studies,33,34 human-derived IVIG was used as an adaptive immunity activation in CLP mice following several reports on the cross-species immune responses.35–39 Accordingly, IVIG attenuated CLP sepsis severity as indicated by several parameters at 1-day post-CLP, including survival analysis, renal injury, liver enzyme, serum TNF-α, IL-6, and spleen-activated caspase 3, but not serum IL-10 and endotoxemia (Figure 9A–I). With flow cytometry analysis of spleen, IVIG decreased total dendritic cells, myeloid and plasmacytoid dendritic cells but did not change adaptive immune cells (B cells, plasma cells, and T cells), macrophages, and neutrophils in mice at 1-day post-CLP (Figure 10A–J), implying a less prominent activation on dendritic cells with IVIG treatment.66,67
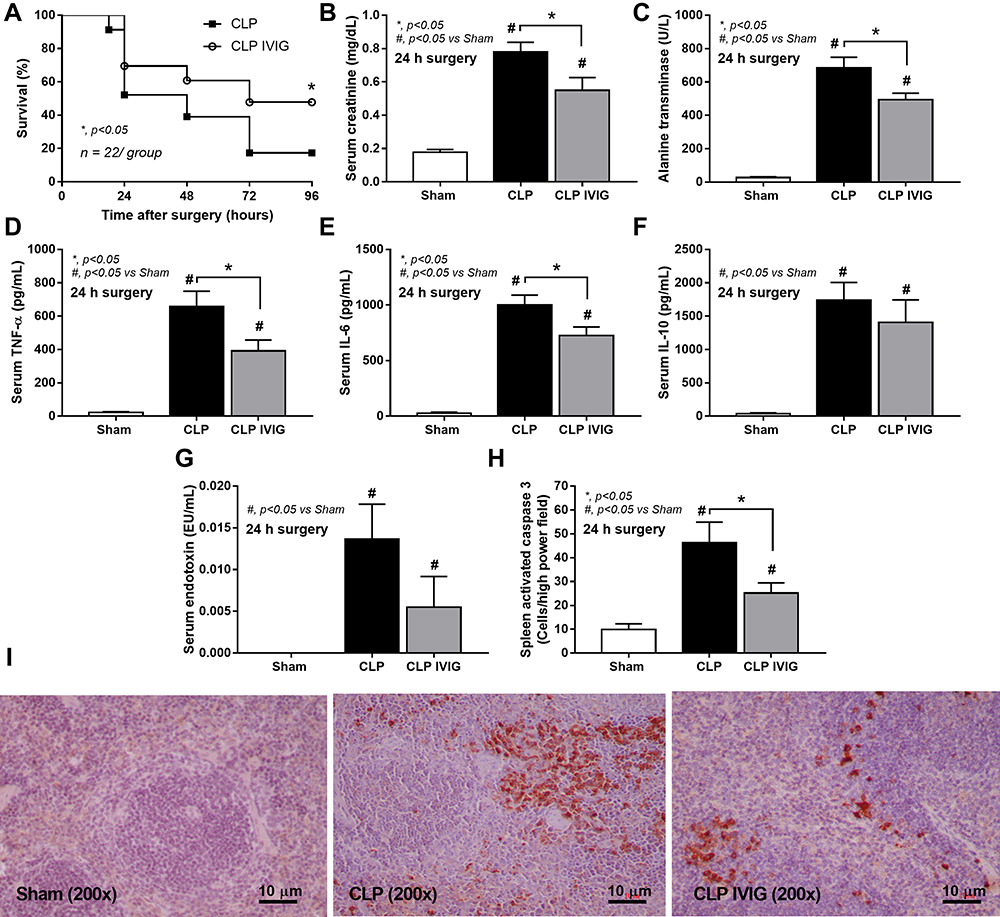 |
Figure 9 Analysis of IVIG-treated CLP mice. Characteristics of mice at 24 h after sham or CLP with IVIG or NSS administration as indicated by survival analysis (n = 22/group) (A), serum creatinine (B), liver enzyme (alanine transaminase) (C), serum cytokines (TNF-α, IL-6, and IL-10) (D-F), gut permeability defect (FITC-dextran assay) (G) and spleen injury (activated caspase 3 apoptotic splenocytes) with the representative caspase 3 immunohistochemistry pictures (H and I) are demonstrated (n = 6–8/group for B-H). Data from sham IVIG mice are not demonstrated due to the normal values as indicated by sham with NSS administration as presented. Columns represent mean values ± SEM. #p < 0.05 compared to the control group (Sham). *p < 0.05 compared to the CLP group. Abbreviations: IVIG, intravenous immunoglobulin; NSS, normal saline. |
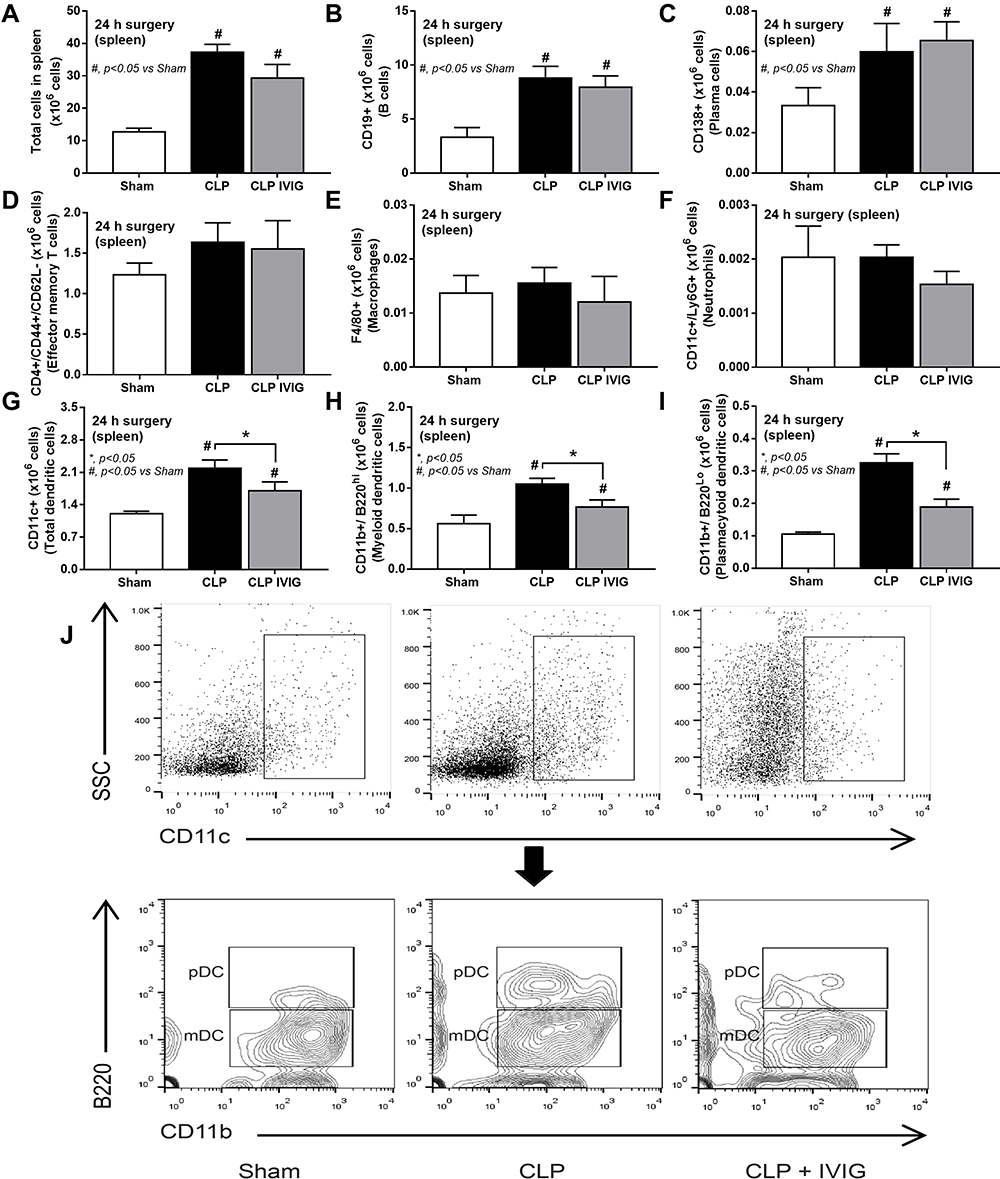 |
Figure 10 Flow cytometry analysis of spleen from intravenous immunoglobulin (IVIG)-treated cecal ligation and puncture (CLP) mice. Characteristics of flow cytometry analysis from the spleen of mice at 24 h after sham or CLP with IVIG or NSS administration as indicated by total splenocytes (A), B cells (CD19 positive) (B), plasma cells (CD138 positive) (C), effector memory T cells (CD4 and CD44 positive with negative for CD62L) (D), macrophages (F4/80 positive) (E), neutrophils (CD11c and Ly6G positive) (F), total dendritic cells (CD11c positive) (G), myeloid dendritic cells (CD11c, CD11b positive and B220 negative) (H) and plasmacytoid dendritic cells (CD11c, CD11b and B220 positive) (I) with the representative flow pattern of dendritic cells (J) are demonstrated (n = 6–7/group). Columns represent mean values ± SEM. #p < 0.05 compared to the control group (Sham). *p < 0.05 compared to the CLP group. Abbreviations: IVIG, intravenous immunoglobulin; NSS, normal saline. |
Discussion
The physiologic exploration on CLP survivors (7-days post-CLP) demonstrated a recovery of most sepsis parameters and innate immunity deceleration along with an adaptive immune acceleration, especially plasma cells and immunoglobulin, supported the use of IVIG in sepsis hyper-inflammatory responses.
The Innate and Adaptive Immunity in Mice with Cecal Ligation and Puncture Sepsis
Innate immune hyper-activation at 1-day post-CLP was indicated by a cytokine storm in responses against endotoxemia, from bacteremia and gut translocation (gut permeability defect),40,41 that induced leukopenia and splenocyte cell deaths,42 possibly due to sepsis-induced immune cells’ apoptosis.43 With spleen analysis, an increase in plasmacytoid dendritic cells (the antigen-presenting cells of innate immunity) and adaptive immunity (activated B cells) at the germinal center (an area with prominent antibody production)44 at 1-day post-CLP facilitated the proliferation of plasma cells and effector memory T cells at 7-days post-CLP that enhanced polyclonal antibody (Ab) production. These data support collaboration between innate and adaptive immune responses in sepsis.11 Additionally, a more effective Ab-mediated microbial control was also indicated by a re-population of neutrophils and macrophages at 7-days post-CLP, which was possibly associated with the reduced sepsis severity in the 7-days survivors. Despite a lack of clinical signs in 7-days post-CLP mice compared with the sham group, mild gut permeability defect and low level of injury (endotoxemia, liver injury, and serum IL-10) were still detectable, possibly because of the intra-abdominal necrotic tissue, implying a post-sepsis low-grade inflammation.9 Further exploration of sepsis recovery is interesting.
The Control of Innate Immunity by Adaptive Immune Responses in Macrophages
Due to the impact of macrophages and endotoxin in sepsis-induced inflammation,45–48 immunoglobulin, a representative adaptive immunity, was tested on LPS-activated macrophages, an in vitro innate immune stimulation. As such, soluble heat aggregated immunoglobulin (a representative of the immune complex49) mildly activated macrophage cytokine production, when compared with LPS activation, through all Fc gamma receptors (FcgRs), except for FcgRI.26 In parallel, LPS induced supernatant cytokines and up-regulated both inhibitory FcgRIIb and activating FcgRs (FcgRIII and FcgRIV). Because the presence of sHA-Ig with LPS (LPS+sHA-Ig) did not alter FcgRs expression in macrophages when compared with LPS alone, the reduced macrophage functions in LPS+sHA-Ig over LPS alone might be due to the higher binding affinity of inhibitory FcgRIIb compared with activating FcgRs.26,50 Indeed, the anti-inflammatory effect of sHA-Ig could not be demonstrated in LPS-activated FcgRIIb-/- macrophages, implying an influence of inhibitory FcgRIIb signaling on the mechanism of sHA-Ig-mediated anti-inflammation.26
On the other hand, the lower glycolysis activity of LPS+sHA-Ig macrophages than LPS-activated macrophages might directly reduce supernatant cytokines due to the glycolysis-dependent cytokine production of macrophages.2–4 Although sHA-Ig induced more prominent glycolysis activity than LPS, cytokine production after sHA-Ig activation was lower than LPS stimulation, suggesting the energy utilization for other macrophage activities (such as phagocytosis) during FcgRs stimulation. The excessive cytokine production induces reactive oxygen species (ROS), the pro-inflammatory NFκB stimulators51,52 promoting pathogen degradation53,54 through the sustained activity of kinase enzymes,55 that cause the unnecessary hyper-inflammation during sepsis.56 Hence, the reduced metabolism in LPS+sHA-Ig macrophages might also attenuate sepsis hyper-inflammation through a decrease in ROS production.51,52 Indeed, the proteomic analysis on LPS+sHA-Ig-activated macrophages compared with LPS stimulation alone supported the reduced macrophage functions in several pathways, including cell energy production (glycolysis, mitochondrial tricarboxylic acid cycle, and fatty acid synthesis) and phagocytosis activity. Additionally, the reduced ROS production in LPS+sHA-Ig macrophages was demonstrated by the up-regulation of metallothionein 1 (Mt1) and Mt2 (ROS neutralizers59) and the down-regulation of 1) three from five subunits of phagocytic NADPH oxidase (Cybb, Ncf1, and Ncf4) (a ROS producer) and 2) tyrosine-protein kinase with Gardner-Rasheed feline sarcoma viral (v-fgr) oncogene homolog (Fgr)58 (a regulator of complex I and complex II electron transport chain57). Then, the presence of adaptive immunity decreased the hyper-responsiveness of sepsis through several mechanisms, including cell energy reduction and decreased ROS production. Hence, taking advantage of innate immunity control by adaptive immunity using IVIG administration is interesting for attenuation of sepsis hyper-immune responses.
Intravenous Immunoglobulin as an Adjuvant Sepsis Treatment – An Ongoing Debate
Human-derived intravenous immunoglobulin (IVIG) was employed in CLP mice as a proof of concept for innate immunity control by adaptive immune responses, taking advantage of the cross-species immunological responses of IVIG between humans and rodents.35–39 Similar to sHA-Ig impacts on macrophages, IVIG attenuated sepsis severity (survival rate, serum cytokines, and organ injuries) and reduced dendritic cells in the spleen supporting IVIG-attenuated rodent sepsis as previously published.33,34 Although our findings suggested that adaptive immunity can be used to counteract hyper-responsive innate immunity in sepsis, several limitations should be mentioned. First, only male mice were used in our experiments and the effect of sepsis due to the gender difference is also possible. Second, IVIG was tested by the human-derived immunoglobulin that might be partly affected by the cross-species reactions, different from the real clinical situation. However, IVIG might be beneficial in sepsis with some specific situations that might be identified by a proper set of multiple biomarkers, despite a debate on IVIG clinical utilization for sepsis.31,32 For example, patients with low microbial burdens (antibiotics effect) and elevated IL-6 (innate immune hyper-responsiveness60) without immune exhaustion (HLA-DR and PD-1) might benefit from IVIG. Because IVIG anti-inflammatory effect might be harmful in patients with sepsis immune paralysis,61–64 the translation to human should be done with caution. More importantly, other adaptive immune activation strategies, such as CD4+ T cell activation65 and dendritic cell stimulation,66,67 might also be beneficial in controlling sepsis hyper-immune responsiveness. More studies on these topics are interesting.
Conclusion
The exploration on CLP survivor mice, immunoglobulin on LPS-activated macrophages and IVIG test in CLP mice supported an impact of immunoglobulin in attenuation of sepsis immune hyper-responsiveness partly through the reduced macrophage energy and the interference on several cell processes. Despite the controversial opinions concerning IVIG’s use in sepsis, IVIG might be beneficial in sepsis with some specific situations. More studies are warranted.
Acknowledgments
This research was supported by Chulalongkorn University through Fundamental Fund 2565 (AL), and National Research Council of Thailand (grant number NRCT5-RGJ63001) and (NRCT-N41A640076) with NSRF via the Program Management Unit for Human Resources & Institutional Development, Research and Innovation. J.M. was supported by TRF, International Network for Lupus Research, Thailand (IRN59W0004). A.T. was supported by Unit of Excellence of research and development in medicinal plants for treatment and prevention of non-communicable diseases, University of Phayao (FF64-UoE020).
Disclosure
The authors report no conflicts of interest in this work.
References
1. Singer M, Deutschman CS, Seymour CW, et al. The third international consensus definitions for sepsis and septic shock (Sepsis-3). JAMA. 2016;315(8):801–810. doi:10.1001/jama.2016.0287
2. Dang CP, Issara-Amphorn J, Charoensappakit A, et al. BAM15, a mitochondrial uncoupling agent, attenuates inflammation in the LPS injection mouse model: an adjunctive anti-inflammation on macrophages and hepatocytes. J Innate Immun. 2021;13(6):359–375. doi:10.1159/000516348
3. Dang CP, Leelahavanichkul A. Over-expression of miR-223 induces M2 macrophage through glycolysis alteration and attenuates LPS-induced sepsis mouse model, the cell-based therapy in sepsis. PLoS One. 2020;15(7):e0236038. doi:10.1371/journal.pone.0236038
4. Nedeva C, Menassa J, Puthalakath H. Sepsis: inflammation is a necessary evil. Front Cell Dev Biol. 2019;7:108. doi:10.3389/fcell.2019.00108
5. Drewry AM, Ablordeppey EA, Murray ET, et al. Monocyte function and clinical outcomes in febrile and afebrile patients with severe sepsis. Shock. 2018;50(4):381–387. doi:10.1097/SHK.0000000000001083
6. Murray PJ. Macrophage Polarization. Annu Rev Physiol. 2017;79(1):541–566. doi:10.1146/annurev-physiol-022516-034339
7. Taratummarat S, Sangphech N, Vu CTB, et al. Gold nanoparticles attenuates bacterial sepsis in cecal ligation and puncture mouse model through the induction of M2 macrophage polarization. BMC Microbiol. 2018;18(1):85. doi:10.1186/s12866-018-1227-3
8. Hotchkiss RS, Opal SM. Activating immunity to fight a foe — a new path. N Eng J Med. 2020;382(13):1270–1272. doi:10.1056/NEJMcibr1917242
9. Hamidzadeh K, Christensen SM, Dalby E, Chandrasekaran P, Mosser DM. Macrophages and the recovery from acute and chronic inflammation. Annu Rev Physiol. 2017;79(1):567–592. doi:10.1146/annurev-physiol-022516-034348
10. Palm NW, Medzhitov R. Not so fast: adaptive suppression of innate immunity. Nat Med. 2007;13(10):1142–1144. doi:10.1038/nm1007-1142b
11. Shanker A. Adaptive control of innate immunity. Immunol Lett. 2010;131(2):107–112. doi:10.1016/j.imlet.2010.04.002
12. Sae-Khow K, Charoensappakit A, Visitchanakun P, et al. Pathogen-associated molecules from gut translocation enhance severity of cecal ligation and puncture sepsis in iron-overload β-thalassemia mice. J Inflamm Res. 2020;13:719–735. doi:10.2147/JIR.S273329
13. Panpetch W, Sawaswong V, Chanchaem P, et al. Candida administration worsens cecal ligation and puncture-induced sepsis in obese mice through gut dysbiosis enhanced systemic inflammation, impact of pathogen-associated molecules from gut translocation and saturated fatty acid. Front Immunol. 2020;11:561652. doi:10.3389/fimmu.2020.561652
14. Issara-Amphorn J, Chancharoenthana W, Visitchanakun P, Leelahavanichkul A. Syk inhibitor attenuates polymicrobial sepsis in fcgriib-deficient lupus mouse model, the impact of lupus characteristics in sepsis. J Innate Immun. 2020;12(6):461–479. doi:10.1159/000509111
15. Visitchanakun P, Tangtanatakul P, Trithiphen O, et al. Plasma miR-370-3P as a biomarker of sepsis-associated encephalopathy, the transcriptomic profiling analysis of microRNA-arrays from mouse brains. Shock. 2020;54:3. doi:10.1097/SHK.0000000000001473
16. Surawut S, Makjaroen J, Thim-uam A, et al. Increased susceptibility against Cryptococcus neoformans of lupus mouse models (pristane-induction and FcGRIIb deficiency) is associated with activated macrophage, regardless of genetic background. J Microbiol. 2019;57(1):45–53. doi:10.1007/s12275-019-8311-8
17. Thim-uam A, Surawut S, Issara-Amphorn J, et al. Leaky-gut enhanced lupus progression in the Fc gamma receptor-IIb deficient and pristane-induced mouse models of lupus. Sci Rep. 2020;10(1):777. doi:10.1038/s41598-019-57275-0
18. Visitchanakun P, Saisorn W, Wongphoom J, et al. Gut leakage enhances sepsis susceptibility in iron-overloaded β-thalassemia mice through macrophage hyperinflammatory responses. Am J Physiol Gastrointestinal Liver Physiol. 2020;318(5):G966–G979. doi:10.1152/ajpgi.00337.2019
19. Leelahavanichkul A, Yasuda H, Doi K, et al. Methyl-2-acetamidoacrylate, an ethyl pyruvate analog, decreases sepsis-induced acute kidney injury in mice. Am J Physiol Renal Physiol. 2008;295(6):F1825–F1835. doi:10.1152/ajprenal.90442.2008
20. Jaroonwitchawan T, Visitchanakun P, Dang PC, Ritprajak P, Palaga T, Leelahavanichkul A. Dysregulation of Lipid Metabolism in Macrophages Is Responsible for Severe Endotoxin Tolerance in FcgRIIB-Deficient Lupus Mice. Front Immunol. 2020;11:959. doi:10.3389/fimmu.2020.00959
21. Yang D, Elner SG, Bian Z-M, Till GO, Petty HR, Elner VM. Pro-inflammatory cytokines increase reactive oxygen species through mitochondria and NADPH oxidase in cultured RPE cells. Exp Eye Res. 2007;85(4):462–472. doi:10.1016/j.exer.2007.06.013
22. Hsu H-Y, Wen M-H. Lipopolysaccharide-mediated reactive oxygen species and signal transduction in the regulation of interleukin-1 gene expression. J Biol Chem. 2002;277(25):22131–22139. doi:10.1074/jbc.M111883200
23. Bhunyakarnjanarat T, Udompornpitak K, Saisorn W, et al. Prominent indomethacin-induced enteropathy in fcgriib deficient lupus mice: an impact of macrophage responses and immune deposition in gut. Int J Mol Sci. 2021;22(3):1377. doi:10.3390/ijms22031377
24. Saisorn W, Saithong S, Phuengmaung P, et al. Acute kidney injury induced lupus exacerbation through the enhanced neutrophil extracellular traps (and apoptosis) in Fcgr2b deficient lupus mice with renal ischemia reperfusion injury. Front Immunol. 2021;12:2336. doi:10.3389/fimmu.2021.669162
25. Boes M, Prodeus AP, Schmidt T, Carroll MC, Chen J, Critical A. Role of natural immunoglobulin M in immediate defense against systemic bacterial infection. J Exp Med. 1998;188(12):2381–2386. doi:10.1084/jem.188.12.2381
26. Bournazos S, Ravetch JV. Fcγ receptor function and the design of vaccination strategies. Immunity. 2017;47(2):224–233. doi:10.1016/j.immuni.2017.07.009
27. Kozicky LK, Zhao ZY, Menzies SC, et al. Intravenous immunoglobulin skews macrophages to an anti-inflammatory, IL-10-producing activation state. J Leukoc Biol. 2015;98(6):983–994. doi:10.1189/jlb.3VMA0315-078R
28. Akyol GY, Manaenko A, Akyol O, et al. IVIG activates FcγRIIB-SHIP1-PIP3 pathway to stabilize mast cells and suppress inflammation after ICH in mice. Sci Rep. 2017;7(1):15583. doi:10.1038/s41598-017-15455-w
29. Voigt A, Rahnefeld A, Kloetzel P, Krüger E. Cytokine-induced oxidative stress in cardiac inflammation and heart failure—how the ubiquitin proteasome system targets this vicious cycle. Front Physiol. 2013;4(42). doi:10.3389/fphys.2013.00042
30. Mittal M, Siddiqui MR, Tran K, Reddy SP, Malik AB. Reactive oxygen species in inflammation and tissue injury. Antioxid Redox Signal. 2014;20(7):1126–1167. doi:10.1089/ars.2012.5149
31. Alejandria MM, Lansang MAD, Dans LF, Mantaring Iii JB. Intravenous immunoglobulin for treating sepsis, severe sepsis and septic shock. Cochrane Database Sys Rev. 2013;(9). doi:10.1002/14651858.CD001090.pub2.
32. Yang Y, Yu X, Zhang F, Xia Y. Evaluation of the effect of intravenous immunoglobulin dosing on mortality in patients with sepsis: a network meta-analysis. Clin Ther. 2019;41(9):1823–1838.e1824. doi:10.1016/j.clinthera.2019.06.010
33. Ozcan PE, Senturk E, Orhun G, et al. Effects of intravenous immunoglobulin therapy on behavior deficits and functions in sepsis model. Ann Intensive Care. 2015;5(1):62. doi:10.1186/s13613-015-0062-z
34. Esen F, Orhun G, Ozcan PE, et al. Neuroprotective effects of intravenous immunoglobulin are mediated through inhibition of complement activation and apoptosis in a rat model of sepsis. Intensive Care Med Exp. 2017;5(1):1. doi:10.1186/s40635-016-0114-1
35. St-Amour I, Bousquet M, Paré I, et al. Impact of intravenous immunoglobulin on the dopaminergic system and immune response in the acute MPTP mouse model of Parkinson’s disease. J Neuroinflammation. 2012;9(1):234. doi:10.1186/1742-2094-9-234
36. Puli L, Pomeshchik Y, Olas K, Malm T, Koistinaho J, Tanila H. Effects of human intravenous immunoglobulin on amyloid pathology and neuroinflammation in a mouse model of Alzheimer’s disease. J Neuroinflammation. 2012;9(1):105. doi:10.1186/1742-2094-9-105
37. Magga J, Puli L, Pihlaja R, et al. Human intravenous immunoglobulin provides protection against Aβ toxicity by multiple mechanisms in a mouse model of Alzheimer’s disease. J Neuroinflammation. 2010;7(1):90. doi:10.1186/1742-2094-7-90
38. Leontyev D, Katsman Y, Branch DR. Mouse background and IVIG dosage are critical in establishing the role of inhibitory Fcγ receptor for the amelioration of experimental ITP. Blood. 2012;119(22):5261–5264. doi:10.1182/blood-2012-03-415695
39. Thomson C, Wang Y, Jackson L, et al. Pandemic H1N1 influenza infection and vaccination in humans induces cross-protective antibodies that target the hemagglutinin stem. Front Immunol. 2012;3:87. doi:10.3389/fimmu.2012.00087
40. Leelahavanichkul A, Worasilchai N, Wannalerdsakun S, et al. Gastrointestinal leakage detected by serum (1→3)-β-D-glucan in mouse models and a pilot study in patients with sepsis. Shock. 2016;46(5):506–518. doi:10.1097/SHK.0000000000000645
41. Issara-Amphorn J, Dang CP, Saisorn W, Limbutara K, Leelahavanichkul A. Candida administration in bilateral nephrectomy mice elevates serum (1→3)-β-D-glucan that enhances systemic inflammation through energy augmentation in macrophages. Int J Mol Sci. 2021;22(9):5031. doi:10.3390/ijms22095031
42. Munshi HG, Montgomery RB. Severe neutropenia: a diagnostic approach. West J Med. 2000;172(4):248–252. doi:10.1136/ewjm.172.4.248
43. Cao C, Yu M, Chai Y. Pathological alteration and therapeutic implications of sepsis-induced immune cell apoptosis. Cell Death Dis. 2019;10(10):782. doi:10.1038/s41419-019-2015-1
44. Stebegg M, Kumar SD, Silva-Cayetano A, Fonseca VR, Linterman MA, Graca L. Regulation of the germinal center response. Front Immunol. 2018;9:2469. doi:10.3389/fimmu.2018.02469
45. Kotas ME, Matthay MA. Mesenchymal stromal cells and macrophages in sepsis: new insights. Eur Respir J. 2018;51(4):1800510. doi:10.1183/13993003.00510-2018
46. Qiu P, Liu Y, Zhang J. Review: the role and mechanisms of macrophage autophagy in sepsis. Inflammation. 2019;42(1):6–19. doi:10.1007/s10753-018-0890-8
47. Mallat J, Leone S, Cascella M, Fiore M. Should endotoxin be a research priority in Gram-negative sepsis and septic shock? Expert Rev Clin Pharmacol. 2019;12(8):697–699. doi:10.1080/17512433.2019.1627871
48. Amornphimoltham P, Yuen PST, Star RA, Leelahavanichkul A. Gut leakage of fungal-derived inflammatory mediators: part of a gut-liver-kidney axis in bacterial sepsis. Dig Dis Sci. 2019;64(9):2416–2428. doi:10.1007/s10620-019-05581-y
49. Ptak W, Paliwal V, Bryniarski K. Aggregated immunoglobulin protects immune T cells from suppression: dependence on isotype, Fc portion, and macrophage FcγR. Scand J Immunol. 1998;47(2):136–145. doi:10.1046/j.1365-3083.1998.00264.x
50. Ben Mkaddem S, Benhamou M, Monteiro RC. Understanding Fc receptor involvement in inflammatory diseases: from mechanisms to new therapeutic tools. Front Immunol. 2019;10:811. doi:10.3389/fimmu.2019.00811
51. Morgan MJ, Liu Z-G. Crosstalk of reactive oxygen species and NF-κB signaling. Cell Res. 2011;21(1):103–115. doi:10.1038/cr.2010.178
52. Lingappan K. NF-κB in oxidative stress. Curr Opin Toxicol. 2018;7:81–86. doi:10.1016/j.cotox.2017.11.002
53. Herb M, Schramm M. Functions of ROS in macrophages and antimicrobial immunity. Antioxidants. 2021;10(2):313. doi:10.3390/antiox10020313
54. Fang FC. Antimicrobial actions of reactive oxygen species. mBio. 2011;2(5). doi:10.1128/mBio.00141-11
55. Meng T-C, Fukada T, Tonks NK. Reversible oxidation and inactivation of protein tyrosine phosphatases in vivo. Mol Cell. 2002;9(2):387–399. doi:10.1016/S1097-2765(02)00445-8
56. Victor MV, Juan VE, Antonio H-M, Milagros R. Oxidative stress and mitochondrial dysfunction in sepsis: a potential therapy with mitochondria-targeted antioxidants. Infect Disorders Drug Targets. 2009;9(4):376–389. doi:10.2174/187152609788922519
57. Quinlan CL, Orr AL, Perevoshchikova IV, Treberg JR, Ackrell BA, Brand MD. Mitochondrial complex II can generate reactive oxygen species at high rates in both the forward and reverse reactions. J Biol Chem. 2012;287(32):27255–27264. doi:10.1074/jbc.M112.374629
58. Acín-Pérez R, Carrascoso I, Baixauli F, et al. ROS-triggered phosphorylation of complex ii by Fgr kinase regulates cellular adaptation to fuel use. Cell Metab. 2014;19(6):1020–1033. doi:10.1016/j.cmet.2014.04.015
59. Ruttkay-Nedecky B, Nejdl L, Gumulec J, et al. The role of metallothionein in oxidative stress. Int J Mol Sci. 2013;14(3). doi:10.3390/ijms14036044.
60. Song J, Park DW, Moon S, et al. Diagnostic and prognostic value of interleukin-6, pentraxin 3, and procalcitonin levels among sepsis and septic shock patients: a prospective controlled study according to the Sepsis-3 definitions. BMC Infect Dis. 2019;19(1):968. doi:10.1186/s12879-019-4618-7
61. Venet F, Monneret G. Advances in the understanding and treatment of sepsis-induced immunosuppression. Nat Rev Nephrol. 2018;14(2):121–137. doi:10.1038/nrneph.2017.165
62. Chen R, Zhou L. PD-1 signaling pathway in sepsis: does it have a future? Clin Immunol. 2021;229:108742. doi:10.1016/j.clim.2021.108742
63. Vu CTB, Thammahong A, Leelahavanichkul A, Ritprajak P. Alteration of macrophage immune phenotype in a murine sepsis model is associated with susceptibility to secondary fungal infection. Asian Pac J Allergy Immunol. 2019. doi:10.12932/AP-170519-0565
64. Ondee T, Jaroonwitchawan T, Pisitkun T, et al. Decreased protein kinase C-β Type II associated with the prominent endotoxin exhaustion in the macrophage of FcGRIIb−/− Lupus prone mice is revealed by phosphoproteomic analysis. Int J Mol Sci. 2019;20(6):1354. doi:10.3390/ijms20061354
65. Martin MD, Badovinac VP, Griffith TS. CD4 T cell responses and the sepsis-induced immunoparalysis state. Front Immunol. 2020;11:1364. doi:10.3389/fimmu.2020.01364
66. Wu -D-D, Li T, Ji X-Y. Dendritic cells in sepsis: pathological alterations and therapeutic implications. J Immunol Res. 2017;2017:3591248. doi:10.1155/2017/3591248
67. Bouras M, Asehnoune K, Roquilly A. Contribution of dendritic cell responses to sepsis-induced immunosuppression and to susceptibility to secondary pneumonia. Front Immunol. 2018;9(2590):548. doi:10.3389/fimmu.2018.02590
 © 2021 The Author(s). This work is published and licensed by Dove Medical Press Limited. The full terms of this license are available at https://www.dovepress.com/terms.php and incorporate the Creative Commons Attribution - Non Commercial (unported, v3.0) License.
By accessing the work you hereby accept the Terms. Non-commercial uses of the work are permitted without any further permission from Dove Medical Press Limited, provided the work is properly attributed. For permission for commercial use of this work, please see paragraphs 4.2 and 5 of our Terms.
© 2021 The Author(s). This work is published and licensed by Dove Medical Press Limited. The full terms of this license are available at https://www.dovepress.com/terms.php and incorporate the Creative Commons Attribution - Non Commercial (unported, v3.0) License.
By accessing the work you hereby accept the Terms. Non-commercial uses of the work are permitted without any further permission from Dove Medical Press Limited, provided the work is properly attributed. For permission for commercial use of this work, please see paragraphs 4.2 and 5 of our Terms.