")
Back to Journals » Diabetes, Metabolic Syndrome and Obesity » Volume 12
A Comparative Prevalence Of Metabolic Syndrome Among Type 2 Diabetes Mellitus Patients In Hawassa University Comprehensive Specialized Hospital Using Four Different Diagnostic Criteria
Authors Bizuayehu Wube T , Mohammed Nuru M , Tesfaye Anbese A
Received 1 July 2019
Accepted for publication 6 September 2019
Published 19 September 2019 Volume 2019:12 Pages 1877—1887
DOI https://doi.org/10.2147/DMSO.S221429
Checked for plagiarism Yes
Review by Single anonymous peer review
Peer reviewer comments 2
Editor who approved publication: Dr Konstantinos Tziomalos
Temesgen Bizuayehu Wube,1 Metsihet Mohammed Nuru,2 Adane Tesfaye Anbese3
1School of Medical Laboratory Science, College of Medicine and Health Sciences, Hawassa University, Hawassa, Ethiopia; 2Hawassa University Comprehensive Specialized Hospital, Hawassa, Ethiopia; 3Department of Public Health, School of Public Health, College of Medicine and Health Science, Dilla University, Dilla, Ethiopia
Correspondence: Temesgen Bizuayehu Wube
School of Medical Laboratory Science, College of Medicine and Health Sciences, Hawassa University, P.O. Box:1560, Hawassa, Ethiopia
Tel +251 916604551
Email [email protected]
Background: Recognition of MetS in type two diabetic patients is important in starting the appropriate preventive and therapeutic measures. The commonly used definitions of MetS have similarities and discrepancies. Different definitions defined metabolic syndrome differently. IDF, WHO, NCEP-ATP III, and the harmonized definitions were used frequently to determine the prevalence of metabolic syndrome.
Objectives: This study was aimed to investigate the prevalence of MetS and its associated factors among patients with type 2 Diabetes Mellitus using four definitions and to identify the concordance and the difference of these four definitions.
Methods: A cross-sectional study was conducted from February 28 to May 30/2017 at Hawassa university comprehensive specialized hospital. The study involved 314 study participants selected by simple random sampling technique. Logistic regression was used to determine associated factors of metabolic syndrome, and kappa statistics was used to determine the concordance between different definitions of metabolic syndrome. In any cases, a p-value of <0.05 was considered to be statistically significant.
Result: The prevalence of metabolic syndrome according to IDF, WHO, harmonized, and NCEP-ATP III diagnostic criteria was 59.9%, 31.2%, 65.6%, and 70.1%, respectively. Our study found the maximum agreement between IDF and NCEP criteria (K=0.54, P<0.001) and IDF and Harmonized(K=0.65, P<0.001). Uric acid level was associated factor of metabolic syndrome by all the four definitions, and total cholesterol was associated factors by the three definitions.
Conclusion: The prevalence of metabolic syndrome varies based on the definition used and the highest prevalence of MetS was observed with NCEP-ATP III and the different types of criteria do not always diagnose the same group of individuals.
Keywords: type 2 DM, metabolic syndrome, Hawassa, Ethiopia
Introduction
Diabetes mellitus (DM) is a group of metabolic disorders characterized by hyperglycemia resulting from defects in insulin secretion, insulin action, or both.1 Diabetes is an important cause of blindness, kidney failure, lower limb amputation, and other long-term consequences that impact significantly on the quality of life.2 Type 2 Diabetes mellitus (T2DM) is the major type of diabetes that increased the morbidities from non-communicable disease and lead to a different form of complication.
Metabolic syndrome (MetS) refers to a constellation of metabolic risk factors which includes elevated waist circumstance, insulin resistance, elevated triglyceride (TG) levels, decreased high-density lipoprotein cholesterol levels (HDL-C), and elevated low-density lipoprotein cholesterol (LDL-C) levels.3–5 T2DM are often manifestations of MetS.6 The syndrome directly contributes to the appearance of T2DM and it is one of the main contributors of death from atherosclerosis among these patients.7 MetS was highly prevalent in patients with T2DM compared to non-diabetic cases.8,9
Nowadays, there are different institutions that set different diagnostic criteria for MetS worldwide. These include the criteria by the World Health Organization (WHO), the National Cholesterol Education Program Adult Treatment Panel III (NCEP-ATP III), the harmonized criteria, and the International Diabetes Federation (IDF). The institutions have their own general agreement on the main component of the MetS but they differ based on the mandatory inclusion criteria.
The difference in the definition of MetS led to difference in the prevalence of MetS even within the same population. This difference was observed in different studies of T2DM patients from African countries.10,11 According to a study from sub-Saharan Africa, the prevalence of MetS in T2DM by the IDF and NCEP-ATP III diagnostic criteria was 71.7% and 60.4%, respectively.10 This variation can have potentially undesirable consequences for risk stratification and prioritization of patients for preventive treatment. For instance, a patient may be denied such treatment on the basis of one set of criteria, while he would be eligible using a different set of criteria. The diagnosis of MetS in such patients is very important, and leads to a better disease control and prevention of cardiovascular complications.
Because the difference in the selection of criteria may lead to an unwanted complication, observing the difference between the criteria’s may help to identify which MetS definition is the best for the study area population. It may also aid physicians to identify which method to use and may help minimize the risk for cardiovascular disorder. The aim of the present study was, therefore, to see the prevalence of MetS among T2DM patients and its associated factor at Hawassa university comprehensive specialized hospital (HUCSH) diabetic clinic based on four worldwide recognized criteria and assess the concordance between these definitions.
Methods And Materials
Study Setting And Design
This was a cross-sectional study conducted at Hawassa University comprehensive specialized Hospital (HUCSH) from February 28 to May 30/2017. HUCSH was established in November 2006 and is providing service for more than 15 million people of the region. Currently, the hospital has over 400 beds and offers services at general and specialty level. It has also established diabetic clinic.
Study Population
All T2DM patients attending HUCSH diabetic clinic were source population. Those T2DM patients visiting HUCSH diabetic clinic during the study period and selected based on inclusion criteria were considered as study participants. The minimum sample size required was calculated using a single population proportion formula. There are 1323 registered DM patients at HUCSH, of whom 1015 were T2DM and the remaining were type 1 diabetes mellitus. A random sampling technique, in which every member of the study participants equally likely to be selected, was used to select 319 T2DM subjects by lottery method from 982 active T2DM patients. Those patients who had been taking blood lipid-lowering therapy, pregnant women, patients suffering from thyroid dysfunction, excessive alcohol or other drug abuse taker, current psychiatric treatment, and contraceptive users were excluded from the study.
Data Collection Instruments And Procedure
Socio-demographic, Clinical, And Related Data Collection
Socio-demographic, clinical, and anthropometric information were collected by using a structured questionnaire by the trained data collector. It was prepared first in the English version and translated to Amharic and back to English to confirm the correctness of the translation. A detailed review of the medical records was also done.
The WHO guideline manual12 was followed for Anthropometric data such as, weight and height, collection. Body mass index (BMI=kg/M2) was calculated as weight in kilogram divided by height square in meter. Mercury-based sphygmomanometer was used to measure systolic blood pressure (SBP) and diastolic blood pressure (DBP) after the participants had rested for more than 10 mins. For those study participants with an SBP ≥ 140 mm of mercury (mmHg) and a DBP ≥ 90 mmHg, blood pressure was repeated and finally, the average value was taken.
Blood Specimen Collection And Sample Analysis
Five milliliters (mL) of venous blood was collected from each study participants after overnight fasting. Then, the blood specimen was allowed to stay for 20–30 mins for clot formation. The specimen was then centrifuged at 3000 revolutions per minute (rpm) and the serum was separated from the whole blood. Finally, A25™ Biosystem random access chemistry analyzer (linear chemicals, Montgat, Spain) was used to analyze the serum for HDL-C, LDL-C, triglycerides (TGs), total cholesterol, uric acid, and fasting blood sugar. All the lipid profile tests were measured by the enzymatic method directly.
Data Processing And Analysis
All data were checked for consistency and completeness visually, and coded and entered into Epidata version 3.4. Statistical data analysis was done using SPSS version 20.0. Descriptive statistics like frequency and percentages were also used to describe data. Categorical variables were expressed as percentages and continuous data as mean (±SD). Bivariate and multivariate logistic regression models were used to assess the statistically significant association between MetS and those independent variables. A p-value of less than 0.25 in the bivariate logistic regression model was moved to multivariate logistic regression to control possible confounder variables. The agreements among the definitions of WHO, IDF, NCEP, and harmonized criteria were assessed with kappa statistics. The level of agreement was categorized as poor with κ ≤0.20, fair with κ =0.21 to 0.40, moderate with κ =0.41 to 0.60, substantial with κ =0.61 to 0.80, and very good with κ >0.80.13 In any cases, a P-value of less than 0.05 was considered as statistically significant.
Definition Of MetS According To Different Criteria
WHO definition: a patient who are T2DM or having Impaired fasting glucose or Impaired glucose tolerance Plus any two of the following: Fasting Plasma Triglycerides ≥150 mg/dL (>1.7 mmol/L); Antihypertensive medication and/or high BP (≥140/90 mmHg); HDL Cholesterol < 35 mg/dL in men or <39 mg/dL in women; Urinary albumin excretion rate >20 mg/min or albumin/Creatinine ratio >30 mg/g.
IDF Definition
Patient who have a waist circumference of ≥94 cm for men and ≥80 cm for women plus two or more of the following: Fasting plasma triglycerides ≥150 mg/dL or on specific medication; Blood pressure of ≥130 systolic or ≥85 mm diastolic or previous diagnosis or on specific medication; HDL cholesterol <40 mg/dL and <50 mg/dL for men and women, respectively, or on specific medication; Fasting plasma glucose >100 mg/dL or previously diagnosed type-2 diabetes.
NCEP ATP-III
Patients who have at least three of the following risk features to be categorized in MetS: abdominal obesity (defined as WC > 102 cm in males and > 88 cm in females); elevated TGs (≥150 mg/dL); low HDL-C (<40 mg/dL in males and <50 mg/dL in females); elevated blood pressure (≥ 130/85 mmHg) and fasting blood sugar (FBS) ≥ 110 mg/dL.
Harmonized: Patients who have at least three of the following risk features to be categorized in MetS: abdominal obesity (defined as WC ≥94 cm in males and ≥80 cm in females); elevated TGs (≥150 mg/dL); low HDL-C (<40 mg/dL in males and <50 mg/dL in females); elevated blood pressure and fasting blood sugar (FBS) >110 mg/dL.
Result
Demographic And Clinical Characteristics Of The Study Participants
A total of 319 study participants were enrolled in this study with a 98.4% response rate and Majority, 67.0% (n = 211) of the study participants were males. The mean age of the study participants was 49.8 ± 9.8 with a range of 30 to 80 years. 51% (n = 159), 88.5% (n = 278), 68.2% (n = 214) study participants were urban dwellers, married and unemployed, respectively. The majority, 82.5% (n = 259) study participants traveled either by public transport or on foot.
175 (55.7%) of the study participants had a DM duration of less than five year and 114 (36.3%) of them had a BMI of between 25 and 29.9 Kg/m2, while 59 (18.8%) of the study participants had a BMI of greater than 30 kg/m2. 80 (25.5%) of them had a raised blood pressure.
Prevalence Of Metabolic Syndrome According To The Four Criteria
The overall prevalence of MetS among the study participants was 59.9%, 31.2%, 65.6%, and 70.1% according to IDF, WHO, harmonized, and NCEP-III diagnostic criteria, respectively. MetS was also prevalent in female, 94.2% vs 32.7%, 43.7 vs 25.1%, 87.4% vs 55.0%, and 70.9% vs 69.7% by IDF, WHO, harmonized and NCEP ATP III diagnostic criteria, respectively, than females (Table 1).
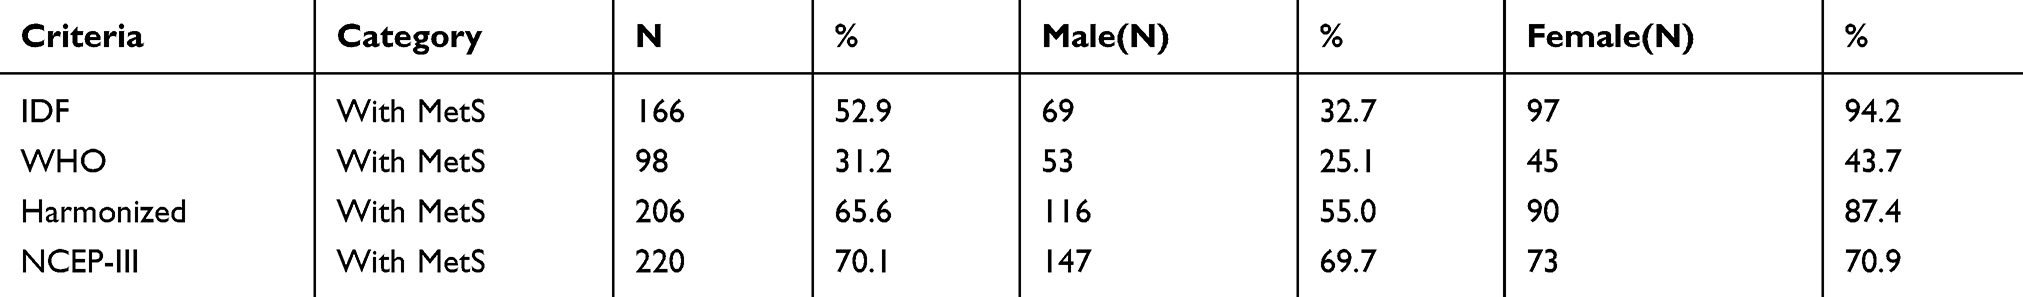 |
Table 1 Prevalence Of MetS According To The Four Different Criteria And Gender At HUCSH, South Ethiopia, From February 28 To May 30/2017 |
Associated Factors Of MetS Among T2DM By The Four Criteria
Logistic regression was used to assess the associated factors of MetS. Accordingly, different associated factor was observed from the four criteria used. From the multivariate analysis, sex (OR=2.7, CI=1.5–4.9, P-value=0.001), age (OR=1.9, CI=1.1–3.2, P-value=0.02), uric acid level (OR=5.5, CI=2.8–10.7, P-Value=<0.0001) and total cholesterol (OR=2, CI=1–4.1, P-Value=0.048) are associated factors of MetS among the study participants according to the harmonized criteria (Table 2) while, regular exercise (OR=2, CI=1.1–3.5, P-value=0.02), uric acid level (OR=5.5, CI=2.8–10.7, P-value=<0.0001), and total cholesterol (OR=2, CI=1.0–4.1, P-value=0.048) were associated with MetS among study participants according to the IDF criteria (Table 3). Marital status, hyperuricemia, and total cholesterol level were associated with MetS by WHO classification criteria (Table 4) and only uric acid level (OR=2.3, CI=1.3–4.2, P-value=0.005) were associated with MetS by NCEP ATP III criteria (Table 5).
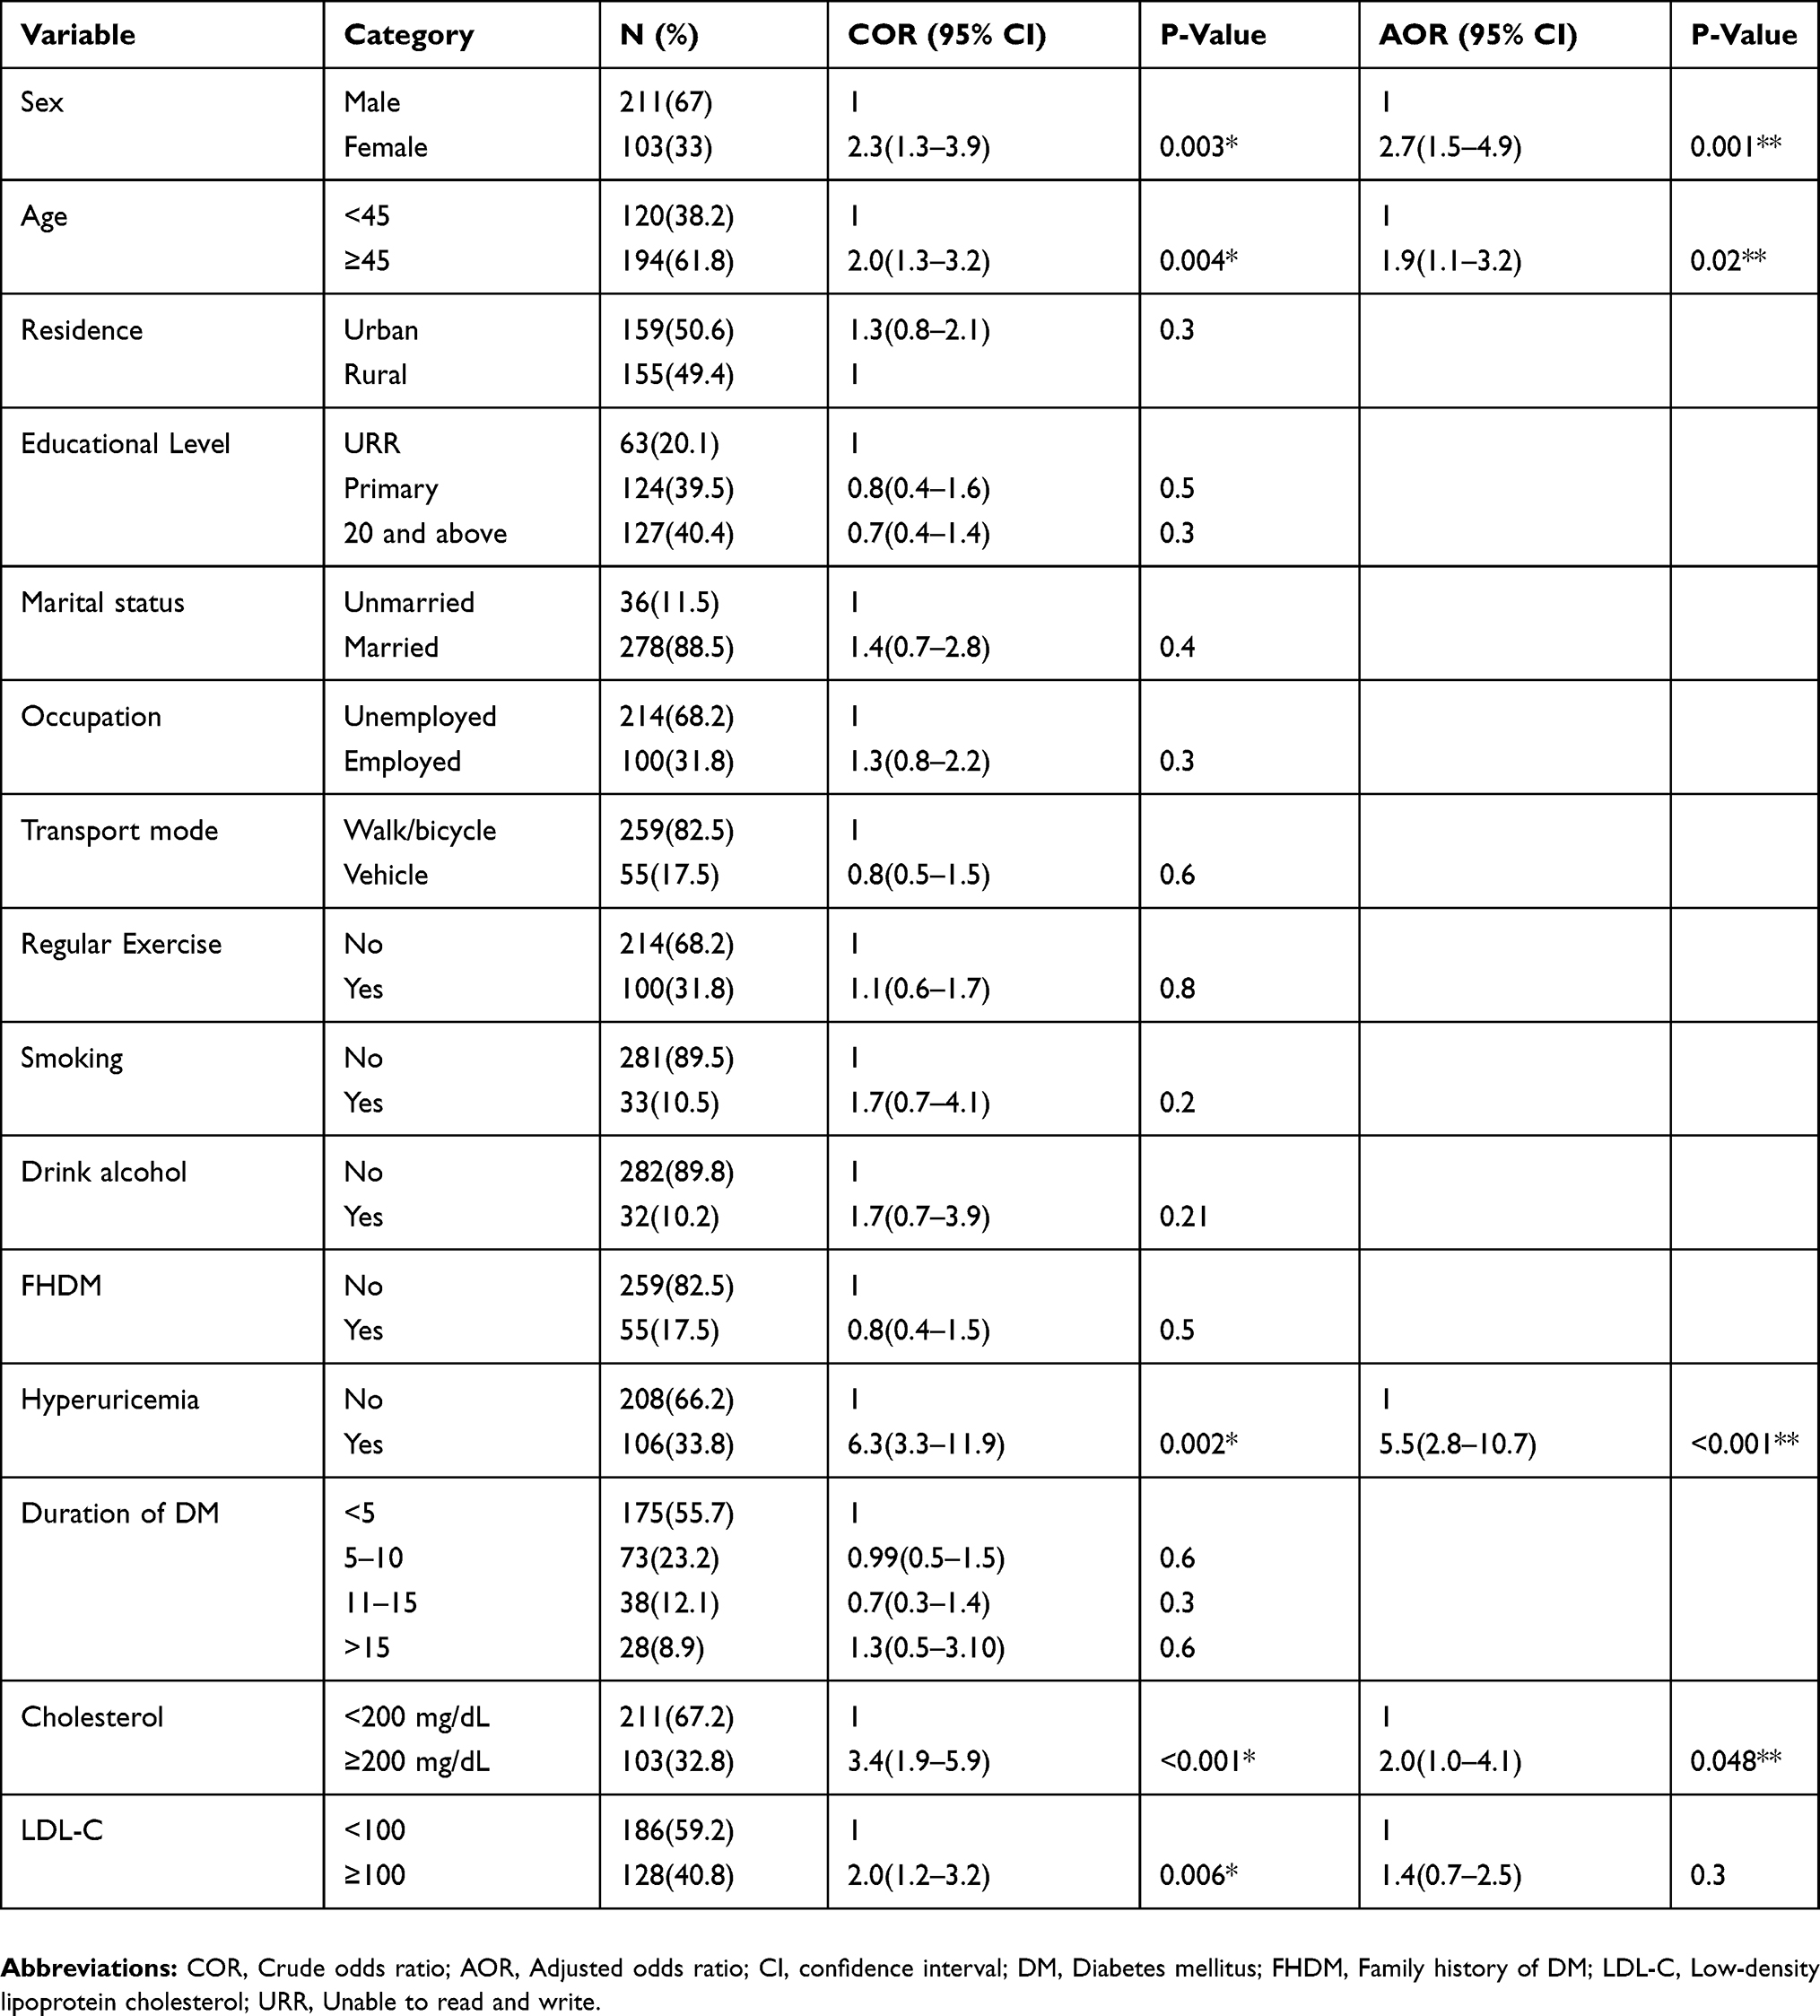 |
Table 2 Associated Factor Of MetS Among T2DM Study Participants At HUCSH, South Ethiopia, According To Harmonized Criteria, From February 28 To May 30/2017 |
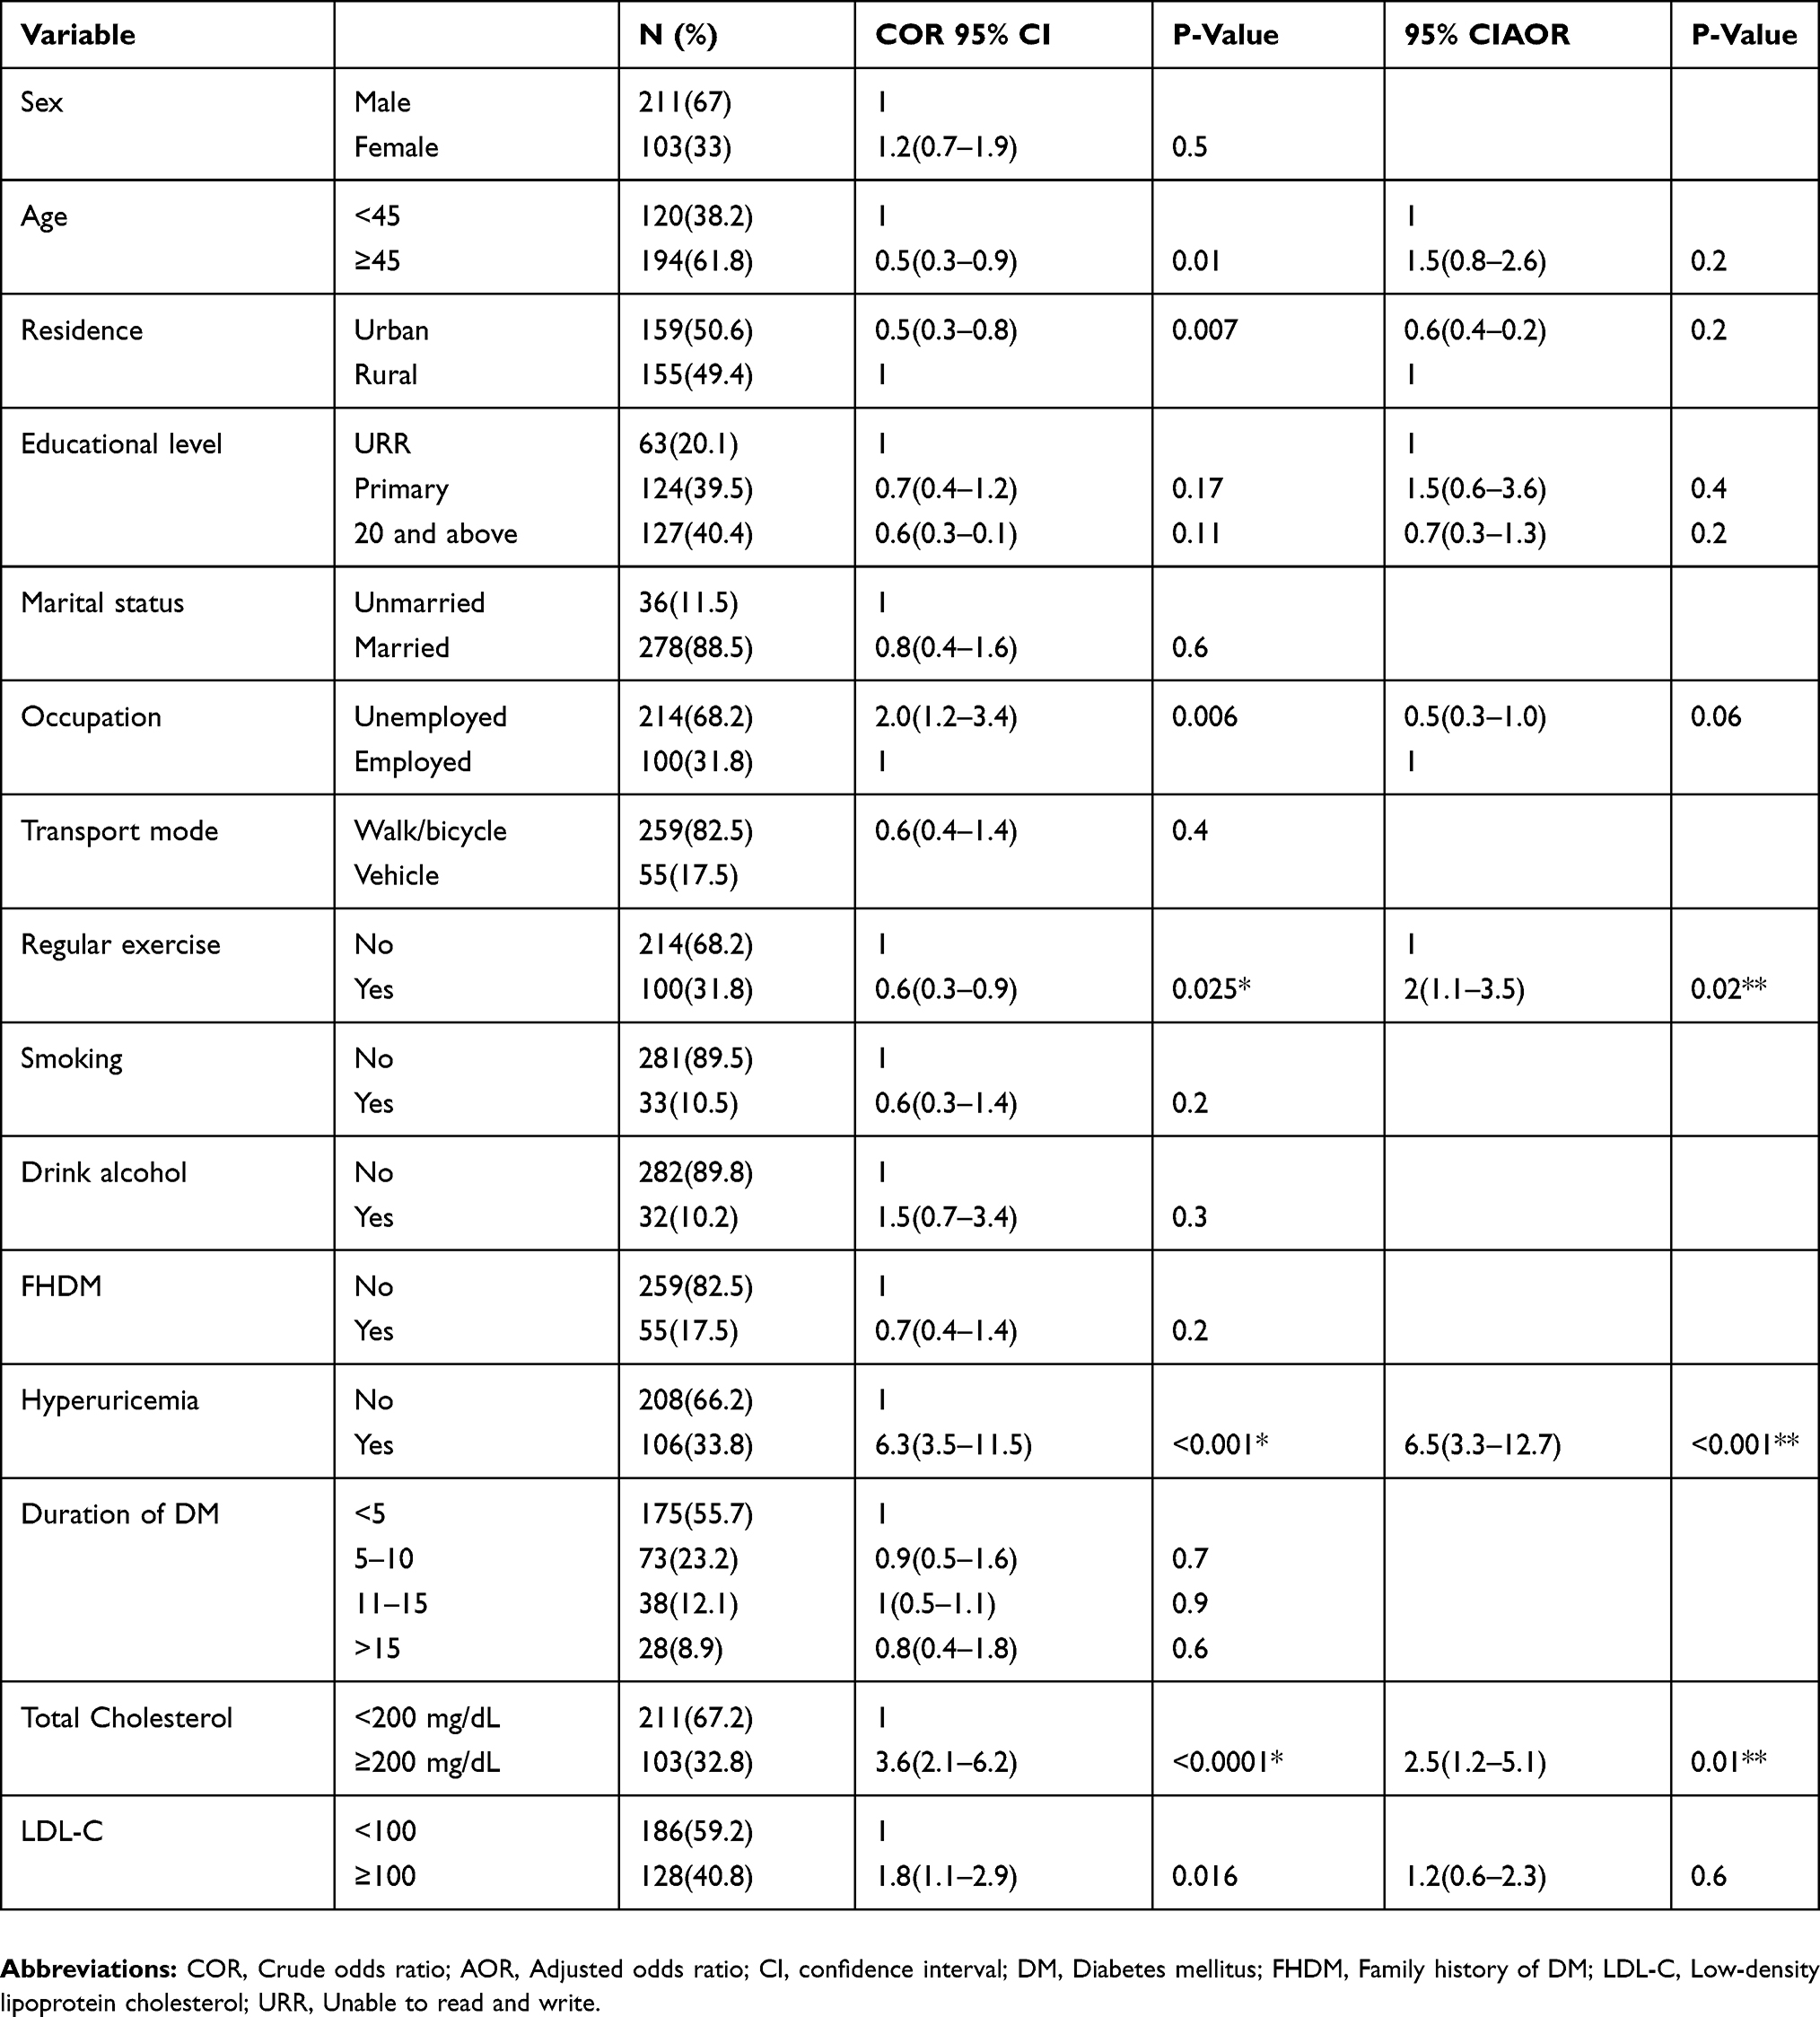 |
Table 3 Associated Factor Of MetS Among T2DM Study Participants At HUCSH, South Ethiopia, According To IDF Criteria, From February 28 To May 30/2017 |
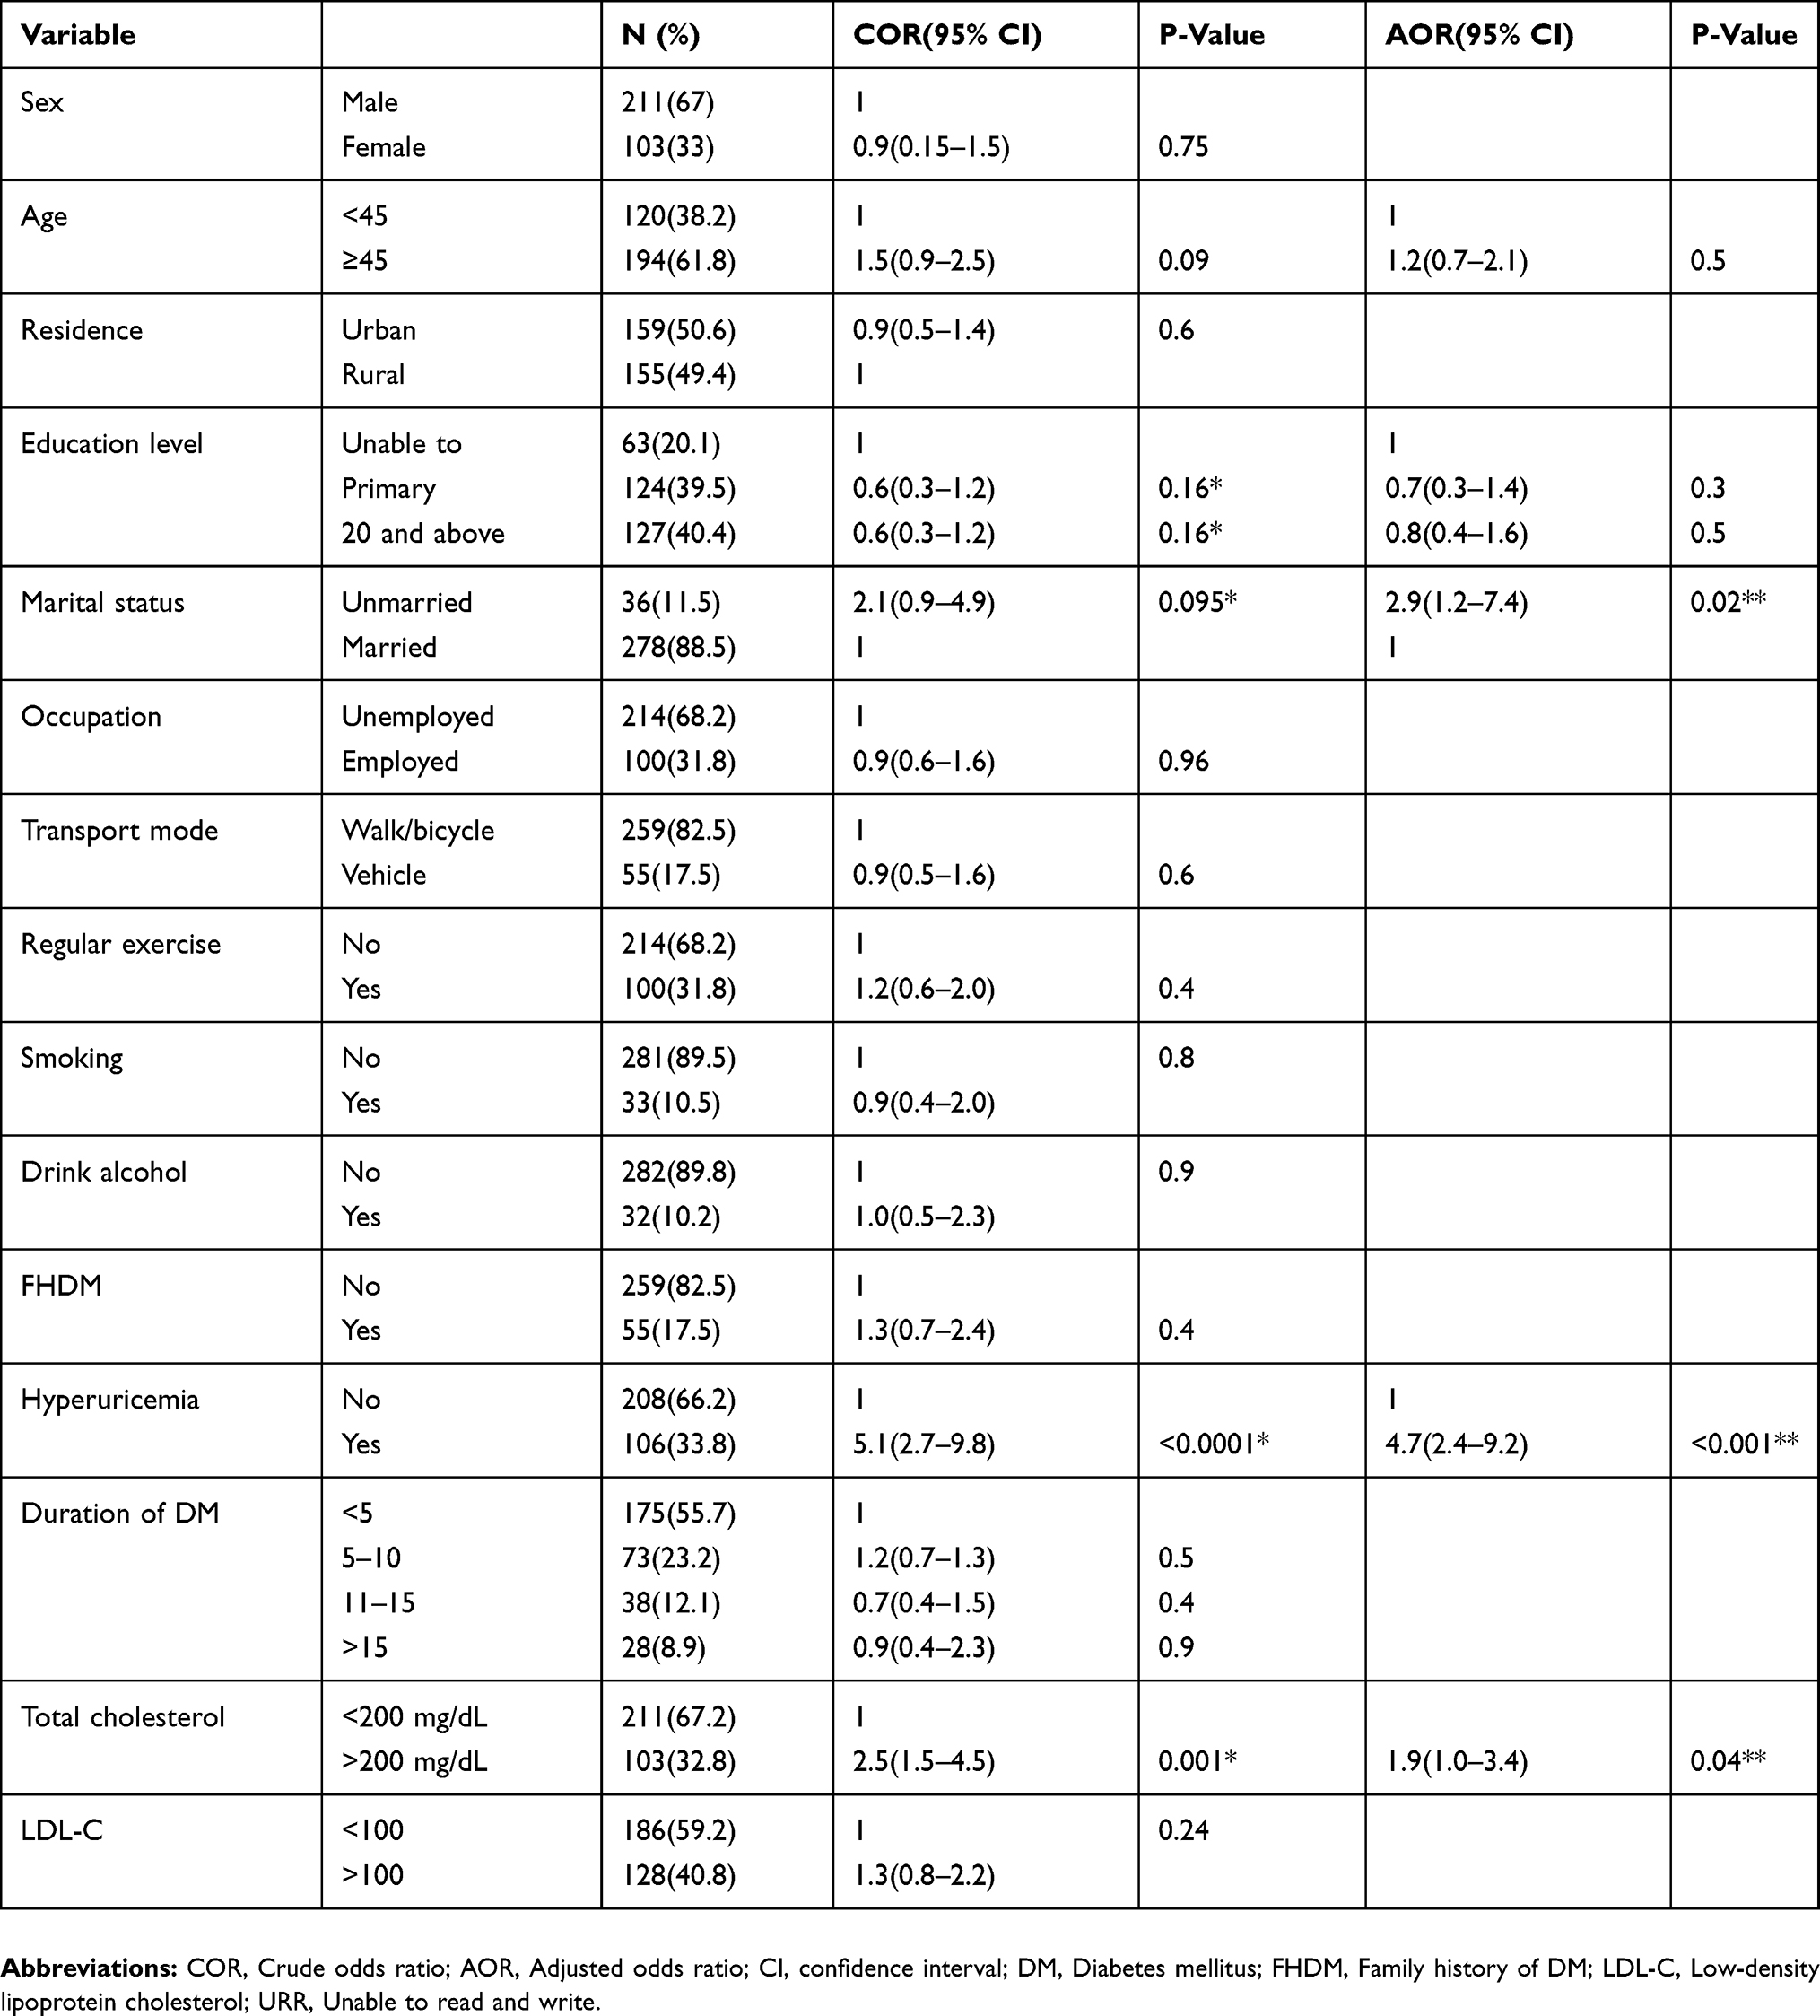 |
Table 4 Associated Factor Of MetS Among T2DM Study Participants At HUCSH, South Ethiopia, According To WHO Criteria, From February 28 To May 30/2017 |
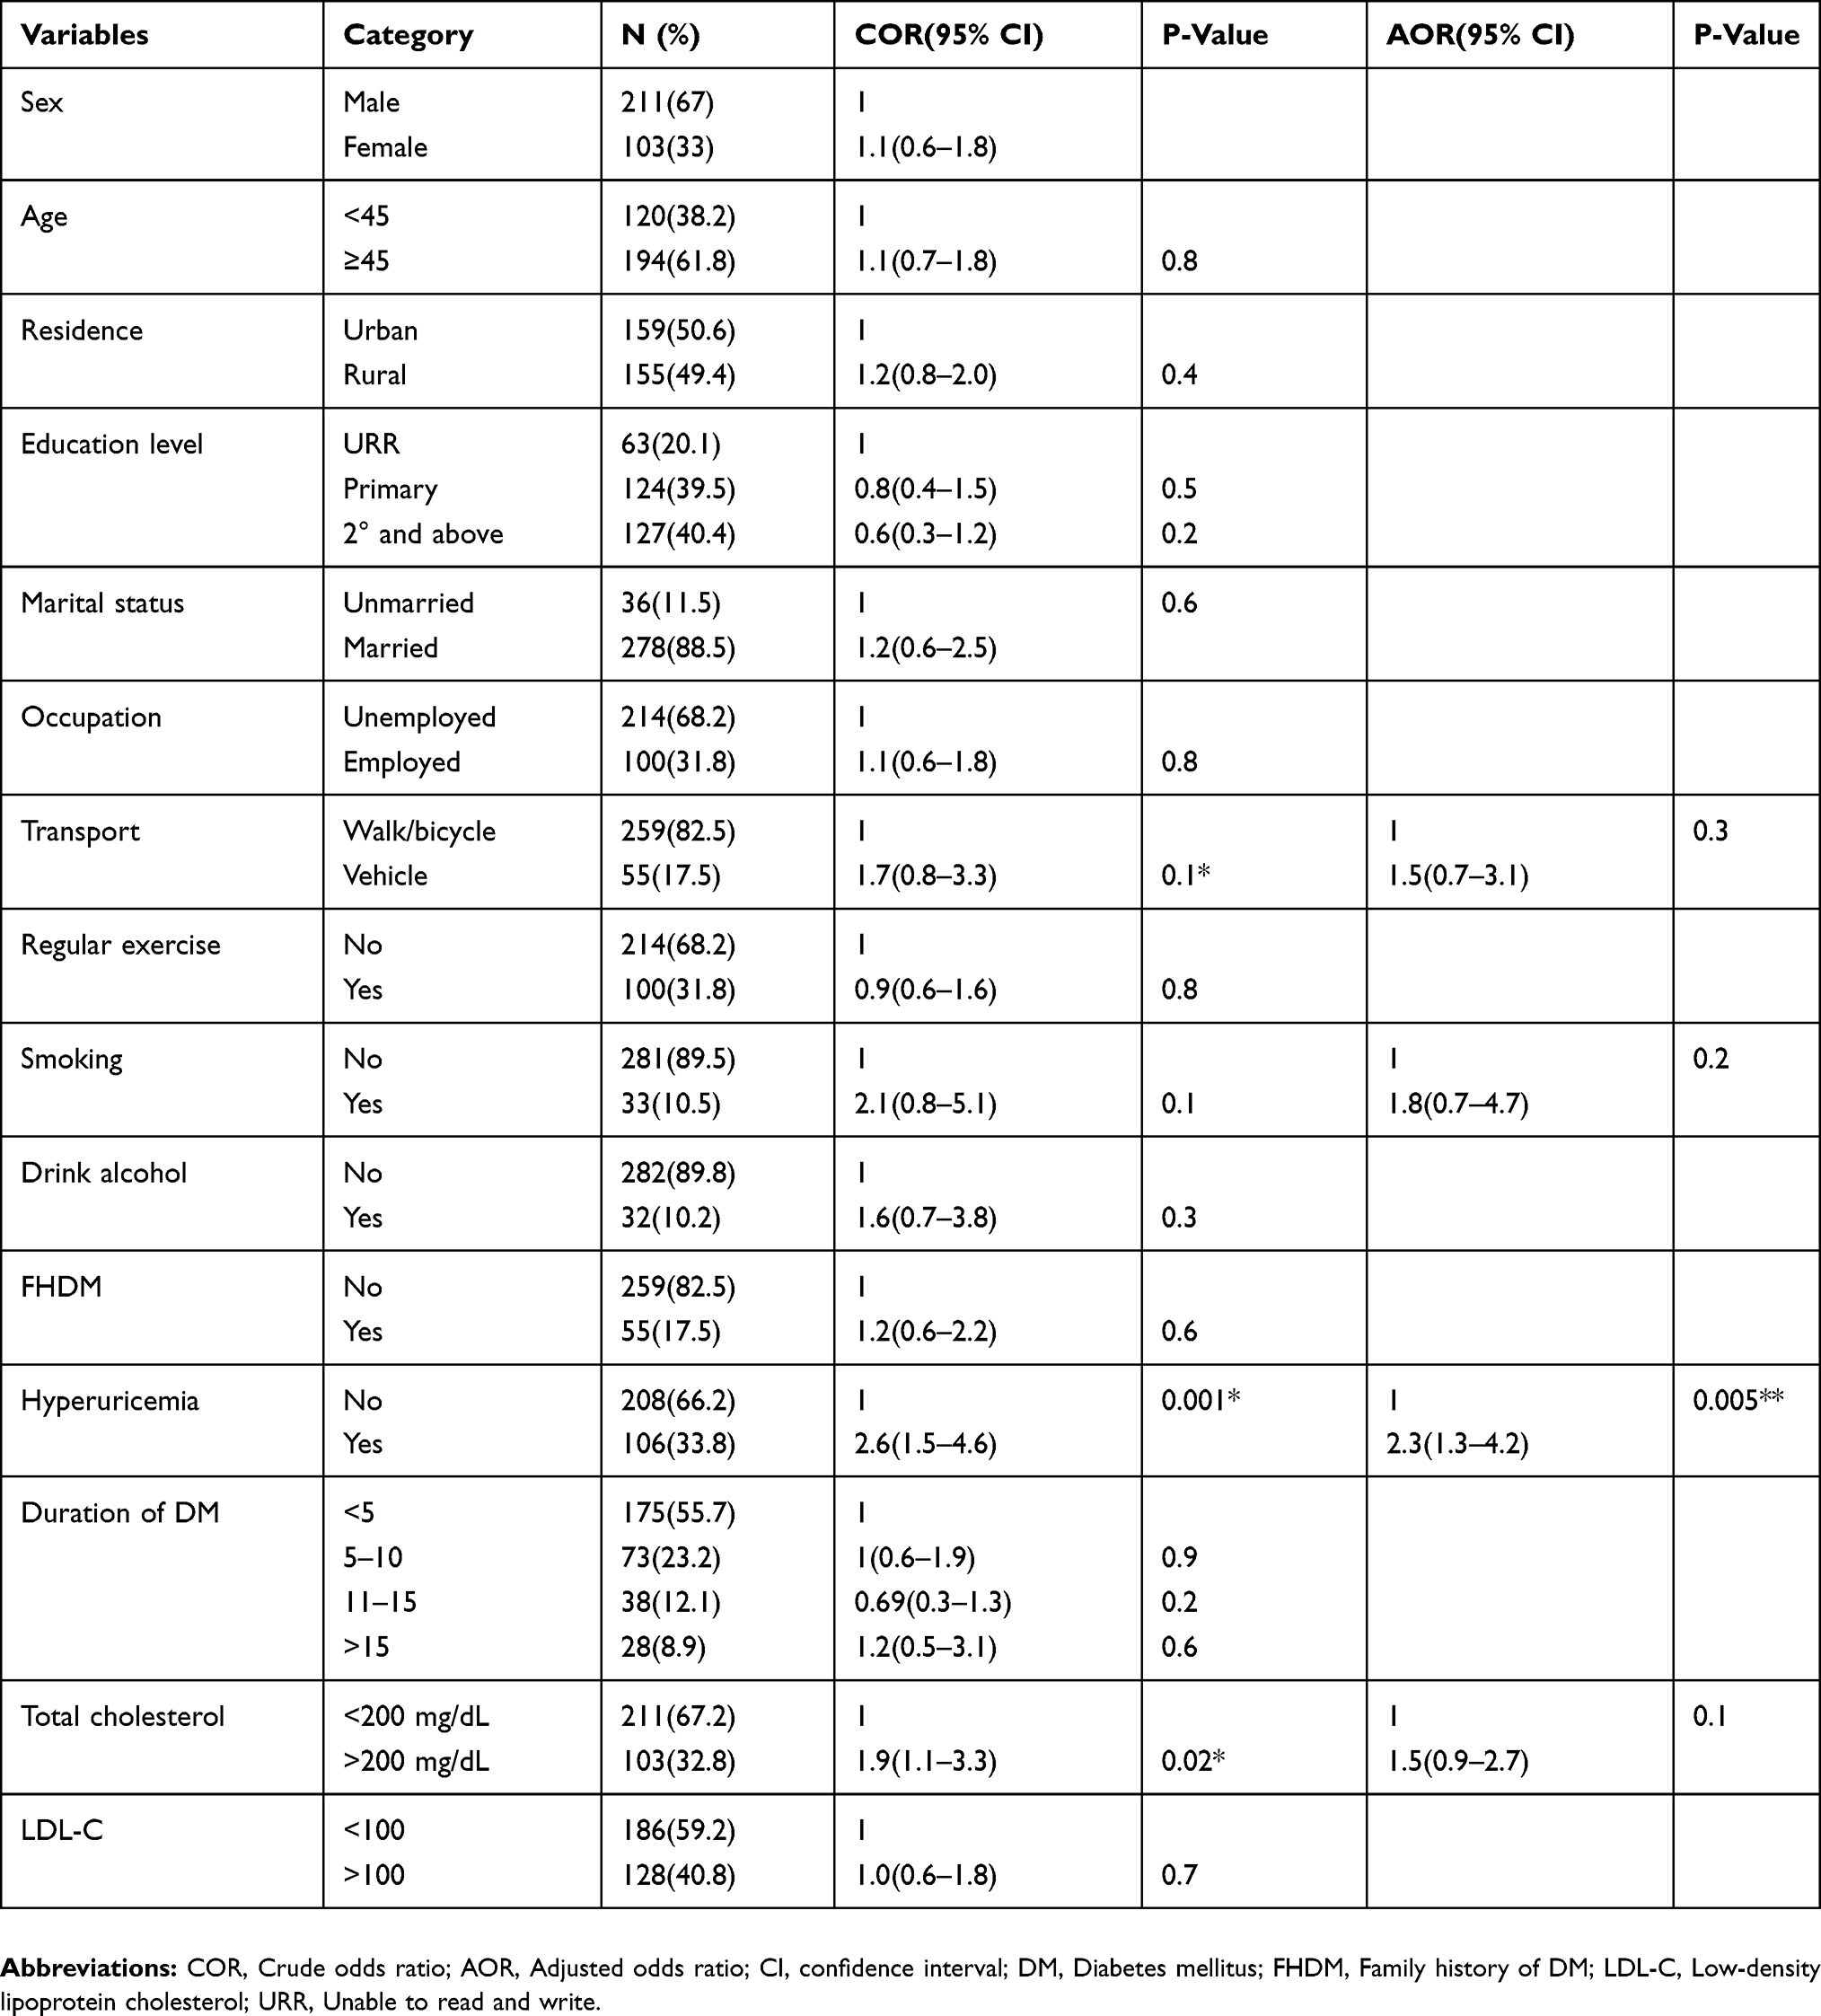 |
Table 5 Associated Factor Of MetS Among T2DM Study Participants At HUCSH, South Ethiopia According To NCEP-III ATP Criteria, From February 28 To May 30/2017 |
Agreement And Disparity Among MetS Definitions
The agreement and difference in the diagnosis of MetS among the WHO, NCEP-III, IDF, and Harmonized definitions are presented in Table 6 and the agreement among these four definitions was poor to good.
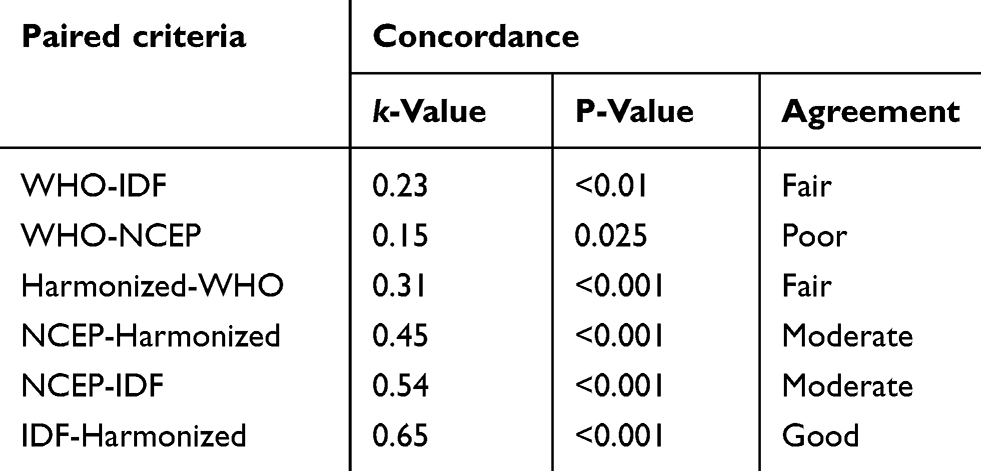 |
Table 6 Concordance Between The Four Criteria At HUCSH, South Ethiopia, From February 28 To May 30/2017 |
Discussion
T2DM is an important public health problem worldwide, not only by its increasing prevalence but also because of its associated micro-vascular and macro-vascular complications which severely impact the quality of life of individuals.14–17 The current study was conducted to compare the prevalence of MetS and associated factors in HUCSH, Ethiopia by using different types of diagnostic criteria.
Such a high prevalence of metabolic syndrome ranging from 31.2% by WHO criteria to 70.1% by NCEP ATP-III criteria in our study population of type 2 diabetics is of great concern as the cardiovascular and other mortalities increases with the presence of metabolic syndrome in T2DM. One of the findings of the present study is the variability of the overall prevalence of MetS among the study participants according to IDF, WHO, harmonized, and NCEP-III diagnostic criteria which is 59.9%, 31.2%, 65.6%, and 70.1%. A study from Gonder, Ethiopia observed a prevalence of 70.3%, 57%, and 45.3% by NCEP-ATP III, IDF, and WHO criteria, respectively,18 which is relatively comparable with our study. The variation on the prevalence of MetS among these different criteria was observed by other previous studies that compare different MetS diagnostic criteria.17,19 The difference could obviously be attributed to different factors such as differences in sample size, socio-economic status, sampling method, difference in life style of study participants, and different cut off value used between different studies. Genetic factors may also affect the prevalence and principal components of the syndrome.11
A prevalence of 31.2% by WHO criteria was comparable with the study from central India.19 Unlike our study, other studies showed the highest prevalence of MetS by WHO classification.17,20 This could be, apart previously mentioned factors, because of the omission of microalbuminuria as a component of MetS in this study even though it is one component of WHO classification criteria. A relatively high prevalence of MetS by NCEP-ATP III (70.1%) and Harmonized criteria (65.6%) than the IDF (59.9%) could be attributed to the relative flexibility of these two criteria in which abdominal obesity is not considered as a prerequisite for the diagnosis.
The degree of agreement, which is measured by kappa statistic, between NCEP-ATP III and IDF was found to be moderate (k=0.54). Relatively the same agreement with our study was found (k=0.51) by other study10 from sub-Saharan country and Yadav et al, reported a different trend of agreement to our study (k=0.68).19 The high degree of agreement (k=0.65) between harmonized and IDF criteria could be explained by the fact that the two definitions use the same cutoff values for the diagnostic components including waist circumference. We found fair level of agreement (K=0.23) between the WHO and IDF. Relatively the same level of agreement (K=0.27) was found from Nepal16 and Benin city (k=0.3).21 A study done in Sri Lanka showed that the agreement between IDF with WHO and IDF-NCEP-ATP III criteria to be 0.37 and 0.53, respectively, whereas the agreement between NCEP-ATP III and WHO criteria was 0.24 (p < 0.001).17 The reasons for the similarities and differences among different studies regarding the agreement of the different criteria could be because of the difference in the distribution of parameter used to assess the prevalence of metabolic syndrome in different ethno geographic populations.
Another result of this study showed that MetS was prevalent in female, 94.2% vs 32.7%, 43.7 vs 25.1%, 87.4% vs 55.0% and 70.9% vs 69.7% by IDF, WHO, Harmonized, and NCEP-ATP III diagnostic criteria used, respectively, than females. This finding is supported by many other studies.17,19,22 Lone S et al, found that very high prevalence of MetS among females, 90.8%, 87.9%, 86.8%, by WHO, IDF, and NCEP ATP III criteria, respectively.20
From the multivariate analysis, different associated factor was observed between the different diagnostic criteria. Cholesterol level and uric acid level are variables that have got an association with MetS at least by three criteria out of the four criteria. Growing evidence is demonstrating that uric acid level is associated with MetS and may have a key role in the pathogenesis of MetS.23,24 The association of MetS with the uric acid level was also proven by another study.25 Different studies also support our finding of an association between cholesterol level and MetS.25
According to the harmonized criteria, female sex was significantly associated with MetS and is 2.3 times (CI: 1.5–4.9, P-value≤0.001) more likely to have MetS compared to male sex. This finding is also supported by other studies.7,26 The reason might be more weight, less activity, and higher prevalence of dyslipidemia in women.27 From one community-based study, it is reported that women in developing countries have shown a higher clustering of behavioral risk factors than men,28 which may account for their being more at risk for MetS. Age of ≥45 years (AOR=1.9, CI: 1.1–3.2, P-Value=0.02) was were found to have significant associations with MetS according to the harmonized criteria and this finding also supported by other study from Ethiopia.26
Conclusion
The prevalence of metabolic syndrome varies based on the definition used and the highest prevalence of MetS was observed with NCEP-ATP III and the different types of criteria do not always diagnose the same group of individuals. The overall prevalence of MetS among the study participants was 59.9%, 31.2%, 65.6%, and 70.1% according to IDF, WHO, harmonized, and NCEP-ATP III diagnostic criteria, respectively. Different associated factors were observed from the four criteria’s used. From the multivariate analysis, sex, Age, uric acid level, and total cholesterol are associated factors of MetS among the study participants according to the harmonized criteria, while regular exercise, uric acid level, and total cholesterol were associated with MetS among study participants according to the IDF criteria. Marital status, hyperuricemia, and total cholesterol level were associated with MetS by WHO classification criteria and the only uric acid level was associated with MetS by NCEP-ATP III criteria.
Limitations Of The Study
The main limitation of our study was the small sample size, which may have limited the power of the results. This was a cross-sectional study which took place in one particular region and may not be extended to other regions.
Abbreviations
BMI, Body Mass Index; CVD, cardiovascular diseases; DBP, diastolic blood pressure; FBS, fasting blood Sugar; HDL-c, high-density lipoprotein cholesterol; HUCSH, Hawassa University comprehensive specialized Hospital; IDF, International Diabetic Federation; LDL-c, low-density lipoprotein cholesterol; NCEP ATP, National cholesterol education program Adult treatment panel; RPM, revolution per minute; SBP, systolic blood pressure; SPSS, statistical package for social sciences; T2DM, Type 2 Diabetes mellitus; WHO, World Health Organization.
Ethical Consideration
This study was conducted according to the Declaration of Helsinki. Ethical clearance was obtained from the ethical review committee of the Institute of Health Sciences, Jimma University. This ethical clearance was taken to HUCSH clinical director office and a permission letter to conduct the study was taken from the clinical director office to the HUCSH diabetic clinic and to the medical laboratory department to conduct the study. Then, the aim, purpose, benefits, and method of the study were clearly explained to the participants. Written informed consent was obtained from each participant and the names of patients were not registered in the questionnaire and their unique MRN numbers were locked for confidentiality. The study participants were informed that they can withdraw from the study at any time and has no negative impact on their diagnosis and treatment in the hospital. Finally, each study participants had provided signed consent before any data collected.
Availability Of Data And Material
The data that support the findings of this study are at Hawassa Comprehensive Specialized Hospital but not publicly available. However, the data are available from the authors upon reasonable request and with the permission of Hawassa Comprehensive Specialized Hospital ethics committee.
Acknowledgments
We would like to thank the College of Health Sciences, Jimma University for supporting this project. We also thank the study participants, data collectors and those who had a contribution to this study.
Author Contributions
All authors contributed to data analysis, drafting or revising the article, gave final approval of the version to be published, and agree to be accountable for all aspects of the work. ATA reviewed and reanalyzed the dataset and reviewed the manuscript and references to get the final version.
Funding
The study was supported by the College of Health Sciences of Jimma University.
Disclosure
The authors report no conflicts of interest in this work.
References
1. Mahato RV, Raut PP, Regmi P, et al. Association between glycaemic control and serum lipid profile in type 2 diabetic patients: glycated hemoglobin as a dual biomarker. Biomed Res. 2011;22((3):):375–380.
2. Uttra KM, Devrajani BR, Shah SZA, et al. Lipid profile of patients with diabetes mellitus (A multidisciplinary study). World Appl Sci J. 2011;12(9):1382–1384.
3. Bhanpuri NH, Hallberg SJ, Williams PT, et al. Cardiovascular disease risk factor responses to a type 2 diabetes care model including nutritional ketosis induced by sustained carbohydrate restriction at 1 year: an open label, non-randomized, controlled study. Cardiovasc Diabetol. 2018;17:1. doi:10.1186/s12933-018-0698-8
4. Malim MH, Emerman M. HIV-1 sequence variation. Cell. 2001;104(4):469–472. doi:10.1016/s0092-8674(01)00234-3
5. Neto JCGL, Xavier MDA, Borges JWP, Araújo MFMD, Damasceno MMC. Roberto wagner júnior freire de freitas. Prevalence of metabolic syndrome in individuals with Type 2 diabetes mellitus. Rev Bras Enferm. 2017;70(2):265–270. doi:10.1590/0034-7167-2016-0145
6. Punthakee Z, Goldenberg R, Katz P. Definition, classification and diagnosis of diabetes, prediabetes and metabolic syndrome. Can J Diabetes. 2018;42. doi:10.1016/j.jcjd.2017.10.003
7. Khuwaja AK, Ali FN, Naqvi I, Bux R, Jabbar A, Dhanani RH. Metabolic syndrome and its individual components among people with type 2 diabetes: prevalence, gender differences and its association with ischemic heart disease. J Diabetes Mellitus. 2012;02(03):332–337. doi:10.4236/jdm.2012.23052
8. Junghyun N, Kyung-Do H, Seung HK, et al. Trends in the pervasiveness of type 2 diabetes impaired fasting glucose and co-morbidities during an 8-year-follow-up of the nationwide Korean population. Sci Rep. 2017;7:1–7. doi:10.1038/s41598-016-0028-x
9. Arca M, Pigna G, Favoccia C. Mechanisms of diabetic dyslipidemia: relevance for atherogenesis. Curr Vasc Pharmacol. 2012;10(6):684–686.
10. Kengne A, Limen S, Sobngwi E, Djouogo C, Nouedoui C. Metabolic syndrome in type 2 diabetes: comparative prevalence according to two sets of diagnostic criteria in sub-Saharan Africans. Diabetol Metab Syndr. 2012;4:1. doi:10.1186/1758-5996-4-22
11. Osei-Yeboah J, Owiredu W, Norgbe G, et al. The prevalence of metabolic syndrome and its components among people with Type 2 diabetes in the Ho Municipality, Ghana: a cross-sectional study. Int J Chronic Dis. 2017;2017:1–8. doi:10.1155/2017/8765804
12. WHO. Chronic diseases and health promotion: a stepwise approach to surveillance (STEPS); 2010. Available from: http://www.who.int/chp/steps/instrument/.
13. Gornbein J. Practical Statistics for Medical Research by Douglas G. Altman. New York: Chapman & Hall; 1991:611. illustrated. Clinical Infectious Diseases. 1992; 14(1):370-370. doi:10.1093/clinids/14.1.370
14. Zimmet P, Magliano D, Herman W, Shaw J. Diabetes: a 21st century challenge. Lancet Diabetes Endocrinol. 2014;2(1):56–64. doi:10.1016/s2213-8587(13)70112-8
15. Cardoso C, Leite N, Moram C, Salles G. Long-term visit-to-visit glycemic variability as predictor of micro- and macrovascular complications in patients with type 2 diabetes: the Rio de Janeiro Type 2 diabetes cohort study. Cardiovasc Diabetol. 2018;17:1. doi:10.1186/s12933-018-0677-0
16. Pokharel D, Khadka D, Sigdel M, et al. Prevalence of metabolic syndrome in Nepalese type 2 diabetic patients according to WHO, NCEP ATP III, IDF and Harmonized criteria. J Diabetes Metab Disord. 2014;13:1. doi:10.1186/s40200-014-0104-3
17. Herath H, Weerasinghe N, Weerarathna T, Amarathunga A. A comparison of the prevalence of the metabolic syndrome among Sri Lankan patients with Type 2 Diabetes Mellitus using WHO, NCEP-ATP III, and IDF definitions. Int J Chronic Dis. 2018;2018:1–8. doi:10.1155/2018/7813537
18. Birarra M, Gelayee D. Metabolic syndrome among type 2 diabetic patients in Ethiopia: a cross-sectional study. BMC Cardiovasc Disord. 2018;18:1. doi:10.1186/s12872-018-0880-7
19. Yadav D, Mahajan S, Subramanian S, Bisen P, Chung C, Prasad G. Prevalence of metabolic syndrome in Type 2 Diabetes Mellitus using NCEP-ATPIII, IDF and WHO definition and its agreement in Gwalior Chambal Region of Central India. Glob J Health Sci. 2013;5:6. doi:10.5539/gjhs.v5n6p142
20. Lone S, Lone K, Khan S, Pampori R. Assessment of metabolic syndrome in Kashmiri population with type 2 diabetes employing the standard criteria given by WHO, NCEPATP III and IDF. J Epidemiol Glob Health. 2017;7(4):235–239. doi:10.1016/j.jegh.2017.07.004
21. Onesi SO, Ignatius UE. Metabolic syndrome: performance of five different diagnostic criterias. Indian J Endocrinol Metab. 2014;18:496–501. doi:10.4103/2230-8210.137494
22. Gundogan K, Bayram F, Gedik V, et al. Metabolic syndrome prevalence according to ATP III and IDF criteria and related factors in Turkish adults. Arch Med Sci. 2013;9:243–253. doi:10.5114/aoms.2013.34560
23. Ishizaka N, Ishizaka Y, Toda E-I, et al. Association between serum uric acid, metabolic syndrome, and carotid atherosclerosis in Japanese individuals. Arterioscler Thromb Vasc Biol. 2005;25:1038–1044. doi:10.1161/01.ATV.0000161274.87407.26
24. Fukui M, Tanaka M, Shiraishi E, et al. Serum uric acid is associated with microalbuminuria and subclinical atherosclerosis in men with type 2 diabetes mellitus. Metabolism. 2008;57(5):625–629. doi:10.1016/j.metabol.2007.12.005
25. Li Q, Yang Z, Lu B, et al. Serum uric acid level and its association with metabolic syndrome and carotid atherosclerosis in patients with type 2 diabetes. Cardiovasc Diabetol. 2011;10(1):72. doi:10.1186/1475-2840-10-72
26. Biadgo B, Melak T, Ambachew S, et al. The prevalence of metabolic syndrome and its components among Type 2 Diabetes Mellitus patients at the University of Gondar Hospital, Northwest Ethiopia. Ethiop J Health Sci. 2018;28(4):645–653. doi:10.4314/ejhs.v28i5.16
27. Foroozanfar Z, Najafipour H, Khanjani N, et al. The prevalence of metabolic syndrome according to different criteria and its associated factors in Type 2 diabetic patients in Kerman, Iran. IJMS. 2015;40(6).
28. Khuwaja AK, Kadir MM. Gender differences and clustering pattern of behavioural risk factors for chronic noncommunicable diseases: community-based study from a developing country. Chronic Illn. 2010;6:163–170. doi:10.1177/1742395309352255
 © 2019 The Author(s). This work is published and licensed by Dove Medical Press Limited. The full terms of this license are available at https://www.dovepress.com/terms.php and incorporate the Creative Commons Attribution - Non Commercial (unported, v3.0) License.
By accessing the work you hereby accept the Terms. Non-commercial uses of the work are permitted without any further permission from Dove Medical Press Limited, provided the work is properly attributed. For permission for commercial use of this work, please see paragraphs 4.2 and 5 of our Terms.
© 2019 The Author(s). This work is published and licensed by Dove Medical Press Limited. The full terms of this license are available at https://www.dovepress.com/terms.php and incorporate the Creative Commons Attribution - Non Commercial (unported, v3.0) License.
By accessing the work you hereby accept the Terms. Non-commercial uses of the work are permitted without any further permission from Dove Medical Press Limited, provided the work is properly attributed. For permission for commercial use of this work, please see paragraphs 4.2 and 5 of our Terms.