")
Back to Journals » International Journal of General Medicine » Volume 8
A combined continuous and interval aerobic training improves metabolic syndrome risk factors in men
Authors Sari-Sarraf V, Aliasgarzadeh A, Naderali M, Esmaeili H, Naderali E
Received 31 January 2015
Accepted for publication 16 March 2015
Published 21 May 2015 Volume 2015:8 Pages 203—210
DOI https://doi.org/10.2147/IJGM.S81938
Checked for plagiarism Yes
Review by Single anonymous peer review
Peer reviewer comments 4
Editor who approved publication: Dr Scott Fraser
Vahid Sari-Sarraf,1 Akbar Aliasgarzadeh,2 Mohammad-Mahdi Naderali,3 Hamid Esmaeili,1 Ebrahim K Naderali4
1Department of Exercise Physiology, Faculty of Physical Education and Sport Sciences, University of Tabriz, 2Bone Research Centre, Endocrine Unit, Department of Medicine, Tabriz University of Medical Sciences, Tabriz, Iran; 3The School of Pharmacy and Biomolecular Sciences, Liverpool John Moores University, Liverpool, 4Faculty of Science, Liverpool Hope University, Liverpool, UK
Abstract: Individuals with metabolic syndrome have significantly higher risk of cardiovascular disease and type 2 diabetes leading to premature death mortality. Metabolic syndrome has a complex etiology; thus, it may require a combined and multi-targeted aerobic exercise regimen to improve risk factors associated with it. Therefore, the aim of this study was to evaluate the effect of combined continuous and interval aerobic training on patients with metabolic syndrome. Thirty adult male with metabolic syndrome (54±8 years) were randomly divided into two groups: test training group (TTG; n=15) and control group (CG; n=15). Subjects in TTG performed combined continuous and interval aerobic training using a motorized treadmill three times per week for 16 weeks. Subjects in CG were advised to continue with their normal activities of life. Twenty-two men completed the study (eleven men in each group). At the end of the study, in TTG, there were significant (for all, P<0.05) reductions in total body weight (-3.2%), waist circumference (-3.43 cm), blood pressure (up to -12.7 mmHg), and plasma insulin, glucose, and triacylglyceride levels. Moreover, there were significant (for all, P<0.05) increases VO2max (-15.3%) and isometric strength of thigh muscle (28.1%) and high-density lipoprotein in TTG. None of the above indices were changed in CG at the end of 16-week study period. Our study suggests that adoption of a 16-week combined continuous and interval aerobic training regimen in men with metabolic syndrome could significantly reduce cardiovascular risk factors in these patients.
Keywords: metabolic syndrome, combined continuous and interval training, blood pressure, insulin sensitivity
Introduction
Metabolic syndrome is a collection of interrelated cardiovascular risk factors including abdominal obesity, hypertension, glucose intolerance, insulin resistance, and dyslipidemia.1,2 The prevalence of metabolic syndrome appears to be influenced by genetic make-up, being high among Asians compared with white Caucasians for a given total body weight.3,4 Individuals with the metabolic syndrome have significantly higher risk of heart disease (two- to threefold), stroke (twofold), and diabetes (fivefold).5–7
Improvement of body composition status, physical performance, cardiovascular factors, and metabolic risk factors is the priority of treatment programs for patients with metabolic syndrome.8–10 Development of central or visceral fat is consistent with higher risk of metabolic syndrome, while small amounts of weight loss, especially visceral fat, potentially prevent or reverse metabolic syndrome and its deleterious outcomes.11,12 Moreover, a low aerobic exercise capacity appears to be the strongest predictor of metabolic syndrome.13 Indeed, each 1 mL/kg/min increment improvement in VO2max was associated with 7% lower risk of metabolic syndrome.14 Furthermore, the muscular strength is generally considered as a function of physical fitness and health. The muscular strength is inversely associated with the prevalence of the metabolic syndrome independently of the aerobic fitness.15 Improvements in other key components of the metabolic syndrome, namely hypertension, glucose intolerance, abnormal lipid profile, and insulin resistance, are mainstay of the non-pharmacological treatment of the metabolic syndrome.16–18 The lifestyle (behavioral) modification (weight control, diet, exercise, smoking cessation) and aerobic exercise training have been shown to be effective interventions for the prevention and treatment of the metabolic syndrome,19 although with a varying degree of success. Therefore, considering the complex etiology of the metabolic syndrome, we have hypothesized that combination of a multi-targeted aerobic training would be an optimal approach to tackle all the risk factors simultaneously in patients with metabolic syndrome.
Methods
Subject inclusion
The study included thirty adult male (54±8 years) subjects with metabolic syndrome according to the definition of the National Cholesterol Education Program Adult Treatment Panel.20 The subjects had three or more of the following criteria: 1) waist circumference >102 cm, 2) triglycerides ≥150 mg/dL, 3) blood pressure (BP) ≥130.85 mmHg, 4) high-density lipoprotein (HDL) <40 mg/dL, and 5) fasting glucose ≥110 mg/dL. The baseline characteristics of the participants are outlined in Table 1. The inclusion criteria included the ability to undergo training program outlined in the study at Imam Reza University Hospital, Tabriz, Iran. All subjects were informed of the nature, purpose, and potential risks of the study, after which written informed consents were obtained from all participants. All subjects with a history of any form of cardiovascular events (myocardial infarction, transient ischemic attacks, peripheral vascular disease, heart failure, unstable angina, or stroke) were excluded from the study. The study was reviewed and approved by the Institutional Review Board on Human Experiments, Tabriz University of Medicine. Patients were randomized and stratified (by age and body mass index [BMI]) into test training group (TTG; n=15) and a control group (CG; n=15). A total of 22 men completed the study (eleven subjects from each group).
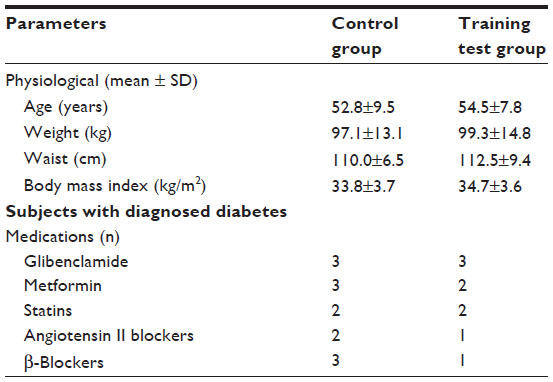 | Table 1 Baseline characteristics of subjects enrolled in this study |
Exercise protocol
Subjects in TTG performed combined continuous and interval aerobic training as walking and running “uphill” on treadmill three times per week for 16 weeks. Each session consisted of the following:
- Warm-up for 5 minutes at 50% of maximum heart rate (MHR)
- Twenty minutes continuous at 70% of MHR
- Twelve (4×3)-minute intervals at 90% of MHR with a 3-minute active recovery at 70% of MHR between intervals
- Five-minute cool-down period at 50% of MHR, giving a total exercise time of 54 minutes.
The subjects in CG continued with their normal daily living activities during the 16 weeks of the study period without any additionally prescribed physical activities.
All subjects were also requested to continue with their normal diet and physical activity patterns outside of the study protocol. Dietary patterns were registered using a “Food Frequency Questionnaire” that has been validated by the Centre for Endocrinology and Metabolism Research of Shahid Beheshti University of Medical Sciences, Tehran, Iran.21
Data acquisition
At the start of the study (day 1) and at the end of the weeks 8 and 16, the following measurements were obtained from all participants.
Anthropometric measurements
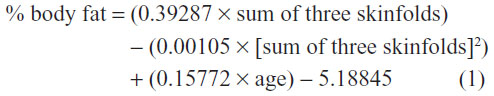
The subjects’ heights were measured to the nearest 0.1 cm using a wall-mounted Stadiometer (Yagami, Miekosha, Japan), and the body weights were measured to the nearest 0.1 kg using a digital scale (Seca, Germany) with the subjects having only their underwear and being barefooted. BMI was calculated as weight in kilograms divided by the square of the height in meters (kg/m2). The waist circumference measurements were taken in triplicate to the nearest 0.1 cm using a nonelastic measuring tape on the skin midway between the iliac crest and the lowest rib in standing position. The percentage body fat was measured using Skinfold Caliper (Yagami) and equations set forth by the American College of Sports Medicine (ACSM),22 for three separate sites: chest pectoral, supra-iliac, and abdominal areas.22
Blood pressure
BP was assessed in duplicate using a manual sphygmomanometer (Riester-1002; Rudolf Reister GmbH, Junginen, Germany) after participants sat quietly for 15 minutes, and the mean of the two measurements was used for statistical analysis.
Blood analyses
The blood samples were collected from all participants after at least 14 hours of fasting and abstinence from smoking. Furthermore, the participants were asked to abstain from vigorous exercise outside of the study protocol for at least 3 days prior to blood sampling. The serum of blood samples was separated immediately by centrifugation at 3,000 rpm for 10 minutes at 4°C for measurements of insulin, glucose, triacylglycerides, and HDL-cholesterol concentrations. The insulin levels were measured by a radioimmunoassay (using Kit IM3210, Immunotech Company), while glucose concentrations were determined using an automated glucose analyzer (Yellow Springs Instruments (YSI), 2300 STAT). The plasma concentrations of triacylglycerides and HDL were determined by standard enzymatic methods (Roche Diagnostics) on a Hitachi automated spectrophotometer. To estimate overall insulin resistance and insulin sensitivity, the homeostasis assessment model of insulin resistance (HOMA-IR)23 and quantitative insulin sensitivity check index (QUICKI)24 methods were used, respectively.


Cardiopulmonary function test
The cardio-respiratory fitness level was measured during a maximal exercise test on a treadmill (Technogym, Casena, Italy) according to a modified Bruce protocol after a 15-minute warm-up. The BP, heart rate (HR), and the Borg scale of rating of perceived exertion (RPE) were measured at 2 minutes of each stage of the exercise. The test was ended when the subject demanded cessation of the treadmill due to exhaustion, or if the HR achieved was more than 90% of estimated maximal HR (220 – age), or if the RPE was more than 17. The predictive VO2max value was calculated using the ACSM walking equation as outlined below.25

Leg strength test (dynamometry assessment)
The subjects performed leg strength test using the back and leg dynamometer. The subjects were asked to stand on the platform with their trunk erected and the knees flexed to an angle of 130°–140°. The subjects then held the hand bar using a pronated grip, positioning it across their thighs by adjusting the length of the chain after which they slowly and gradually were asked to exert as much force as possible while extending their knees without using their back so that the maximum indicator needle remained at the peak force achieved. To ensure reproducibility and accuracy, two or three trials with a 1-minute rest interval were conducted.25
Statistical analyses
Data are presented as mean ± standard deviation. Data were analyzed with a commercially available statistical software program (SPSS version 17.0). The intergroup and intragroup comparisons were assessed using a repeated measure of analysis of variance and post hoc Bonferroni where appropriate. Indicators for group (CG vs TTG), time (in weeks), and an interaction term (group × time) were assessed. Values of P<0.05 are considered as statistically significant.
Results
Baseline characteristics
There were no significant differences among the four parameters (body composition, physical performance, cardiovascular factors, and metabolic factors) at baseline between the two groups (CG vs TTG; for all, P>0.05) (Table 2). In TTG, four subjects were excluded from the analyses due to their inability to complete the training program; four subjects withdrew from the study (one for a minor sole injury and three for personal reasons). In CG, four patients were excluded from the analyses due to their refusal to perform follow-up tests for personal reasons.
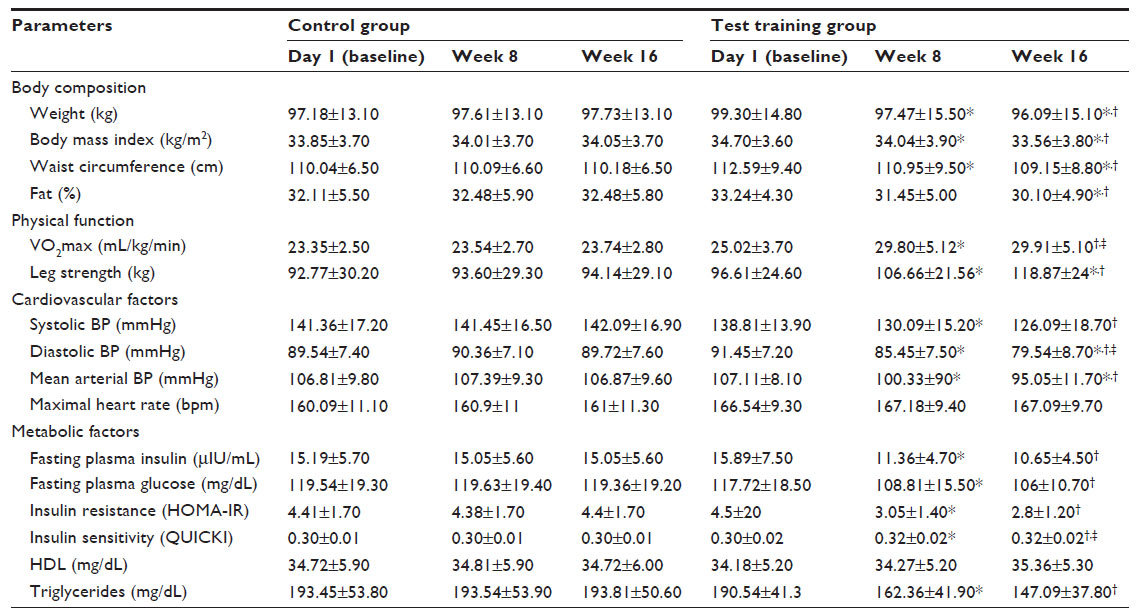 | Table 2 Parameters related to the metabolic syndrome before, in the middle of, and after the experimental period |
Body composition
In TTG, the combined training program resulted in significant reductions in total body weight (up to 3.2%), BMI (up to 1.1 kg/m2), and waist circumference (up to 3.4 cm) at the end of first 8 weeks, second 8 weeks, and over the 16 weeks after adjusting for the baseline values (all P<0.05). Compared with baseline, there were significant reductions in subcutaneous fat mass at week 16 (up to 3.1%, P<0.05) but not at week 8. Interestingly, in CG, there were no significant changes observed in any of these parameters (for all, P>0.05) (Table 2).
Physical performance
In TTG, there were significant improvements in maximal oxygen consumption (VO2max) by 19.1% and 19.5% at weeks 8 and 16, respectively (for both, P<0.05), compared with their baseline level. However, there were no differences between improvements seen at week 8 and week 16 (P>0.05) (Table 2). Compared with baseline levels, the maximum leg strength was significantly improved by 10.04 kg and 22.25 kg at week 8 and week 16 (P<0.05), respectively. Interestingly, the improvement in maximum leg strength was continuous with significant difference between week 8 and week 16 (12.2 kg improvement vs week 8 value, P<0.05) (Table 2). There was no significant difference in any physical performance parameters in CG compared with their baseline levels (Table 2).
Blood pressure
In TTG, the combined training program significantly reduced systolic and diastolic BP at week 16 by 12.7 mmHg and 11.9 mmHg (for both, P<0.05), respectively (Table 2). Importantly, improvement in BP was evident at week 8 (systolic: 8 mmHg and diastolic: 6 mmHg, P<0.05) (Table 2). The reduction in diastolic but not systolic BP during the second 8 weeks was significant compared with the first 8 weeks (week 16: 79.5 mmHg vs week 8: 85.5 mmHg, P<0.05) (Table 2). Once again, no significant changes were observed in any of these indices within the CG (P>0.05) (Table 2).
Maximal heart rate
There were no changes in MHR in either TTGs or CGs compared with their baseline characteristics (Table 2).
Glycemic and lipid profiles
In TTGs, there were significant (for all, P<0.05) reductions in plasma glucose (−10%: 11.27 mg/dL), insulin (−33%: 5.24 μIU/mL), and triglycerides (−23%: 43 mg/dL) at the end of the study (week 16) compared with their baseline values. Moreover, HOMA-IR values were also reduced in TTG (−1.7 U) indicating improvement in insulin resistance (Table 2). Indeed, insulin sensitivity analysis confirmed a significant increase (7%, P<0.05) in TTG at week 8. There was also a numerical increase in plasma HDL concentrations (3.4%: 2 mg/dL) at week 8 in TTGs, but it did not reach statistical significance (P>0.05) level. Interestingly, no further reductions in any of the above biochemical parameters were seen during the second 8 weeks in TTG. In CG, there were no significant changes observed in any of above indices at any stage of the study period (Table 2).
Changes in medications
At the end of the study period, anti-diabetes medications (sulfonylureas: glibenclamide) but not metformin were reduced by 17.2% (by dosage) in TTG. There were no other changes in medications (lipid-lowering, antihypertensive agents) in either TTGs or CGs. At the end of the experimental period (week 16) in TTG, 54% (six out of eleven patients) could no longer be considered as patients with the metabolic syndrome (Table 3). Importantly, these observations were made in the presumed absence of dietary changes during the training period (data not shown).
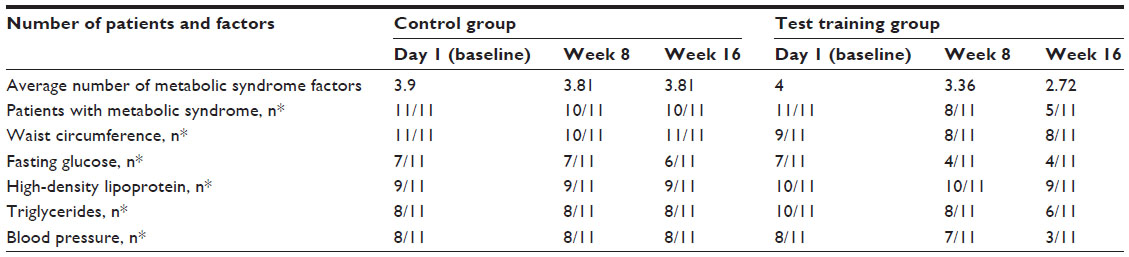 | Table 3 Number of patients with metabolic syndrome according to ATP III definition at day 1 (baseline), week 8, and week 16 of the study period |
Discussion
With increasing chronological age, there is a tendency to accumulate excess weight, often with consequentially marked increase in adiposity. Nearly four decades ago, an eloquent study reported that body fat in adults may double between the ages of 20 years and 60 years, resulting in an increased risk for the development of type 2 diabetes mellitus (T2DM) and cardiovascular disease.26 Obesity per se is directly associated with poor cardiovascular outcomes.27,28 Conversely, reductions in adiposity (physiologically, pharmacologically, or surgically) have been shown to improve and in some cases completely reverse T2DM and improve cardiovascular function.29–31
In this study, 16-week lifestyle intervention (combined continuous and interval aerobic training program) significantly improved risk factor markers for T2DM (fasting plasma glucose and insulin levels, HOMA-IR, and QUICKI) and cardiovascular risk factors (adiposity, BP, and lipid profile) indicating a clear positive impact of our intervention program in these subjects. Moreover, subjects in TTG patients had significantly improved muscular strength, a finding that can guide us for effective management of fatigue in patients with T2DM. In patients with T2DM, there is a persistent muscular weakness in particular in slow twitch muscles (arms and legs).32 The exact mechanism(s) of this phenomenon is not fully understood yet. However, it is possible that a) persistently high plasma glucose (hyperglycemia) may exert toxic effect (glucotoxicity) on muscle fibers, or b) the diabetes-induced neuropathy may impede optimal muscular function. Alternatively, diabetes-induced endothelial damage may limit oxygen delivery to muscular tissue in T2DM patients, resulting in their decreased performance. Indeed, reductions observed in circulating plasma glucose and insulin as well as increase in VO2max in TTG provide plausible arguments for above hypotheses. Other possible explanations may include interference of high level of intramuscular triacylglycerides,33 or alterations in insulin responsiveness of muscle fibers.34 However, further mechanistic studies are required to elucidate the exact mechanism(s) involved in muscular weakness in T2DM.
The most remarkable finding in our study is that improvements observed by our combined continuous and interval aerobic training program were not transient. The program had significant positive effects at week 8 followed by further improvements at week 16, with the exception of plasma glucose and insulin levels. This in turn suggests that biochemical and anthropometric improvement (reduction in % fat, total body weight, waist circumference, BMI, and increased muscular strength) is a continuous flow that could be achieved in proportion to the length and volume of the training program, underlining the need for continuous care program for such patients. In other words, there is a clear evidence indicating susceptibility of the patients’ physiological being to adapt to lifestyle (exercise) changes, further underscoring the importance of the diet and exercise regimen in managing sequelaes of obesity and T2DM. In practice, the continuum of care does not exist which may explain our collective failure in managing obesity and T2DM-related health problems.
As mentioned above, there were no significant changes in plasma glucose and insulin levels between week 8 and week 16. The main reason for this apparent stagnation of the metabolic improvement is that after the first 8 weeks, the fasting plasma glucose and insulin levels in TTG were returned to near-normal levels (fasting plasma glucose: 108 mg/dL and insulin: 11 μIU/mL), which suggests that maximum effect has already been reached by 8 weeks of our exercise program. This finding can have major implications in management of patients with prediabetes and T2DM.
The fat tissue provides the required fuel for exercising muscle during an aerobic training period. The triacylglycerides are first hydrolyzed, and the resultant fatty acids are then transported by blood flow and delivered to the mitochondria of working muscle where they are oxidized. Although the lipolytic rate remains relatively high with increasing exercise intensity, the release of fatty acids into the circulation declines suggesting that increasing exercise intensity inhibits fat oxidation by inhibiting the carnitinepalmitoyltransferase 1A and carnitine-mediated transport of fatty acids into mitochondria.35 In fact, it appears that that maximal fat oxidation occurs at around 42%±6% VO2max (62%±5% MHR) with average fat oxidation rate of 0.45±0.07 g/min.36 Thus, an exercise training program at an intensity that elicits maximal rates of fat oxidation (ie, Fatmax)37 may be a useful armament in weight loss programs and health-related exercise programs. Interval training markedly increases (2.5- to 15-fold) insulin receptor phosphorylation (and thus activation) in muscle and fat tissue.8 In our study, combined continuous and interval training program improved metabolic syndrome markers (hyperglycemia, hyperinsulinemia, insulin sensitivity, and insulin resistance indexes) which may have contributed to increased fat utilization and metabolism leading to decrease in % fat levels in TTG. Taking together previous reports, it is plausible that there was approximately 20% increase in VO2max in TTG pointing to increased rate of fat oxidation, a mechanism which may also have contributed to reduction in adiposity. Therefore, we propose that the “continuous training” could be considered as part of a Fatmax training regimen. However, our finding is in contrast to two previous reports where no significant effect of endurance exercise on body composition indices in metabolic syndrome patients was seen.38,39 These contrasting results may be due to the use of different training equipment and/or patient selection. For instance, both the previous studies38,39 conducted the bulk of their aerobic training on the “cyclo-ergometer” equipment, whereas in this study, the “treadmill” was used during the entire program accounting for reduction in % fat, since the rate of fat oxidation is higher during running than activity on cyclo-ergometer.40
Metabolic syndrome patients have lower physical fitness levels than healthy individuals.32,41 There appears to be a strong link between physical function and mortality such that improving physical function improves overall mortality rate.42,43 In this study, there was a steady increase (baseline to week 8 and week 8 to week 16) in aerobic power of the lower limb in TTG implying the importance of increased intensity and duration of the overload to achieve optimal leg strength. This steady increase in the maximum leg strength signifies non-saturation index (desensitization) to the volume and intensity of the exercises prescribed in our program. Furthermore, progressive improvement in leg strength seen in our study may be at least in part due to reduction in intramuscular triacylglyceride33 and increase in capillary density, muscle mass, citrate synthetase activity, cellular oxidative capacity, and maximal stroke volume that limits VO2max.8,44
The obese and diabetic patients almost always present with hypertension. The presence of the metabolic syndrome amplifies hypertension-related end-organ damages (eg, cardiac and renal) over and above the potential contribution of each single component of this syndrome.45 These patients are often on a number of pharmacological agents to maintain optimal BP. However, despite the use of polypharmacy, optimal target BP is rarely achieved.45 In this study, there was a progressive BP reduction in TTG at week 8 and week 16 compared to their respective baseline. Although we did not directly measure changes in arterial elasticity or the level of nitric oxide production, it is possible that aerobic exercise increased shear stress (stimulating production of nitric oxide) in the artery, leading to improved arterial endothelial function and subsequent decrease in arterial BP. Furthermore, reduction in plasma insulin level seen at week 8 and week 16 may have removed vasoconstrictor pathway of insulin (via endothelin response) leading to lower arterial BP.45
In summary, there is a fast and progressive increase in the incidence and prevalence of obesity and metabolic abnormalities (metabolic syndrome). Obese patients with metabolic syndrome are at increased risk of developing diabetes and cardiovascular disease which would result in premature morbidity and mortality. The lifestyle change remains to be the cornerstone of therapy algorithm. However, the most significant challenge in the management of these conditions remains to be the buy-in from the patients for adequate lifestyle changes. We have shown in this study that a relatively modest but persistent lifestyle change (a programmed exercise regime) would result in improvements in body composition, physical performance, cardiovascular factors, and metabolic factors to an extent of disease reversal in some patients. Therefore, the findings from our study indicate that a “combined continuous and interval aerobic training” could offer an optimal non-pharmacological tool in management of risk factors in patients with metabolic syndrome.
Acknowledgment
The authors would like to express their gratitude to Miss Sara Naderali for her editorial assistance in preparing this manuscript.
Disclosure
The authors have reported no conflict of interest.
References
Reaven GM. Role of insulin resistance in human disease. Diabetes. 1988;37:1595–1607. | |
Grundy SM, Brewer HB Jr, Cleeman JI, Smith SC Jr, Lenfant C. Definition of metabolic syndrome: report of the National Heart, Lung, and Blood Institute/American Heart Association Conference on scientific issues related to definition. Circulation. 2004;109:433–438. | |
Azizi F, Salehi P, Etemadi A, Zahedi-Asl S. Prevalence of metabolic syndrome in an urban population: Tehran Lipid and Glucose Study. Diabetes Res Clin Pract. 2003;61:29–37. | |
Ford ES, Giles WH, Dietz WH. Prevalence of the metabolic syndrome among US adults: findings from the Third National Health and Nutrition Examination Survey. JAMA. 2002;287:356–359. | |
Isomaa B, Almgren P, Tuomi T, et al. Cardiovascular morbidity and mortality associated with the metabolic syndrome. Diabetes Care. 2001;24:683–689. | |
Koren-Morag N, Goldbourt U, Tanne D. Relation between the metabolic syndrome and ischemic stroke or transient ischemic attack: a prospective cohort study in patients with atherosclerotic cardiovascular disease. Stroke. 2005;36:1366–1371. | |
Tkác I. Metabolic syndrome in relationship to type 2 diabetes and atherosclerosis. Diabetes Res Clin Pract. 2005;68(Suppl 1):2–9. | |
Tjønna AE, Lee SJ, Rognmo Ø, et al. Aerobic interval training versus continuous moderate exercise as a treatment for the metabolic syndrome a pilot study. Circulation. 2008;118:346–354. | |
Irving BA, Davis CK, Brock DW, et al. Effect of exercise training intensity on abdominal visceral fat and body composition. Med Sci Sports Exerc. 2008;40:1863–1872. | |
Yang X, Telama R, Hirvensalo M, Mattsson N, Viikari JS, Raitakari OT. The longitudinal effects of physical activity history on metabolic syndrome. Med Sci Sports Exerc. 2008;40:1424–1431. | |
O’Leary VB, Marchetti CM, Krishnan RK, Stetzer BP, Gonzalez F, Kirwan JP. Exercise-induced reversal of insulin resistance in obese elderly is associated with reduced visceral fat. J Appl Physiol. 2006;100:1584–1589. | |
Okauchi Y, Nishizawa H, Funahashi T, et al. Reduction of visceral fat is associated with decrease in the number of metabolic risk factors in Japanese men. Diabetes Care. 2007;30:2392–2394. | |
LaMonte MJ, Barlow CE, Jurca R, Kampert JB, Church TS, Blair SN. Cardiorespiratory fitness is inversely associated with the incidence of metabolic syndrome: a prospective study of men and women. Circulation. 2005;112:505–512. | |
Okura T, Nakata Y, Ohkawara K, et al. Effects of aerobic exercise on metabolic syndrome improvement in response to weight reduction. Obesity. 2007;15:2478–2484. | |
Jurca R, Lamonte MJ, Church TS, et al. Associations of muscle strength and aerobic fitness with metabolic syndrome in men. Med Sci Sports Exerc. 2004;36:1301–1307. | |
Hsu C-N, Chen Y-C, Wang T-D. Prevalence and characteristics of the metabolic syndrome in Chinese hypertensive patients: a hospital-based observation. Acta Cardiol Sin. 2005;21:89–97. | |
Lee JM, Kim SR, Yoo SJ, Hong OK, Son HS, Chang SA. The relationship between adipokines, metabolic parameters and insulin resistance in patient with metabolic syndrome and type 2 diabetes. J Int Med Res. 2009;37:1803–1812. | |
Menuet R, Lavie CJ, Milani RV. Importance and management of dyslipidaemia in the metabolic syndrome. Am J Med Sci. 2005;330:295–302. | |
Lakka TA, Laaksonen DE. Physical activity in prevention and treatment of the metabolic syndrome. Appl Physiol Nutr Metab. 2007;32:76–88. | |
Expert Panel on Detection, Evaluation, and Treatment of High Blood Cholesterol in Adults. Executive summary of the Third Report of the National Cholesterol Education Program (NCEP) expert panel on detection, evaluation, and treatment of high blood Cholesterol (adult treatment panel III). JAMA. 2001;285:2486–2497. | |
Malekshah AF, Kimiagar M, Saadatian-Elahi M, et al. Validity and reliability of a new food frequency questionnaire compared to 24 h recalls and biochemical measurements: pilot phase of Golestan cohort study of esophageal cancer. Eur J Clin Nutr. 2006;60:971–977. | |
Lippincott N, Williams Y. ACSM’s Guidelines for Exercise Testing and Prescription. 7th ed. New York: American College of Sports Medicine; 2005. | |
Matthews DR, Hosker JP, Rudenski AS, Naylor BA, Treacher DF, Turner RC. Homeostasis model assessment: insulin resistance and cell function from fasting plasma glucose and insulin concentrations in man. Diabetologia. 1985;28:412–419. | |
Katz A, Nambi SS, Mather K, et al. Qunatitative inulin sensitivity check index: a simple, accurate method for assessing insulin sensitivity in humans. J Clin Endocrionl Metab. 2000;85:402–410. | |
Heyward VH. Advanced Fitness Assessment and Exercise Prescription. 5th ed. Leeds: Human Kinetics Europe Ltd; 2006. | |
Cohn SH, Vaswani A, Zanzi I, Aloia JF, Roginsky MS, Ellis KJ. (1976) Changes in body chemical composition with age measured by total-body neutron activation. Metabolism. 1976;25:85–95. | |
Obesity. World Heart Federation. Available from: http://www.world-heart-federation.org/cardiovascular-health/cardiovascular-disease-risk-factors/obesity/. Accessed December 21, 2014. | |
Naderali EK. Obesity and cardiovascular dysfunction: a role for resveratrol? Obes Res Clin Pract. 2009;3(1):1–5. | |
Naderali EK, Fatani S, Williams G. Chronic withdrawal of a high-palatable obesity-inducing diet completely reverses metabolic and vascular abnormalities associated with dietary-obesity in the rat. Atherosclerosis. 2004;172:63–69. | |
Su X, Magkos F, Zhou D, et al. Adipose tissue monomethyl branched-chain fatty acids and insulin sensitivity: effects of obesity and weight loss. Obesity. 2015;23(2):329–334. | |
Lim EL, Hollingsworth KG, Aribisala BS, Chen MJ, Mathers JC, Taylor R. Reversal of type 2 diabetes: normalisation of beta cell function in association with decreased pancreas and liver triacylglycerol. Diabetologia. 2011;54:2506–2514. | |
Sartorio A, Fontana P, Trecate L, Lafortuna CL. Short-term changes of fatigability and muscle performance in severe obese patients after an integrated body mass reduction program. Diabetes Nutr Metab. 2003;16:88–93. | |
Fatani S, Abubakari AR, Itua I, Wong C, Thomas C, Naderali EK. Effects of diet-induced obesity on protein expression in insulin signalling pathways of skeletal muscle in male Wistar rats. Int J Gen Med. 2012;5:573–582. | |
Albers PH, Pedersen AJ, Birk JB, et al. Human muscle fiber type specific insulin signaling – impact of obesity and type 2 diabetes. Diabetes. 2015;64(2):485–497. | |
Horowitz JF. Fatty acid mobilization from adipose tissue during exercise. Trends Endocrinol Metab. 2003;14:386–392. | |
Lazzer S, Lafortuna C, Busti C, et al. Fat oxidation rate during and after a low – or high – intensity exercise in severely obese Caucasian adolescents. Eur J Appl Physiol. 2009;10:1007–1234. | |
Jeukendrup AE, Achten J. Fatmax: a new concept to optimize fat oxidation during exercise? Eur J Sport Sci. 2001;5:1–5. | |
Cuff DJ, Meneilly GS, Martin A, Ignaszewski A, Tildesley HD, Frohlich JJ. Effective exercise modality to reduce insulin resistance in women with type 2 diabetes. Diabetes Care. 2003;26:2977–2982. | |
Lambers S, Van Laethem C, Van Acker K, Calders P. Influence of combined exercise training on indices of obesity, diabetes and cardiovascular risk in type 2 diabetes patients. Clin Rehabil. 2008;22:483–492. | |
Capostagno B, Bosch A. Higher fat oxidation in running than cycling at the same exercise intensities. Int J Sport Nutr Exerc Metab. 2010;20:44–55. | |
Nyholm B, Mengel A, Nielsen S, et al. Insulin resistance in relatives of NIDDM patients: the role of physical fitness and muscle metabolism. Diabetologia. 1996;39:813–822. | |
Blair SN, Brodney S. Effects of physical inactivity and obesity on morbidity and mortality: current evidence and research issues. Med Sci Sports Exerc. 1999;31:646–662. | |
Vatten LJ, Nilsen TI, Romundstad PR, Droyvold WB, Holmen J. Adiposity and physical activity as predictors of cardiovascular mortality. Eur J Cardiovasc Prev Rehabil. 2006;13:909–915. | |
Nemoto K, Gen-No H, Masuki S, Okazaki K, Nose H. Effects of high- intensity interval walking training on physical fitness and blood pressure in middle – aged and older people. Mayo Clin Proc. 2007;82:803–811. | |
Singer GM, Setaro JF. Secondary hypertension: obesity and the metabolic syndrome. Clin Hypertens. 2008;10:567–574. |
 © 2015 The Author(s). This work is published and licensed by Dove Medical Press Limited. The full terms of this license are available at https://www.dovepress.com/terms.php and incorporate the Creative Commons Attribution - Non Commercial (unported, v3.0) License.
By accessing the work you hereby accept the Terms. Non-commercial uses of the work are permitted without any further permission from Dove Medical Press Limited, provided the work is properly attributed. For permission for commercial use of this work, please see paragraphs 4.2 and 5 of our Terms.
© 2015 The Author(s). This work is published and licensed by Dove Medical Press Limited. The full terms of this license are available at https://www.dovepress.com/terms.php and incorporate the Creative Commons Attribution - Non Commercial (unported, v3.0) License.
By accessing the work you hereby accept the Terms. Non-commercial uses of the work are permitted without any further permission from Dove Medical Press Limited, provided the work is properly attributed. For permission for commercial use of this work, please see paragraphs 4.2 and 5 of our Terms.