")
Back to Journals » International Journal of Nanomedicine » Volume 11
A combination of sorafenib and nilotinib reduces the growth of castrate-resistant prostate cancer
Authors Archibald M, Pritchard T, Nehoff H, Rosengren RJ, Greish K , Taurin S
Received 28 September 2015
Accepted for publication 25 November 2015
Published 8 January 2016 Volume 2016:11 Pages 179—201
DOI https://doi.org/10.2147/IJN.S97286
Checked for plagiarism Yes
Review by Single anonymous peer review
Peer reviewer comments 3
Editor who approved publication: Dr Thomas Webster
Monica Archibald,1 Tara Pritchard,1 Hayley Nehoff,1 Rhonda J Rosengren,1 Khaled Greish,1,2 Sebastien Taurin1
1Department of Pharmacology and Toxicology, University of Otago, Dunedin, New Zealand; 2Aljawhara Centre for Molecular Medicine, Arabian Gulf University, Manama, Kingdom of Bahrain
Abstract: Castrate-resistant prostate cancer (CRPC) remains incurable due to the lack of effective therapies. Several tyrosine kinases have been implicated in the development and growth of CRPC, as such targeting these kinases may offer an alternative therapeutic strategy. We established the combination of two tyrosine kinase inhibitors (TKIs), sorafenib and nilotinib, as the most cytotoxic. In addtion, to improve their bioavailability and reduce their metabolism, we encapsulated sorafenib and nilotinib into styrene-co-maleic acid micelles. The micelles’ charge, size, and release rate were characterized. We assessed the effect of the combination on the cytotoxicity, cell cycle, apoptosis, protein expression, tumor spheroid integrity, migration, and invasion. The micelles exhibited a mean diameter of 100 nm, a neutral charge, and appeared highly stable. The micellar TKIs promoted greater cytotoxicity, decreased cell proliferation, and increased apoptosis relative to the free TKIs. In addition, the combination reduced the expression and activity of several tyrosine kinases and reduced tumor spheroid integrity and metastatic potential of CRPC cell lines more efficiently than the single treatments. The combination increased the therapeutic potential and demonstrated the relevance of a targeted combination therapy for the treatment of CRPC. In addition, the efficacy of the encapsulated drugs provides the basis for an in vivo preclinical testing.
Keywords: sorafenib, nilotinib, castrate-resistant prostate cancer, tyrosine kinase inhibitors, nanomedicine
Introduction
Prostate cancer is the most prevalent noncutaneous cancer diagnosed in men in developed countries and remains a leading cause of cancer-associated death among men worldwide.1 The standard treatment for localized prostate cancer includes surgery and radiotherapy. Although this treatment can be curative, in 20%–30% of patients, the tumor eventually spreads beyond the prostate boundary.2 Should progression occur, radiotherapy followed by androgen-deprivation therapy (ADT) has shown to improve overall patient survival.3,4 Early studies by Huggins and Hodges5 showed that chemical castration induced tumor regression. Currently, ADT includes luteinizing hormone-releasing hormone agonists and androgen-receptor (AR) antagonists.6 A clinical response to ADT occurs in approximately 80% of patients, where tumor regression initially correlates with a decrease in the serum level of prostate-specific antigen (PSA), a clinical biomarker.7 Despite ADT, the serum level of PSA increases as the tumor progresses to a more aggressive phenotype and eventually spreads to distant sites.8 Castrate resistance is a hallmark of prostate cancer with a 5-year relative survival rate of approximately 25%–33%.9 In recent years, several treatments have been approved for castrate-resistant prostate cancer (CRPC) extending overall survival by up to 35%.10–13 Although current treatment strategies provide a small survival benefit in some patients, no drug provides a cure, and the development of alternative or complementary therapies is, therefore, necessary.
Several contributors have been proposed to explain the recurrence of prostate cancer, its evolution toward metastatic CRPC (mCRPC), and acquired resistance to anticancer treatments. AR expression status was initially overlooked as prostate cancer appeared to grow despite low levels of circulating androgen. However, more recent studies have identified the AR as a major promoter of CRPC. The amplification of the AR gene copy number, the existence of splice variants, the identification of gain-of-function point mutations, the altered expression of AR coregulators, or even the autocrine androgen production by prostate tumor cells have been identified as factors contributing to the development of mCRPC.14,15 Furthermore, activation of the AR can also result from deregulated signaling pathways involving receptor tyrosine kinases (RTKs) such as the epidermal growth factor receptor (EGFR) or c-Met, or non-RTKs such as SRC and cytokine receptors.16,17 EGFR overexpression is observed in more than 40% of CRPC patients, but the use of specific EGFR inhibitors in the clinic has failed to provide survival benefits.18 Additional mechanisms independent of AR status and involving tyrosine kinases also contribute to the development of mCRPC including the bypass and outlaw pathways, which rely on the local overexpression of growth factors or associated receptors, the activation of oncogenes, and the inhibition of tumor suppressor genes.19
In a preliminary study, we chose eight tyrosine kinase inhibitors (TKIs), targeting proteins associated with the development and progression of mCRP (as listed in Table 1) and assessed their cytoxicity either alone or in combination. A combination of sorafenib and nilotinib proved to be the most efficacious against CRPC cells in vitro. Sorafenib targets multiple tyrosine and serine/threonine kinases, including the vascular endothelial growth factor receptor (VEGFR) family, platelet-derived growth factor receptor (PDGFR)-β, stem cell factor receptor (KIT), RET tyrosine kinase, Flt-3 kinase, B-RAF, and C-RAF.20 Sorafenib has been approved by the US Food and Drug Administration (FDA) for the treatment of hepatocellular carcinoma, renal cell carcinoma, and thyroid cancer.21–23 The anticancer effect of sorafenib for the treatment of CRPC has currently been assessed in Phase II clinical trials.24 Nilotinib is a TKI that targets Bcr-Abl as well as other kinases, including PDGFR-α, KIT, discoidin domain receptor, and colony-stimulating factor receptor-1.25 Nilotinib is currently approved by the FDA for the treatment of imatinib-resistant chronic myeloid leukemia.26 The anticancer effect of nilotinib in CRPC has only been documented in one study and showed mixed results.27
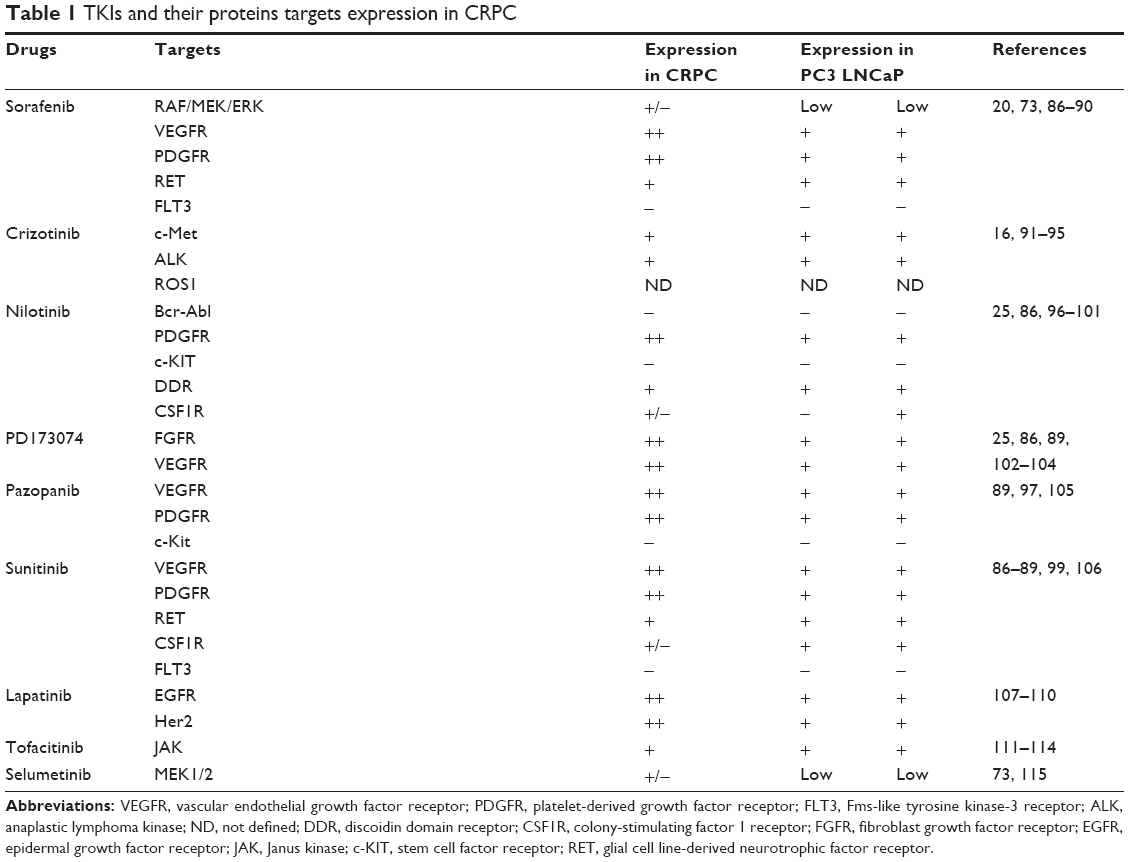 | Table 1 TKIs and their proteins targets expression in CRPC |
Sorafenib and nilotinib are poorly soluble in aqueous environments.28,29 In addition, treatment with sorafenib has been discouraged in elderly patients due to signs of cardiac toxicity.30 The encapsulation of sorafenib and nilotinib into nanoparticles may improve the drugs solubility and stability, minimize the toxic side effects, and allow the drug to accumulate at the tumor site through the enhanced permeability and retention (EPR) effect.31 In this study, we prepared sorafenib- and nilotinib-loaded poly(styrene-co-maleic acid [SMA]) micelles. We characterized the micelles, including their loading, size, charge, and release rate and assessed their anticancer effect using two CRPC cell lines in vitro.
Materials and methods
Materials
Cumene-terminated poly(styrene-co-maleic anhydride) with an average Mn ~1,700, N-(3-dimethylaminopropyl)-N-ethyl-carbodiimide hydrochloride (EDAC), penicillin, streptomycin, and sulforhodamine B (SRB) were obtained from Sigma-Aldrich Ltd. (St Louis, MO, USA). Sorafenib (Sor), nilotinib (Nilo), crizotinib (Crizo), PD173074 (PD), pazopanib (Pazo), sunitinib (Suni), lapatinib (Lap), tofacitinib (Tofa), and selumetinib (Selu) were purchased from LC Laboratories (Woburn, MA, USA).
Methods
Cell culture
The CRPC cell lines, PC3 and LNCaP, were obtained from American Type Culture Collection (Manassas, VA, USA). Cells were maintained in complete growth medium composed of Dulbecco’s Modified Eagle Medium/Ham’s F12 supplemented with 5% fetal bovine serum, 2 mM L-glutamine, 100 units/mL penicillin, 100 μg/mL of streptomycin, and 2.2 g/L of sodium bicarbonate. For all procedures, cells were harvested using TrypLE Express (Thermo Fisher Scientific, Waltham, MA, USA) and maintained at 37°C in a humidified atmosphere with 5% CO2. The research was conducted according to the principles of the Declaration of Helsinki.
Preparation of SMA-Sor and SMA-Nilo micelles
SMA-Sor and SMA-Nilo micelles were prepared as described previously.32 Briefly, the hydrolyzed SMA solution was adjusted to pH 5; sorafenib or nilotinib was dissolved in a minimum volume of dimethyl sulfoxide (DMSO) and added to the SMA solution while stirring. Water-solubilized EDAC was then added to the mixture and stirred for 20 minutes at pH 5. The solution was then adjusted to pH 11 with 0.1 N NaOH and stirred for 30 minutes to allow micelle formation. The pH of the clear solution was readjusted to pH 7.4 with HCl 0.1 N. The clear micelle suspension was ultrafiltered four times using a lab-scale ultrafiltration system mounted with a Pellicon XL filter 10 kDa (Merck Millipore, Billerica, MA, USA). The concentrated micelle solution was lyophilized to obtain the final SMA-Sor or SMA-Nilo powder.
Loading of SMA-Sor and SMA-Nilo
A standard curve for sorafenib and nilotinib were prepared in DMSO and measured at 270 nm. Drug content of SMA-Sor and SMA-Nilo micelles was determined by solubilizing the micelles (1 mg/mL) in DMSO and measuring the absorbance at 270 nm in comparison with their respective standard curve. The loading was expressed as % weight of sorafenib or nilotinib in the final micelle compared to the total weight of recovered SMA-Sor or SMA-Nilo, respectively. We determined a loading of 16.8% and 16.4% w/w for SMA-Sor and SMA-Nilo, respectively.
Size and zeta potential of SMA-Sor and SMA-Nilo micelles
SMA-Sor and SMA-Nilo micelles (8 mg/mL) were solubilized in sodium bicarbonate (0.1 M, pH 7.4) or water for the determination of mean intensity-weighted diameter and zeta potential, respectively. All measurements for size distribution and zeta potential were carried out using the Malvern ZEN3600 Zetasizer Nano Series (Malvern Instruments Inc., Westborough, MA, USA). Measurements were taken from three independent experiments, conducted in triplicate.
Sorafenib and nilotinib release profile
The release of sorafenib and nilotinib from the micellar constructs was evaluated using a dialysis method. SMA-Sor and SMA-Nilo micelles were solubilized at a concentration of 1 mg/mL in phosphate-buffered saline (PBS) and placed in a dialysis bag (2 mL) with a molecular weight cutoff of 12 kDa. The micelle resuspension was dialyzed against 20 mL of PBS adjusted to either pH 5.5, 6.8, or 7.4. Over a period of 96 hours, aliquots of the solution outside the dialysis bag were removed, and the absorbance measured at 270 nm. Quantification of the percentage of release was determined by the ratio of the absorbance of the solution outside the bag at defined time points divided by the absorbance inside the bag at t=0. All experiments were performed in triplicate. Percentage release is reported as a mean ± standard error.
Cytotoxicity of sorafenib, nilotinib, SMA-Sor, and SMA-Nilo
PC3 (4×10³ cells/well) and LNCaP (8×10³ cells/well) cells were seeded in 96-well plates and incubated for 24 hours at 37°C in 5% CO2 and then treated with a range of concentrations from 0 to 15 μM of either free sorafenib, free nilotinib, SMA-Sor, or SMA-Nilo. The cells were incubated for 72 hours and fixed using trichloroacetic acid. Cell number was determined using the SRB assay.33 The concentration required to decrease the cell number by 50% (IC50 [half maximal inhibitory concentration]) was determined by nonlinear regression using Graphpad Prism™ software (GraphPad Software, Inc., San Diego, CA, USA). Measurements were taken from three independent experiments conducted in triplicate. The preliminary study used various TKIs at a concentration of 2.5 μM and evaluated the cytotoxicity as single or combination treatments in PC3 cells as described earlier. For the time course study, cells were treated with 2.5 μM of sorafenib free or micellar, 3 μM of nilotinib free or micellar, and DMSO or SMA for 12, 24, 36, 48, and 72 hours. At the specified time, cells were processed as described earlier. All experiments were performed in triplicate and repeated independently three times.
Cell cycle analysis
PC3 (8×10⁴ cells/well) and LNCaP (3×10⁵ cells/well) cells were seeded in six-well plates in 1.5 mL of complete growth media. Cells were treated with 2.5 μM of free or micellar sorafenib, 3 μM of free or micellar nilotinib, DMSO, or SMA for 48 hours. Cell cycle distribution was assessed using propidium iodide staining, as previously described.34 Samples were analyzed using an FACScalibur flow cytometer (BD Biosciences, San Jose, CA, USA) and the proportion of cells in G0/G1-, S-, and G2/M-phases was determined using CellQuest Pro software (BD Biosciences). All experiments were performed in triplicate and repeated independently three times.
Apoptosis analysis
PC3 (8×10⁴ cells/well) and LNCaP (3×10⁵ cells/well) cells were seeded in six-well plates in 1.5 mL of complete growth media. Cells were treated with 2.5 μM of free or micellar sorafenib, 3 μM of free or micellar nilotinib, DMSO, or SMA for 48 hours. Apoptosis was assessed using Annexin-V-FLUOS/propidium iodide staining, as described previously.34 Samples were analyzed using an FACScalibur flow cytometer and the proportion of apoptotic cells was determined using CellQuest Pro software (BD Biosciences). All experiments were performed in triplicate and repeated independently three times.
Western blot
PC3 (1×10⁶) and LNCaP (1.5×10⁶) cells were seeded in 10 cm Petri dishes in 10 mL of complete growth media and incubated for 36 hours. Cells were treated with 2.5 μM of free or micellar sorafenib, 3 μM of free or micellar nilotinib, DMSO, or SMA for 48 hours. Cells were lysed in buffer containing Tris-HCl 50 mM (pH 8), sodium chloride 150 mM (NaCl), Triton X-100 1%, sodium dodecyl sulfate (SDS) 1%, sodium fluoride 1 mM, sodium orthovanadate 200 μM, and protease inhibitors (leupeptin 1 μg/mL, aprotinin 1 μg/mL, phenylmethylsulfonyl fluoride 1 mM). The lysates were cleared of insoluble material by centrifugation at 20,000× g for 10 minutes, boiled in Laemmli buffer, subjected to polyacrylamide gel electrophoresis, and analyzed by Western blotting using polyvinyl difluoride membrane. Antibodies used were as follows: anti-VEGFR-2 (D5B1, Cell Signaling Technology; Beverly, MA, USA); antiphospho focal adhesion kinase (FAK) (D20B1, Cell Signaling); anti-FAK (D2R2E, Cell Signaling); anti-PDGFR (D1E1E, Cell Signaling), antiphospho-EGFR (tyr1148) (Cell Signaling), anti-EGFR (D38B1, Cell Signaling), antiphospho-AKT (193H2, Cell Signaling), anti-AKT (Cell Signaling), antiphospho-SRC (D49G4, Cell Signaling), anti-SRC (32G6, Cell Signaling), and β-tubulin (2-28-3, Sigma-Aldrich Ltd). Secondary horseradish peroxidase (HRP)-conjugated antibodies were from Merck Millipore, and HRP can be detected using SuperSignal West Pico Chemiluminescent Substrate (Thermo Fisher Scientific).
Indirect immunofluorescence microscopy
Immunofluorescence was performed as described previously.34,35 LNCaP cells (2.5×10⁴ cells/well) seeded on glass slides were incubated for 36 hours and treated with 2.5 μM of free or micellar sorafenib, 3 μM of free or micellar nilotinib, DMSO, or SMA for 48 hours. Cells were washed twice with ice-cold PBS, fixed with 4% paraformaldehyde in PBS for 15 minutes at room temperature, washed again with PBS, and permeabilized in 0.2% Tween-20 in PBS for 15 minutes, followed by incubation with 1% bovine serum albumin (BSA) in PBS for 1 hour. The cells were then incubated with anti-AR antibody (D6F11 XP, Cell Signaling Technology; 5 μg/mL in PBS/BSA, as described earlier) overnight at 4°C and washed four times with PBS, followed by incubation with Dylight 594 goat anti-rabbit IgG antibody (Vector Laboratories, Burlingame, CA, USA; 10 μg/mL in PBS/BSA, as described earlier) for 1 hour at room temperature. The slides were again washed four times with PBS, and the coverslips were mounted using Gel/Mount aqueous mounting medium (Fisher, Pittsburgh, PA, USA). The images were taken using Nikon Eclipse Ni-E upright epifluorescence microscope (Nikon Corporation, Tokyo, Japan).
Tumor spheroids and cell viability via acid phosphatase assay
Tumor spheroids were produced as described by Friedrich et al.36 Briefly, PC3 (4×10³ cells) and LNCaP (8×10³ cells/well) cells were transferred to a 96-well plate precoated with agarose (1.5% w/v). Cells were incubated for 4 days and then treated with 2.5 μM of free sorafenib or an equivalent sorafenib concentration of SMA-Sor, 3 μM of free nilotinib or an equivalent nilotinib concentration of SMA-Nilo, DMSO, or SMA for 15 days. Culture medium and treatments were renewed every 4 days. At the end of the treatment period, photographs were taken, and cell viability was assessed by an acid phosphatase assay as previously described.36 Briefly, tumor spheroids were collected, washed in PBS, and incubated in the presence of acid phosphatase buffer (0.1 M sodium acetate, 0.1% Triton X-100 and p-nitrophenyl phosphate [2 mg/mL]) for 90 minutes at 37°C. The reaction was stopped with NaOH (1 N) and quantified at 405 nm on a microplate reader. The results are expressed as a percentage of control. The three independent experiments were performed in sextuplicate.
Cell migration
Migration of PC3 cells was measured using an in vitro cell scratch assay. After cells grown in six-well plates had reached 90% confluency, a scratch was made with a 10 μL pipette tip, followed by extensive washing with serum-free medium to remove cell debris. Free or micellar sorafenib (2.5 μM) or free or micellar nilotinib (3 μM) or controls (SMA or DMSO) were then added. Cells were allowed to migrate into the scraped area for up to 20 hours at 37°C, 5% CO2 before being photographed. Experiments were performed in triplicate and repeated independently three times.
Cell invasion
PC3 cells (4×10⁴) were seeded onto Boyden chambers (8 μm pore; In Vitro Technologies, Auckland, New Zealand) coated with Geltrex (Life Technologies) and treated with free or micellar sorafenib (2.5 μM), or free or micellar nilotinib (3 μM) or controls (SMA or DMSO). Fetal bovine serum (5%) was used as a chemoattractant in the lower chamber containing complete growth media. After 20 hours, the filters were fixed in methanol and stained using Diff-Quick staining solutions. Cells from each well were counted under an inverted microscope at 200× magnification. The invasion was expressed as the percentage of cells passing through the basement membrane layer over the number of cells counted in the control well without basement membrane. Data were collected from three independent experiments, conducted in triplicate. Migrated cells were counted and analyzed using the Student’s t-test.
MMP-9 activity assay and MMP-9 and isthmin-1 secretion
PC3 cells (1×10⁶) were seeded in 10 cm Petri dishes in 10 mL of complete growth media and incubated for 36 hours. The cells were washed with PBS and then incubated in serum-free media and treated with 2.5 μM of free or micellar sorafenib, 3 μM of free or micellar nilotinib, DMSO, or SMA for 48 hours. Following treatment, media was collected, centrifuged to remove cell debris, and freeze-dried for 12 hours. Samples were rehydrated and mixed with loading buffer (0.4 M Tris, pH 6.8, 5% SDS, 20% glycerol, 0.03% bromophenol blue). For zymography, samples were loaded on a 10% SDS-polyacrylamide gel containing 1 mg/mL of gelatin. After electrophoresis, the gels were incubated in renaturing solution (2.5% Triton-X-100 (w/v)) for 30 minutes at room temperature and then for 24 hours at 37°C in a developing buffer containing 50 mM Tris, pH 7.5, 200 mM NaCl, 4 mM calcium chloride (CaCl2), and 0.02% NP40. The gels were then stained with Coomassie blue R250, and regions without staining were indicative of gelatin lysis. The gels were briefly rinsed and scanned. For MMP-9 and isthmin-1 (ISM1) secretion, samples were loaded on a 10% SDS-polyacrylamide gel, and the expression of MMP-9 and ISM-1 was assessed by Western blotting using anti-MMP-9 (D6O3H, Cell Signaling) and anti-isthmin-1 antibodies (Biorbyt, San Francisco, CA, USA).
Statistics
Groups were compared using a Student’s t-test or one-way analysis of variance (ANOVA) for Figures 1, 4, 5, 8 and 9 and Supplementary Figures 1 and 2. Two-way ANOVA was used for Figures 2 and 3. In all cases, the ANOVA was coupled with the Student–Newman–Keuls post hoc test. For all analyses, P<0.05 was the minimal requirement for a statistically significant difference.
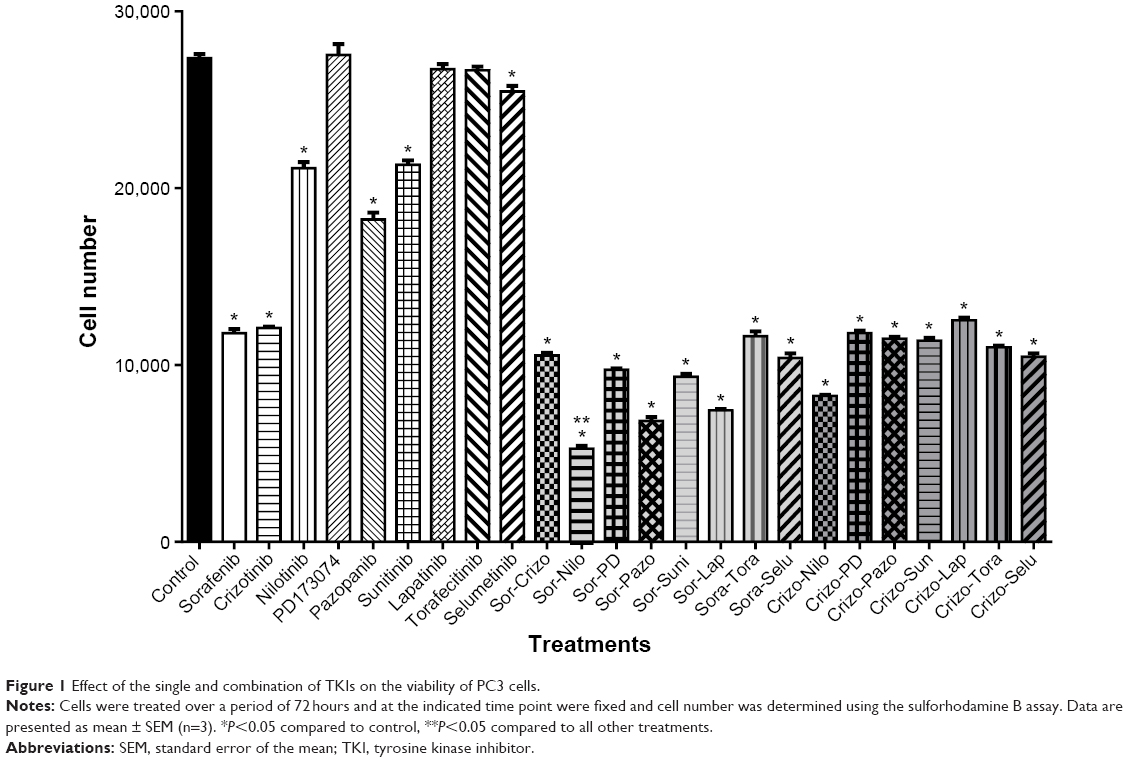 | Figure 1 Effect of the single and combination of TKIs on the viability of PC3 cells. |
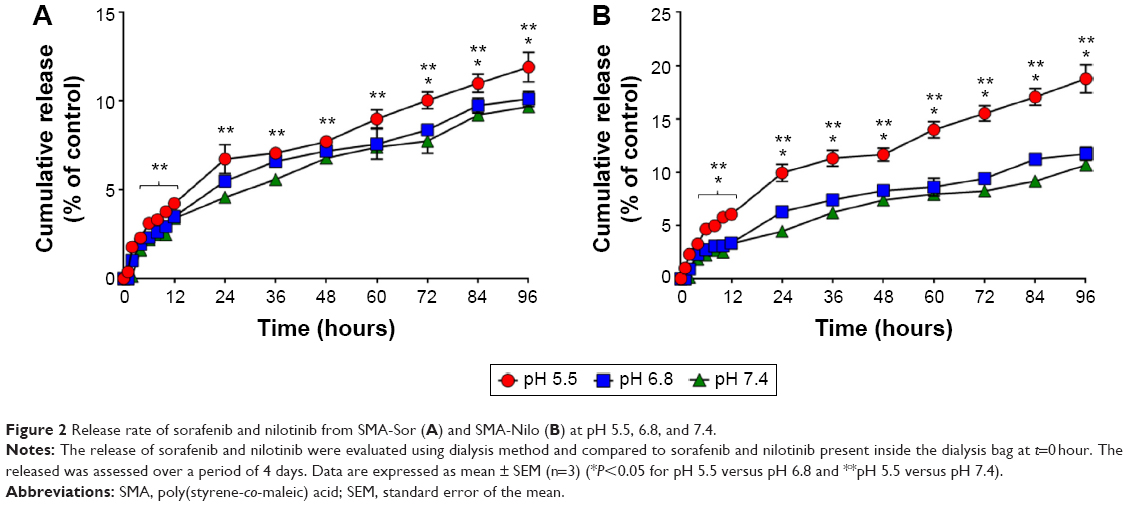 | Figure 2 Release rate of sorafenib and nilotinib from SMA-Sor (A) and SMA-Nilo (B) at pH 5.5, 6.8, and 7.4. |
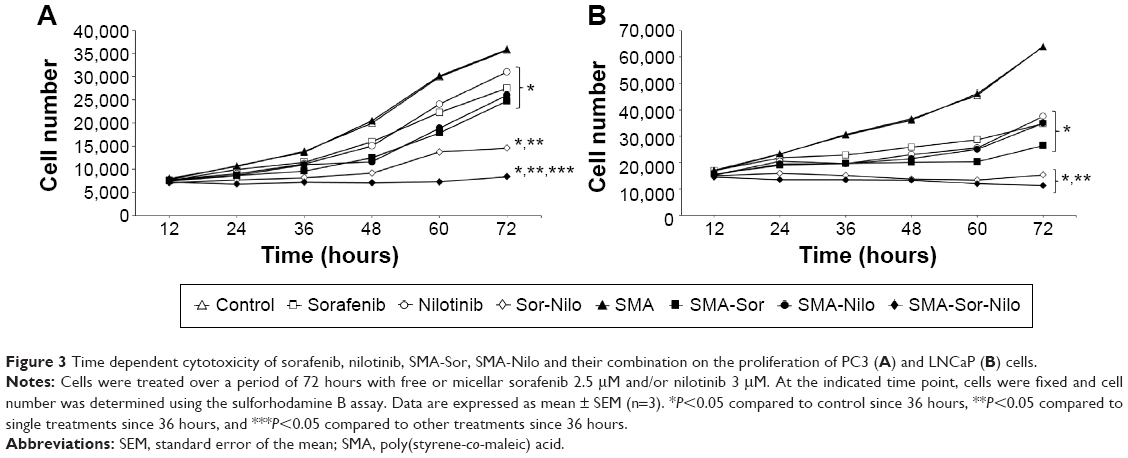 | Figure 3 Time dependent cytotoxicity of sorafenib, nilotinib, SMA-Sor, SMA-Nilo and their combination on the proliferation of PC3 (A) and LNCaP (B) cells. |
Results
A combination of sorafenib and nilotinib reduces cell viability of PC3 cells
To determine the optimal combination of TKIs that elicit cytotoxicity toward CRPC cells, PC3 cells were treated with 2.5 μM of TKIs as single or in combination treatment for 72 hours. The combination of sorafenib and nilotinib decreased cell viability by 80% after 72 hours, and this was statiscally significant compared to all other treatments (Figure 3). Thus, this combination was studied further.
Synthesis and characterization of SMA-Sor and SMA-Nilo
SMA is an amphiphilic block copolymer forming a self-assembled micellar structure in aqueous solution. We generated SMA-Sor and SMA-Nilo micelles with a theoretical loading of 20%, the encapsulation efficiency was between 85% and 88%, and the loading efficiency of 16.8% and 16%, respectively, as determined by the weight ratio of the drug over total SMA micelle weight (Table 2). Sorafenib and nilotinib encapsulation into SMA micelles improved their solubility in aqueous solution by 1,357-fold (0.00171–2.32 mg/mL) and 1,313-fold (0.00201–2.65 mg/mL), respectively. The mean micelle diameter, measured by dynamic light scattering, was 109±28.9 and 113±35.2 nm for SMA-Sor and SMA-Nilo, respectively (Table 2). The charges of SMA-Sor and SMA-Nilo were near neutral (Table 2). The physicochemical characteristics of size and charge of both micelles are predictive for improved biodistribution and circulatory half-life when administrated systemically. A micellar size greater than 7 nm escapes renal filtration,37 while the size and neutral charge of the micelles will reduce their possible interaction with the reticuloendothelial system (RES).37
 | Table 2 Characteristics of the sorafenib and nilotinib micelles |
Release rate of the drugs from the micelle
As illustrated in Figure 1, the release profiles of SMA-Sor and SMA-Nilo micelles were stable at physiological pH 7.4 with less than 3.4% and 3.3% released of sorafenib and nilotinib in the first 12 hours, respectively (Figure 1). The release of both drugs was sustained over 96 hours with 9.7% and 10.7% sorafenib and nilotinib released from the micelles, respectively (Figure 1). This release rate indicates that the micelles are stable at physiological pH. At a pH of 6.8, comparable to the pH surrounding the tumor tissue, the release after 96 hours was 10.1% and 11.7% for sorafenib and nilotinib, respectively (Figure 1). The low release in the tumor microenvironment may promote their internalization by the tumor cells through endocytosis to act synergistically on the targeted tumor cells. Release at pH 5.5, equivalent to the pH of the lumen of endosomes, was relatively faster than at pH 6.8 and 7.4. At pH 5.5, 12% SMA-encapsulated sorafenib and 18.8% SMA-encapsulated nilotinib were released after 96 hours (Figure 1). The acidic environment promotes a conformational transition of SMA,38 allowing a slow release of the encapsulated drug.
Cytotoxicity of sorafenib, SMA-Sor, nilotinib, and SMA-Nilo
The cytotoxicity of sorafenib, SMA-Sor, nilotinib, and SMA-Nilo micelles toward LNCaP and PC3 cells was evaluated in vitro using an SRB assay over 72 hours. As listed in Table 3, the concentration of SMA-Sor that decreased the number of cells by 50% (IC50) was nearly identical to free sorafenib in LNCaP cells. In PC3 cells, the encapsulation of sorafenib slightly improved its cytotoxicity and decreased the IC50 by almost 20% from 4.08 to 3.29 μM for sorafenib and SMA-Sor, respectively. The encapsulation of nilotinib improved its cytotoxicity by nearly 46% in LNCaP cells from an IC50 value of 2.98–1.59 μM, and by 22% in PC3 cells with IC50 value of 3.97 and 3.08 μM for nilotinib and SMA-Nilo, respectively (Table 3). The effects of a combination of sorafenib and nilotinib and their micellar formulations were further evaluated over a time course of 72 hours using the same cell lines. The cells were treated with 2.5 μM of free or micellar sorafenib, 3 μM of free or micellar nilotinib; DMSO (0.034%) or SMA (1.55 mg/mL) was used as control groups. In PC3 cells, sorafenib treatment decreased the cell number by 23%, while SMA-Sor reduced it by 27.2% (Figure 2A). A similar trend was observed following nilotinib and SMA-Nilo treatments, where cell numbers were decreased by 13.1% and 27.2%, respectively (Figure 2A). The combination of sorafenib and nilotinib and their micellar formulations reduced the cell number by 59.2% and 76.4%, respectively (Figure 2A). In LNCaP cells, sorafenib and SMA-Sor decreased the cell number by 45% and 58.7%, respectively, and nilotinib and SMA-Nilo treatments reduced cell number by 41.3% and 45%, respectively (Figure 2B). Free and micellar combination treatments decreased the cell number by 76% and 82%, respectively (Figure 2B). These results demonstrated that a combination of sorafenib and nilotinib was more potent than the single drug treatments, and encapsulation of the drugs only further improved their cytotoxicity.
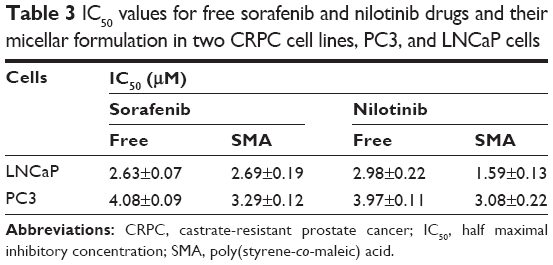 | Table 3 IC50 values for free sorafenib and nilotinib drugs and their micellar formulation in two CRPC cell lines, PC3, and LNCaP cells |
Sorafenib and nilotinib treatment decreased cell cycle progression in PC3 and LNCaP cells
PC3 and LNCaP cells were treated with free or micellar sorafenib (2.5 μM) and/or nilotinib (3 μM) for 48 hours, and the effect on cell cycle progression was measured by flow cytometry. In PC3 cells, sorafenib and nilotinib moderately increased the number of cells in the G0/G1 phase of the cell cycle by 3.7% and 4.1%, respectively (Figure 4A). A concomitant decrease in the S phase was observed while the proportion of cells in the G2/M phase was not altered (Figure 4A). A similar observation was made following treatment with SMA-Sor and SMA-Nilo, where the percentage of cells in the G0/G1 phase increased by 5.1% and 4.5%, respectively. However, the combination of the sorafenib and nilotinib triggered accumulation of the cells in G2/M phase from 25.6% up to 33%, with a concomitant decrease of the proportion of cells in the S (−3.4%) and G0/G1 phase (−4%) (Figure 4A). In contrast, treatment with the micellar combination did not promote G2/M accumulation of the cells. The micellar combination increased the number of cells in G0/G1 phase by 5% with a concomitant decrease of the cells in the S phase (Figure 4A). In the LNCaP cells, similar patterns were observed, where sorafenib, nilotinib, SMA-Sor, SMA-Nilo, and micellar combination increased the number of cells in the G0/G1 phase by 6.2%, 3.7%, 5.5%, 5.7%, and 6.9%, respectively (Figure 4B). A concomitant decrease in the number of cells in both the S and G2/M phases was observed. The combination of sorafenib and nilotinib increased the number of LNCaP cells in the S (+3.7%) and G2/M (+4.2%) phases (Figure 4B).
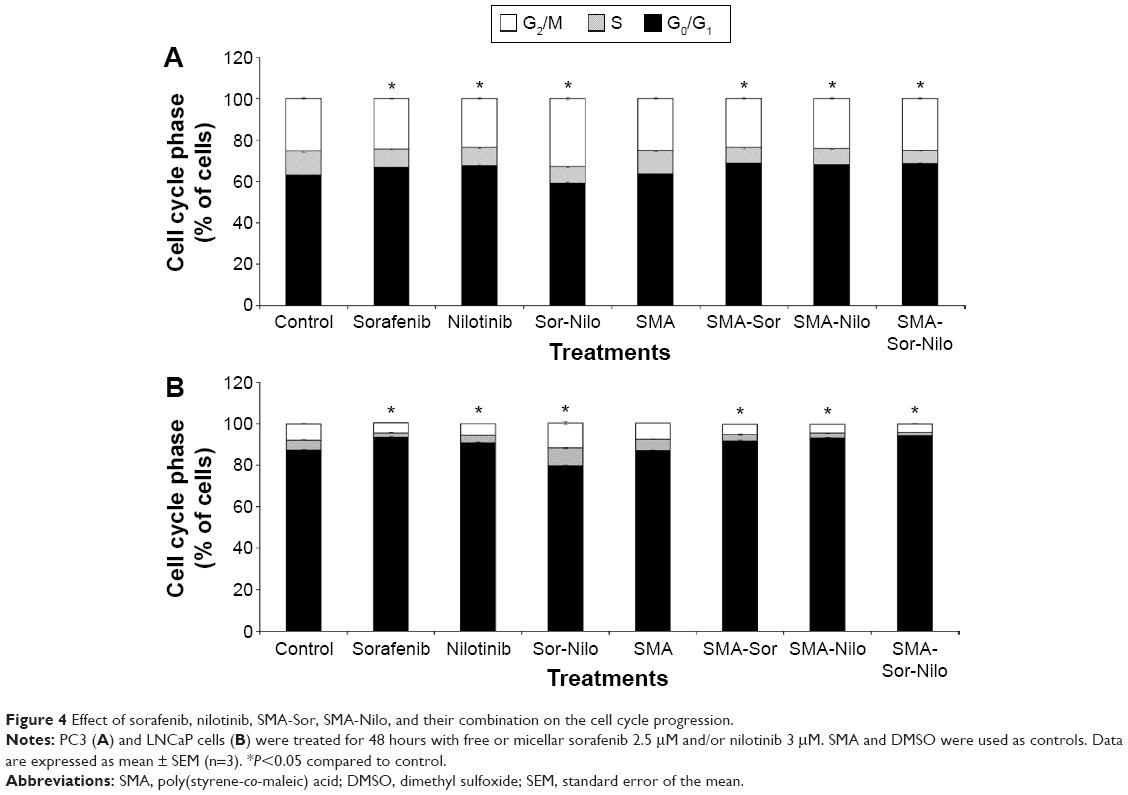 | Figure 4 Effect of sorafenib, nilotinib, SMA-Sor, SMA-Nilo, and their combination on the cell cycle progression. |
A combination of free and micellar sorafenib and nilotinib enhanced apoptosis
The effect of sorafenib, nilotinib, and their micellar formulations on apoptosis was determined after 48 hours incubation using annexin V and propidium iodide and analyzed by flow cytometry. As shown in Figure 5A, when compared to control, sorafenib and nilotinib increased apoptosis by 2.9- and 2.3-fold, respectively, while their combination increased the proportion of apoptotic cells by 5.3-fold in PC3 cells (Figure 5A). SMA-Sor, SMA-Nilo, and their combination followed the same pattern observed with the free drugs. Apoptosis increased by 3.6-, 3.5-, and 6.9-fold for SMA-Sor, SMA-Nilo, and micellar combination, respectively. In LNCaP cells, drugs had a more profound cytotoxic effect. Sorafenib, nilotinib, and their combination increased apoptotic cells by 5.7-, 3.5-, and 8.6-fold when compared to control, respectively (Figure 5B). Furthermore, the micellar formulation of each drug slightly increased the number of apoptotic cells when compared to the free drugs. SMA-Sor, SMA-Nilo, and micellar combination increased the number of apoptotic cells by 8.8-, 6.1-, and 12.2-fold when compared to SMA (Figure 5B). Overall, the combination of both micellar drugs improved the cytotoxicity against CRPC cell lines, potentially the result of the inhibition of multiple signaling pathways.
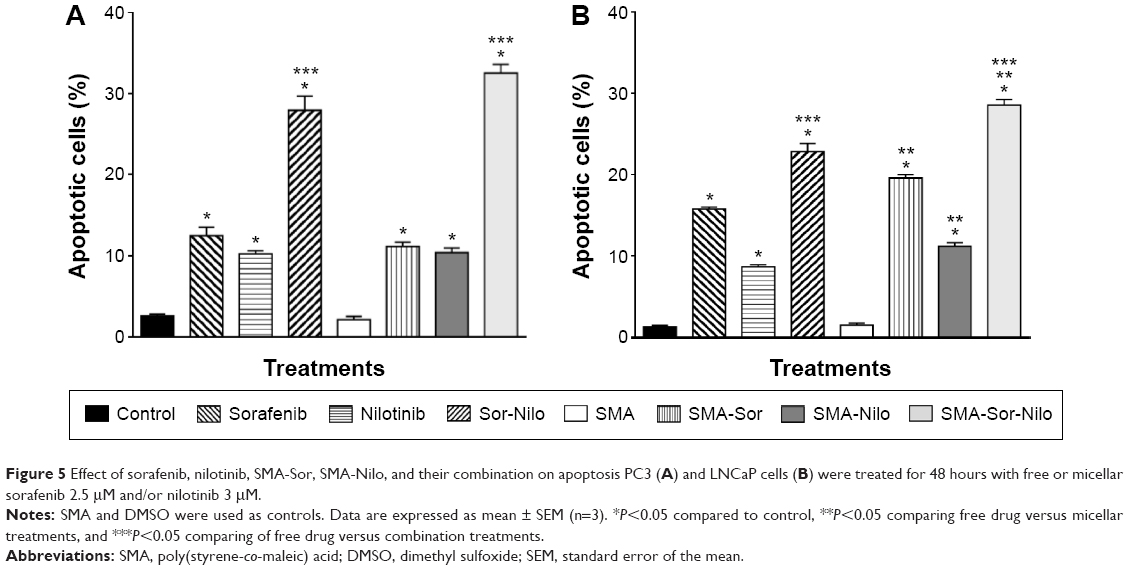 | Figure 5 Effect of sorafenib, nilotinib, SMA-Sor, SMA-Nilo, and their combination on apoptosis PC3 (A) and LNCaP cells (B) were treated for 48 hours with free or micellar sorafenib 2.5 μM and/or nilotinib 3 μM. |
Combination reduces the expression of proteins essential for cancer cell proliferation and survival
We evaluated the effect of the combination treatment of either free or micellar drugs on the expression of protein targets of sorafenib and nilotinib and also signaling proteins critical to cell proliferation and apoptosis. Following free or micellar combination treatment, the expression of VEGFR2 was not affected in PC3 cells (Figure 6A). In LNCaP cells, the expression of VEGFR2 was reduced 46% and 81% following free and micellar combination treatment, respectively (Figures 6B and S1 [quantification]). Both sorafenib and nilotinib are inhibitors of PDGFR; in PC3 cells, the combination treatment decreased its expression by 65% and 80% following free and micellar combination treatment, respectively (Figures 6A and S1). In LNCaP cells, PDGFR expression decreased by 96% and 82% following free and micellar combination treatment, respectively (Figure 6B). EGFR is a tyrosine kinase receptor with elevated expression in CRPC that contributes to tumor cell proliferation. The free and micellar combination treatment decreased EGFR expression by 15% and 29% in PC3 cells following free and micellar combination treatment, respectively, in PC3 cells and abolished EGFR expression in LNCaP cells (Figures 6A, B, and S1). FAK is a ubiquitous non-RTK, which has also been implicated the progression of prostate cancer.39 In PC3 cells, the free and micellar combination decreased FAK expression by 76% and 80%, respectively (Figures 6A and S1). In LNCaP cells, free and micellar combination reduced FAK expression by 85% and 78%, respectively (Figures 6B and S1).
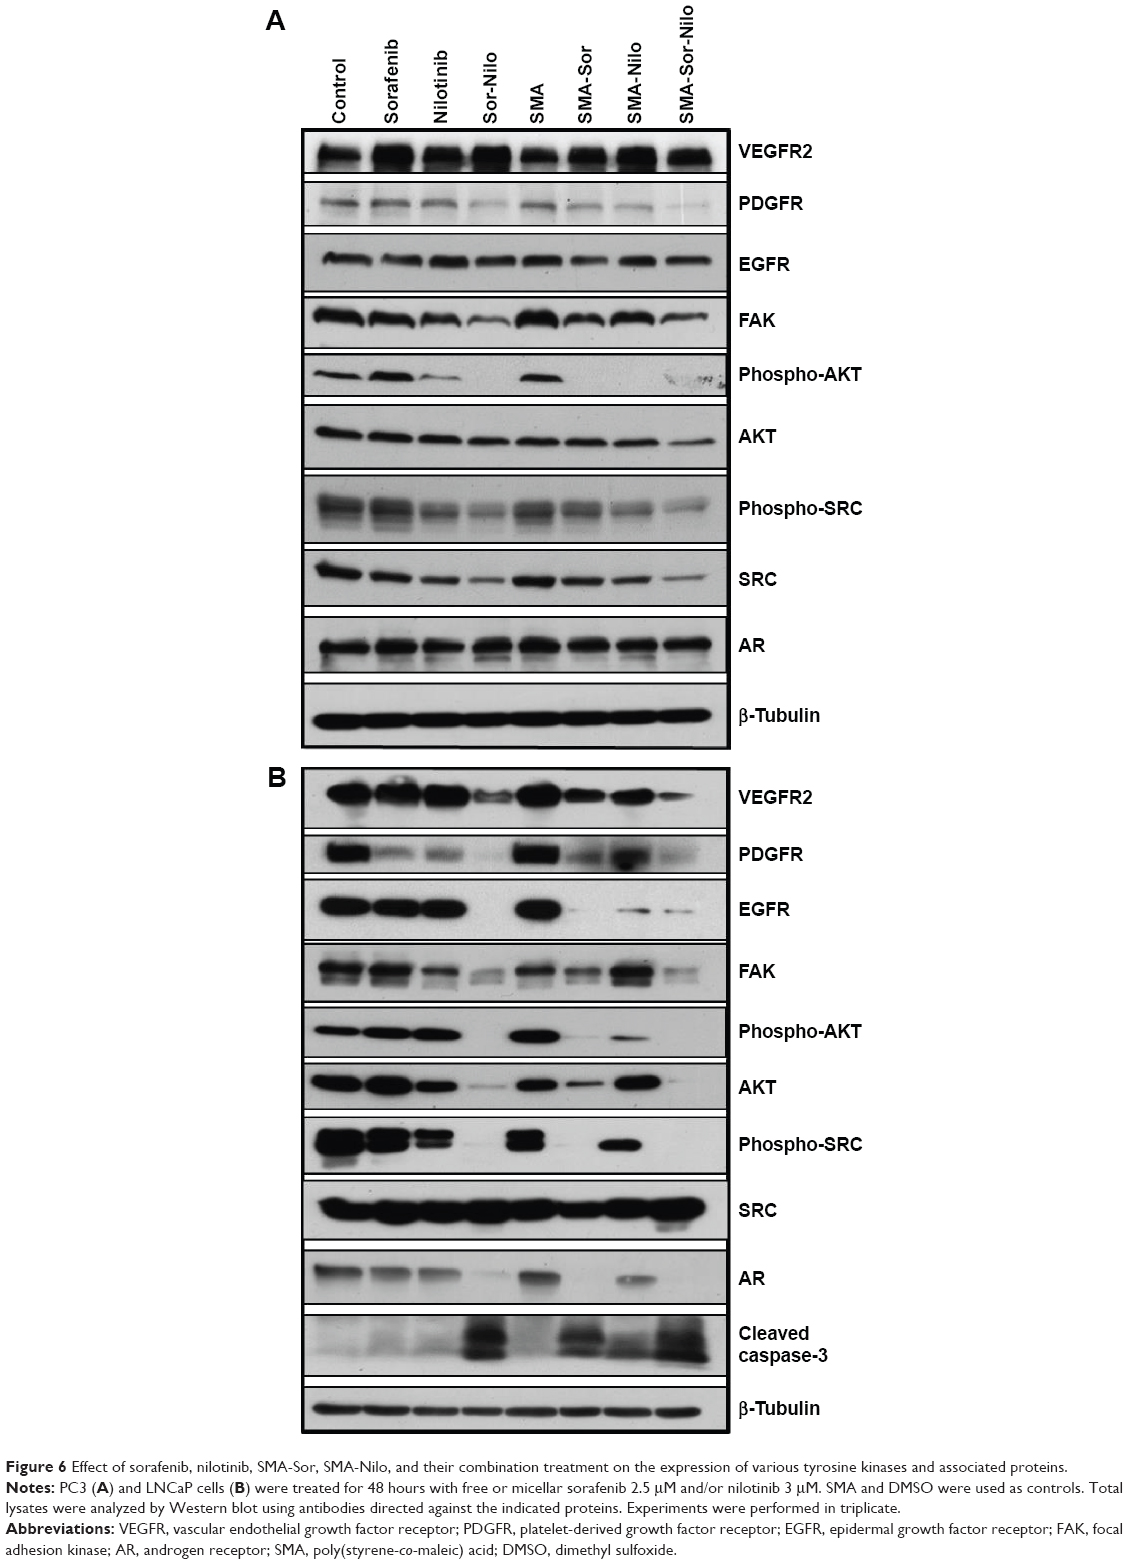 | Figure 6 Effect of sorafenib, nilotinib, SMA-Sor, SMA-Nilo, and their combination treatment on the expression of various tyrosine kinases and associated proteins. |
In addition, we assessed the effect of the combination on downstream signaling proteins such as AKT and SRC. In PC3 cells, the combination treatment abolished AKT phosphorylation, but overall AKT expression was only moderately affected (−10%). Phosphorylation was also completely abolished with the micellar combination while AKT expression decreased by 40% (Figures 6A and S1). In LNCaP cells, the combination of free and micellar drugs suppressed phosphorylation of AKT. However, total AKT expression was reduced by 88% following combination treatment while the micellar combination treatment abolished it (Figures 6B and S1). The expression of total SRC was reduced by 57% and 69% following free and micellar combination treatment, respectively, in PC3 cells but not in LNCaP cells (Figure 6A and B). The phosphorylation of SRC was decreased in PC3 cells and abolished in LNCaP cells following either free or micellar combination treatment (Figures 6A, B, and S1). We also considered the effect of the treatments on AR expression in LNCaP cells. LNCaP cells overexpressed a mutated AR and were responsive to the low level of androgens and other steroids. The combination of sorafenib and nilotinib free or micellar abolished the expression of the AR in LNCaP cells (Figures 6B and S1) but has no effect on AR expression in PC3 cells (Figures 6A and S1). Finally, we assessed the effect of the treatments on the activation of caspase-3, a classic apoptotic marker. In PC3 cells, an increase in apoptosis was not associated with a detectable level of active caspase-3. However, free and micellar combination treatment of LNCaP cells increased active caspase-3 by tenfold (Figures 6B and S1).
Sorafenib and nilotinib and combination differentially affect nuclear localization of the AR
The AR is a DNA-binding transcription factor crucial for the expression of multiple genes in LNCaP cells. We evaluated the ability of sorafenib and nilotinib treatments to interfere with the nuclear localization of the AR in LNCaP cells. In vehicle or SMA-treated cells, the AR is distributed throughout the cytoplasm and nucleus. Upon treatment with sorafenib, AR is altered and essentially localized in the cytoplasm (Figure 7). A similar effect was observed following SMA-Sor treatment, where SMA-Sor promoted the colocalization of the AR with the plasma membrane (Figure 7). Free nilotinib, however, failed to alter the nuclear localization of the AR but decreased its overall expression (Figure 7). SMA-Nilo reduced the nuclear localization of the AR but increased its colocalization with the plasma membrane. The combination treatment, both free and micellar, abolished the nuclear accumulation of the AR and promoted its colocalization with the plasma membrane.
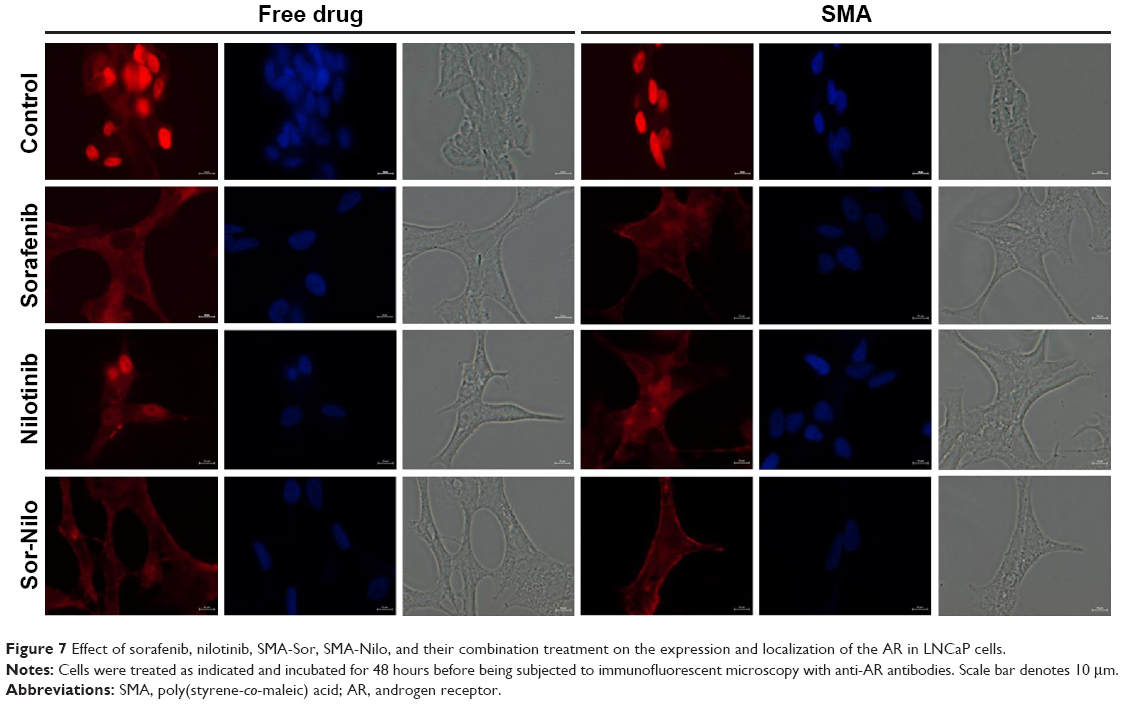 | Figure 7 Effect of sorafenib, nilotinib, SMA-Sor, SMA-Nilo, and their combination treatment on the expression and localization of the AR in LNCaP cells. |
Sorafenib and nilotinib combination reduces tumor spheroid viability
We used PC3 and LNCaP tumor spheroid models to further assess the effect of free and micellar sorafenib, nilotinib, and their combination treatments on the cellular viability. The three-dimensional culture model mimics some aspects of the in vivo tumor organization, better recapitulating the response of the cells to the drug. As shown in Figure 8A and C, cell viability of the PC3 spheroids, as measured by acid phosphatase activity, was reduced by 34%, 18%, and 54% following free sorafenib, nilotinib, and combination treatment, respectively (Figure 8B). The encapsulation of the drugs improved their cytotoxicity and decreased cell viability by 47%, 29%, and 66% following treatment with SMA-Sor, SMA-Nilo, and the combination, respectively (Figure 8B). In addition, the micellar combination alters cell–cell interaction changing the organization of the tumor spheroid (Figure 8A). The LNCaP tumor spheroids (Figure 8C) followed a similar pattern. Sorafenib and combination treatment decreased acid phosphatase activity by 47% and 69%, respectively (Figure 8D). However, nilotinib treatment did not affect tumor spheroid integrity. The micellar formulations were more potent when compared to the free drug treatments and decreased acid phosphatase activity by 69.5%, 19%, and 79% following SMA-Sor, SMA-Nilo, and the combination treatment, respectively (Figure 8D).
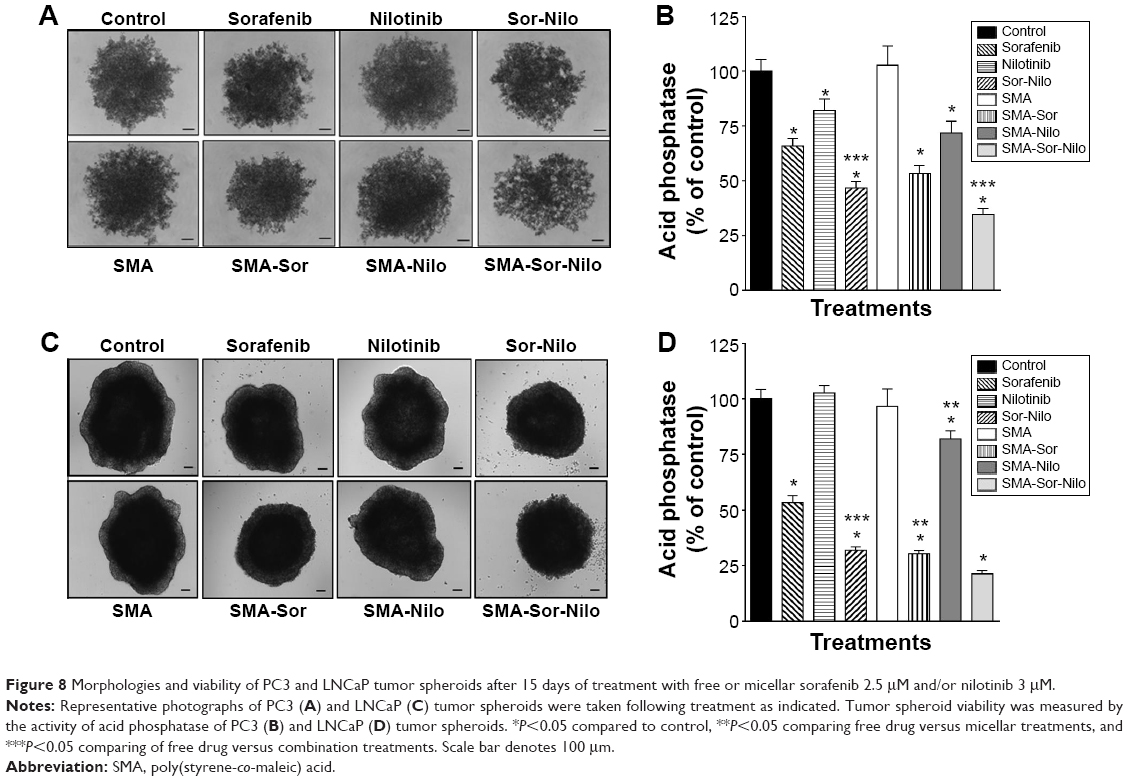 | Figure 8 Morphologies and viability of PC3 and LNCaP tumor spheroids after 15 days of treatment with free or micellar sorafenib 2.5 μM and/or nilotinib 3 μM. |
Combination decreases metastatic potential of PC3 cells
As shown in Figure 6, the combination treatment lowered the expression and/activity of proteins essential for cell migration and invasion such as EGFR, FAK, SRC, and AKT. We, therefore, evaluated the effect of the single treatments and their combination, on the metastatic potential of CRPC cells. First, we used a wound-healing assay to determine the effect on cell migration. PC3 cells were grown on a culture dish until reaching confluency, then a scratch through the cell monolayer was made using a pipette tip. Wound healing was assessed 20 hours after treatment with sorafenib, nilotinib, or combination treatment. As shown in Figure 9A, nilotinib treatment moderately reduced the wound closure, while sorafenib and combination treatment are more potent. The micellar TKI formulations abolished the migration of PC3 cells both alone and in combination (Figure 9A). In addition, we used a Boyden chamber coated with or without geltrex coating to assess cellular invasion. Treatment with sorafenib (2.5 μM), nilotinib (3 μM), and combination reduced the invasion by 48%, 41%, and 68%, respectively (Figure 9B). The micellar sorafenib (2.5 μM), nilotinib (3 μM), and combination slightly potentiated the anti-invasive effect, by reducing it by 53%, 50%, and 72%, respectively (Figure 9B). These results demonstrated that the combination of sorafenib and nilotinib reduced migration and invasion, and this effect was further potentiated by their encapsulation into a micelle. Matrix metalloproteinases (MMPs) are essential for migration and invasion; we used zymography and Western blot to detect the MMP-9 activity and secretion in cell culture media. Sorafenib decreased MMP-9 activity and secretion by 50%, while nilotinib has no effect (Figure 9C). However, the combination decreased MMP-9 activity by 69%. SMA-Sor, SMA-Nilo, and the micellar combination treatments potentiated the decrease of MMP-9 secretion and activity by 62%, 33%, and 86%, respectively (Figures 9C and S2). The antiangiogenic effect of sorafenib has been demonstrated previously; here, we report that sorafenib and combination treatment triggered the secretion of ISM-1 (Figures 9C and S2), a secreted antiangiogenic protein promoting apoptosis in endothelial cells.40 The secretion of ISM-1, however, was not observed when the cells were exposed to the micellar formulations.
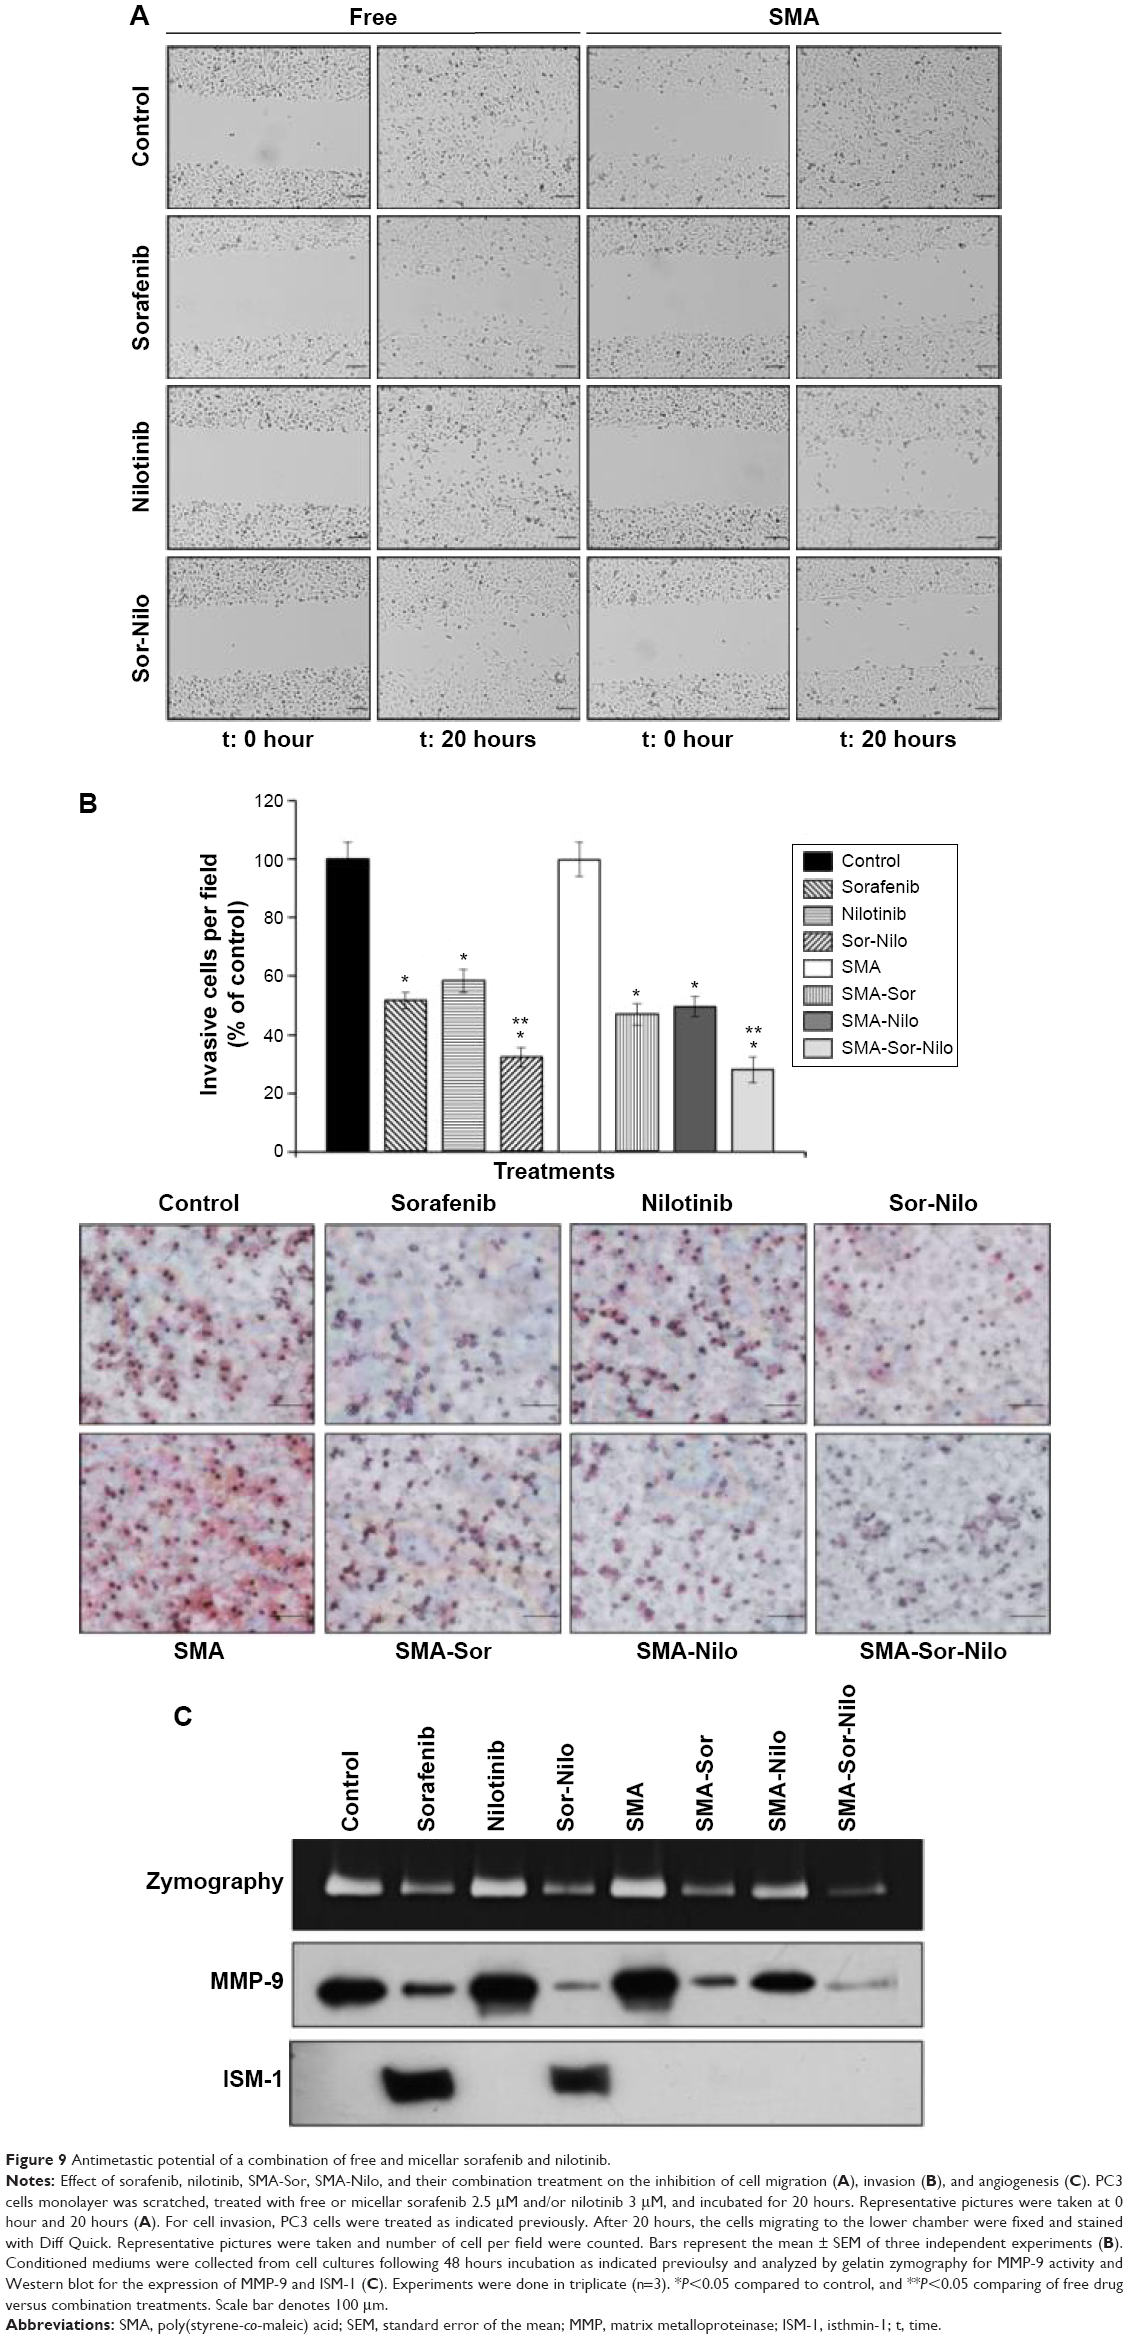 | Figure 9 Antimetastic potential of a combination of free and micellar sorafenib and nilotinib. |
Discussion
Despite the emergence of new therapies, CRPC remains an important health challenge. The new treatments included chemotherapeutic agents such as docetaxel and cabazitaxel, dendritic-cell-based vaccine such as sipuleucel-T, bone-targeted radiopharmaceutical such as radium-223, and compounds interfering with the androgen stimulation of tumor growth such as AR antagonist (enzalutamide) or androgen synthesis inhibitor (abiraterone). The continuation of the androgen deprivation is recommended indefinitely for mCRPC.41 The amplification of AR was observed in 30% of CRPC patients in recurrent tumors but not in the tissue taken from the same patient prior to the ADT.42 Treatments such as abiraterone acetate/prednisone, enzalutamide, radium-223, and docetaxel/prednisone have improved patient survival and patient quality of life with moderate toxicity for docetaxel/prednisone.41 While for asymptomatic or minimally symptomatic men, sipuleucel-T improved patient survival.41 These new therapies have ameliorated the overall survival of patients from 6–10 months to up to 24 months for certain therapies.43,44 Despite these clinical improvements, it is clear that additional therapeutic advances are needed. Recent studies have demonstrated that the progression of CRPC and the development of resistance to current treatments were associated with an increased activity of tyrosine kinase signaling.45 However, contrary to other cancer types, somatic mutations or amplification of tyrosine kinase genes have rarely been identified in CRPC patients.45 The lack of mutation also suggests that tumors are not addicted to a dominant signaling pathway, and likely to promote intertumoral and intratumoral heterogeneity in their response to a specific inhibitor. In recent years, the progress in the understanding of the essential role played by RTKs in prostate cancer development has led to the assessment of various TKIs in clinical trials (for review, see Ojemuyiwa et al46). However, TKIs used as single treatments had disappointing outcomes. Therefore, more promising strategies have used them in combination with other TKIs or chemotherapeutic agents.46
We have shown a combination of the two TKIs, sorafenib and nilotinib, elicited the greatest cytotoxicity toward PC3 cells. However, both TKIs are highly hydrophobic, which considerably impair their bioavailability in vivo.47,48 The nanoparticles developed in this study had a similar size of approximately 100 nm and a near neutral charge as well as achieved a loading of ~16% for SMA-Sor and SMA-Nilo. The size and charge of the micelles are important parameters to consider for a prolonged circulatory half-life and desirable biodistribution. The elimination of the nanoparticles from the circulation is principally mediated by the kidneys and the RES. Nanoparticles with an hydrodynamic size greater than 5.5 nm escape renal clearance,49 while a size of 100 nm or lower is less likely to be recognized and eliminated by the RES.50 Moreover, the near neutral charges of the micelles reduce its opsonization and recognition by the RES,51 contributing to an extended presence in the blood circulation. Therefore, the encapsulation of these drugs into SMA micelles improved their solubility and would also reduce metabolism, enhance bioavailability, decrease the toxicity to surrounding tissues, and promote accumulation in the tumor.
For an effective anticancer treatment, the stability of the micelles is an important criterion. The micelles, SMA-Sor and SMA-Nilo, were highly stable at physiological pH as measured by the low release rate of only 10% after 4 days. At a pH comparable to that observed in the proximity of a tumor, the release rate was slightly greater, while at a lower pH of 5.5 the micelles were less stable and freed a greater quantity of the encapsulated drug. The stability of these micelles will promote their passive accumulation at the tumor site through the EPR effect. All of the currently approved nanomedicines rely mostly on the EPR effect for their anticancer targeting.37 The aberrant architecture of the tumor blood vessels with large fenestrations and the deficient lymphatic drainage contribute to the EPR effect.52 The accumulation of the nanoparticles in the tumor interstitium will favor their internalization by the tumor cells. We have previously demonstrated that the cellular uptake of the SMA micelles was mediated by endocytosis via the formation of caveolin vesicles.53 Furthermore, the stability and loading of the micelles suggest that a high content of both drugs will be released into the cytoplasm and allow the drugs to act in combination.
We showed that sorafenib and nilotinib reduced cell viability and increased apoptosis moderately in PC3 cells and strongly in the androgen-sensitive LNCaP cells. The cytotoxic effect was potentiated by the combination of both drugs while the encapsulation of the drugs, in all treatment conditions, triggered a more profound cytotoxic effect. The cytotoxicity promoted by sorafenib or nilotinib treatment is dependent on their intracellular concentration. Sorafenib is transported into hepatocytes by organic cation transporter-1 and -3 and organic anion transporting polypeptides.54,55 These transporters are also expressed in CRPC tumors and cell lines including PC3 and LNCaP cells.56–59 However, no transporter has been identified for nilotinib, suggesting a passive transport across the cell membrane.25 The cellular efflux mechanisms of sorafenib and nilotinib have been reported in various studies and involved breast cancer resistance protein (BCRP), P-glycoprotein (P-gp), and multidrug resistance protein (MRP)-2 for sorafenib only.60–63 Interestingly, while there is no basal expression of P-gp reported in these cell lines, treatment with a chemotherapeutic agent may induce the expression of P-gp proteins.64 On the other hand, BRCP was shown to be expressed in both cell lines, while MRP-2 was only found in PC3 cells.65,66 One possible explanation for the increased cytotoxicity following the combination treatment, despite the redundancy of the proteins targeted, is that the small TKIs are also known inhibitors of these efflux pumps. Nilotinib has been identified as an inhibitor of the activity of the P-gp and the BCRP proteins, while sorafenib reduces the expression of P-gp proteins.67,68 The higher cytotoxicity observed following combination treatment might be the result of the inhibition of the efflux of the drugs.
The uptake of the drug-loaded micelles is mediated by endocytosis, where internalization is not rate limited. This, combined with the inhibition of the efflux mechanisms, may promote a higher intracellular accumulation of the drugs that is responsible for the inhibition of multiple signaling pathways.
Sorafenib and nilotinib are characterized by a broad specificity and inhibit the autophosphorylation of multiple tyrosine kinases.69,70 Sorafenib was initially developed to suppress the Raf/MEK1/2/ERK1/2 signaling pathway by inhibiting Raf-171 as well as B-Raf or its mutant (V600E).72 PC3 and LNCaP cells, however, are characterized by a low level of expression of the components of the Raf/MEK1/2/ERK1/2 protein cascade.73 In addition, the mutation of the PTEN protein identified in PC3 and LNCaP cells also contributes to the high basal activity of AKT, which can repress the Raf/MEK1/2/ERK1/2 signaling cascade.73 These findings suggest that the effect of sorafenib treatment in these cell lines is mediated by the inhibition of one or several RTKs. We assessed the effect of free and micellar combination on the expression of several RTKs and non-RTKs such as VEGFR-2, PDGFR, EGFR, and FAK and their downstream effector kinases, including SRC, AKT, and AR specifically in androgen-sensitive cell lines. These proteins are overexpressed or constitutively activated in CRPC and promote tumor cell proliferation, survival, and migration. In addition, the sensitivity to the single drug treatment differs if the cells are androgen sensitive such as LNCaP cells or androgen resistant such as the PC3 cells. Multiple mechanisms could explain the difference in sensitivity such as the number of transporters present on the surface of the cells, the abundance of the RTKs, and/or the expression of metabolism and efflux proteins. Overall, the encapsulation into SMA potentiated the effect of the single drugs, while the combination effect on the RTKs and non-RTKs expression followed a similar pattern in PC3 and LNCaP cells. The combination of free and micellar sorafenib and nilotinib also abolished AKT and SRC activity and decreased their expression. AKT and SRC are at the crossroads of several signaling pathways including the AR and promotes androgen-independent growth of CRPC.74 The mutation of PTEN found in LNCaP cells contributes to an elevated activity of AKT, which has been shown to synergize with the AR in androgen-sensitive cell lines and promote prostate cancer progression.75 In addition, the association between SRC and the AR has also been demonstrated and was dependent on EGFR activity.76 In LNCaP cells, the maintenance of AR activity under androgen deprivation is the result of the activation of multiple signaling pathways, including RTKs. In our study, sorafenib and nilotinib slightly reduced AR expression; however, sorafenib decreased AR nuclear localization. The combination of both drugs decreased AR expression and also abolished its nuclear localization. The treatment with micellar drugs abolishes AR nuclear localization. Interestingly, the profile of expression of AR was similar to EGFR in LNCaP cells. We were able to visualize AR expression in PC3 cells; however, the expression of the AR was not affected by any of the treatment conditions. PC3 cells are reported to be AR negative; however, several studies have demonstrated the expression of AR.77,78 However, AR expression appears independent of the activity of tyrosine kinase as the inhibition of SRC by the singles and combination treatments, a known regulator of AR activity in LNCaP cells,79 failed to affect its expression in PC3 cells. The role of AR in PC3 cells remains elusive. The reduction of the activity and expression of these proteins contributed to the activation of apoptosis and cleavage of caspase-3 in LNCaP cells. However, in all treatment conditions, the cytotoxicity and the increase in apoptosis observed in PC3 cells were not associated with a detectable level of the cleaved caspase-3. Sorafenib was shown to induce caspase-3 cleavage at a higher concentration in PC3 cells using immunocytochemistry.80 In human leukemia cells, sorafenib was shown to promote endoplasmic reticulum stress, a process partially independent of the activation of caspase-3.81 Furthermore, we used tumor spheroid models of PC3 and LNCaP cells to assess the cytotoxicity of the free and micellar combination treatments. Tumor spheroids are commonly used in vitro to validate the drugs’ cytotoxicity before assessing their efficacy in preclinical animal studies. Tumor spheroids mimic to some extent the complexity of the cellular interaction observed in vivo.82 The combination of sorafenib and nilotinib reduced the size of the PC3 and LNCaP spheroids, as well as their viabilities as measured by a reduced acid phosphatase activity. The encapsulation of the drugs further potentiated this effect in both cellular models, demonstrating the superiority of the micellar system to deliver a greater cytotoxic concentration. Moreover, we assessed the possible antimetastatic drug effect of a combination of sorafenib and nilotinib. Treatment with sorafenib was previously shown to inhibit the invasion of PC3 cells.83 We demonstrated that free or micellar nilotinib and sorafenib decreased the migration and invasion of PC3 cells. However, only the micellar nilotinib reduced MMP-9 secretion, as assessed by zymography and Western blot. Treatment with a combination of free or micellar drugs reduced cell invasion and drastically decreased MMP-9 secretion, suggesting the higher potential of combination treatment for the inhibition of metastasis. Sorafenib and nilotinib have also been characterized by their antiangiogenic properties: sorafenib through its inhibition of VEGFR-2 and PDGFR is a potent antiangiogenic agent,84 whereas nilotinib interferes with PDGFR signaling and has been shown to have antiangiogenic activity.85 Furthermore, we considered the effect of the different treatments on the secretion of ISM-1, a potent angiogenic inhibitor acting on endothelial cells through the receptors αvβ5 integrin and glucose-regulated protein 78 kDa (GRP78).40 Interestingly, sorafenib treatment and its combination with nilotinib triggered the release of ISM-1 from the PC3 cells. However, the encapsulation of the drugs into a micelle repressed the secretion of ISM-1. These results suggest that endocytosis suppresses the effect of the sorafenib on ISM-1 secretion.
Conclusion
In summary, we provided insights into the molecular response of a micellar combination of sorafenib and nilotinib in two cellular models of CRPC. Furthermore, we demonstrated a clear enhanced cytotoxic effect of the combination of multi-TKIs, therapy, which may provide a way to overcome therapeutic escape from single treatment.
Disclosure
The authors report no conflicts of interest in this work.
References
Torre LA, Bray F, Siegel RL, Ferlay J, Lortet-Tieulent J, Jemal A. Global cancer statistics, 2012. CA Cancer J Clin. 2015;65(2):87–108. | ||
Kelly K, Yin JJ. Prostate cancer and metastasis initiating stem cells. Cell Res. 2008;18(5):528–537. | ||
Bolla M, Van Tienhoven G, Warde P, et al. External irradiation with or without long-term androgen suppression for prostate cancer with high metastatic risk: 10-year results of an EORTC randomised study. Lancet Oncol. 2010;11(11):1066–1073. | ||
Brundage M, Sydes MR, Parulekar WR, et al. Impact of radiotherapy when added to androgen-deprivation therapy for locally advanced prostate cancer: long-term quality-of-life outcomes from the NCIC CTG PR3/MRC PR07 randomized trial. J Clin Oncol. 2015;33(19):2151–2157. | ||
Huggins C, Hodges CV. Studies on prostatic cancer. I. The effect of castration, of estrogen and of androgen injection on serum phosphatases in metastatic carcinoma of the prostate. Cancer Res. 1941;1(4):293–297. | ||
Penning TM. Androgen biosynthesis in castration-resistant prostate cancer. Endocr Relat Cancer. 2014;21(4):T67–T78. | ||
Greasley R, Khabazhaitajer M, Rosario DJ. A profile of enzalutamide for the treatment of advanced castration resistant prostate cancer. Cancer Manag Res. 2015;7:153–164. | ||
Pound CR, Partin AW, Eisenberger MA, Chan DW, Pearson JD, Walsh PC. Natural history of progression after PSA elevation following radical prostatectomy. JAMA. 1999;281(17):1591–1597. | ||
Brawley OW. Prostate cancer epidemiology in the United States. World J Urol. 2012;30(2):195–200. | ||
Fizazi K, Scher HI, Molina A, et al. Abiraterone acetate for treatment of metastatic castration-resistant prostate cancer: final overall survival analysis of the COU-AA-301 randomised, double-blind, placebo-controlled phase 3 study. Lancet Oncol. 2012;13(10):983–992. | ||
Scher HI, Fizazi K, Saad F, et al. Increased survival with enzalutamide in prostate cancer after chemotherapy. N Engl J Med. 2012;367(13):1187–1197. | ||
Saad F, Chi KN, Finelli A, et al. The 2015 CUA-CUOG Guidelines for the management of castration-resistant prostate cancer (CRPC). Can Urol Assoc J. 2015;9(3–4):90–96. | ||
Kantoff PW, Higano CS, Shore ND, et al. Sipuleucel-T immunotherapy for castration-resistant prostate cancer. N Engl J Med. 2010;363(5):411–422. | ||
Ceraline J, Cruchant MD, Erdmann E, et al. Constitutive activation of the androgen receptor by a point mutation in the hinge region: a new mechanism for androgen-independent growth in prostate cancer. Int J Cancer. 2004;108(1):152–157. | ||
Montgomery RB, Mostaghel EA, Vessella R, et al. Maintenance of intratumoral androgens in metastatic prostate cancer: a mechanism for castration-resistant tumor growth. Cancer Res. 2008;68(11):4447–4454. | ||
Tu WH, Zhu C, Clark C, Christensen JG, Sun Z. Efficacy of c-Met inhibitor for advanced prostate cancer. BMC Cancer. 2010;10:556. | ||
Nabhan C, Parsons B, Touloukian EZ, Stadler WM. Novel approaches and future directions in castration-resistant prostate cancer. Ann Oncol. 2011;22(9):1948–1957. | ||
Canil CM, Moore MJ, Winquist E, et al. Randomized phase II study of two doses of gefitinib in hormone-refractory prostate cancer: a trial of the National Cancer Institute of Canada-Clinical Trials Group. J Clin Oncol. 2005;23(3):455–460. | ||
Lee EC, Tenniswood M. Programmed cell death and survival pathways in prostate cancer cells. Arch Androl. 2004;50(1):27–32. | ||
Adnane L, Trail PA, Taylor I, Wilhelm SM. Sorafenib (BAY 43-9006, Nexavar), a dual-action inhibitor that targets RAF/MEK/ERK pathway in tumor cells and tyrosine kinases VEGFR/PDGFR in tumor vasculature. Methods Enzymol. 2006;407:597–612. | ||
Llovet JM, Villanueva A, Lachenmayer A, Finn RS. Advances in targeted therapies for hepatocellular carcinoma in the genomic era. Nat Rev Clin Oncol. 2015;12(7):408–424. | ||
Ivy SP, Wick JY, Kaufman BM. An overview of small-molecule inhibitors of VEGFR signaling. Nat Rev Clin Oncol. 2009;6(10):569–579. | ||
Carneiro RM, Carneiro BA, Agulnik M, Kopp PA, Giles FJ. Targeted therapies in advanced differentiated thyroid cancer. Cancer Treat Rev. 2015;41(8):690–698. | ||
Shore N, Mason M, de Reijke TM. New developments in castrate-resistant prostate cancer. BJU Int. 2012;109(Suppl 6):22–32. | ||
Blay J-Y, von Mehren M. Nilotinib: a novel, selective tyrosine kinase inhibitor. Semin Oncol. 2011;38(Suppl 1):S3–S9. | ||
Giles FJ, Rosti G, Beris P, et al. Nilotinib is superior to imatinib as first-line therapy of chronic myeloid leukemia: the ENESTnd study. Expert Rev Hematol. 2010;3(6):665–673. | ||
Schneider M, Korzeniewski N, Merkle K, et al. The tyrosine kinase inhibitor nilotinib has antineoplastic activity in prostate cancer cells but up-regulates the ERK survival signal – implications for targeted therapies. Urol Oncol. 2015;33(2):72.e1–72.e7. | ||
Cao H, Wang Y, He X, et al. Codelivery of sorafenib and curcumin by directed self-assembled nanoparticles enhances therapeutic effect on hepatocellular carcinoma. Mol Pharm. 2015;12(3):922–931. | ||
Hazarika M, Jiang X, Liu Q, et al. Tasigna for chronic and accelerated phase philadelphia chromosome – positive chronic myelogenous leukemia resistant to or intolerant of imatinib. Clin Cancer Res. 2008;14(17):5325–5331. | ||
Sasine JP, Schiller GJ. Emerging strategies for high-risk and relapsed/refractory acute myeloid leukemia: novel agents and approaches currently in clinical trials. Blood Rev. 2015;29(1):1–9. | ||
Maeda H, Nakamura H, Fang J. The EPR effect for macromolecular drug delivery to solid tumors: Improvement of tumor uptake, lowering of systemic toxicity, and distinct tumor imaging in vivo. Adv Drug Deliv Rev. 2013;65(1):71–79. | ||
Greish K, Sawa T, Fang J, Akaike T, Maeda H. SMA–doxorubicin, a new polymeric micellar drug for effective targeting to solid tumours. J Control Release. 2004;97(2):219–230. | ||
Vichai V, Kirtikara K. Sulforhodamine B colorimetric assay for cytotoxicity screening. Nat Protoc. 2006;1(3):1112–1116. | ||
Somers-Edgar TJ, Taurin S, Larsen L, Chandramouli A, Nelson MA, Rosengren RJ. Mechanisms for the activity of heterocyclic cyclohexanone curcumin derivatives in estrogen receptor negative human breast cancer cell lines. Invest New Drugs. 2011;29(1):87–97. | ||
Taurin S, Sandbo N, Qin Y, Browning D, Dulin NO. Phosphorylation of β-catenin by cyclic AMP-dependent protein kinase. J Biol Chem. 2006;281(15):9971–9976. | ||
Friedrich J, Seidel C, Ebner R, Kunz-Schughart LA. Spheroid-based drug screen: considerations and practical approach. Nat Protoc. 2009;4(3):309–324. | ||
Taurin S, Nehoff H, Greish K. Anticancer nanomedicine and tumor vascular permeability; Where is the missing link? J Control Release. 2012;164(3):265–275. | ||
Banerjee S, Sen K, Pal TK, Guha SK. Poly(styrene-co-maleic acid)-based pH-sensitive liposomes mediate cytosolic delivery of drugs for enhanced cancer chemotherapy. Int J Pharm. 2012;436(1–2):786–797. | ||
Parsons JT, Slack-Davis J, Tilghman R, Roberts WG. Focal adhesion kinase: targeting adhesion signaling pathways for therapeutic intervention. Clin Cancer Res. 2008;14(3):627–632. | ||
Xiang W, Ke Z, Zhang Y, et al. Isthmin is a novel secreted angiogenesis inhibitor that inhibits tumour growth in mice. J Cell Mol Med. 2011;15(2):359–374. | ||
Basch E, Loblaw DA, Oliver TK, et al. Systemic therapy in men with metastatic castration-resistant prostate cancer: American Society of Clinical Oncology and Cancer Care Ontario Clinical Practice Guideline. J Clin Oncol. 2014;32(30):3436–3448. | ||
Visakorpi T, Hyytinen E, Koivisto P, et al. In vivo amplification of the androgen receptor gene and progression of human prostate cancer. Nat Genet. 1995;9(4):401–406. | ||
El-Amm J, Aragon-Ching JB. The changing landscape in the treatment of metastatic castration-resistant prostate cancer. Ther Adv Med Oncol. 2013;5(1):25–40. | ||
Heidegger I, Massoner P, Eder IE, et al. Novel therapeutic approaches for the treatment of castration-resistant prostate cancer. J Steroid Biochem Mol Biol. 2013;138:248–256. | ||
Drake JM, Graham NA, Stoyanova T, et al. Oncogene-specific activation of tyrosine kinase networks during prostate cancer progression. Proc Natl Acad Sci U S A. 2012;109(5):1643–1648. | ||
Ojemuyiwa MA, Madan RA, Dahut WL. Tyrosine kinase inhibitors in the treatment of prostate cancer: taking the next step in clinical development. Expert Opin Emerg Drugs. 2014;19(4):459–470. | ||
Wang XQ, Fan JM, Liu YO, Zhao B, Jia ZR, Zhang Q. Bioavailability and pharmacokinetics of sorafenib suspension, nanoparticles and nanomatrix for oral administration to rat. Int J Pharm. 2011;419(1–2):339–346. | ||
Di Gion P, Kanefendt F, Lindauer A, et al. Clinical pharmacokinetics of tyrosine kinase inhibitors: focus on pyrimidines, pyridines and pyrroles. Clin Pharmacokinet. 2011;50(9):551–603. | ||
Choi HS, Liu W, Liu F, et al. Design considerations for tumour-targeted nanoparticles. Nat Nanotechnol. 2010;5(1):42–47. | ||
Davis ME, Chen Z, Shin DM. Nanoparticle therapeutics: an emerging treatment modality for cancer. Nat Rev Drug Discov. 2008;7(9):771–782. | ||
Roser M, Fischer D, Kissel T. Surface-modified biodegradable albumin nano- and microspheres. II: effect of surface charges on in vitro phagocytosis and biodistribution in rats. Eur J Pharm Biopharm. 1998;46(3):255–263. | ||
Noguchi Y, Wu J, Duncan R, et al. Early phase tumor accumulation of macromolecules: a great difference in clearance rate between tumor and normal tissues. Jpn J Cancer Res. 1998;89(3):307–314. | ||
Taurin S, Nehoff H, van Aswegen T, Rosengren RJ, Greish K. A novel role for raloxifene nanomicelles in management of castrate resistant prostate cancer. Biomed Res Int. 2014;2014:323594. | ||
Swift B, Nebot N, Lee JK, et al. Sorafenib hepatobiliary disposition: mechanisms of hepatic uptake and disposition of generated metabolites. Drug Metab Dispos. 2013;41(6):1179–1186. | ||
Namisaki T, Schaeffeler E, Fukui H, et al. Differential expression of drug uptake and efflux transporters in Japanese patients with hepatocellular carcinoma. Drug Metab Dispos. 2014;42(12):2033–2040. | ||
Gong S, Lu X, Xu Y, Swiderski CF, Jordan CT, Moscow JA. Identification of OCT6 as a novel organic cation transporter preferentially expressed in hematopoietic cells and leukemias. Exp Hematol. 2002;30(10):1162–1169. | ||
Arakawa H, Nakanishi T, Yanagihara C, et al. Enhanced expression of organic anion transporting polypeptides (OATPs) in androgen receptor-positive prostate cancer cells: possible role of OATP1A2 in adaptive cell growth under androgen-depleted conditions. Biochem Pharmacol. 2012;84(8):1070–1077. | ||
Joerger M, van Schaik RH, Becker ML, et al. Multidrug and toxin extrusion 1 and human organic cation transporter 1 polymorphisms in patients with castration-resistant prostate cancer receiving metformin (SAKK 08/09). Prostate Cancer Prostatic Dis. 2015;18(2):167–172. | ||
Chen L, Hong C, Chen EC, et al. Genetic and epigenetic regulation of the organic cation transporter 3, SLC22A3. Pharmacogenomics J. 2013;13(2):110–120. | ||
Huang WC, Hsieh YL, Hung CM, et al. BCRP/ABCG2 inhibition sensitizes hepatocellular carcinoma cells to sorafenib. PLoS One. 2013;8(12):e83627. | ||
Tang SC, de Vries N, Sparidans RW, Wagenaar E, Beijnen JH, Schinkel AH. Impact of P-glycoprotein (ABCB1) and breast cancer resistance protein (ABCG2) gene dosage on plasma pharmacokinetics and brain accumulation of dasatinib, sorafenib, and sunitinib. J Pharmacol Exp Ther. 2013;346(3):486–494. | ||
Shibayama Y, Nakano K, Maeda H, et al. Multidrug resistance protein 2 implicates anticancer drug-resistance to sorafenib. Biol Pharm Bull. 2011;34(3):433–435. | ||
Shukla S, Kouanda A, Silverton L, Talele TT, Ambudkar SV. Pharmacophore modeling of nilotinib as an inhibitor of ATP-binding cassette drug transporters and BCR-ABL kinase using a three-dimensional quantitative structure-activity relationship approach. Mol Pharm. 2014;11(7):2313–2322. | ||
Sanchez C, Mendoza P, Contreras HR, et al. Expression of multidrug resistance proteins in prostate cancer is related with cell sensitivity to chemotherapeutic drugs. Prostate. 2009;69(13):1448–1459. | ||
Xie Y, Xu K, Linn DE, et al. The 44-kDa Pim-1 kinase phosphorylates BCRP/ABCG2 and thereby promotes its multimerization and drug-resistant activity in human prostate cancer cells. J Biol Chem. 2008;283(6):3349–3356. | ||
Cai C, Omwancha J, Hsieh CL, Shemshedini L. Androgen induces expression of the multidrug resistance protein gene MRP4 in prostate cancer cells. Prostate Cancer Prostatic Dis. 2007;10(1):39–45. | ||
Couture L, Nash JA, Turgeon J. The ATP-binding cassette transporters and their implication in drug disposition: a special look at the heart. Pharmacol Rev. 2006;58(2):244–258. | ||
He M, Wei MJ. Reversing multidrug resistance by tyrosine kinase inhibitors. Chin J Cancer. 2012;31(3):126–133. | ||
Fletcher JA, Rubin BP. KIT mutations in GIST. Curr Opin Genet Dev. 2007;17(1):3–7. | ||
Wilhelm SM, Adnane L, Newell P, Villanueva A, Llovet JM, Lynch M. Preclinical overview of sorafenib, a multikinase inhibitor that targets both Raf and VEGF and PDGF receptor tyrosine kinase signaling. Mol Cancer Ther. 2008;7(10):3129–3140. | ||
Lyons JF, Wilhelm S, Hibner B, Bollag G. Discovery of a novel Raf kinase inhibitor. Endocr Relat Cancer. 2001;8(3):219–225. | ||
Wilhelm SM, Carter C, Tang L, et al. BAY 43-9006 exhibits broad spectrum oral antitumor activity and targets the RAF/MEK/ERK pathway and receptor tyrosine kinases involved in tumor progression and angiogenesis. Cancer Res. 2004;64(19):7099–7109. | ||
McCubrey JA, Steelman LS, Chappell WH, et al. Roles of the Raf/MEK/ERK pathway in cell growth, malignant transformation and drug resistance. Biochim Biophys Acta. 2007;1773(8):1263–1284. | ||
Perner S, Cronauer MV, Schrader AJ, Klocker H, Culig Z, Baniahmad A. Adaptive responses of androgen receptor signaling in castration-resistant prostate cancer. Oncotarget. 2015;6(34):35542–35555. | ||
Xin L, Teitell MA, Lawson DA, Kwon A, Mellinghoff IK, Witte ON. Progression of prostate cancer by synergy of AKT with genotropic and nongenotropic actions of the androgen receptor. Proc Natl Acad Sci U S A. 2006;103(20):7789–7794. | ||
Castoria G, Giovannelli P, Di Donato M, et al. Targeting androgen receptor/Src complex impairs the aggressive phenotype of human fibrosarcoma cells. PLoS One. 2013;8(10):e76899. | ||
Alimirah F, Chen J, Basrawala Z, Xin H, Choubey D. DU-145 and PC-3 human prostate cancer cell lines express androgen receptor: implications for the androgen receptor functions and regulation. FEBS Lett. 2006;580(9):2294–2300. | ||
Tong da Y, Wu X, Sun H, Jin Y, Liu Z, Zhou F. Expression changes and regulation of AR and IGF-1 in PC3 prostate cancer cells treated with sexual hormones and flutamide. Tumour Biol. 2012;33(6):2151–2158. | ||
Guo Z, Dai B, Jiang T, et al. Regulation of androgen receptor activity by tyrosine phosphorylation. Cancer Cell. 2006;10(4):309–319. | ||
Huang R, Chen XQ, Huang Y, Chen N, Zeng H. The multikinase inhibitor sorafenib induces caspase-dependent apoptosis in PC-3 prostate cancer cells. Asian J Androl. 2010;12(4):527–534. | ||
Rahmani M, Davis EM, Crabtree TR, et al. The kinase inhibitor sorafenib induces cell death through a process involving induction of endoplasmic reticulum stress. Mol Cell Biol. 2007;27(15):5499–5513. | ||
Hirschhaeuser F, Menne H, Dittfeld C, West J, Mueller-Klieser W, Kunz-Schughart LA. Multicellular tumor spheroids: an underestimated tool is catching up again. J Biotechnol. 2010;148(1):3–15. | ||
Yu P, Ye L, Wang H, et al. NSK-01105, a novel sorafenib derivative, inhibits human prostate tumor growth via suppression of VEGFR2/EGFR-mediated angiogenesis. PLoS One. 2014;9(12):e115041. | ||
Yamamoto Y, De Velasco MA, Kura Y, et al. Evaluation of in vivo responses of sorafenib therapy in a preclinical mouse model of PTEN-deficient of prostate cancer. J Transl Med. 2015;13:150. | ||
Heine A, Held SA, Bringmann A, Holderried TA, Brossart P. Immunomodulatory effects of anti-angiogenic drugs. Leukemia. 2011;25(6):899–905. | ||
Mahon KL, Henshall SM, Sutherland RL, Horvath LG. Pathways of chemotherapy resistance in castration-resistant prostate cancer. Endocr Relat Cancer. 2011;18(4):R103–R123. | ||
Robinson D, He F, Pretlow T, Kung HJ. A tyrosine kinase profile of prostate carcinoma. Proc Natl Acad Sci U S A. 1996;93(12):5958–5962. | ||
Brooks C, Sheu T, Bridges K, et al. Preclinical evaluation of sunitinib, a multi-tyrosine kinase inhibitor, as a radiosensitizer for human prostate cancer. Radiat Oncol. 2012;7:154. | ||
Jackson MW, Roberts JS, Heckford SE, et al. A potential autocrine role for vascular endothelial growth factor in prostate cancer. Cancer Res. 2002;62(3):854–859. | ||
Huber RM, Lucas JM, Gomez-Sarosi LA, et al. DNA damage induces GDNF secretion in the tumor microenvironment with paracrine effects promoting prostate cancer treatment resistance. Oncotarget. 2015;6(4):2134–2147. | ||
Heigener DF, Reck M. Crizotinib. Recent Results Cancer Res. 2014;201:197–205. | ||
Drake JM, Graham NA, Lee JK, et al. Metastatic castration-resistant prostate cancer reveals intrapatient similarity and interpatient heterogeneity of therapeutic kinase targets. Proc Natl Acad Sci U S A. 2013;110(49):E4762–E4769. | ||
Viticchiè G, Muller PA. c-Met and other cell surface molecules: interaction, activation and functional consequences. Biomedicines. 2015;3(1):46–70. | ||
Kim IY, Zelner DJ, Lee C. The conventional transforming growth factor-β (TGF-β) receptor type I is not required for TGF-β1 signaling in a human prostate cancer cell line, LNCaP. Exp Cell Res. 1998;241(1):151–160. | ||
Ergüven M, Muramatsu T, Bilir A. Midkine: From Embryogenesis to Pathogenesis and Therapy. Springer: the Netherlands; 2012. | ||
Patel D, Suthar MP, Patel V, Singh R. BCR ABL kinase inhibitors for cancer therapy. Int J Pharm Sci Drug Res. 2010;2:80–90. | ||
Simak R, Capodieci P, Cohen DW, et al. Expression of c-kit and kit-ligand in benign and malignant prostatic tissues. Histol Histopathol. 2000;15(2):365–374. | ||
Shimada K, Nakamura M, Ishida E, et al. Prostate cancer antigen-1 contributes to cell survival and invasion though discoidin receptor 1 in human prostate cancer. Cancer Sci. 2008;99(1):39–45. | ||
Ide H, Seligson DB, Memarzadeh S, et al. Expression of colony-stimulating factor 1 receptor during prostate development and prostate cancer progression. Proc Natl Acad Sci U S A. 2002;99(22):14404–14409. | ||
Wiesner C, Nabha SM, Dos Santos EB, et al. C-kit and its ligand stem cell factor: potential contribution to prostate cancer bone metastasis. Neoplasia. 2008;10(9):996–1003. | ||
Yan Z, Jin S, Wei Z, et al. Discoidin domain receptor 2 facilitates prostate cancer bone metastasis via regulating parathyroid hormone-related protein. Biochim Biophys Acta. 2014;1842(9):1350–1363. | ||
Kwabi-Addo B, Ozen M, Ittmann M. The role of fibroblast growth factors and their receptors in prostate cancer. Endocr Relat Cancer. 2004;11(4):709–724. | ||
Corn PG, Wang F, McKeehan WL, Navone N. Targeting fibroblast growth factor pathways in prostate cancer. Clin Cancer Res. 2013;19(21):5856–5866. | ||
Ozen M, Giri D, Ropiquet F, Mansukhani A, Ittmann M. Role of fibroblast growth factor receptor signaling in prostate cancer cell survival. J Natl Cancer Inst. 2001;93(23):1783–1790. | ||
McCormack PL. Pazopanib: a review of its use in the management of advanced renal cell carcinoma. Drugs. 2014;74(10):1111–1125. | ||
Kim S, Ding W, Zhang L, Tian W, Chen S. Clinical response to sunitinib as a multitargeted tyrosine-kinase inhibitor (TKI) in solid cancers: a review of clinical trials. Onco Targets Ther. 2014;7:719–728. | ||
Whang YE, Armstrong AJ, Rathmell WK, et al. A phase II study of lapatinib, a dual EGFR and HER-2 tyrosine kinase inhibitor, in patients with castration-resistant prostate cancer. Urol Oncol. 2013;31(1):82–86. | ||
Sridhar SS, Hotte SJ, Chin JL, et al. A multicenter phase II clinical trial of lapatinib (GW572016) in hormonally untreated advanced prostate cancer. Am J Clin Oncol. 2010;33(6):609–613. | ||
Pignon J-C, Koopmansch B, Nolens G, Delacroix L, Waltregny D, Winkler R. Androgen receptor controls EGFR and ERBB2 gene expression at different levels in prostate cancer cell lines. Cancer Res. 2009;69(7):2941–2949. | ||
El Sheikh SS, Domin J, Abel P, Stamp G, Lalani E-N. Phosphorylation of both EGFR and ErbB2 is a reliable predictor of prostate cancer cell proliferation in response to EGF. Neoplasia. 2004;6(6):846–853. | ||
Gu L, Talati P, Vogiatzi P, et al. Pharmacologic suppression of JAK1/2 by JAK1/2 inhibitor AZD1480 potently inhibits IL-6-induced experimental prostate cancer metastases formation. Mol Cancer Ther. 2014;13(5):1246–1258. | ||
Meyer SC, Levine RL. Molecular pathways: molecular basis for sensitivity and resistance to JAK kinase inhibitors. Clin Cancer Res. 2014;20(8):2051–2059. | ||
Weiss-Messer E, Merom O, Adi A, et al. Growth hormone (GH) receptors in prostate cancer: gene expression in human tissues and cell lines and characterization, GH signaling and androgen receptor regulation in LNCaP cells. Mol Cell Endocrinol. 2004;220(1–2):109–123. | ||
Jorvig JE, Chakraborty A. Zerumbone inhibits growth of hormone refractory prostate cancer cells by inhibiting JAK2/STAT3 pathway and increases paclitaxel sensitivity. Anticancer Drugs. 2015;26(2):160–166. | ||
O’Neil BH, Goff LW, Kauh JS, et al. Phase II study of the mitogen-activated protein kinase 1/2 inhibitor selumetinib in patients with advanced hepatocellular carcinoma. J Clin Oncol. 2011;29(17):2350–2356. |
Supplementary materials
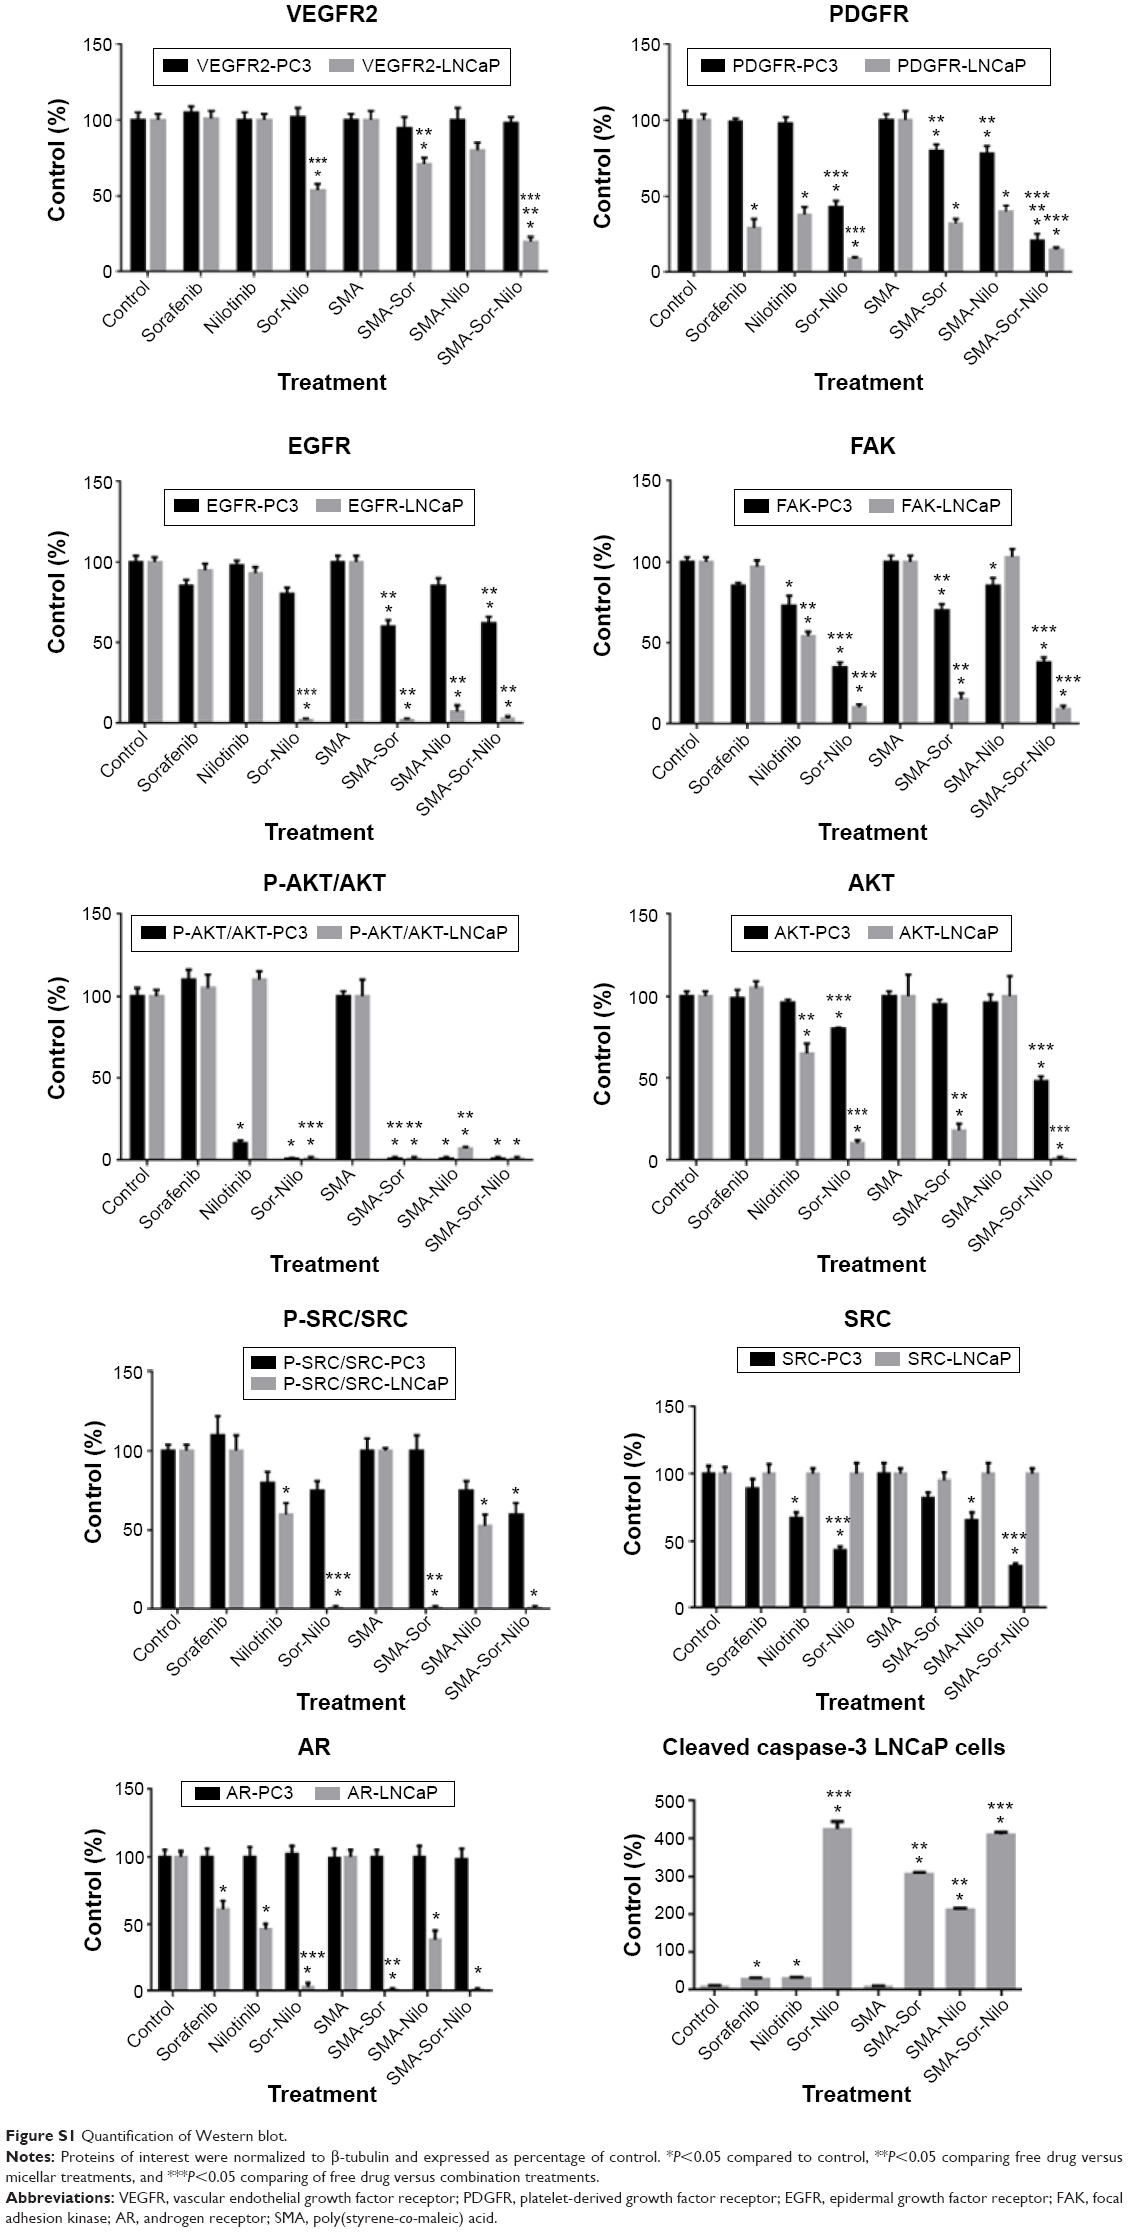 | Figure S1 Quantification of Western blot. |
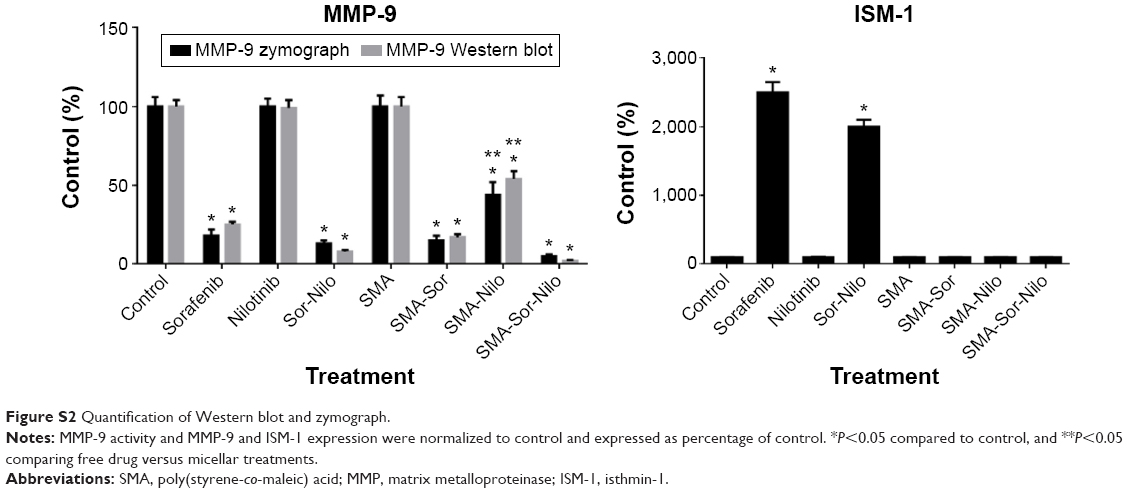 | Figure S2 Quantification of Western blot and zymograph. |
 © 2016 The Author(s). This work is published and licensed by Dove Medical Press Limited. The full terms of this license are available at https://www.dovepress.com/terms.php and incorporate the Creative Commons Attribution - Non Commercial (unported, v3.0) License.
By accessing the work you hereby accept the Terms. Non-commercial uses of the work are permitted without any further permission from Dove Medical Press Limited, provided the work is properly attributed. For permission for commercial use of this work, please see paragraphs 4.2 and 5 of our Terms.
© 2016 The Author(s). This work is published and licensed by Dove Medical Press Limited. The full terms of this license are available at https://www.dovepress.com/terms.php and incorporate the Creative Commons Attribution - Non Commercial (unported, v3.0) License.
By accessing the work you hereby accept the Terms. Non-commercial uses of the work are permitted without any further permission from Dove Medical Press Limited, provided the work is properly attributed. For permission for commercial use of this work, please see paragraphs 4.2 and 5 of our Terms.