")
Back to Journals » OncoTargets and Therapy » Volume 13
A 5-Gene Stemness Score for Rapid Determination of Risk in Multiple Myeloma
Received 15 February 2020
Accepted for publication 23 April 2020
Published 18 May 2020 Volume 2020:13 Pages 4339—4348
DOI https://doi.org/10.2147/OTT.S249895
Checked for plagiarism Yes
Review by Single anonymous peer review
Peer reviewer comments 3
Editor who approved publication: Dr Federico Perche
Hua Bai, Bing Chen
Department of Hematology, The Affiliated Drum Tower Hospital of Nanjing University Medical School, Nanjing 210008, People’s Republic of China
Correspondence: Hua Bai; Bing Chen Email [email protected]; [email protected]
Purpose: Risk stratification in patients with multiple myeloma (MM) remains a challenge. As clinicopathological characteristics have been demonstrated insufficient for exactly defining MM risk, and molecular biomarkers have become the focuses of interests. Prognostic predictions based on gene expression profiles (GEPs) have been the most accurate to this day. The purpose of our study was to construct a risk score based on stemness genes to evaluate the prognosis in MM.
Materials and Methods: Bioinformatics studies by ingenuity pathway analyses in side population (SP) and non-SP (MP) cells of MM patients were performed. Firstly, co-expression network was built to confirm hub genes associated with the top five Kyoto Encyclopedia of Genes and Genomes pathways. Functional analyses of hub genes were used to confirm the biologic functions. Next, these selective genes were utilized for construction of prognostic model, and this model was validated in independent testing sets. Finally, five stemness genes (ROCK1, GSK3B, BRAF, MAPK1 and MAPK14) were used to build a MM side population 5 (MMSP5) gene model, which was demonstrated to be forcefully prognostic compared to usual clinical prognostic parameters by multivariate cox analysis. MM patients in MMSP5 low-risk group were significantly related to better prognosis than those in high-risk group in independent testing sets.
Conclusion: Our study provided proof-of-concept that MMSP5 model can be adopted to evaluate recurrence risk and clinical outcome for MM. The MMSP5 model evaluated in different databases clearly indicated novel risk stratification for personalized anti-MM treatments.
Keywords: multiple myeloma, gene expression profiling, side population, risk score, prognosis
Introduction
Multiple myeloma (MM), originated from malignant plasma cells, represents the most second common hematological malignancies. These malignant plasma cells are characterized with recurrent gene gains, deletions or translocations.1–3 Gene expression signature made it possible to confirm gene expression of myeloma cells associated with overall and event-free survival (OS/EFS) of newly diagnosed MM patients. Zhan et al identified 8 genetic subgroups of MM.4 Subsequently, Shaughnessy et al established a 70-gene risk-scoring system able to divide 13% of MM cases into high-risk group.5 Later, Decaux et al developed IFM15 risk stratification, which classify 25% of MM cases as high-risk.6 These risk-scoring systems mostly include genes coding for proteins involved in cell communication, cell cycle and metabolism. Although the incorporation of prognostic evaluation and novel agents has significantly improved the response rate to chemotherapy and prognosis of patients,7,8 almost MM patients will ultimately suffer from relapse. In those relapsed MM patients, a group of clonal myeloma stem cell might be responsible for the accumulation of myeloma cell after complete remission (CR).9,10 Thus, it is an urgent demand to explore the prognostic markers able to identify MM patients with high recurrence in order to schedule personalized anti-MM treatment.11,12 Unfortunately, none of these studies focused on myeloma stem cell.
Our purpose is that identifying genes whose expression is over-expressed in myeloma stem cell and could predict risk stratification in newly diagnosed MM patients. Especially, it is of interest to confirm whether myeloma stem cell could aberrantly express genes shared by bone marrow microenvironment, which confer to myeloma metastasize.13 Although previous researches have identified myeloma stem cell phenotypes,14–16 the individual myeloma stem cell marker is still under dispute. Side population (SP) cells, explained by Goodell et al,17 are a group of enriched tumor-initiating cells with low Hoechst 33342 staining, and SP cells were characterized with stem cell-like features including clonogenicity, self-renewal, differentiation and repopulation.14–16,18,19 MM side population (MMSP) cells, which are considered a functional surrogate marker for cancer stem cells, generate more colonies when compared with mature MM cells and may lack CD138 expression.18,20 Defining gene expression of SP cells is as important as defining high-risk MM for setting up appropriate risk stratification.
On the above bases, we investigated a stemness gene signature able to distinguish the different stages of myeloma progression, and evaluated the prognostic associations of MMSP5 in SP cells by analyzing gene expression profiles (GEPs) datasets. As a result, MMSP5 was demonstrated to be an efficient model in different datasets and be helpful in the prediction of clinical outcome.
Materials and Methods
Data Source and Microarray Analysis
The GEP of GSE109651 was obtained from Gene Expression Omnibus (GEO) datasets. Zhan et al submitted GSE109651, which was based on Agilent GPL570 platform. GSE109651 dataset contained 14 samples, including 7 Side-population/light chain+ (SP/LC) samples and 7 CD138+ (MP) samples. Flow SP cells were enumerated and flow-sorted as described by our previous publications.21 Briefly, 1 × 10⁶ cells were suspended in 1 mL RPMI1640 media with 10% FBS and 5 μg/mL Hoechst 33342, and incubated in 37°C water bath for 90 minutes. Cells treated with 100 μmol/L verapamil were used as negative control. After incubation, cells were stained with CD138-FITC, κ-APC or λ-PE antibodies and resuspended in ice-cold RPMI1640 media with propidium iodide (2 μg/mL) for flow analysis or sorting. Cell death assays were performed using Annexin V Apoptosis Detection Kit APC. SP cells were analyzed on a LSR flow cytometer equipped with 424/44 nm band pass and 670 nm long pass optical filters.
GEO datasets were also carried out to evaluate MMSP5 in MM patient cohorts (GSE5900,22 GSE2658,4 GSE24080,23 GSE31161,24 GSE978225 and GSE5731726). Data acquisition and normalization methods in the above datasets have been described previously.23 The gene expression in plasma cells was determined using the Affymetrix U133Plus2.0 microarray, which was performed as previously described.4
Data Preprocessing and Differentially Expressed Genes (DEGs) Screening
RMA algorithm in affy package was utilized to preprocess the raw expression data in R package.27,28 Then, The limma package in R package was used to identify DEGs between SP and MP samples,29 with the fold change >2 and the statistical significance of P < 0.05. The Benjamin and Hochberg’s method was used to control the false discovery rate.
Gene Ontology (GO) and Pathway Enrichment Analysis of DEGs
To confirm the main functional pathways of SP cells, Database for Annotation, Visualization and Integrated Discovery (DAVID) was applied to perform the Kyoto Encyclopedia of Genes and Genomes (KEGG) enrichment analysis and GO analysis of DEGs.30 P < 0.05 was defined as the cut-off value for enriched pathways and functions.
Quantitative Real-Time PCR (qRT-PCR) Analysis
Total RNA from MM sorted cells was isolated and supplied to reverse transcription; qRT-PCR was done using a StepOnePlus RT-PCR System (Applied Biosystems, USA). GAPDH levels were used to normalize all genes expression levels. Primers were listed in Supplemental Materials. These clinical samples were collected from The Affiliated Drum Tower Hospital of Nanjing University Medical School, written informed consent was obtained from all of the patients. This study was approved by the Ethics Committee on Human Research of The Affiliated Drum Tower Hospital of Nanjing University Medical School.
Statistical Analysis
Various statistical analyses were utilized to evaluate the impact of 5 genes expression on clinical outcome of MM patients. Two-tailed Student’s t-test and one-way analysis of variance were used to compare two or multiple experimental groups. The Chi-square test was used to compare clinical features between high-risk (HR) and low-risk (LR) groups. Survival curves for OS/EFS were hatched according to Kaplan–Meier method, and the Log-rank test was used to analyze statistical differences between different curves. The effect of MMSP5 on outcome was analyzed using univariate and multivariate Cox proportional hazard models. GraphPad Prism 6 software was employed for our analyses and *P < 0.05 was considered significant.
Results
DEGs Between the SP and MP Groups
In total, 988 genes were identified to be DEGs, including 393 up-regulated genes and 595 down-regulated genes in SP samples. As shown in the heatmap and giant network (Figure 1A and B), DEGs were divided into 2 clusters according to the clustering analysis result. Meanwhile, SP and CD138+ (MP) specimens were also classified into 2 different groups. To explore the specific function pattern of DEGs, DAVID was employed for functional enrichment analysis. GO analysis revealed that up-regulated genes were enriched in several biological processes (BP), including inflammatory response, lipopolysaccharide-mediated signaling pathway and movement of cell or subcellular component; For molecular function (MF), those up-regulated genes were enriched protein binding, guanosine diphosphate (GDP) and protein phosphatase binding; Additionally, cell component (CC) analysis displayed that the up-regulated genes were mainly enriched in the cytosol, extracellular exosome and membrane raft (Figure 1C).
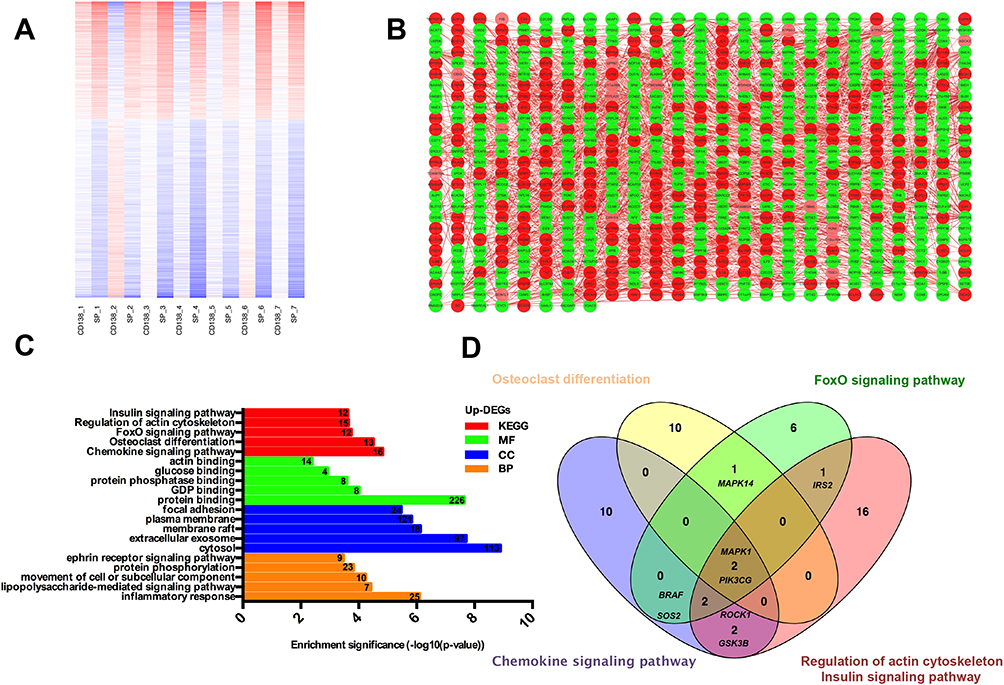 |
Figure 1 Functional enrichment analysis of hub genes. (A) Heat map and clustering analysis of DEGs. Red: high expression level; Blue: low expression level. (B) The giant network was extracted from the whole PPI network. Key nodes in the giant network are highlighted in different colors: red corresponds to the up-regulated gene and green corresponds to the down-regulated gene in SP cells. (C) Significant Enriched Go Terms of up-regulated DEGs in SP cells based on their functions. (D) Identification of 8 commonly changes DEGs from top five KEGG pathways in up-regulated DEGs, using Venn diagram, different color areas represented different KEGG pathway. The cross areas denote overlapping DEGs. Abbreviations: PPI, protein and protein interaction; DEGs, differentially expressed genes; SP, side population; KEGG, Kyoto Encyclopedia of Genes and Genomes. |
Moreover, the KEGG pathway enrichment analysis was also performed in up-regulated DEGs. Among them, the top five KEGG pathways in up-regulated DEGs were enriched in Chemokine signaling pathway, Osteoclast differentiation, FoxO pathway, Regulation of actin cytoskeleton and Insulin signaling pathway (Figure 1C).
Construction of a Stemness Prognostic Score
We used the Venn diagram to construct co-expression network in the top five KEGG pathways, and identified 8 hub genes as the stemness genes (Figure 1D). Firstly, in order to acquire the ideal feature genes for diagnosing MM, we examined gene expression in normal plasma (NP), monoclonal gammopathy of undetermined significance (MGUS), smoldering multiple myeloma (SMM) and MM cells using GEO database. Notably, 5 genes (ROCK1, GSK3B, BRAF, MAPK1 and MAPK14) expression increased significantly from NP to MM samples (Figure 2A–E). We also compared these 5 genes expression in LC/SP and CD138+ MM cells, and increased ROCK1, GSK3B, BRAF, MAPK1 and MAPK14 expression was confirmed in SP/LC MM cells by qRT-PCR (Figure 2F). Using the STRING online database, these 5 DEGs were filtered into the DEGs protein and protein interaction (PPI) network complex (Figure 2G).31 Then, each of the 8 chosen genes was divided into two categories according to gene expression (low and high, using the 50th percentile as cut-offs) and validated in Kaplan-Meier analysis and multivariate cox models for their relation to OS. Subsequently, only 5 genes resulted independently associated with survival (P < 0.05, Figure 2A–E, Supplemental materials) were further utilized to construct MMSP5 model (the mean ratios of 5 over-expressed genes). We assessed a score to each gene (low expression = 0 and high expression = 1) and then constructed a prognostic risk score (RS) as follows: ROCK1+GSK3B+BRAF+MAPK1+MAPK14. The RS could present 6 different values, and patients were divided into two groups: low-risk (LR) = RS 0–2 and high-risk (HR) = RS 3–5 according to 50th percentile of the RS (Figure 3A). Then, we calculated the RS of each patient in the UAMS cohort. MM patients were divided into HR group (n = 175) and LR group (n = 176) according to their risk fraction (Figure 3A). As a result, MMSP5 model was significantly associated with survival, and patients in HR group having more dead cases and mean survival in UAMS cohort (mean survival: 36.81 ± 1.084 vs 33.80 ± 1.202, P = 0.0643, Figure 3A; P = 0.0180, Figure 3B).
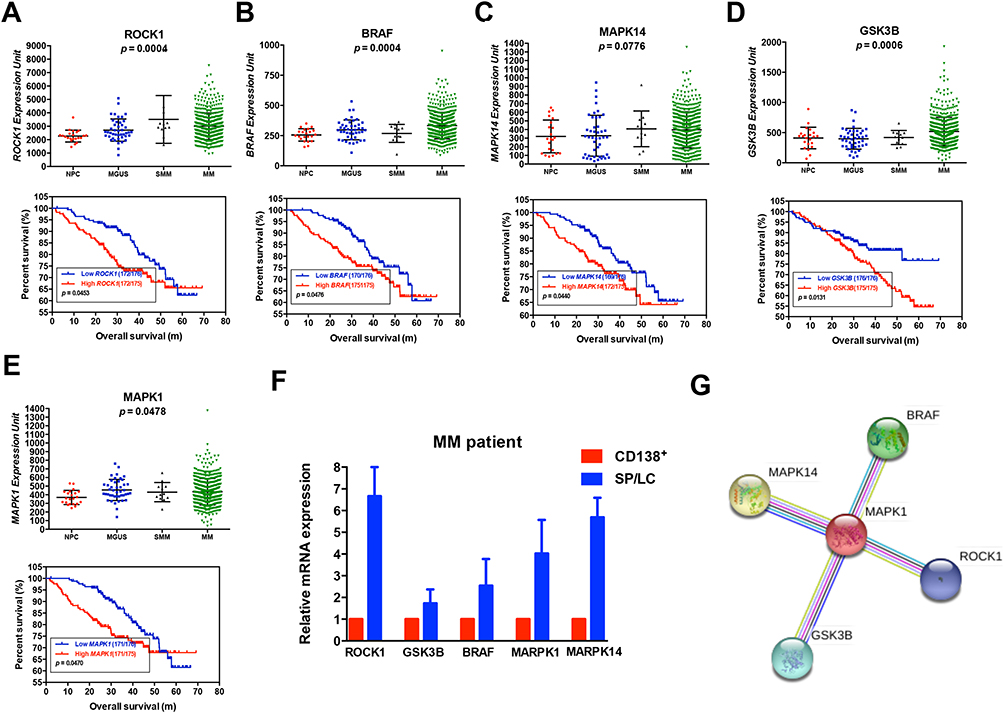 |
Figure 2 Five selected genes levels are correlated with poor survival in newly diagnosed myeloma patients. (A–E) Gene expression of NP (n = 22), MGUS (n = 44), SMM (n = 12) and MM (n = 559) in GSE5900 and GSE2658 datasets (upper row). Kaplan–Meier analysis on the overall survival of MM patients in TT2 cohorts based on the gene expression (lower row). (F) 5 selected gene mRNA expression from MM patients with paired SP/LC and CD138+ MM cells were detected by qRT-PCR. (G) The protein network was constructed by online STRING software. Abbreviations: NP, normal plasma; MGUS, monoclonal gammopathy of undetermined significance; SMM, smoldering multiple myeloma; qRT-PCR, quantitative real-time PCR; TT2. Total therapy 2. |
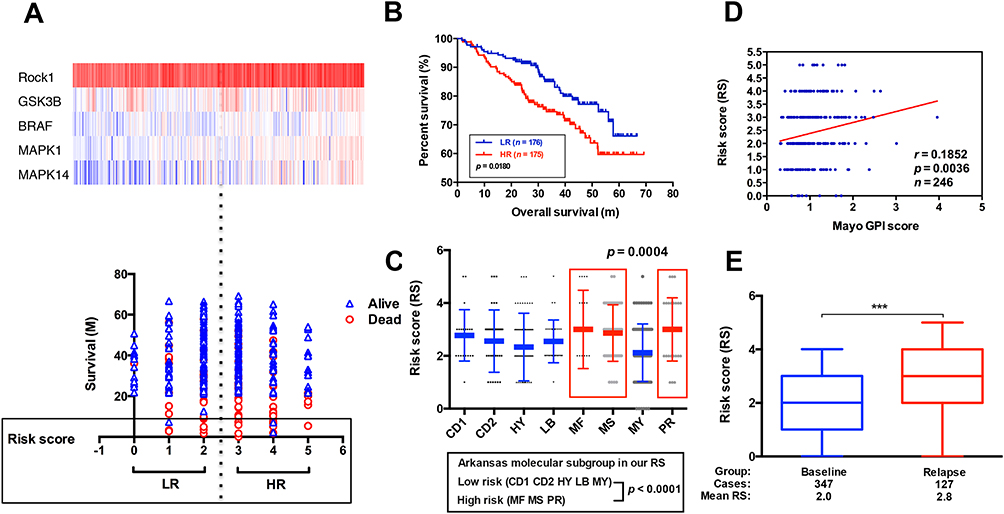 |
Figure 3 The correlation between MMSP5 model and disease progression. (A) Heat map (upper row) reporting probe fluorescence intensity of 5 selected genes for each patient evaluated in accordance with its survival, MMSP5 risk score (lower row). (B) The HR group identified MM patients with the lowest OS in GSE2658. (C) A scatter-plot showed MMSP5 risk scores in 8 MM subgroups (CD1 and CD2 subgroups with spiked expression of CCND1 and CCND3, PR, MY, LB, HY, MS and MF). (D) Scatter plot demonstrating positive correlation of MMSP5 risk scores and myeloma proliferation in 246 Bortezomib-treated patients from the Mayo Clinic. Tumor cell proliferation was scored with the assistance of GPI. (E) The MMSP5 risk scores were significantly up-regulated in relapsed patients from TT2 cohort compared to baseline patients (***p < 0.001). Abbreviations: MMSP5, MM side population 5 gene model; PR, proliferation; MY, myeloid-like group; LB, low-bone disease; HY, hyperdiploid; MS, MMSET; MF, MAFB; TT2, total therapy 2; HR, high-risk; LR, low-risk; GPI, gene expression-based proliferation index. |
MMSP5 Model and Disease Progression
Applying the 8-subgroup model (CD1, CD2, LB, HY, MF, MS, MY and PR) to MMSP5 model, Figure 3C presents the values of MMSP5 risk score in 8 subgroups, showing that elevated RS was particularly prevalent in 3 known to confer high-risk in terms of clinical outcome and course: MAF/MAFB (MF), MMSET/FGGR3 (MS) and Proliferation (PR). In sync with that, we observed a significantly increasing between the Zhan et al defined two different risk groups (low-risk group: CD1 + CD2 + LB + MY + HY and high-risk group: MF + MS + PR, 2.354 ± 0.071 vs 2.936 ± 0.123, P < 0.0001, Figure 3C).
To validate our findings, we also evaluated the efficiency of MMSP5 model in proliferation. Risk scores were positively correlated (r = 0.1852, P = 0.0036, Figure 3D) with myeloma cell proliferation in 246 Bortezomib-treated MM patients available at GSE9782 dataset, using the global gene expression-based proliferation index (GPI) of MM originated by Mayo Clinic as proxy of actual myeloma cell proliferation.32 In addition, risk scores significantly increased in the relapsed MM patients compared to baseline patients in GSE31161 (2.006 ± 0.054 vs 2.882 ± 0.111, P < 0.0001, Figure 3E). These data strongly suggested that MMSP5 model could be adopted in the evolution of myeloma progression and disease relapse.
Evaluation of the Prognostic Role of MMSP5 Model
To confirm the robustness of MMSP5, we evaluated the MMSP5 model in predicted clinicopathological parameters distribution. Using 11 clinicopathological parameters, we identified different distribution among risk subgroups in 559 patients. Lactate dehydrogenase (LDH) and number of bone lesions were significantly increased in the HR group compared with the LR group by unpaired t test (162.1 ± 3.149 vs 181.8 ± 4.529, P = 0.0004, Figure 4A; 9.678 ± 0.8324 vs 12.39 ± 0.9564, P = 0.0326, Figure 4B). Respectively, Albumin (ALB) and Haemoglobin (HB) were significantly decreased in the HR group (11.41 ± 0.107 vs 11.10 ± 0.109, P = 0.0399, Figure 4C; 4.104 ± 0.030 vs 3.994 ± 0.038, P = 0.0263, Figure 4D). The remaining clinicopathological parameters were equally distributed between two risk groups. As shown in Table 1, LDH and β2-Microglobulin (β2-MG) were also significantly more distributed in HR group compared to LR group.
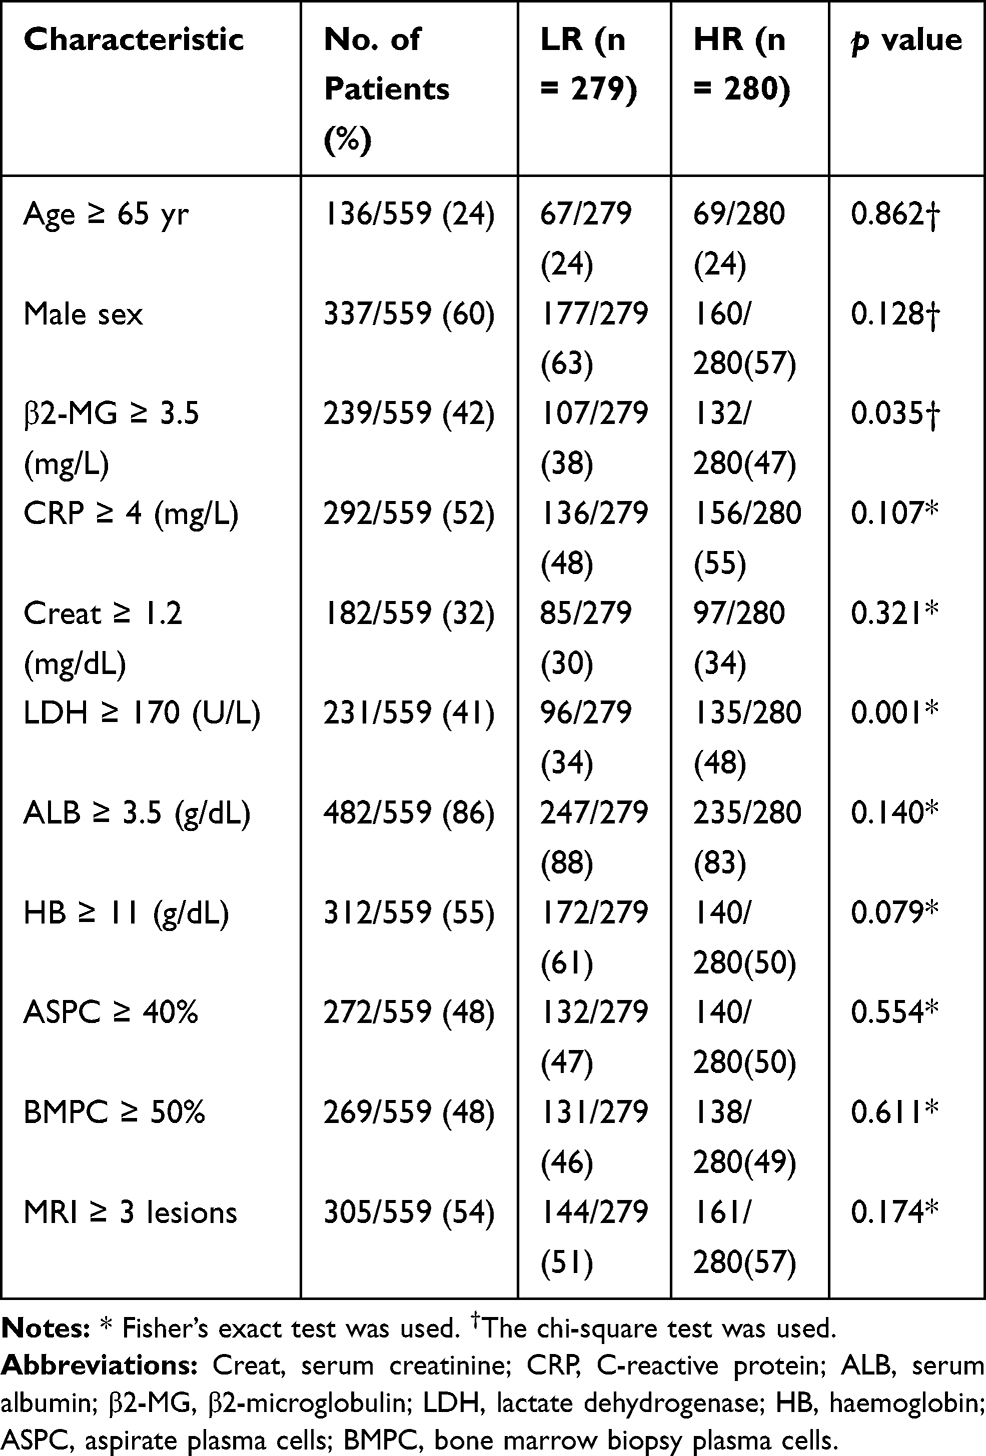 |
Table 1 Relation of the Characteristics 559 MM Patients |
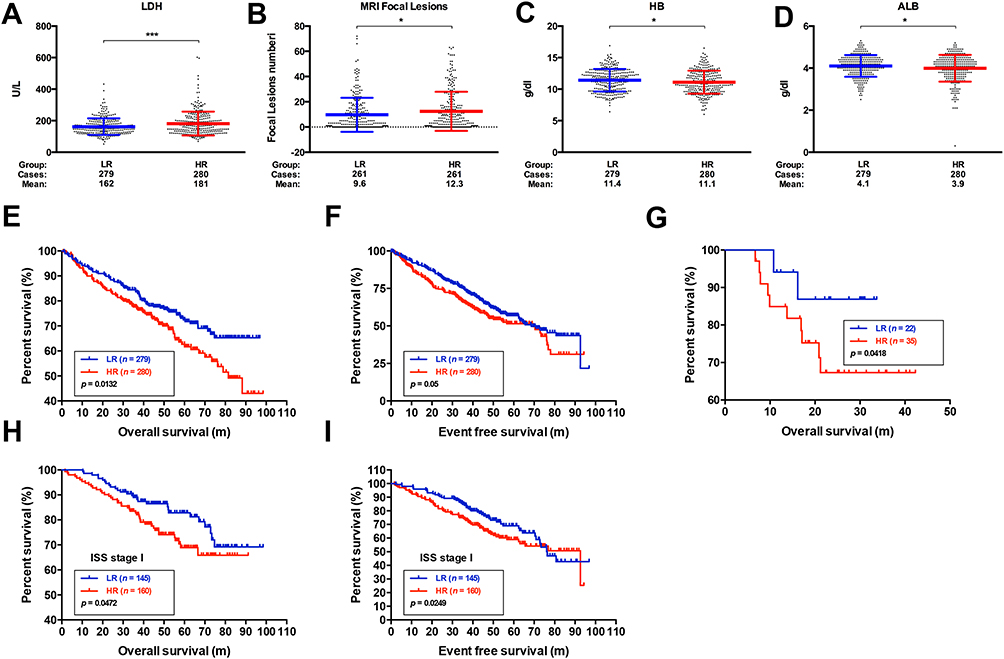 |
Figure 4 Evaluation of the prognostic role of the MMSP5 model. (A, B) The expression of LDH and MRI focal lesions in different subgroups of MMSP5 model. LDH and MRI focal lesions expressed highest in HR group, while lowest in LR group. (C, D) The expression of HB and ALB in different subgroups of MMSP5 model. HB and ALB expressed highest in LR group, while lowest in HR group. (E) The HR group identified MM patients with the lowest OS in UAMS cohort. (F) The HR group identified MM patients with the lowest EFS in UAMS cohort. (G) The HR group identified MM patients with the lowest OS in GSE57317. (H, I) The LR group had better OS and EFS compared to HR group in MM patients of ISS I stage (*p < 0.05, ***p < 0.001). Abbreviations: MMSP5, MM side population 5 gene model; HR, high risk; LR, low risk; LDH, lactate dehydrogenase; ALB, albumin; HB, haemoglobin; OS, overall survival; EFS, event-free survival; ISS, International Staging System. |
We applied the Kaplan-Meier analysis to validated MMSP5 model in two independent datasets: UAMS cohort and GSE57317, and survival curves indicated that LR group had better OS and EFS compared to HR group in the UAMS cohort (P = 0.0132, Figure 4E; P = 0.0500, Figure 4F). Similarly, LR group also had better OS compared to HR group in transplant-treated MM patients (GSE58317, P = 0.0418, Figure 4G). Based on the results of univariate Cox regression analysis, β2-MG, C-reactive protein (CRP), Creatinine (Creat), ALB, HB and MMSP5 model were further included for multivariable Cox regression analysis. As shown in Table 2, MMSP5 model was still an independent prognostic factor in terms of OS (HR = 1.380, 95% CI: 1.016–1.875, P = 0.039).
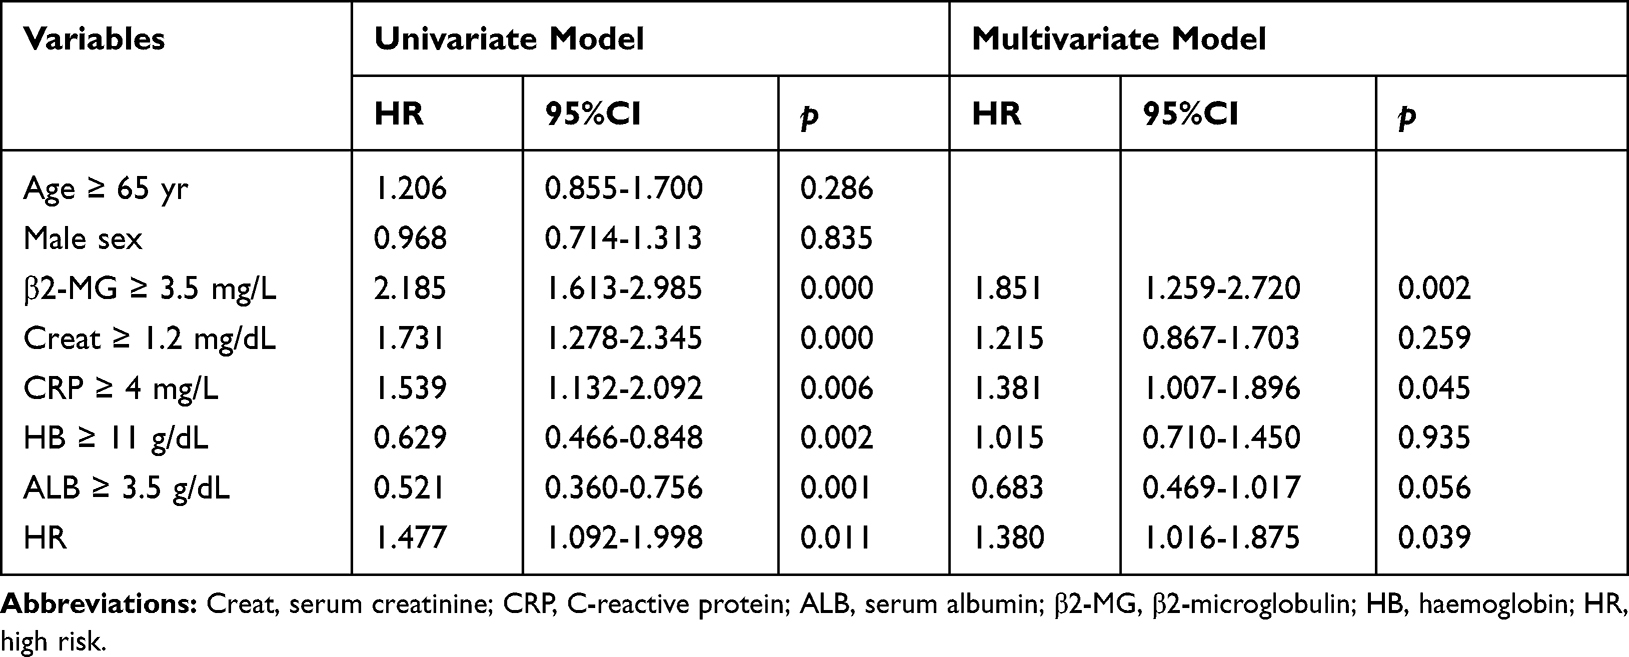 |
Table 2 Univariate and Multivariate Cox Regression Analyses for OS in 559 MM Patients |
Furthermore, MMSP5 risk score was able to divide ISS I stage patients (low-risk patients in ISS system) into HR and LR groups, and survival curves indicated that LR group had better OS and EFS compared to HR group in ISS I stage patients (P = 0.0472, Figure 4H; P = 0.0249, Figure 4I). Although the incorporation of ISS/ISS-R has significantly improved the accuracy rate to prognosis of patients, almost ISS I stage patients will ultimately suffer from relapse. In MMSP5 scoring system, evaluation of myeloma stem cell might improve the effectiveness of risk stratification. Thus, the MMSP5 model clearly indicates more effectiveness and possibilities of prognosis compared to ISS/ISS-R stages.
Discussion
Myeloma stem cell, a rare population of myeloma cells with the capacity for drug resistance and self-renewal, is considered to lead to myeloma relapse.9,10 The identification of the myeloma stem cell should rely on cell phenotypes. Unfortunately, the myeloma stem cell phenotypes had not been appropriately defined yet. All these led to the investigation that prognostic markers in myeloma stem cell could reflect the clinical outcome of MM patients.
In this research, a total of 988 DEGs (393 up-regulated genes and 595 down-regulated genes) were identified between the SP and MP groups. These up-regulated DEGs were mostly enriched in KEGG pathways such as Chemokine signaling pathway, Osteoclast differentiation, FoxO signaling, Regulation of actin cytoskeleton and Insulin signaling pathway. As we all know, chemokine is widely expressed in cancer stem cell niche and modulates the cancer stem cell self-renewal;33,34 Osteoclast differentiation is an important mechanism for myeloma bone lesions and regulated the bone homeostasis and hematopoietic stem cells niche;2,35 FoxO proteins conduce to the metabolism of cancer stem cells as well as to the initiation, maintenance and progression of cancer;36 The cytoskeleton activities are coordinated with formation/disassembly of cancer stem cell–ECM adhesions;37,38 Insulin signaling directly controls germline stem cells cell division, indicating that this signaling acts both extrinsically and intrinsically to control cancer stem cells.39 Functional enrichment analyses indicated that hub genes were mostly enriched in cancer stem cell-related GO terms, which were in accordance with the stemness value of hub genes. Based on the above results, we selected 5 hub genes for our model. MM patients in this 5-gene (ROCK1, GSK3B, BRAF, MAPK1 and MAPK14) low expression group were related to better OS compared to high expression group, respectively.
Actually, these selected hub genes in our signature have been experimentally demonstrated to be related to cancer stem cell as following: inactivation of ROCK1 decreased the self-renewal and OCT4 transcription activity, and rescued glioma stem cells tumorigenic potential;40 Inhibition of GSK3B abolished the expression of all mesenchymal and stemness markers and altered the dynamics of tumour sphere formation and cell plasticity in cancer stem cell;41 BRAF inhibitors synergize with cetuximab to weaken metastatic and stemness capacities of cancer stem cell;42 MAPK1, MAPK14 were the FoxO proteins and p38α (MAPK14) regulates osteoclastogenesis, p38α ablation could regulate bone formation and bone marrow mesenchymal stem cells, due to decreased expression of BMP2 and PDGF-AA;43 Above literatures provided stable support for the 5-gene signature in the biologic function of cancer stem cell. We constructed a prognostic risk score with MM patients divided into two risk groups. Firstly, we evaluated our prognostic score in 8-subgroup model. The scatter plot showed that distribution of MMSP5 model was similar to 8-subgroup model. Aggressive subgroups of myeloma (chiefly subgroups: MF, MS and PR), which are characterized by high-risk myeloma and associated with an adverse prognosis,4,44 had significantly higher MMSP5 risk scores compared to other molecular subgroups.
MMSP5 model was more comprehensively estimated the efficiency in proliferation and recurrence. Analyzing GEO datasets along with MMSP5 model. In the GSE9782 dataset, MMSP5 risk scores in 246 Bortezomib-treated patients paralleled the myeloma proliferation score, which was scored with the boost of GPI.45 In the GSE31161 dataset, we found a significant increase of MMSP5 risk scores in relapsed patients compared to baseline patients. A high MMSP5 risk score possibly reflected biological capabilities of MM cells that confer resistance to Bortezomib-based regimes. Therefore, MMSP5 model might allow rapid risk determination at diagnosis, enabling suggestions of more intensified investigational treatments to be directed to high-risk MM patients.
We also analyzed the prognostic significance of MMSP5 model in MM patients, high-risk groups correlated with markers of myeloma activity, such as lower levels of ALB and HB, higher levels of LDH, number of lesions on MRI and β2-MG. Among them, International Staging System (ISS) has been constructed, which combines clinicopathological parameters of tumor burden (ALB and β2-MG) with parameters of aggressive tumor biology (bone lesions and LDH).46,47 Whether the ISS is used, ALB and renal function have been considered easy and good indicators of survival.48 The serum level of β2-MG was one of the most important independent predictors of survival and considered an indicator of tumor burden.49 High levels of circulating LDH enhanced myeloma cell proliferation and drug resistance under stressed conditions, and correlated with poor prognosis in myeloma.50–52 More importantly, HR group correlated significantly to all the aforementioned parameters of disease activity, which support the fact that MMSP5 model might have prognostic value.
At last, we evaluated the prognostic value of MMSP5 model with independent datasets. Our results indicated that survival conditions were significantly different in HR and LR patients (divided by MMSP5 model). Univariate and multivariate Cox regression analysis were then performed to verify the association of clinicopathological parameters and MMSP5 model with survival. Our results further proved that MMSP5 HR group was an independent prognostic factor.
Conclusion
To sum up, incorporation of MMSP5 into risk determination algorithms for newly diagnosed MM patients will facilitate the development of anti-MM treatments in the ongoing effort to decrease recurrence risk and prolong survival.
Data Sharing Statement
The dataset supporting the conclusions of this article is included in the article.
Author Contributions
All authors made substantial contributions to conception and design, acquisition of data, or analysis and interpretation of data, took part in drafting the article or revising it critically for important intellectual content, gave final approval of the version to be published, and agree to be accountable for all aspects of the work.
Funding
This work was supported by the Jiangsu Provincial Medical Innovation Team (CXTDA2017046).
Disclosure
The authors report no conflicts of interest in this work.
References
1. Palumbo A, Anderson K. Multiple myeloma. N Engl J Med. 2011;364(11):1046–1060. doi:10.1056/NEJMra1011442
2. Bai H, Zhu H, Yan Q, et al. TRPV2-induced Ca(2+)-calcineurin-NFAT signaling regulates differentiation of osteoclast in multiple myeloma. Cell Commun Signaling. 2018;16(1):68. doi:10.1186/s12964-018-0280-8
3. Walker BA, Leone PE, Chiecchio L, et al. A compendium of myeloma-associated chromosomal copy number abnormalities and their prognostic value. Blood. 2010;116(15):e56–e65. doi:10.1182/blood-2010-04-279596
4. Zhan F, Huang Y, Colla S, et al. The molecular classification of multiple myeloma. Blood. 2006;108(6):2020–2028. doi:10.1182/blood-2005-11-013458
5. Shaughnessy JD
6. Decaux O, Lode L, Magrangeas F, et al. Prediction of survival in multiple myeloma based on gene expression profiles reveals cell cycle and chromosomal instability signatures in high-risk patients and hyperdiploid signatures in low-risk patients: a study of the Intergroupe Francophone du Myelome. J Clin Oncol. 2008;26(29):4798–4805. doi:10.1200/JCO.2007.13.8545
7. Dingli D, Ailawadhi S, Bergsagel PL, et al. Therapy for relapsed multiple myeloma: guidelines from the mayo stratification for myeloma and risk-adapted therapy. Mayo Clinic Proc. 2017;92(4):578–598. doi:10.1016/j.mayocp.2017.01.003
8. Kassambara A, Hose D, Moreaux J, et al. Identification of pluripotent and adult stem cell genes unrelated to cell cycle and associated with poor prognosis in multiple myeloma. PLoS One. 2012;7(7):e42161. doi:10.1371/journal.pone.0042161
9. Franqui-Machin R, Wendlandt EB, Janz S, Zhan F, Tricot G. Cancer stem cells are the cause of drug resistance in multiple myeloma: fact or fiction? Oncotarget. 2015;6(38):40496–40506. doi:10.18632/oncotarget.5800
10. Gao M, Kong Y, Yang G, Gao L, Shi J. Multiple myeloma cancer stem cells. Oncotarget. 2016;7(23):35466–35477. doi:10.18632/oncotarget.8154
11. Ng SW, Mitchell A, Kennedy JA, et al. A 17-gene stemness score for rapid determination of risk in acute leukaemia. Nature. 2016;540(7633):433–437. doi:10.1038/nature20598
12. Xu G, Zhang M, Zhu H, Xu J. A 15-gene signature for prediction of colon cancer recurrence and prognosis based on SVM. Gene. 2017;604:33–40. doi:10.1016/j.gene.2016.12.016
13. Ghobrial IM. Myeloma as a model for the process of metastasis: implications for therapy. Blood. 2012;120(1):20–30. doi:10.1182/blood-2012-01-379024
14. Boucher K, Parquet N, Widen R, et al. Stemness of B-cell progenitors in multiple myeloma bone marrow. Clin Cancer Res. 2012;18(22):6155–6168. doi:10.1158/1078-0432.CCR-12-0531
15. Yang Y, Shi J, Gu Z, et al. Bruton tyrosine kinase is a therapeutic target in stem-like cells from multiple myeloma. Cancer Res. 2015;75(3):594–604. doi:10.1158/0008-5472.CAN-14-2362
16. Yang Y, Shi J, Tolomelli G, et al. RARalpha2 expression confers myeloma stem cell features. Blood. 2013;122(8):1437–1447. doi:10.1182/blood-2013-02-482919
17. Goodell MA, Brose K, Paradis G, Conner AS, Mulligan RC. Isolation and functional properties of murine hematopoietic stem cells that are replicating in vivo. J Exp Med. 1996;183(4):1797–1806. doi:10.1084/jem.183.4.1797
18. Jakubikova J, Adamia S, Kost-Alimova M, et al. Lenalidomide targets clonogenic side population in multiple myeloma: pathophysiologic and clinical implications. Blood. 2011;117(17):4409–4419. doi:10.1182/blood-2010-02-267344
19. Yan W, Du J, Du Y, et al. Fenretinide targets the side population in myeloma cell line NCI-H929 and potentiates the efficacy of antimyeloma with bortezomib and dexamethasone regimen. Leuk Res. 2016;51:32–40. doi:10.1016/j.leukres.2016.10.010
20. Nara M, Teshima K, Watanabe A, et al. Bortezomib reduces the tumorigenicity of multiple myeloma via downregulation of upregulated targets in clonogenic side population cells. PLoS One. 2013;8(3):e56954. doi:10.1371/journal.pone.0056954
21. Gao M, Bai H, Jethava Y, et al. Identification and characterization of tumor-initiating cells in multiple myeloma. J Natl Cancer Inst. 2019. doi:10.1093/jnci/djz159
22. Zhan F, Barlogie B, Arzoumanian V, et al. Gene-expression signature of benign monoclonal gammopathy evident in multiple myeloma is linked to good prognosis. Blood. 2007;109(4):1692–1700. doi:10.1182/blood-2006-07-037077
23. Shi L, Campbell G, Jones WD, et al. The MicroArray Quality Control (MAQC)-II study of common practices for the development and validation of microarray-based predictive models. Nat Biotechnol. 2010;28(8):827–838.
24. Mitchell JS, Li N, Weinhold N, et al. Genome-wide association study identifies multiple susceptibility loci for multiple myeloma. Nat Commun. 2016;7(1):12050. doi:10.1038/ncomms12050
25. Mulligan G, Mitsiades C, Bryant B, et al. Gene expression profiling and correlation with outcome in clinical trials of the proteasome inhibitor bortezomib. Blood. 2007;109(8):3177–3188. doi:10.1182/blood-2006-09-044974
26. Heuck CJ, Qu P, van Rhee F, et al. Five gene probes carry most of the discriminatory power of the 70-gene risk model in multiple myeloma. Leukemia. 2014;28(12):2410–2413. doi:10.1038/leu.2014.232
27. Irizarry RA, Hobbs B, Collin F, et al. Exploration, normalization, and summaries of high density oligonucleotide array probe level data. Biostatistics. 2003;4(2):249–264. doi:10.1093/biostatistics/4.2.249
28. Gautier L, Cope L, Bolstad BM, Irizarry RA. affy–analysis of Affymetrix GeneChip data at the probe level. Bioinformatics. 2004;20(3):307–315. doi:10.1093/bioinformatics/btg405
29. Ritchie ME, Phipson B, Wu D, et al. limma powers differential expression analyses for RNA-sequencing and microarray studies. Nucleic Acids Res. 2015;43(7):e47. doi:10.1093/nar/gkv007
30. Dennis G
31. Bai W, Wang H, Bai H. Identification of candidate genes and therapeutic agents for light chain amyloidosis based on bioinformatics approach. Pharmacogenomics Pers Med. 2019;12:387–396. doi:10.2147/PGPM.S228574
32. Bergsagel PL, Kuehl WM, Zhan F, Sawyer J, Barlogie B, Shaughnessy J
33. Ibrahim SA, Gadalla R, El-Ghonaimy EA, et al. Syndecan-1 is a novel molecular marker for triple negative inflammatory breast cancer and modulates the cancer stem cell phenotype via the IL-6/STAT3, Notch and EGFR signaling pathways. Mol Cancer. 2017;16(1):57. doi:10.1186/s12943-017-0621-z
34. Hayakawa Y, Ariyama H, Stancikova J, et al. Mist1 expressing gastric stem cells maintain the normal and neoplastic gastric epithelium and are supported by a perivascular stem cell niche. Cancer Cell. 2015;28(6):800–814. doi:10.1016/j.ccell.2015.10.003
35. Jadhav G, Teguh D, Kenny J, Tickner J, Xu J. Morc3 mutant mice exhibit reduced cortical area and thickness, accompanied by altered haematopoietic stem cells niche and bone cell differentiation. Sci Rep. 2016;6(1):25964. doi:10.1038/srep25964
36. Zhang X, Rielland M, Yalcin S, Ghaffari S. Regulation and function of FoxO transcription factors in normal and cancer stem cells: what have we learned? Curr Drug Targets. 2011;12(9):1267–1283. doi:10.2174/138945011796150325
37. Sun B, Zhang D, Zhao N, Zhao X. Epithelial-to-endothelial transition and cancer stem cells: two cornerstones of vasculogenic mimicry in malignant tumors. Oncotarget. 2017;8(18):30502–30510. doi:10.18632/oncotarget.8461
38. Sun M, Zaman MH. Modeling, signaling and cytoskeleton dynamics: integrated modeling-experimental frameworks in cell migration. Wiley Interdiscip Rev Syst Biol Med. 2017;9(1):e1365. doi:10.1002/wsbm.1365
39. Kao SH, Tseng CY, Wan CL, et al. Aging and insulin signaling differentially control normal and tumorous germline stem cells. Aging Cell. 2015;14(1):25–34. doi:10.1111/acel.12288
40. Wu F, Hu P, Li D, et al. RhoGDIalpha suppresses self-renewal and tumorigenesis of glioma stem cells. Oncotarget. 2016;7(38):61619–61629. doi:10.18632/oncotarget.11423
41. Turano M, Costabile V, Cerasuolo A, et al. Characterisation of mesenchymal colon tumour-derived cells in tumourspheres as a model for colorectal cancer progression. Int J Oncol. 2018;53(6):2379–2396. doi:10.3892/ijo.2018.4565
42. Wu Z, Huang M, Gong Y, Lin C, Guo W. BRAF and EGFR inhibitors synergize to increase cytotoxic effects and decrease stem cell capacities in BRAF(V600E)-mutant colorectal cancer cells. Acta Biochim Biophys Sin (Shanghai). 2018;50(4):355–361. doi:10.1093/abbs/gmy018
43. Cong Q, Jia H, Li P, et al. p38alpha MAPK regulates proliferation and differentiation of osteoclast progenitors and bone remodeling in an aging-dependent manner. Sci Rep. 2017;7(1):45964. doi:10.1038/srep45964
44. van Andel H, Kocemba KA, de Haan-kramer A, et al. Loss of CYLD expression unleashes Wnt signaling in multiple myeloma and is associated with aggressive disease. Oncogene. 2017;36(15):2105–2115. doi:10.1038/onc.2016.368
45. Hose D, Reme T, Hielscher T, et al. Proliferation is a central independent prognostic factor and target for personalized and risk-adapted treatment in multiple myeloma. Haematologica. 2011;96(1):87–95. doi:10.3324/haematol.2010.030296
46. Rajkumar SV. Myeloma today: disease definitions and treatment advances. Am J Hematol. 2016;91(1):90–100. doi:10.1002/ajh.24236
47. Greipp PR, San Miguel J, Durie BG, et al. International staging system for multiple myeloma. J clin oncol. 2005;23(15):3412–3420. doi:10.1200/JCO.2005.04.242
48. Jacobson JL, Hussein MA, Barlogie B, Durie BG, Crowley JJ, Southwest Oncology G. A new staging system for multiple myeloma patients based on the Southwest Oncology Group (SWOG) experience. Br J Haematol. 2003;122(3):441–450. doi:10.1046/j.1365-2141.2003.04456.x
49. Min R, Li Z, Epstein J, Barlogie B, Yi Q. Beta(2)-microglobulin as a negative growth regulator of myeloma cells. Br J Haematol. 2002;118(2):495–505. doi:10.1046/j.1365-2141.2002.03635.x
50. Yang J, Liu Z, Liu H, et al. C-reactive protein promotes bone destruction in human myeloma through the CD32-p38 MAPK-Twist axis. Sci Signal. 2017;10(509):509. doi:10.1126/scisignal.aan6282
51. Ludwig H, Durie BG, Bolejack V, et al. Myeloma in patients younger than age 50 years presents with more favorable features and shows better survival: an analysis of 10 549 patients from the international myeloma working group. Blood. 2008;111(8):4039–4047. doi:10.1182/blood-2007-03-081018
52. Dimopoulos MA, Barlogie B, Smith TL, Alexanian R. High serum lactate dehydrogenase level as a marker for drug resistance and short survival in multiple myeloma. Ann Intern Med. 1991;115(12):931–935. doi:10.7326/0003-4819-115-12-931
 © 2020 The Author(s). This work is published and licensed by Dove Medical Press Limited. The full terms of this license are available at https://www.dovepress.com/terms.php and incorporate the Creative Commons Attribution - Non Commercial (unported, v3.0) License.
By accessing the work you hereby accept the Terms. Non-commercial uses of the work are permitted without any further permission from Dove Medical Press Limited, provided the work is properly attributed. For permission for commercial use of this work, please see paragraphs 4.2 and 5 of our Terms.
© 2020 The Author(s). This work is published and licensed by Dove Medical Press Limited. The full terms of this license are available at https://www.dovepress.com/terms.php and incorporate the Creative Commons Attribution - Non Commercial (unported, v3.0) License.
By accessing the work you hereby accept the Terms. Non-commercial uses of the work are permitted without any further permission from Dove Medical Press Limited, provided the work is properly attributed. For permission for commercial use of this work, please see paragraphs 4.2 and 5 of our Terms.