")
Back to Journals » Cancer Management and Research » Volume 10
A 15-lncRNA signature predicts survival and functions as a ceRNA in patients with colorectal cancer
Authors Wang X , Zhou J , Xu M, Yan Y, Huang L, Kuang Y, Liu Y , Li P, Zheng W, Liu H, Jia B
Received 29 June 2018
Accepted for publication 27 September 2018
Published 16 November 2018 Volume 2018:10 Pages 5799—5806
DOI https://doi.org/10.2147/CMAR.S178732
Checked for plagiarism Yes
Review by Single anonymous peer review
Peer reviewer comments 3
Editor who approved publication: Professor Harikrishna Nakshatri
Xuning Wang,1 Jianguo Zhou,2 Maolin Xu,1 Yongfeng Yan,3 Liang Huang,1 Yanshen Kuang,1 Yuansheng Liu,4 Peng Li,3 Wei Zheng,3 Hongyi Liu,3 Baoqing Jia3
1Department of General Surgery, Chinese PLA Medical School, Beijing 100853, People’s Republic of China; 2Division of Thoracic Oncology, Department of Oncology, Affiliated Hospital of Zunyi Medical University, Zunyi City 563000, Guizhou Province, People’s Republic of China; 3Department of General Surgery, Chinese PLA General Hospital, Beijing 100853, People’s Republic of China; 4School of Medicine, Nankai University, TianJing, People’s Republic of China
Purpose: Colorectal cancer (CRC) is one of the most common malignant tumors worldwide. This study aimed to explore the prognostic value of lncRNAs in CRC.
Material and methods: We performed gene expression profiling to identify differentially expressed lncRNAs between 51 normal and 646 tumor tissues from The Cancer Genome Atlas database. Cox regression and robust likelihood-based survival models were used to find prognosis-related lncRNAs. A lncRNA signature was developed to predict the overall survival of patients with CRC. In addition, a receiver operating characteristic curve analysis was performed to identify the optimal cutoff with the best Youden index to divide patients into different groups based on risk level.
Results: Eighty survival-related lncRNAs were identified and a 15-lncRNA signature was developed on the basis of a risk score to comprehensively predict the overall survival of patients with CRC. The prognostic value of the 15-lncRNA risk score was validated using the internal testing set and total set. The risk indicator was shown to be an independent prognostic factor (hazard ratio =2.92; 95% CI: 1.73–4.94; P<0.001). Notably, all 15 lncRNAs (AC024581.1, FOXD3-AS1, AC012531.1, AC003101.2, LINC01219, AC083967.1, AL590483.1, AC105118.1, AC010789.1, AC067930.5, AC105219.2, LINC01354, LINC02474, LINC02257, and AC079612.1) were newly found to correlate with the prognosis of patients with CRC. Furthermore, the function of 15 lncRNAs was explored through the ceRNA network. These lncRNAs regulated coding genes that were involved in many key cancer pathways.
Conclusion: A 15-lncRNA expression signature was discovered as a prognostic indicator for patients with CRC, which may act as competing endogenous RNA (ceRNAs) to play a crucial role in the modulation of cancer-related pathways. These findings may allow a better understanding of the prognostic value of lncRNAs.
Keywords: long noncoding RNA, colorectal cancer, survival, biomarker, competing endogenous RNA, ceRNA
Introduction
Colorectal cancer (CRC) is one of the most common malignant tumors of the gastrointestinal tract worldwide, as well as the fourth leading cause of cancer-related death owing to its prevalence and mortality.1 Studies have shown that CRC is caused by several genetic factors, including changes in chromosomal copy number, aberrant gene methylation, and dysregulated gene expression.2,3 Considerable progress has been made in the diagnosis and treatment of CRC in the last several decades. However, the current prognostic factors for patients with CRC do not meet clinical needs, making it necessary to identify novel biomarkers in a sensitive and accurate way to better predict overall survival.
lncRNAs, usually >200 nucleotides in length, are a class of RNAs that do not code for proteins.4 lncRNAs used to be considered “transcript junk,” but have recently emerged as key molecules in multiple complex biological processes (BP),4,5 including proliferation, cell cycle progression, and survival.6 Several reports have shown that lncRNAs serve as modulators of carcinogenesis and affect the rates of invasion and metastasis in several types of cancer.6 However, the biological function and prognostic value of many lncRNAs remain unknown. Interestingly, it has been shown that numerous lncRNAs can act as competing endogenous RNAs (ceRNAs) to regulate the expression of coding genes7 that have common miRNA response elements (MREs). In this study, the predictive value of lncRNAs in patients with CRC was explored. Furthermore, the function of these lncRNAs was investigated using the ceRNA network.
Materials and methods
Data processing and computational analysis
Figure 1 shows the overall workflow of this study. The data of 697 RNA expression profiles (level 3), including 51 normal tissues and 646 tumor tissues, were downloaded from The Cancer Genome Atlas (TCGA) data portal (dated to September 18, 2017). This study met the publication guidelines provided by TCGA (http://cancergenome.nih.gov/publications/publicationguidelines). According to TCGA guidelines, RNA expression profiles can be studied in three forms: HT-seq raw read count, Fragments per Kilobase of transcript per Million mapped reads (FPKM), and FPKM-UQ (upper quartile normalization). Here, HT-seq raw read count was chosen. lncRNAs general feature format file (Gencode.v27) was used as the lncRNA annotation reference.8 The expression profiles of lncRNAs were analyzed by edgeR.9,10 Differentially expressed lncRNAs were selected according to P-value (≤0.01) and absolute fold change (≥2).
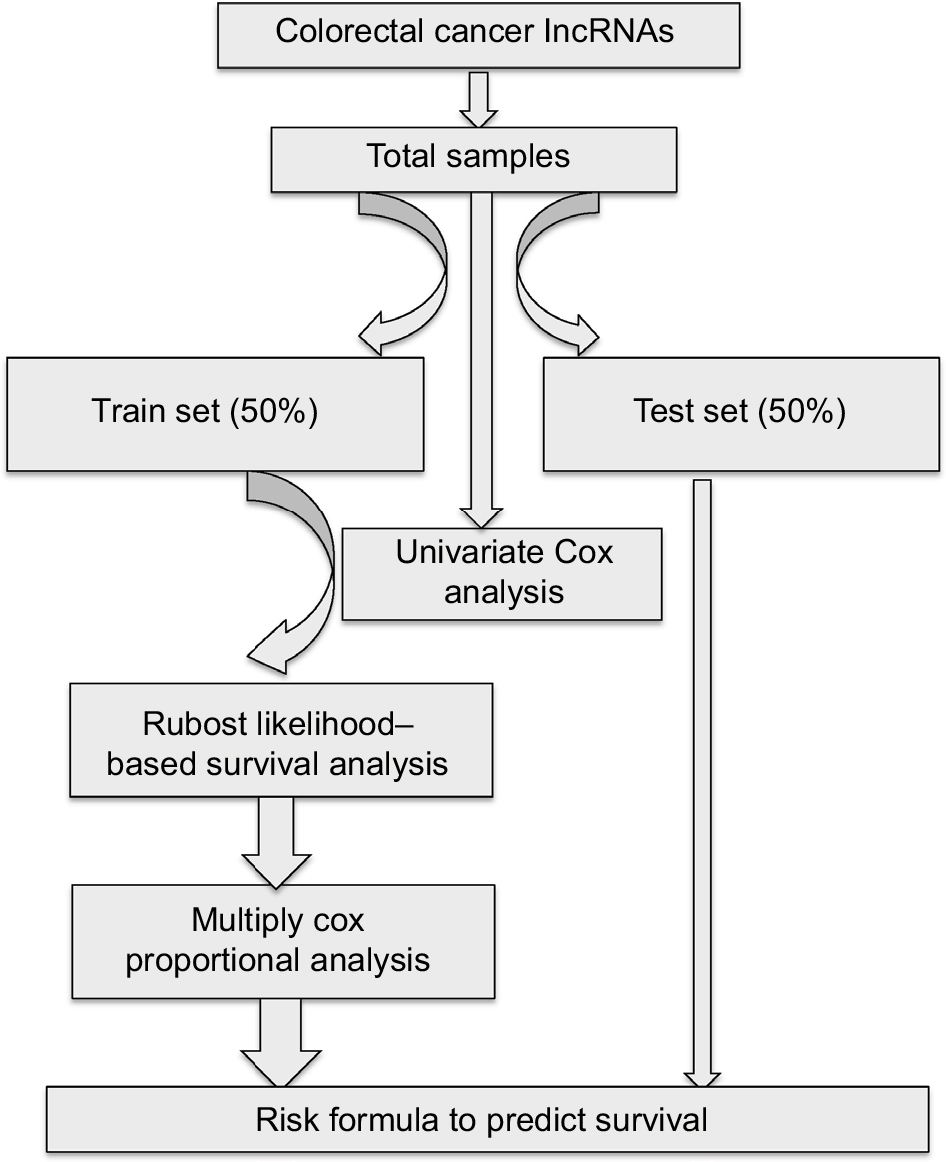 | Figure 1 Main workflow for the identification of cancer-related lncRNAs. |
Identification of lncRNAs related to patient prognosis
Samples were filtered by removing cases without complete survival data to yield 616 samples that were included in our analysis. All samples were randomly divided into either training set (308 samples) or validation set (308 samples) groups. The clinical and demographic characteristics of the study population are shown in Table 1. There was no statistical difference between the two sets. To determine the feasibility and reliability of survival-associated lncRNAs as prognostic markers in CRC, univariate Cox proportional hazards regression was applied to identify overall survival-related lncRNAs. The robust likelihood-based survival model, using the R package analysis method (Rbsurv), was then applied to further identify prognosis-related lncRNAs.11 The protocol of this method was as follows: first, the model randomly put N(1 − p) samples into the training set and Np cases into the validation set. Here, we chose p=1/3. Second, the model added a gene to the training set and obtained the parameter for the gene. The loglik was evaluated for each parameter and validated within the internal validation samples. The procedure was repeated 1,000 times to select the best prognosis-related lncRNAs with the smallest mean negative loglik. Next, the Akaike information criterion (AIC) was computed and used as an estimator of the relative quality of statistical models for a given set of data, and the optimal model was chosen with the smallest AIC. P<0.05 was considered statistically significant.
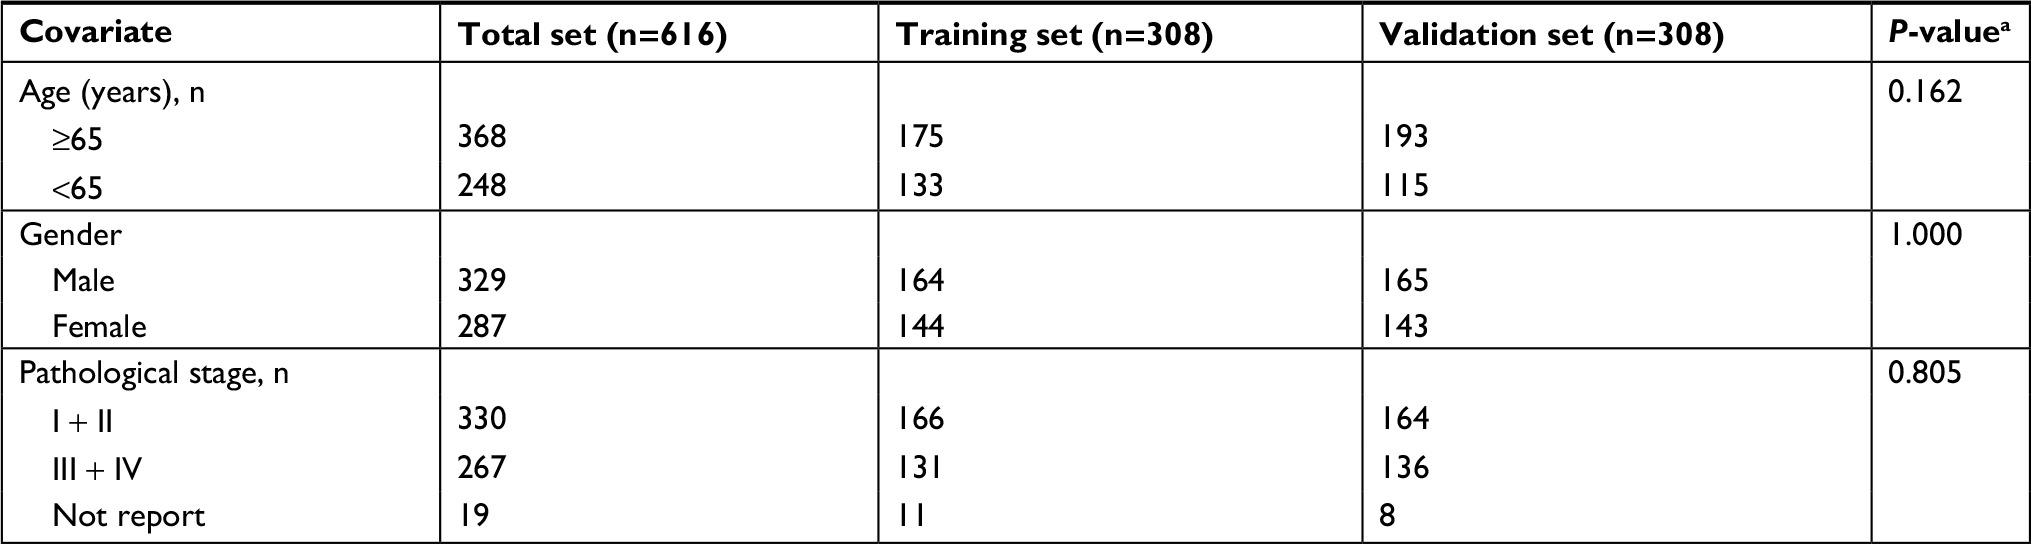 | Table 1 Clinical covariates for TCGA colorectal cancer Note: aχ2 test. Abbreviation: TCGA, The Cancer Genome Atlas. |
Establishment and validation of the risk formula
lncRNAs chosen from the previous step were inserted into the multiply Cox proportional model to calculate the coefficients in the training set, thereby establishing the risk formula. Risk scores for each sample were calculated using this formula. All patients were classified into either the high-risk or the low-risk group on the basis of the median of their risk score. The Kaplan–Meier method and the log-rank test were applied to analyze the overall survival of the two groups using the R package survival analysis.12,13 A time-dependent receiver operating characteristic curve (ROC) was constructed to evaluate the prediction value of the model (version 1.0.3),14 and the figures were plotted by ggplot2 (version 2.2.1)15 and ggfortify (version 0.4.1).16,17 All data were processed and analyzed by perl 5 version 24, excel 2010, and R (version 3.4.1).
Determination of lncRNA function
The function of the lncRNAs was explored using the triple ceRNA (lncRNA–miRNA–mRNA) network. The sequences of the identified lncRNAs were obtained from Ensembl18 and inputted into the miRDB19,20 database to predict their miRNA targets. The corresponding coding genes were then identified using miRDB,19,20 miRTarBase,21 and TargetScan.22 The triple ceRNA network was visualized and constructed by Cytoscape v3.5.1.23 The Gene Ontology (GO) and Kyoto Encyclopedia of Genes and Genomes (KEGG) pathway analysis coding genes were annotated by the R package of clusterProfiler.24 The cutoff P-value was 0.05.
Results
Differential expression of lncRNAs
A total of 1,103 differentially expressed lncRNAs were identified in patients with CRC. These lncRNAs are listed in Table S1. Eighty lncRNAs that were associated with overall survival were identified through our univariate Cox regression analysis in the total set (Table S2).
Identification of a 15-lncRNA signature
The 20 lncRNAs with the lowest P-value were selected (Table 2) and analyzed with the robust likelihood-based survival model. Fifteen lncRNAs were selected with the lowest AIC values. The risk coefficients for these lncRNAs were calculated using the multivariable Cox proportional hazards model. The risk formula used to calculate the risk score was as follows: (0.238*AC024581.1)+(0.053*FOXD3-AS1)+(0.067*AC012531.1)+(0.221*AC003101.2)+(0.357*LINC01219)+(0.082*AC083967.1)+(–0.113*AL590483.1)+(0.060*AC105118.1)+(0.031*AC010789.1)+(0.126*AC067930.5)+(0.161*AC105219.2)+(0.317*LINC01354)+(0.139*LINC02474)+(–0.131*LINC02257)+(–0.269*AC079612.1). Additionally, the risk scores were calculated for each patient in the training set. The patients were divided into two groups on the basis of the median of the risk scores (Figure 2A). Figure 2B shows the distribution of patient survival status and survival time. Survival, assessed with the Kaplan–Meier method and log-rank test, indicated that patients with a high-risk score had a shorter survival time (P<0.001) (Figure 2C). In our analysis, survival time was negatively correlated with risk score.
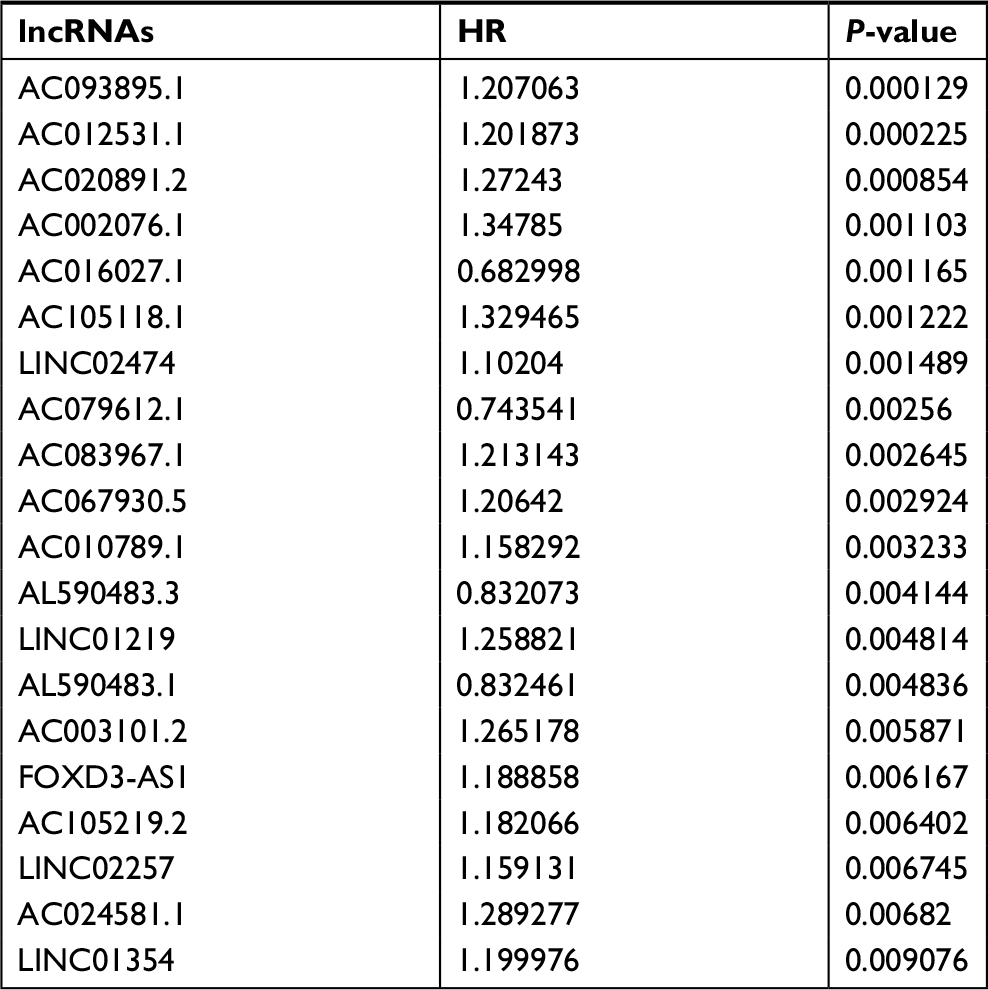 | Table 2 Top 20 survival-related lncRNAs |
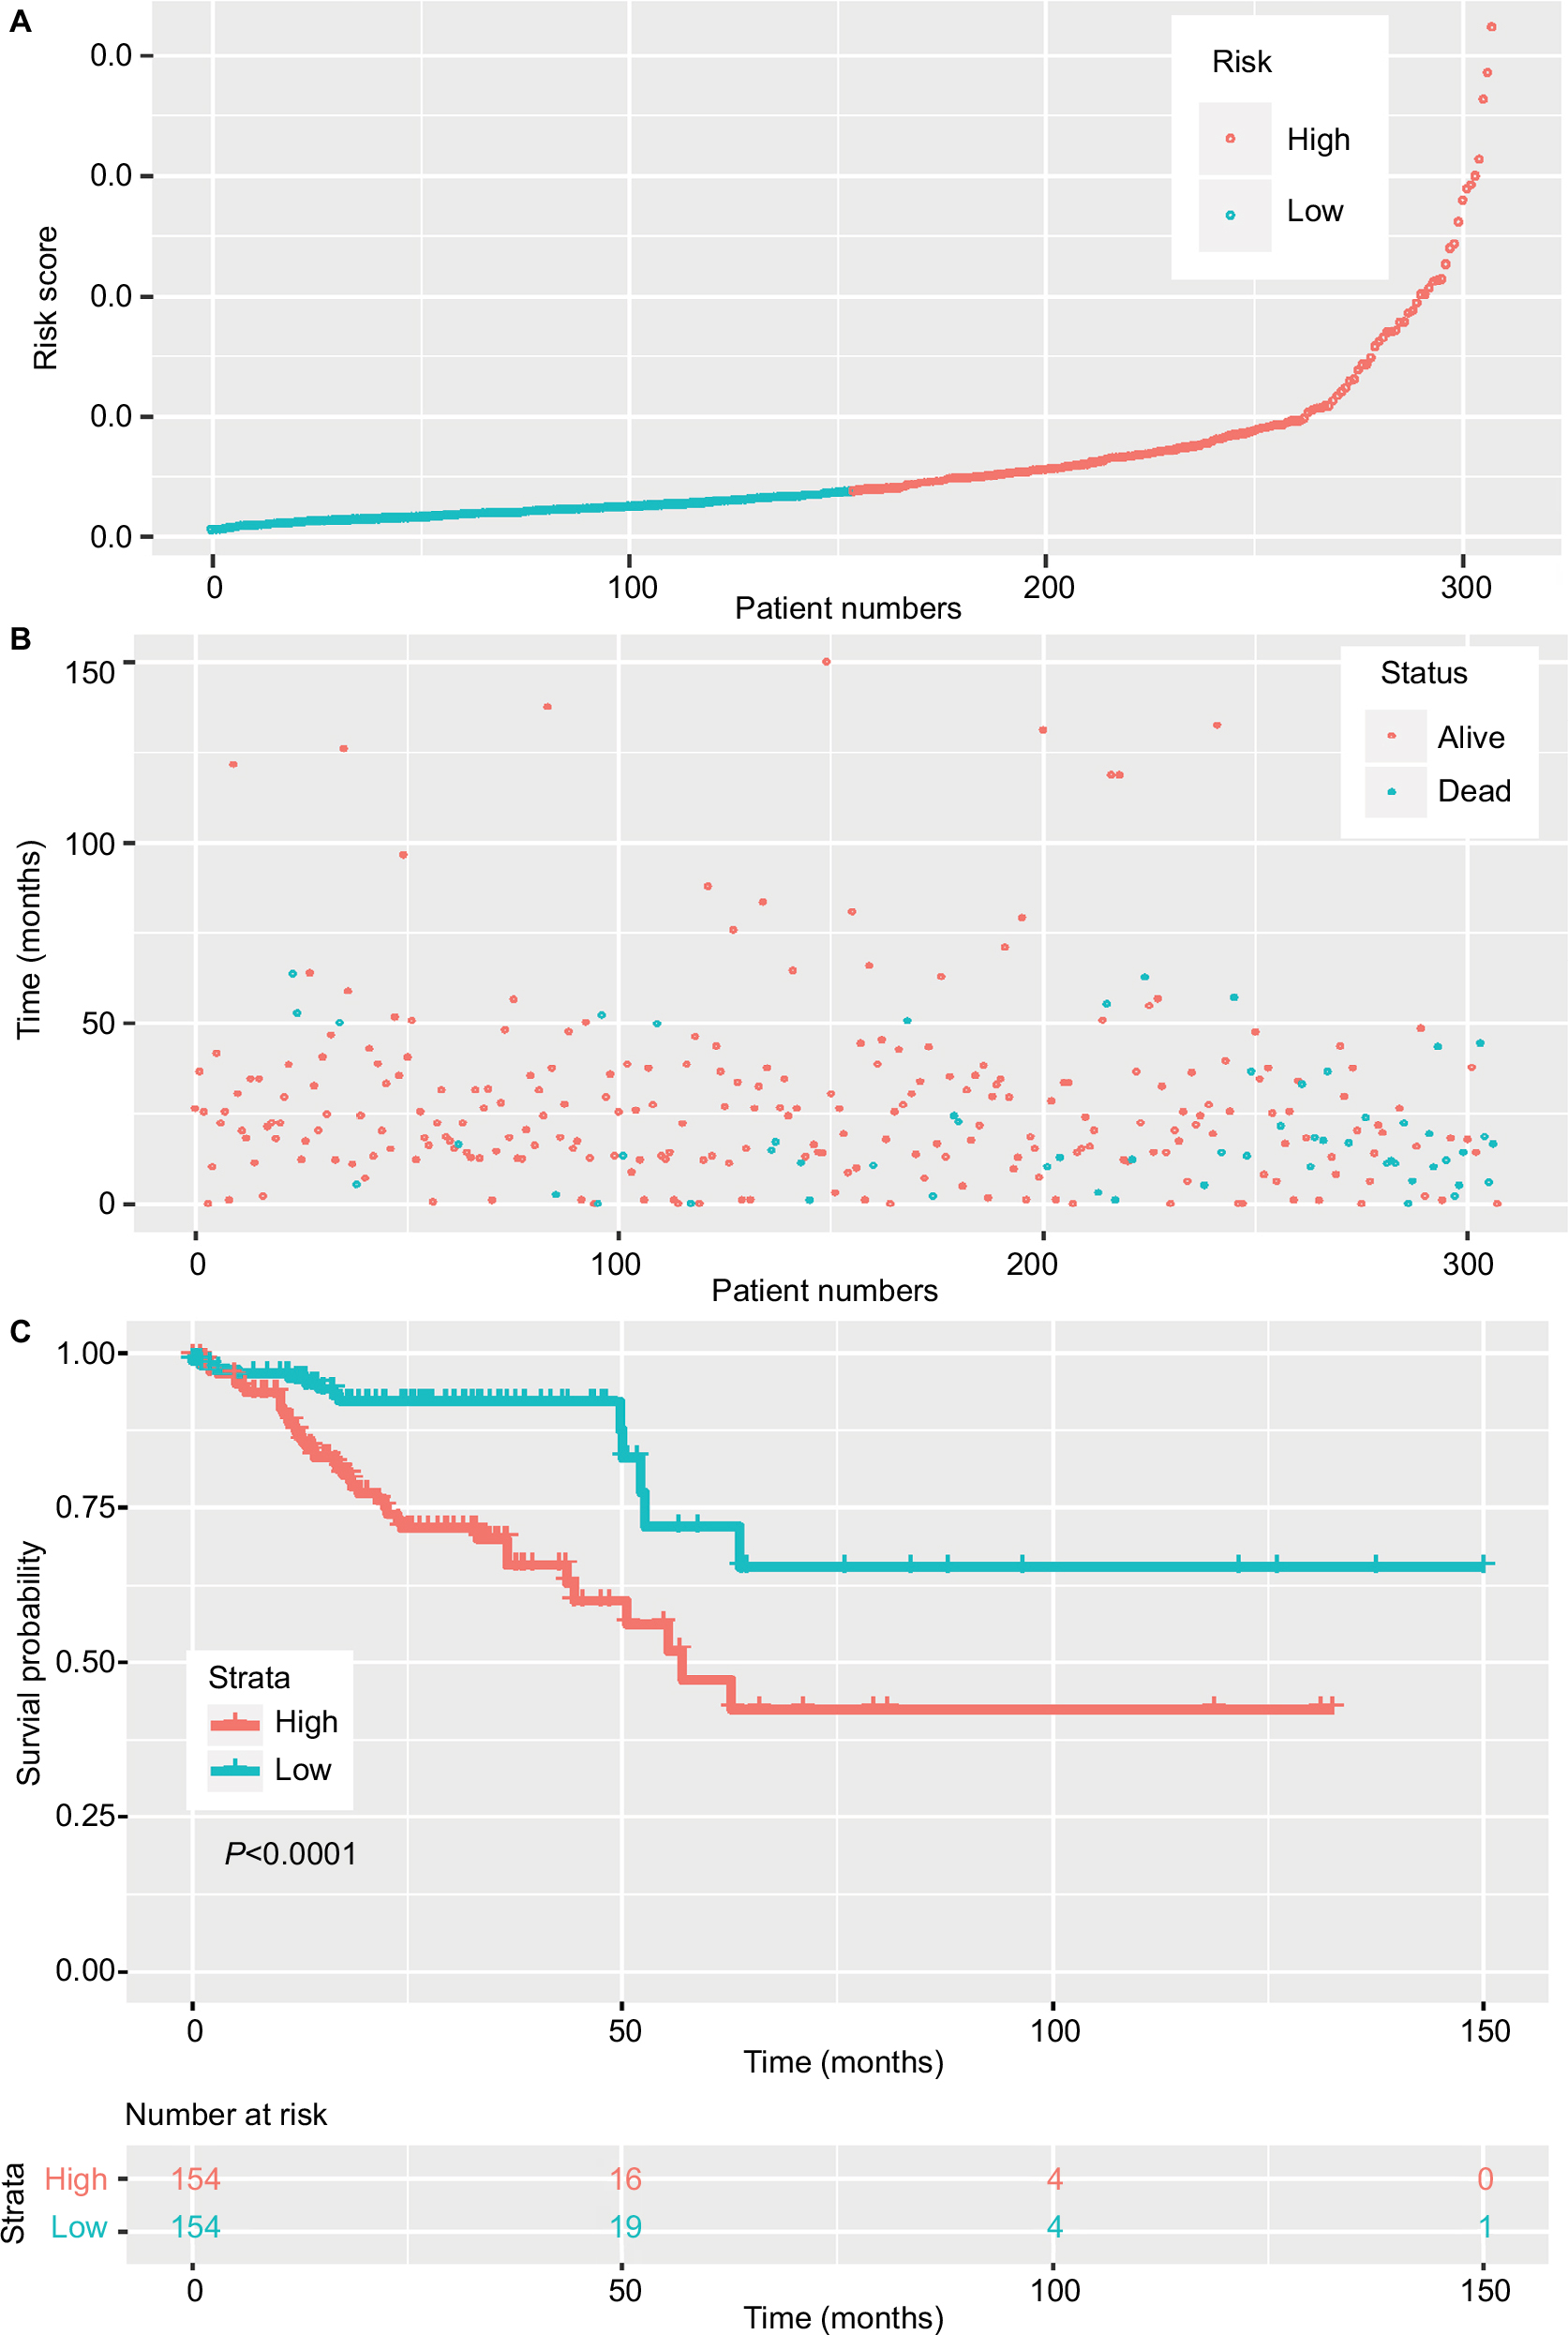 | Figure 2 Risk score of lncRNAs in the training set. Notes: (A) The risk score of patients in the training set based on risk formula. (B) The distribution of patient survival status and survival time. (C) Survival curve of the low-risk and high-risk groups based on median risk score using the Kaplan–Meier method. |
Validation of the prognostic value of the lncRNAs
To assess prognostic value, ROC was conducted for the 15-lncRNA signature (Figure 3A). For our analysis, the area under curve was 0.708. 2.027 was chosen as the best optimal cutoff, taking into account the maximal sensitivity and specificity of our survival prediction. Patients from the data sets (total set and validating set) were further divided into high-risk or low-risk groups. Figure 3B and 3C shows the Kaplan–Meier survival curves for the testing set and the total set, respectively, where the results were all consistent with our model.
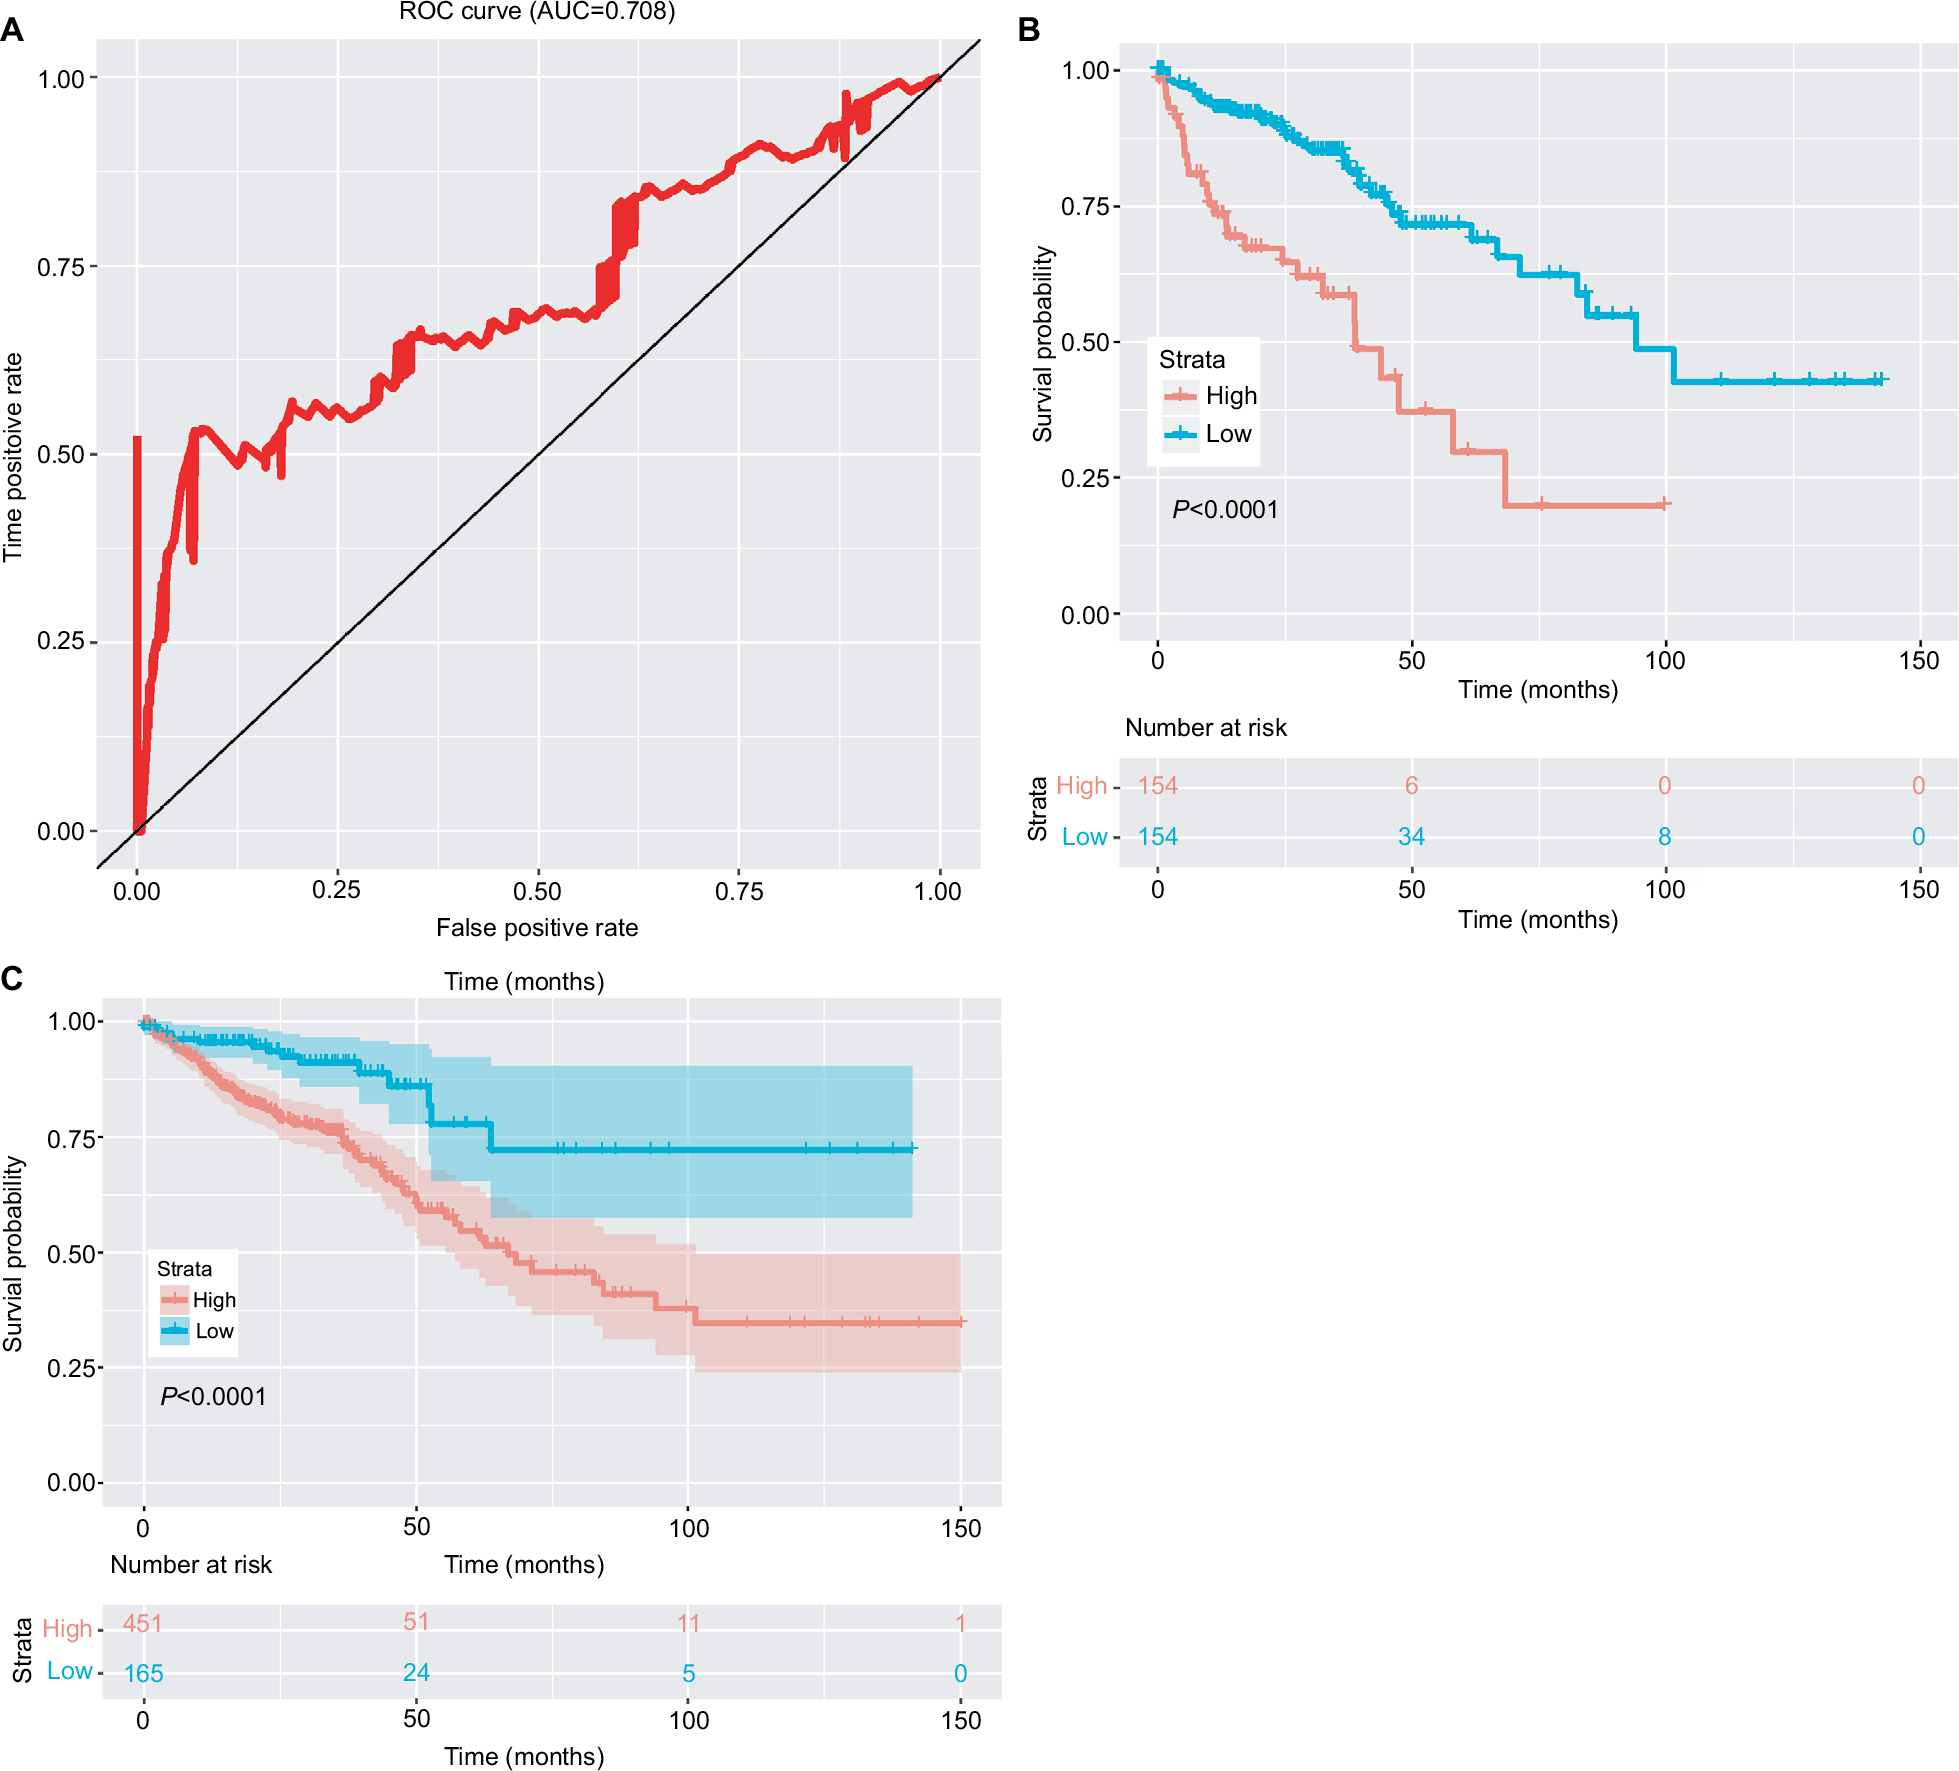 | Figure 3 Clinical significance of the 15-lncRNA signature. Notes: (A) The ROC curve of the 15 lncRNA model. (B) The survival curve of the low-risk and high-risk groups based on the optimal cutoff in the testing set. (C) The survival curve of the low-risk and high-risk groups based on the optimal cutoff in the complete set. Abbreviations: AUC, area under curve; ROC, receiver operating characteristic curve. |
Determination of lncRNA function
The 15 lncRNAs identified in our study were inputted into the miRDB database to predict their miRNA targets (yielding a total of 222 miRNAs), and the coding genes for these miRNAs were then predicted (yielding 1,179 genes). Figure 4A shows an overview of the triple ceRNA (lncRNA–miRNA–mRNA) network. The detailed interactions of the ceRNA network are shown in Table S3. The functional enrichment assay identified 691 GO terms in BP, 46 GO terms in cellular components, 81 GO terms in molecular function (Table S4), and 46 pathways (Table S5). It also showed that these genes are involved in multiple BP, such as regulation of cell morphogenesis, and Wnt-mediated cell signaling. The top ten GO results are shown in Figure 4B. The top 20 KEGG pathways are shown in Figure 4C. KEGG was enriched in several cancer-related pathways, including the p53 and Wnt signaling pathways. lncRNA AC012531.1 was not only related to the mTOR signal pathway by regulating hsa-mir-424-5p, and hsa-mir-16-5p, hsa-mir-410-3p, which targeted ATK3, SEH1L, and GSK3B, respectively, but also took part in the MAPK signal pathway. lncRNA LINC01354 participated in the TP53 signal pathway by hsa-mir-107 and hsa-mir-497-5 p, which regulated CDK6 and CCNE1, respectively. lncRNA LINC02257, indirectly regulating ROCK2 through hsa-mir-138-5p, played an important role in the Wnt signal pathway. lncRNA AC079612.1 interacted with hsa-mir-760 targeting PPIP5K1 to involve in the phosphatidylinositol signal. Furthermore, these four lncRNAs were also involved in other pathways. However, the rest of the lncRNAs in this study have not been found involved in pathways through interaction with miRNAs.
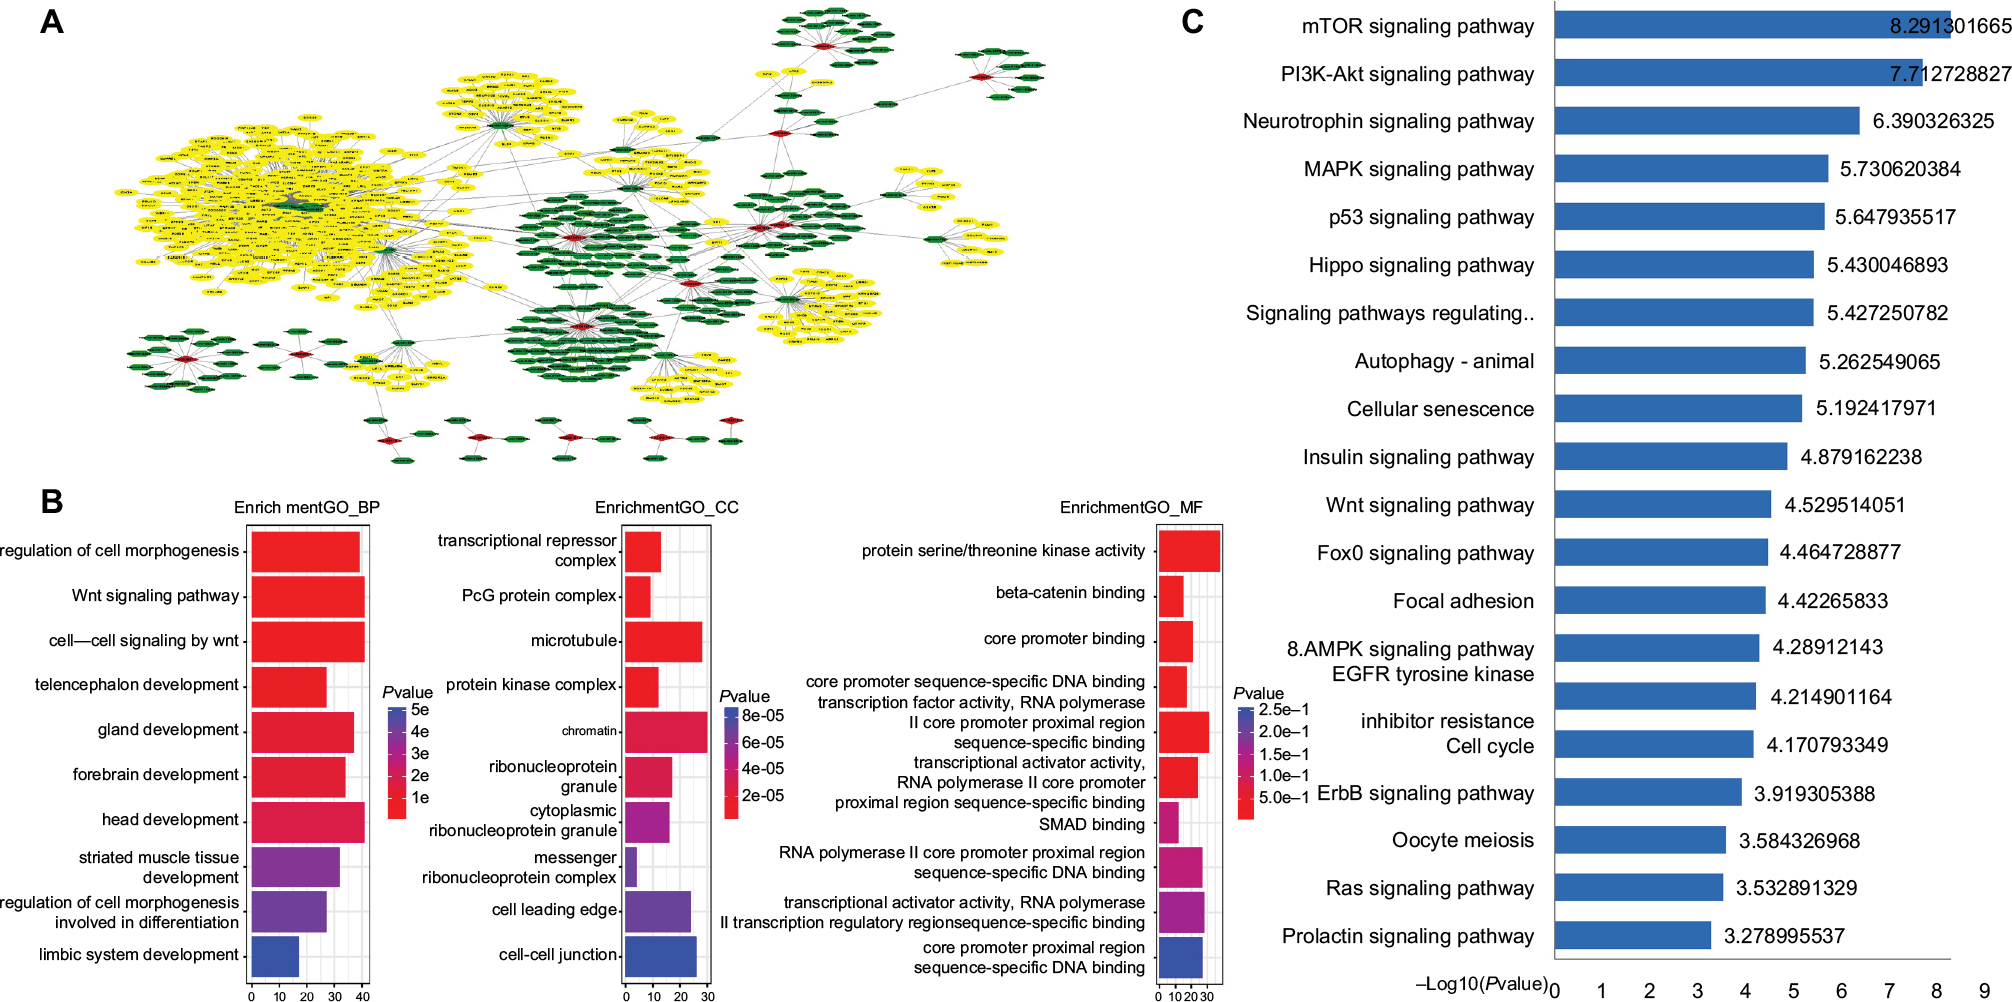 | Figure 4 ceRNA network of 15 lncRNAs. Notes: (A) The overall ceRNA network of 15 lncRNAs. The red rhombus refers to lncRNA. Green sexangle refers to miRNA. Yellow sexangle refers to mRNA. (B) Top ten GO enrichment results. (C) Top 20 KEGG pathways. Abbreviations: GO, gene ontology; KEGG, Kyoto Encyclopedia of Genes and Genomes. |
Discussion
Recently, much attention has been given to the clinical significance of lncRNAs, which account for the majority of transcriptional products in the cell.25,26 Many lncRNAs have tissue-specific expression patterns and play crucial roles in the progression of diseases,27 such as gastric cancer28 and breast cancer.29
Those lncRNAs expressed in CRC were comprehensively analyzed, and 1,103 differentially expressed lncRNAs were identified. Then, 80 lncRNAs that were correlated with the overall survival of patients with CRC were selected using the univariate Cox regression model. The robust likelihood-based survival model was then applied, and the 20 lncRNAs with the lowest P-value selected to identify a 15-lncRNA signature that predicts the 5-year overall survival of patients with CRC. This model showed excellent performance and consistency throughout the training set, testing set, and total set. These results imply that the 15-lncRNA signature identified in our study may be used as a biomarker to predict patient prognosis in clinical practice. A literature search in PubMed and Google Scholar indicates this is the first time these 15 lncRNAs are reported to be correlated with CRC.
Previous studies have shown that there is signaling “crosstalk” between different transcriptional products.30,31 Many cancer-related phenotypes are driven by lncRNAs,25 either directly or indirectly, by modulating the stability of various molecules, including DNA, proteins, and miRNAs. The hypothesis of ceRNA is that transcriptional products that share common MREs with target genes communicate with different genes through miRNAs.7 Furthermore, any transcriptional product that has MREs can act as a ceRNA. These transcriptional products, which share common MREs, including lncRNAs, circular RNAs, and pseudogenes, regulate corresponding genes through miRNAs that function in RNA posttranscriptional silencing by binding the 3’-untranslated region to influence transcript stability. Thus, lncRNAs may act as ceRNAs to indirectly regulate coding genes through miRNAs. It is therefore necessary to explore the role of lncRNAs as ceRNAs.
In this study, a triple ceRNA (lncRNA–miRNA–mRNA) network was constructed. Bioinformatics analyses of this ceRNA network revealed that 15 lncRNAs may function as ceRNAs to regulate genes that participate in cancer-associated signaling, including p53 and Wnt signaling.32 Furthermore, this ceRNA network may be involved in other types of cancer because KEGG analysis results of ceRNA showed this network was associated with many cancer-related pathways. For example, the TP53 signaling pathway participates in multiple tumor genesis.33–35
Taken together, these results suggest that 15 differentially expressed lncRNAs play an important role in oncogenesis and may be used as a prognostic biomarker in clinical practice. However, there were still some limits to our study. Our results are based on a bioinformatics analysis and were validated using in vitro or in vivo experimentation. In addition, as the binding affinity between miRNAs and their RNA targets is influenced by the matching between MRE and the seeds regions (as well as other factors), we could not adequately assess the exact function of each ceRNA. Future studies will assess the biological functions of these lncRNAs by measuring their effects on cell proliferation and apoptosis and will further evaluate these lncRNAs as prognostic biomarkers.
Conclusion
In summary, we identified 1,103 lncRNAs that were differentially expressed in CRC.
A 15-lncRNAs’ risk formula was developed that correlated with the overall survival of patients with CRC using a robust likelihood-based survival model, and the function of these newly identified survival-associated lncRNAs was explored. Our results justify further study of the transcriptional regulatory network of lncRNAs in CRC and provide a new resource to discover novel prognostic biomarkers.
Acknowledgments
We thank everyone who supported this study. We also thank Dr Yuan Tang for giving us important advice pertaining to this article.
Disclosure
The authors report no conflicts of interest in this work.
References
Brenner H, Kloor M, Pox CP. Colorectal cancer. Lancet. 2014;383(9927):1490–1502. | ||
Cancer Genome Atlas Network. Comprehensive molecular characterization of human colon and rectal cancer. Nature. 2012;487(7407):330–337. | ||
Wood LD, Parsons DW, Jones S, et al. The genomic landscapes of human breast and colorectal cancers. Science. 2007;318(5853):1108–1113. | ||
Batista PJ, Chang HY. Long noncoding RNAs: cellular address codes in development and disease. Cell. 2013;152(6):1298–1307. | ||
Beermann J, Piccoli MT, Viereck J, Thum T. Non-coding RNAs in development and disease: background, mechanisms, and therapeutic approaches. Physiol Rev. 2016;96(4):1297–1325. | ||
Liang WC, Fu WM, Wong CW, et al. The lncRNA H19 promotes epithelial to mesenchymal transition by functioning as miRNA sponges in colorectal cancer. Oncotarget. 2015;6(26):22513–22525. | ||
Salmena L, Poliseno L, Tay Y, Kats L, Pandolfi PP. A ceRNA hypothesis: the Rosetta Stone of a hidden RNA language? Cell. 2011;146(3):353–358. | ||
Aken BL, Ayling S, Barrell D, et al. The Ensembl gene annotation system. Database. 2016;2016:baw093. | ||
Robinson MD, Mccarthy DJ, Smyth GK. edgeR: a Bioconductor package for differential expression analysis of digital gene expression data. Bioinformatics. 2010;26(1):139–140. | ||
Mccarthy DJ, Chen Y, Smyth GK. Differential expression analysis of multifactor RNA-Seq experiments with respect to biological variation. Nucleic Acids Res. 2012;40(10):4288–4297. | ||
Cho HJ, Yu A, Kim S, Kang J. Robust likelihood-based survival modeling with microarray data. J Stat Software. 2008;29(1):1–16. | ||
Therneau TM. A Package for Survival Analysis in S. version 2 .38; 2015:38. Available from: https://CRAN.R-project.org/package=survival. Accessed October 29, 2018. | ||
Therneau TM, Grambsch PM. Modeling survival data: extending the Cox model. Technometrics. 2000;44(1):85–86. | ||
Heagerty PJ, Lumley T, Pepe MS. Time-dependent ROC curves for censored survival data and a diagnostic marker. Biometrics. 2000;56(2):337–344. | ||
Wickham H. ggplot2: Elegant Graphics for Data Analysis. New York, NY: Springer Publishing Company, Incorporated; 2009. | ||
Tang Y, Horikoshi M, Li W. Ggfortify: Unified interface to visualize statistical results of popular r packages. 2016. Available from: https://journal.r-project.org/archive/2016/RJ-2016-060/RJ-2016-060.pdf. Accessed October 16, 2018. | ||
Yuan T. Ggfortify: Data Visualization Tools for Statistical Analysis Results. 2017. Available from: https://rdrr.io/cran/ggfortify/. Accessed October 16, 2018. | ||
Zerbino DR, Achuthan P, Akanni W, et al. Ensembl 2018. Nucleic Acids Res. 2018;46(D1):D754–D761. | ||
Wang X. Improving microRNA target prediction by modeling with unambiguously identified microRNA-target pairs from CLIP-ligation studies. Bioinformatics. 2016;32(9):1316–1322. | ||
Wong N, Wang X. miRDB: an online resource for microRNA target prediction and functional annotations. Nucleic Acids Res. 2015;43(D1):D146–D152. | ||
Chou CH, Chang NW, Shrestha S, et al. miRTarBase 2016: updates to the experimentally validated miRNA-target interactions database. Nucleic Acids Res. 2016;44(D1):D239–D247. | ||
Agarwal V, Bell GW, Nam JW, Bartel DP. Predicting effective microRNA target sites in mammalian mRNAs. Elife. 2015;4. | ||
Shannon P, Markiel A, Ozier O, et al. Cytoscape: a software environment for integrated models of biomolecular interaction networks. Genome Res. 2003;13(11):2498–2504. | ||
Yu G, Wang LG, Han Y, He QY, Qy H. clusterProfiler: an R package for comparing biological themes among gene clusters. OMICS. 2012;16(5):284–287. | ||
Schmitt AM, Chang HY. Long noncoding RNAs in cancer pathways. Cancer Cell. 2016;29(4):452–463. | ||
Lu C, Yang M, Luo F, et al. Prediction of lncRNA-disease associations based on inductive matrix completion. Bioinformatics. 2018;34(19):3357–3364. | ||
Wang Z, Yang B, Zhang M, et al. lncRNA epigenetic landscape analysis identifies EPIC1 as an oncogenic lncRNA that interacts with MYC and promotes cell-cycle progression in cancer. Cancer Cell. 2018;33(4):706–720. | ||
Song YX, Sun JX, Zhao JH, et al. Non-coding RNAs participate in the regulatory network of CLDN4 via ceRNA mediated miRNA evasion. Nat Commun. 2017;8(1):289. | ||
Berger AC, Korkut A, Kanchi RS, et al. A comprehensive pan-cancer molecular study of gynecologic and breast cancers. Cancer Cell. 2018;33(4):690–705. | ||
Li MJ, Zhang J, Liang Q, et al. Exploring genetic associations with ceRNA regulation in the human genome. Nucleic Acids Res. 2017;45(10):5653–5665. | ||
Karreth FA, Pandolfi PP. ceRNA cross-talk in cancer: when ce-bling rivalries go awry. Cancer Discov. 2013;3(10):1113–1121. | ||
Carethers JM, Jung BH. Genetics and genetic biomarkers in sporadic colorectal cancer. Gastroenterology. 2015;149(5):1177–1190e1173. | ||
Bykov VJN, Eriksson SE, Bianchi J, Wiman KG. Targeting mutant p53 for efficient cancer therapy. Nat Rev Cancer. 2018;18(2):89–102. | ||
Kastenhuber ER, Lowe SW. Putting p53 in context. Cell. 2017;170(6):1062–1078. | ||
Zucman-Rossi J, Villanueva A, Nault JC, Llovet JM. Genetic landscape and biomarkers of hepatocellular carcinoma. Gastroenterology. 2015;149(5):1226–1239.e4. |
 © 2018 The Author(s). This work is published and licensed by Dove Medical Press Limited. The full terms of this license are available at https://www.dovepress.com/terms.php and incorporate the Creative Commons Attribution - Non Commercial (unported, v3.0) License.
By accessing the work you hereby accept the Terms. Non-commercial uses of the work are permitted without any further permission from Dove Medical Press Limited, provided the work is properly attributed. For permission for commercial use of this work, please see paragraphs 4.2 and 5 of our Terms.
© 2018 The Author(s). This work is published and licensed by Dove Medical Press Limited. The full terms of this license are available at https://www.dovepress.com/terms.php and incorporate the Creative Commons Attribution - Non Commercial (unported, v3.0) License.
By accessing the work you hereby accept the Terms. Non-commercial uses of the work are permitted without any further permission from Dove Medical Press Limited, provided the work is properly attributed. For permission for commercial use of this work, please see paragraphs 4.2 and 5 of our Terms.