")
Back to Journals » International Journal of Nanomedicine » Volume 16
99mTc-Radiolabeled Silica Nanocarriers for Targeted Detection and Treatment of HER2-Positive Breast Cancer
Authors Rainone P , De Palma A, Sudati F, Roffia V, Rigamonti V, Salvioni L , Colombo M , Ripamonti M, Spinelli AE , Mazza D, Mauri P , Moresco RM, Prosperi D , Belloli S
Received 13 August 2020
Accepted for publication 24 October 2020
Published 8 March 2021 Volume 2021:16 Pages 1943—1960
DOI https://doi.org/10.2147/IJN.S276033
Checked for plagiarism Yes
Review by Single anonymous peer review
Peer reviewer comments 2
Editor who approved publication: Dr Thomas Webster
Paolo Rainone,1– 3 Antonella De Palma,4 Francesco Sudati,5 Valentina Roffia,4 Valentina Rigamonti,6 Lucia Salvioni,6 Miriam Colombo,6 Marilena Ripamonti,2 Antonello Enrico Spinelli,7 Davide Mazza,7 Pierluigi Mauri,4 Rosa Maria Moresco,1,2,7 Davide Prosperi,6 Sara Belloli2,7
1Department of Medicine and Surgery, University of Milano-Bicocca, Monza, 20900, Italy; 2Institute of Molecular Bioimaging and Physiology of CNR, Segrate, 20090, Italy; 3Doctorate School of Molecular and Translational Medicine, University of Milan, Milan, Italy; 4Institute of Biomedical Technologies of CNR, Segrate, 20090, Italy; 5PET and Nuclear Medicine Unit, San Raffaele Scientific Institute, Milan, 20132, Italy; 6NanoBioLab, Department of Biotechnology and Biosciences, University of Milano-Bicocca, Milan, 20126, Italy; 7Experimental Imaging Center, San Raffaele Scientific Institute, Milan, 20132, Italy
Correspondence: Sara Belloli
Institute of Molecular Bioimaging and Physiology of CNR, Via Fratelli Cervi 93, Segrate, 20090, Italy
Tel +39 02 26433640
Fax +39 02 26432717
Email [email protected]
Introduction: The overexpression of Human Epidermal Growth Factor Receptor 2 (HER2) is usually associated with aggressive and infiltrating breast cancer (BC) phenotype, and metastases. Functionalized silica-based nanocarriers (SiNPs) can be labeled for in vivo imaging applications and loaded with chemotherapy drugs, making possible the simultaneous noninvasive diagnosis and treatment (theranostic) for HER2-positive BC.
Methods: Firstly, FITC-filled SiNPs, were engineered with two different amounts of Hc-TZ (trastuzumab half-chain) per single nanoparticle (1:2 and 1:8, SiNPs to Hc-TZ ratio), which was 99mTc-radiolabeled at histidine residues for ex vivo and in vivo biodistribution evaluations. Secondly, nanoparticles were loaded with DOX and their in vitro and ex vivo/in vivo delivery was assessed, in comparison with liposomal Doxorubicin (Caelyx). Finally, the treatment efficacy of DOX-SiNPs-TZ (1:8 Hc-TZ) was evaluated in vivo by PET and supported by MS-based proteomics profiling of tumors.
Results: SiNPs-TZ (1:8 Hc-TZ) tumor uptake was significantly greater than that of SiNPs-TZ (1:2 Hc-TZ) at 6 hours post-injection (p.i.) in ex vivo biodistribution experiment. At 24 h p.i., radioactivity values remained steady. Fluorescence microscopy, confirmed the presence of radiolabeled SiNPs-TZ (1:8 Hc-TZ) within tumor even at later times. SiNPs-TZ (1:8 Hc-TZ) nanoparticles loaded with Doxorubicin (DOX-SiNPs-TZ) showed a similar DOX delivery capability than Caelyx (at 6 h p.i.), in in vitro and ex vivo assays. Nevertheless, at the end of treatment, tumor volume was significantly reduced by DOX-SiNPs-TZ (1:8 Hc-TZ), compared to Caelyx and DOX-SiNPs treatment. Proteomics study identified 88 high stringent differentially expressed proteins comparing the three treatment groups with controls.
Conclusion: These findings demonstrated a promising detection specificity and treatment efficacy for our system (SiNPs-TZ, 1:8 Hc-TZ), encouraging its potential use as a new theranostic agent for HER2-positive BC lesions. In addition, proteomic profile confirmed that a set of proteins, related to tumor aggressiveness, were positively affected by targeted nanoparticles.
Keywords: HER2-positive BC, targeted silica nanoparticles, TZ-half chain conjugation, 99mTc-radiolabeling, SPECT imaging, doxorubicin-loaded nanoparticles
Introduction
Breast cancer (BC) is the second leading cause of mortality for tumor after lung cancer,1 and it has long been the predominant reason of cancer death among women.2 The phenotypic/genotypic heterogeneity of neoplastic populations within a patient’s tumor, and among different patients, are features that can complicate diagnosis and treatment setting. Several histopathological biomarkers, such as receptors expression (estrogen-receptor, progesterone-receptor and/or HER2), contribute to diagnostic classification.3,4 Treatment planning, prognosis and responses to therapy reflect these expression profiles.5 It is well known that HER2 gene is amplified in about 30% of BC patients, and it is associated with aggressive phenotype and poorer clinical outcomes,6 making HER2 a relevant target for both diagnosis and therapy. Nowadays, the anti-HER2 monoclonal antibodies administration, such as trastuzumab (TZ), in combination with liposomal Doxorubicin (Caelyx) is considered the first-line treatment of metastatic/recurrent HER2-positive (HER2+) BC.7 Despite its efficacy, about 70% of HER2+ BC patients demonstrate resistance and systemic toxicity to this therapy setting,8 stressing the relevance of developing new effective and safe therapeutic strategies. The new drug TZ-emtansine (T-DM1), an antibody cytotoxic drug conjugated, has improved overall survival in patients with HER2+ metastatic BC, who were previously treated with TZ and Caelyx.9 In 2013, FDA first approved T-DM1 as monotherapy for the treatment of patients with HER2+ advanced BC, who had previously received TZ and taxane.9 The safety and efficacy of this novel agent in the BC setting, and its deficiency in the treatment of metastatic HER2+ BC, has been further assessed recently confirming some limitations.10,11 Nevertheless, to get advantages by TZ based therapies the HER2 expression evaluation remains crucial. Currently, BC diagnosis and screening are usually performed by anatomical or molecular in vivo diagnostic techniques, whereas tumor phenotype is evaluated through ex vivo immunohistochemical analysis of biopsy specimens from primary lesion or regional lymph nodes.12 Staging and searching for metastases is only carried out in symptomatic patients, or in those at high risk for relapse.13 The prevalence of metastasis in asymptomatic patients is high in large tumors or in patients with extensive nodal disease.14 Routine staging and restaging consist of chest radiography, abdominal ultrasound, and bone scan, but only the latter technique owns good sensitivity, although it has showed low specificity and it is easy to cause false positives.15
New advances in molecular imaging techniques as Positron Emission Tomography (PET) and Single Photon Emission Computed Tomography (SPECT),16 have progressed improving their accuracy for the identification of specific tumor biomarkers, such as HER2, in the different districts, discriminating pathological changing in non-invasive way.17 Hence, these techniques might provide the HER2 expression assessment in primary and secondary lesions, in particular when it is not achievable by biopsy.18,19 Related to this, new advances in Nanomedicine have led to the development of nanoparticles (NPs) for the simultaneous diagnosis and treatment of human cancer (theranostic), offering the possibility to improve the efficiency and safety of conventional anticancer treatments and allowing a tailored care of patient.20 Nanotechnologies in Nuclear Medicine are offering innovative radiolabeled probes, which are able to host various functionalities in order to improve specificity and sensitivity versus the target, with multi-labeling chance for multimodal imaging techniques.21 Moreover, targeted NPs are a powerful drug delivery systems, since they can enhance the efficacy of chemotherapeutic agent or radionuclides by improving its targeting to tumor cells overexpressing antigens such as HER2,22 while reducing the toxicity in healthy tissues.23 In our studies, we explored the use of multifunctional 99mTc-labeled silica nanoparticles (SiNPs) for early in vivo detection and treatment of HER2-positive BC lesions. In order to improve the tumor targeting, spherical SiNPs (hydrodynamic diameter ≈ 70–80 nm) were engineered with the half-chain of TZ monoclonal antibody (Hc-TZ).24 In a previous work,25 we assessed the contribution offered by the Hc-TZ active targeting to the distribution of SiNPs-TZ in HER2+ BC cells and tumor lesions, compared to non-specifically targeted nanoparticles SiNPs (without Hc-TZ), before and after radiolabeling. For this reason, both nanoparticle species were radiolabeled at NTA (nitrilotriacetic acid) linker, previously conjugated on the nanoparticles’ shell. Our findings showed a remarkable tumor concentration of targeted 99mTc-SiNPs-(NTA)-TZ nanoparticles, at 4 h post-injection, compared to untargeted 99mTc-SiNPs-(NTA), with a rapid drop thereafter. This trend suggested the involvement of an active targeting mediated by Hc-TZ, followed by lysosomal degradation and a consequent rapid washout of 99mTc-radiolabeled nanoparticles shell.
In the present study, the potential use of SiNPs-TZ as a theranostic agent has been further explored, by radiolabeling the nanoparticles directly on the histidine residues of the Hc-TZ. The preclinical evaluation of SiNPs-TZ has been completed performing in vivo treatment efficacy tests by Doxorubicin loaded silica nanoparticles (DOX-SiNPs-TZ), in comparison with liposomal Doxorubicin (Caelyx). In addition, the effect of different Hc-TZ amounts per single nanoparticle (1:2 and 1:8, SiNPs to Hc-TZ ratio) on biodistribution kinetics has been evaluated.
Materials and Methods
Synthesis and Characterization of FITC-Loaded Nanoparticles SiNPs-TZ, Functionalized with Different Amounts of Hc-TZ per Single Nanoparticle (1:2 and 1:8, SiNPs to Hc-TZ Ratio)
SiNPs-TZ were initially filled with the fluoresceine isothiocyanate (FITC) dye, as illustrated in Figure 1, to allow their ex vivo detection also by fluorescence microscopy. The synthesis and characterization protocols of SiNPs-TZ functionalized with an amount of about eight Hc-TZ per single nanoparticle (1:8, SiNPs to Hc-TZ ratio) were performed according to the methods previously described by our group in the manuscript Rainone et al (2017).25 In order to reduce the number to about two Hc-TZ per single nanoparticle (1:2, SiNPs to Hc-TZ ratio), during the synthesis of SiNPs-TZ (1:2 Hc-TZ) the reaction protocols were developed using a quarter of Hc-TZ dose, compared to that employed for SiNPs-TZ (1:8 Hc-TZ) synthesis. For additional information about the synthesis and characterization, see the Supporting Information (SI).
 |
Figure 1 Illustration of targeted (Hc-TZ) spherical silica nanoparticles 99mTc-SiNPs-TZ (hydrodynamic diameter ≈ 70–80 nm). Nanoparticles silica shell (grey) was FITC (yellow) filled and the 99mTc-radiolabeling procedure was performed directly on the histidine residues exposed on the half-chain of TZ antibody (Hc-TZ). |
Radiolabeling of SiNPs-TZ (1:2 and 1:8, SiNPs to Hc-TZ Ratio)
Preparation of (99mTc[CO]3)+
The preparation of (99mTc[CO]3)+ was performed according to the methods previously described by our group in the manuscript Rainone et al (2017).25 The radiochemical purity (RCP) of the product was analyzed by high performance liquid chromatography (HPLC), and RPC resulted greater than 95%.
Conjugation of (99mTc[CO]3)+ Directly on Nanoparticles Hc-TZ (1:2, SiNPs to Hc-TZ Ratio) by Histidine Residues
The [99mTc(H2O)3(CO)3]+ precursor solution was added to 500 µL of SiNPs-TZ solution [6.7 mg/mL] (suspended in Hepes buffer 20mM, pH 7.4). The solution mixture was incubated at RT under stirring for 2.5 h, and then the RCP was checked. The solution was shaken for about 1 min on a vortex mixer and then centrifuged for 15 min at 18,000 rpm; the pellet was washed with Hepes buffer and centrifuged three times in the same conditions. After the radioactivity measurement of total supernatant and pellet, the RCP was 24.6%.
Conjugation of (99mTc[CO]3)+ Directly on Nanoparticles Hc-TZ (1:8, SiNPs to Hc-TZ Ratio)
The [99mTc(H2O)3(CO)3]+ precursor solution was added to 500 µL of SiNPs-TZ solution [8.6 mg/mL] (suspended in Hepes buffer 20mM, pH 7.4). The radiolabeling procedure was performed as described in the previous section, then the RCP was checked as described above and it was 19.8%.
Synthesis and Characterization of Doxorubicin Externally Loaded Nanoparticles SiNPs and SiNPs-TZ (1:8, SiNPs to Hc-TZ Ratio)
For Doxorubicin externally loaded nanoparticles SiNPs and SiNPs-TZ (Figure 2), the synthesis and characterization protocols were performed according to the method used in a recent study by Riva et al (2018).26 In order to obtain the selected amount of Hc-TZ conjugated on nanoparticles’ shell (1:8 Hc-TZ), the reaction protocol was developed as previously described for FITC loaded nanoparticles SiNPs-TZ (1:8 Hc-TZ). For additional information about the synthesis and characterization, see the SI.
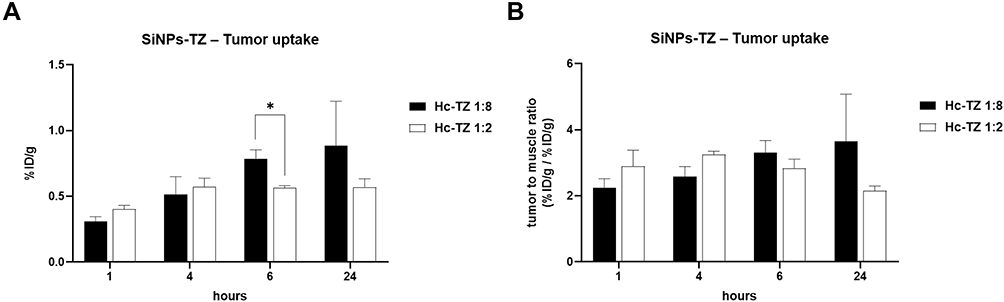 |
Figure 2 Ex vivo tumor distribution of 99mTc-labeled SiNPs-TZ (1:2 Hc-TZ) and SiNPs-TZ (1:8 Hc-TZ) nanoparticles, in SK-BR-3 tumor bearing mice. The uptake values are expressed as (A) percent of injected dose per gram of tissue (%ID/g) and (B) as tumor to muscle ratio of %ID/g. Mean values calculated per group ± SEM, (Student’s t-test; *p < 0.05 vs 1:2 Hc-TZ). |
Cell Culture
The uptake of silica nanoparticles was tested in SK-BR-3 (HER2+) and MDA-MB-468 (HER2–) cell lines (American Type Culture Collection [ATCC], Manassas, VA, USA). MCF-10A (ATCC) were used as control cells for confocal microscopy assay. All the materials and procedures employed to realize in vitro and in vivo ad hoc models were described in detail in our previous work, Rainone et al (2017).25
Animal Model
Balb/c nude female mice of 7–8 weeks of age were purchased from the ENVIGO RMS S.r.l. (Italy) and subcutaneously injected under the right shoulder with 5×10⁶ of SK-BR-3 cells suspended in serum-free medium/matrigel 1:1. All the animal experiments were in line with the IRCCS San Raffaele Institute guidelines (Regolamento Stabulario DIBIT, rev. 14, Milan, Italy). Each procedure has been performed in accordance to the European Directive 2010/63/EU and with the Italian regulation D.L. 26/2014. Animals’ protocol has been notified and approved by the Italian Ministry of Health (approval number 10/2016-PR) and the Ethics Committee of the IRCCS San Raffaele Scientific Institute (IACUC).
Ex vivo Biodistribution Study of 99mTc-SiNPs-TZ (1:2 and 1:8, SiNPs to Hc-TZ Ratio)
99mTc-labeled SiNPs were evaluated on HER2+ tumor xenograft model. Mice were anaesthetized with a mixture of 4% isoflurane in air, and subdivided into two experimental groups. The first group (17 mice) was injected in a tail vein with 100 µL of a solution containing 99mTc-SiNPs-TZ (1:8 Hc-TZ), and the second group (15 mice) with the 99mTc-SiNPs-TZ (1:2 Hc-TZ) solution (37 MBq/mL, pH~7.4). Additional aliquot (0.1 mL) of both radioactive solution was diluted 1:10, 1:100 and 1:1000 and used to calculate the standard curve. For the 99mTc-SiNPs-TZ (1:8 Hc-TZ) group, n. 3, 6, 5 and 3 animals were sacrificed at 1, 4, 6 and 24 h post-injection, respectively. For the 99mTc-SiNPs-TZ (1:2 Hc-TZ) group, n. 3, 5, 3 and 4 animals were sacrificed at 1, 4, 6 and 24 h post-injection, respectively. Animals were euthanized by cervical dislocation. Tumor and muscle samples were removed and placed in pre-weighted tube for counting by a γ-counter (LKB Compugamma CS 1282). The radioactivity concentration in tumor was calculated as percentage of injected dose per gram of tissue (%ID/g) and also expressed as tumor to muscle ratio.
Ex vivo Fluorescence Microscopy of 99mTc-SiNPs-TZ (1:8, SiNPs to Hc-TZ Ratio)
After biodistribution study, tumor samples from injected mice with FITC-filled 99mTc-SiNPs-TZ (1:8 Hc-TZ) were fixed with 4% paraformaldehyde overnight, and then embedded in optimal cutting temperature compound (OCT, Sakura Finetek, Torrance, CA, USA), to prepare frozen sections (20 µm). For nuclei staining, tumor sections (20 µm) were rinsed with PBS, and incubated with 4-6-diamidino-2-phenylindole (DAPI) for 5 min. Finally, sections were sealed with anti-fluorescence quenching agent (Beyotime), and acquired by fluorescence microscopy (Nikon Eclipse 80i).
In vivo SPECT Study of 99mTc-SiNPs-TZ (1:8, SiNPs to Hc-TZ Ratio)
SPECT study were performed with a YAP-(S)-PET II small animal scanner (ISE S.r.l., Pisa, Italy).27 A high resolution collimator with parallel holes has been placed in front of the four crystal detectors for SPECT modality acquisition. A female Balb/c nude mouse was anaesthetized with a mixture of 4% isoflurane in air, and was injected intravenously with 6.5 MBq of radiolabeled 99mTc-SiNPs-TZ (1:8 Hc-TZ). After 1, 4 and 24 hours of radiolabeled nanoparticles injection, the mouse was positioned prone on the PET/SPECT scanner bed with the tumor centred in the field of view (FOV). The animal was acquired for 30 minutes (six scans of 5 minutes) in list mode. Data were reconstructed, calibrated with a dedicated phantom and corrected for the radionuclide half-life decay.
In vitro Evaluation of Doxorubicin Delivery by Confocal Microscopy
DOX subcellular distribution was evaluated on SK-BR-3 (HER2+ BC) and MCF-10A (HER2‒, non-transformed mammary epithelial) cells by confocal microscopy. SK-BR-3 and MCF-10A cells (5×10⁴) were grown on glass coverslips and were incubated with DOX-SiNPs or DOX-SiNPs-TZ (1:8 Hc-TZ) nanoparticles, dispersed in cell culture media (at DOX concentration of 1 μM), at 37 °C (humidified atmosphere, 5% CO2 air). After 1 h incubation, the cells were washed with PBS solution twice and fixed using 4% (wt/vol) formaldehyde solution for 15 min, followed by the treatment with antifade mounting Medium (with DAPI to stain the nucleus) for another 15 min. The subcellular distribution of DOX fluorescence (Ex. 480 nm/Em. 580 nm) was recorded using a Leica laser scanning confocal microscope (TCS SP8 SMD FLIM).
In vivo/ex vivo Evaluation of Doxorubicin Delivery by Optical Imaging
In order to evaluate in vivo DOX biodistribution after the administration of the three DOX loaded particles, HER2+ tumor xenograft mice were randomized when tumor volumes reached an average of 100 mm3 and subdivided into three groups (3 mice per group), each one per a nanoparticles set. After general anesthesia, with a mixture of 4% isoflurane in air, the mice of each group were intravenously injected with 30 µL of a nanoparticle solution containing 60 µg of DOX in different formulations: Caelyx® [2 mg/mL]; DOX-SiNPs [2 mg/mL]; DOX-SiNPs-TZ (1:8 Hc-TZ) [2 mg/mL]. Fluorescent images of each mouse were obtained using an IVIS Spectrum® (Perkin Elmer, Italy) in vivo imaging system at selected time points (1, 4 and 6 h), in order to measure in vivo DOX distribution into the tumor over time. After 6 h, animals were euthanized under general anesthesia and main tissues were carefully excised and acquired for further imaging analysis.
In vivo Treatment Efficacy Evaluation of DOX-SiNPs vs Caelyx
On the basis of the results obtained with OI, we decided to use the same treatment schedule for the three particles. HER2+ tumor xenograft mice were subdivided into four treatment groups (Control: n. 5 mice; DOX-SiNPs: n. 6 mice; Caelyx: n. 10 mice and DOX-SiNPs-TZ: n. 9 mice). Twice weekly the weight and tumor volumes were monitored by digital Caliper. When tumor volumes reached an average of 65–85 mm3 mice were weekly injected i.v. with a dose DOX of 1mg/Kg, loaded in the three nanoparticles formulations, for six weeks of treatment. Control group was injected with vehicle solution (5% glucose solution). Tumor volume was calculated following the formula: [length X (width)2]/2. Tumor regression at the end of treatment was calculated as the percentage reduction in tumor volume from baseline value (measured before starting treatment): (T0-T41)/T0 X 100, where T0 is the tumor volume on day 0 (starting treatment), and T41 is the median tumor volume of the same group on day 41 (end of treatment). Tumor growth inhibition (%TGI) was determined at several time points by the formula: %TGI = [1-(Tt/T0/Ct/C0)]/[1-(C0/Ct)] X 100, where Tt = median tumor volume of treated group on day t, T0 = median tumor volume of treated group on day 0, Ct = median tumor volume of control group on day t and C0 = median tumor volume of control group on day 0. Tumor growth inhibition > 50% is considered meaningful.
Moreover, treatment efficacy was assessed evaluating glucose tumor metabolism. For this, [18F]FDG tumor uptake was monitored by in vivo PET molecular imaging using the scanner YAP-(S)-PET II. For the shifting to PET modality, the four high resolution collimators were removed, maintaining the same setting conditions. Three mice per group of treatment were anaesthetized with a mixture of 4% isoflurane in air, and were injected intravenously with 3.7 MBq of [18F]FDG. After 1 h from the injection, mice were positioned prone on the PET/SPECT scanner bed with the tumour centred in the FOV and acquired for 30 minutes (six scans of 5 minutes). The first PET analysis was performed the day before starting treatment and replicated every three weeks. PET data were acquired in list mode, using the full axial acceptance angle of the scanner (3D mode), and then reconstructed with the Expectation Maximization (EM) algorithm. All images were calibrated with a dedicated phantom, corrected for the radionuclide half-life decay and then quantified with PMOD 2.7 software. Regions of interest (ROIs) were drawn on tumor and muscle for all time points. The radioactivity concentration in tumor was calculated as percentage of injected dose (%ID), and values are expressed as tumor to muscle ratios.
Statistical Analysis
Values are expressed as mean ± SEM. The statistical significance of differences between groups was evaluated with unpaired Student’s t-test. A p-value lower than 0.05 was considered significant.
Proteomic Analysis
Protein Extraction, In-Solution Tryptic Digestion and Purification
Proteomic analysis was performed on tumor samples dissected from the animals that underwent the efficacy study, at the end of treatment regimen. A total of 24 LC-MS/MS runs were performed, representing the four conditions examined (Control, Caelyx, DOX-SiNPs and DOX-SiNPs-TZ) as technical (two analyses for sample) and biological replicates (three animals per condition). Each section of frozen tumor was cold homogenized in 200 µL 0.1 M NH4HCO3 pH 7.9 buffer. To improve the subsequent enzymatic digestion, RapigestTM SF reagent (Waters Co, Milford, MA, USA) was added at 0.2% (w/v) and the obtained suspensions were incubated under stirring at 100°C for 20 minutes. Using SPNTM-Protein assay kit (G-Biosciences, St. Louis, MO, USA) the protein concentration was assayed and the digestion was carried out on 50 ± 0.5 µg proteins of each sample by adding Sequencing Grade Modified Trypsin (Promega Inc., Madison, WI, USA) at an enzyme/substrate ratio of 1:50 (w/w) overnight and at 1:100 (w/w) for further 4 hours at 37°C in 0.1 M NH4HCO3 pH 7.9 buffer with 10% CH3CN. Moreover, the enzymatic digestion was stopped and the RapiGest removed according to the manufacturer instructions.28 Finally, after purification with PierceTM C-18 spin columns (Thermo Fisher Scientific - Pierce Biotechnology, Rockford, Il, USA), the sample mixtures were resuspended in 0.1% formic acid (Sigma-Aldrich Inc., St. Louis, MO, USA).
µLC–MS/MS Conditions
Trypsin-digested samples were analyzed by means of a platform consisting of a micro-liquid chromatographic system coupled with a linear ion trap mass spectrometer. Briefly, the chosen trap-elute configuration allows to first load 4µg of each digested peptide mixture onto a peptide trap (Zorbax 300 SB-C18, 0.3 i.d. x 5 mm, 5 µm, 300 Å; Agilent Technologies, Santa Clara, CA, USA) for concentration and desalting with isocratic pumping 0.1% formic acid in water. Then, the trapped mixture was eluted through a ten port valve switching, on a C-18 column (Biobasic-C18, 0.180 i.d., 100 mm length, 5μm particle size, Thermo Fisher Scientific) for the separation with an acetonitrile gradient (eluent A, 0.1% formic acid in water; eluent B, 0.1% formic acid in acetonitrile) consisting of 5% eluent B for 5 min, followed by 5–40% eluent B for 93 min, 40–95% eluent B for 12 min and 95% eluent B for 7 min. The operative flow rate after split was of 2µL/min. The eluted peptides were directly characterized with a LTQ mass spectrometer equipped with a nano- ESI source (Thermo Fisher Scientific), which operated as previously described.29
Data Processing
The Thermo Scientific Proteome Discoverer software, version 2.1, with Sequest HT algorithm, was used to process all data generated. For the correlation of experimental MS/MS spectra with the theoretical ones obtained by in silico digestion, the Homo Sapiens proteome database (73,660 entries) was downloaded from Uniprot in May 2019 (www.uniprot.org). The filtering criteria adopted were identical to those described by De Palma et al,29 and set to get high identification confidence and a false discovery rate (FDR) of 0.01 based on q-values.30 An in-house tool, MAProMa (Multidimensional Algorithm Protein Map), was employed to elaborate the output data so proteins could be compared and relative abundances evaluated in a label-free mode based of average spectral counts (aSpCs) among the examined conditions (Control, Caelyx, DOX-SiNPs and DOX-SiNPs-TZ).31 In depth, considering the aSpCs and applying a threshold of 0.35 for DAve (Differential Average) and 4 for DCI (Differential Confidence Index) MAProMa indexes,29 it was possible to extract the differentially expressed proteins for the three nanoparticle formulations with respect to the Control. Individual cellular function of the significantly dysregulated proteins was assigned according to the GOA database (http://geneontology.org/) and the UniProt database (http://www.uniprot.org/). The distribution of proteins in the examined conditions with their enrichment and fold change in biological processes and molecular functions was achieved using FunRich (version 3.1.3) (http://www.funrich.org/). This is a functional enrichment analysis tool that allow graphical visualizing the most expressed protein classes using Venn, bar/pie charts and interaction networks.32
Results
Ex vivo Biodistribution of 99mTc-SiNPs-TZ (1:2 and 1:8, SiNPs to Hc-TZ Ratio) in HER2+ Mouse Model
In a recent study,33 the authors demonstrated in HER2-positive breast cancer models that tumor targeting and therapeutic efficacy of spherical nanoparticles can be improved, reducing the number of attached antibodies. Therefore, in order to test whether the reduction of Hc-TZ number, conjugated on nanoparticles shell, could improve their targeting efficiency, FITC-loaded SiNPs were functionalized with different TZ half-chain (Hc-TZ) number per single nanoparticle, to obtain 1:8 (as we did in the previous study)25 or 1:2, SiNPs to Hc-TZ ratio (see Figure 1 for SiNPs-TZ general structure). FITC loading was assessed by UV-Vis spectroscopy (Figure S1), while Hc-TZ conjugation was demonstrated by dot blot analysis (Figure S2). Moreover, Dynamic Light Scattering (DLS) analysis (Table S1) showed no significant differences in the hydrodynamic diameter of the two preparations, suggesting that a different behavior in SiNPs biodistribution should only be caused by the different targeting agent density. After 1 h p.i. of radiolabeled SiNPs-TZ (1:2 Hc-TZ), radioactivity distribution showed a significant increase in spleen, kidney and blood compared to the SiNPs-TZ (1:8 Hc-TZ) values, expressed as %ID/g (Table 1), whereas the distribution at 4 h p.i. did not significantly differ between the two groups. Conversely, at 6 h mice injected with SiNPs-TZ (1:8 Hc-TZ) reported a significant higher tumor uptake (Figure 2A) in comparison with SiNPs-TZ (1:2 Hc-TZ) group; a similar behavior was observed in heart, kidney and blood. At 24 h p.i., tumor uptake values remained stable for both groups. However, at this time, radioactivity concentration in kidney was higher for SiNPs-TZ (1:2 Hc-TZ) when compared to SiNPs-TZ (1:8 Hc-TZ) group. Results, expressed as tumor to muscle ratios, confirmed this trend of tumor uptake values, throughout the experimental times (Figure 2B). These findings showed the highest tumor uptake values in SiNPs-TZ (1:8 Hc-TZ) group indicating that a further reduction of particles to antibody ratio is not necessary, in order to improve the targeting specificity. For these reasons, SiNPs-TZ (1:8 Hc-TZ) nanoparticles were then chosen for further investigations in vitro and ex vivo/in vivo. Considering the peripheral districts, the highest levels of radioactivity were observed for both nanoparticles sets in organs responsible for degradation and elimination of the nanoconjugates, such as in liver and kidney and in the spleen.34
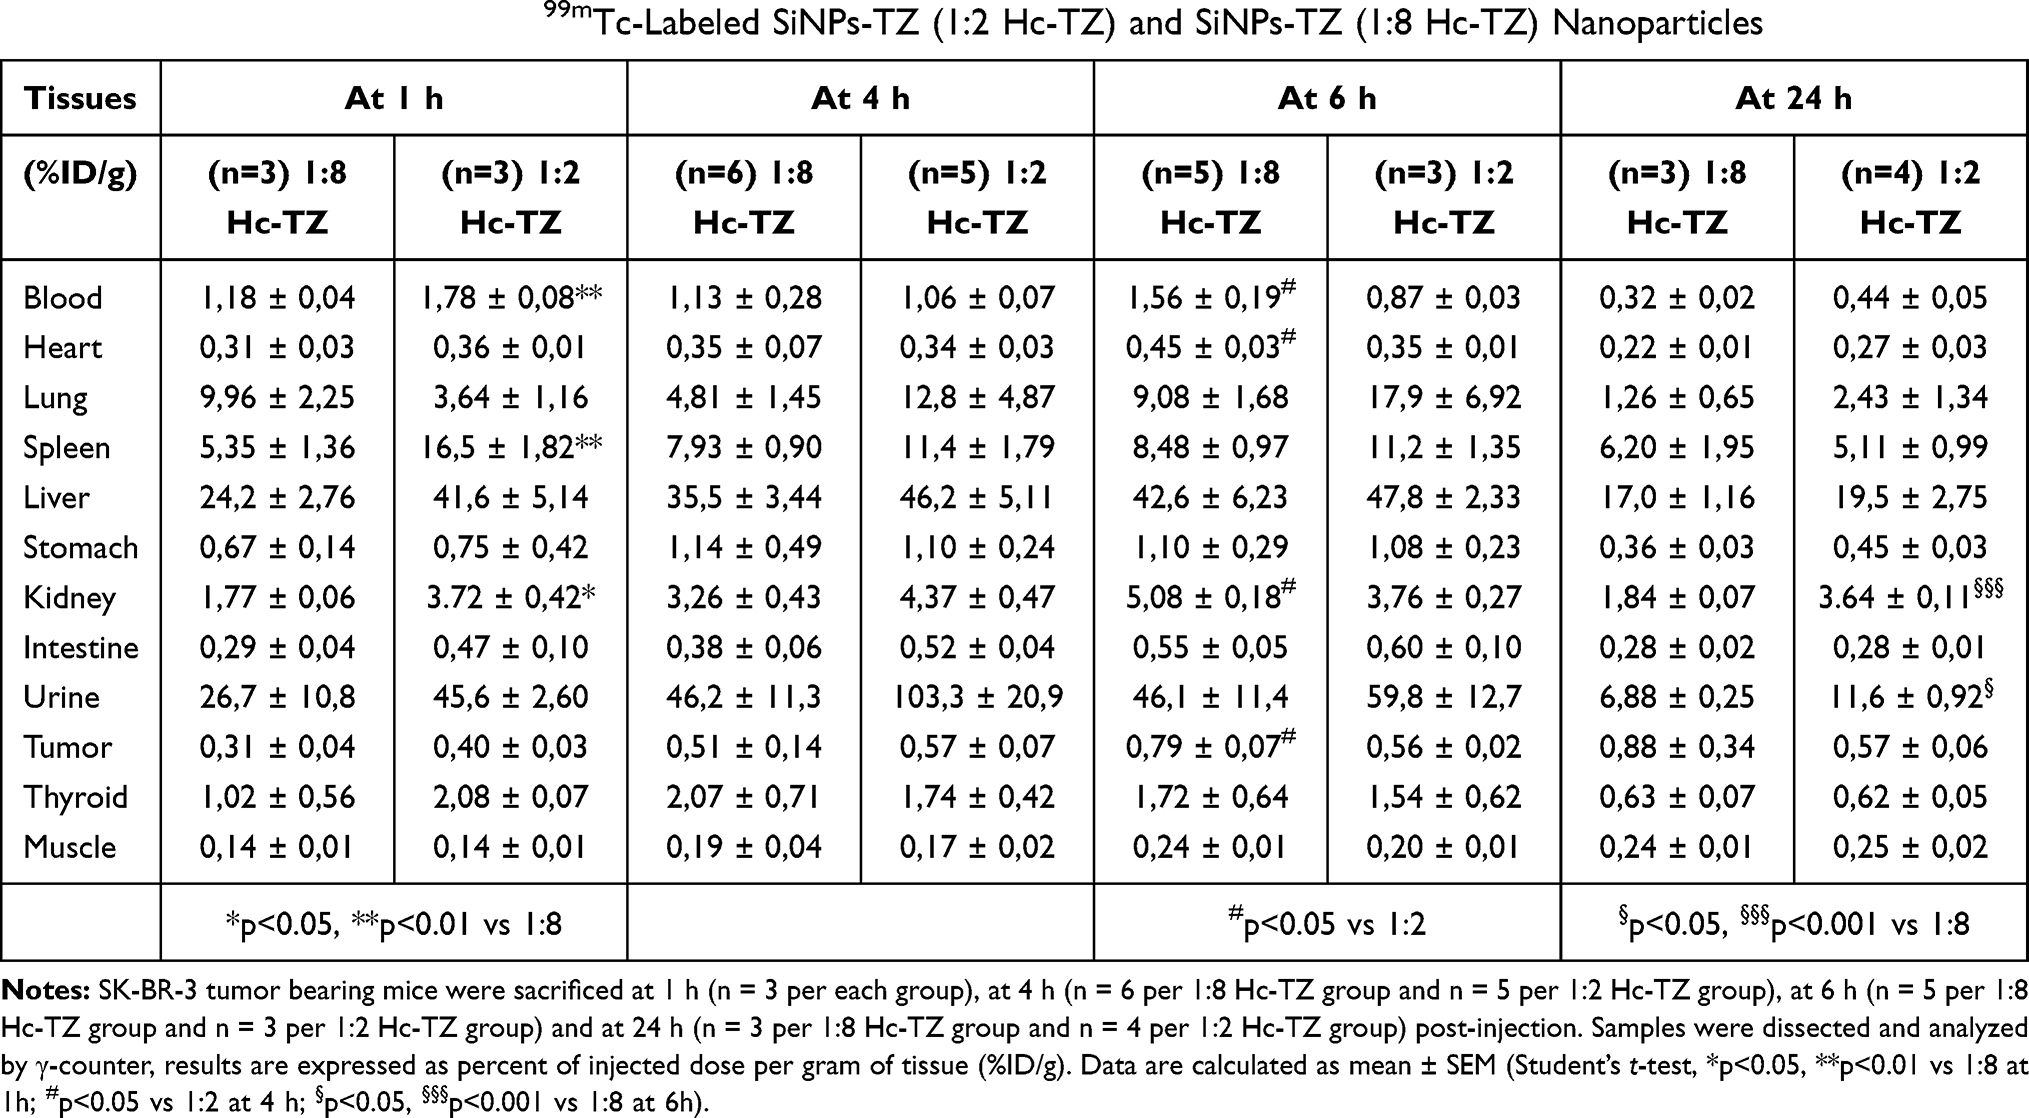 |
Table 1 Ex vivo Biodistribution of 99mTc-Labeled SiNPs-TZ (1:2 Hc-TZ) and SiNPs-TZ (1:8 Hc-TZ) Nanoparticles |
Ex vivo Tumor Distribution of FITC-Filled 99mTc-SiNPs-TZ (1:8 Hc-TZ) by Fluorescence Microscopy
To confirm the localization of nanoparticles fluorescent core (FITC) into the tumor tissue, the uptake of 99mTc-labeled SiNPs-TZ (1:8 Hc-TZ) was assessed postmortem by fluorescence microscopy, on the same samples counted in the biodistribution analysis. Tumor cryosections were collected and processed for imaging at 1, 4 and 24 h post-injection (Figure 3). Acquisitions showed a green fluorescence signaling in tumor already at 1 h p.i., with a remarkable increase at 4 h. Fluorescence intensity was still present at 24 h post-injection, confirming the radioactivity biodistribution results and indicating that the nanoparticles were also able to reach the tumor. Fluorescence microscopy images allowed us to demonstrate the presence of the FITC loaded nanocarriers in tumor lesions, throughout the experimental times.
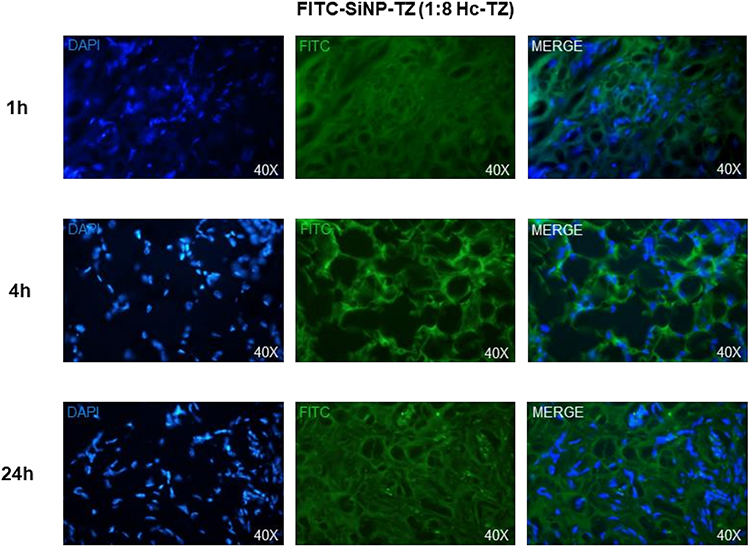 |
Figure 3 Ex vivo fluorescence microscopy acquisitions, collected on SK-BR-3 tumor cryosections at 1, 4 and 24 h post-injection of FITC-filled 99mTc-SiNPs-TZ (1:8 Hc-TZ) nanoparticles. Merge images represent the colocalization of 99mTc-SiNPs-TZ (green) and reporting nuclei (blue). Magnification: 40X. |
Explorative in vivo SPECT Distribution Kinetic, of 99mTc-SiNPs-TZ (1:8 Hc-TZ) in HER2+ Mouse Model
To confirm that radiolabeled nanoconjugates could be visualized in vivo, we performed an explorative in vivo evaluation of SiNPs-TZ (1:8 Hc-TZ) biodistribution kinetic, by SPECT molecular imaging, on one SK-BR-3 tumor-bearing mouse. All images were calibrated with a dedicated phantom and corrected for the radionuclide half-life decay. SPECT images, qualitatively examined after nanoparticles injection, showed a rapid radioactivity accumulation in tumor at 1 h, with a remarkable increase at 4 h (Figure 4). At 24 h post-injection, the radioactivity was not detectable due to the radionuclide decay and the lower sensitivity of SPECT imaging technique in comparison with γ-counter.
 |
Figure 4 In vivo SPECT images, acquired on one mouse at 1, 4 and 24 h post-injection of radiolabeled SiNPs-TZ (1:8 Hc-TZ). Acquisitions were showed in coronal sections; mouse was anaesthetized with a mixture of 4% isoflurane in air and injected intravenously with 6.5 MBq of 99mTc-SiNPs-TZ (1:8 Hc-TZ). The white arrows denote the tumor and the dash lines highlight the anatomical references. |
In vitro Evaluation of Doxorubicin Cell Internalization by DOX-Loaded Nanoparticles
For targeted cancer therapy, it is essential to carrier the drugs specifically into cancer cells. To address this aim, two nanoparticles sets loaded with doxorubicin were prepared obtaining DOX-SiNPs and DOX-SiNPs-TZ (1:8 Hc-TZ, see Figure 5 for the schematic representation). Notably, doxorubicin was externally loaded to the silica core by means of isocyanatopropyl trimethoxysilane-drug complex according with a protocol established in our laboratory.26 Drug conjugation was assessed by UV-Vis spectroscopy (Figure S1) and using a standard curve the DOX loading (DLE) and encapsulation efficiency (DEE) were calculated to be around 1.5–1.6% and 40% respectively. The preparations were further characterized by Transmission Electron Microscopy (TEM) and DLS analysis, as reported in Figure S3 and in Table S2 respectively, where a round shape and a hydrodynamic diameter similar to FITC-loaded nanoparticles were found. Afterwards, in vitro drug delivery studies using confocal microscopy were conducted using SK-BR-3 cell line as HER2+ BC model and in non-transformed mammary cell line MCF-10A, as negative control. DOX cell uptake was evaluated 1h after incubation with DOX-SiNPs and DOX-SiNPs-TZ (1:8 Hc-TZ) by confocal microscopy. As displayed in Figure 6, A, SK-BR-3 cells incubated with targeted nanoparticles DOX-SiNPs-TZ (1:8 Hc-TZ) showed an intracellular red fluorescence signaling (DOX, Ex. 480 nm/Em. 580 nm) stronger than cells incubated with untargeted DOX-SiNPs (Figure 6B). It should be noted that DOX delivered by DOX-SiNPs-TZ is expected to be internalized in HER2 overexpressing (SK-BR-3) cells by an active pathway, conversely the lower intracellular DOX presence observed in DOX-SiNPs images could only be due to its diffusion capability in cell membrane by passive effect.35 Similarly, in HER2-negative MCF-10A cells (Figure 6C) the DOX diffusion by DOX-SiNPs-TZ nanoparticles was lower compared to HER2-positive cells SK-BR-3 (Figure 6A).
 |
Figure 5 Illustration of targeted (Hc-TZ) spherical silica nanoparticles DOX-SiNPs-TZ (hydrodynamic diameter ≈ 70–80 nm). Nanoparticles silica core (grey) was externally loaded with Doxorubicin (red). |
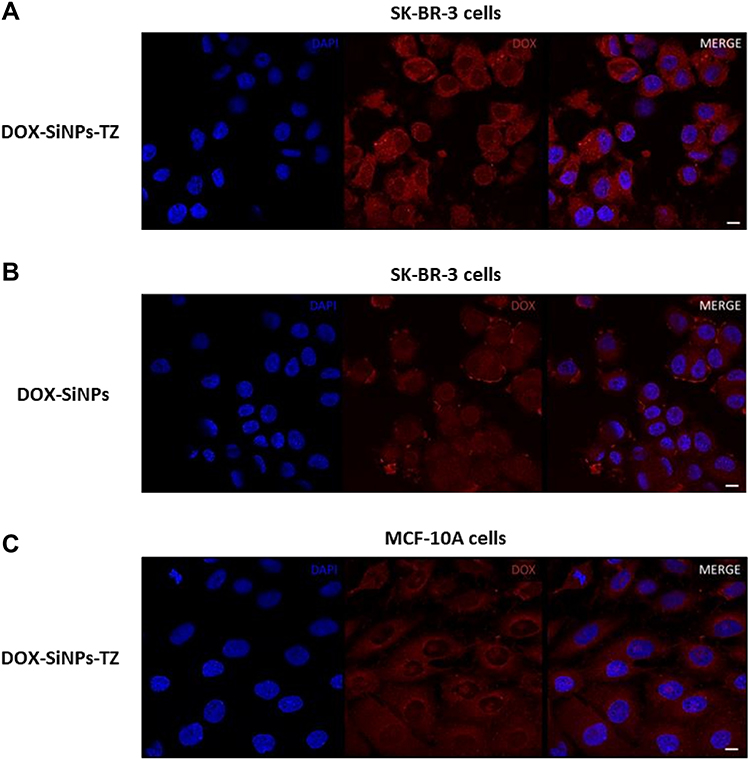 |
Figure 6 The cellular DOX uptake was imaged by confocal microscopy after 1 h post incubation, with following treatments: (A) DOX-SiNPs-TZ and (B) DOX-SiNPs nanoparticles for HER2+ BC cells SK-BR-3 and (C) DOX-SiNPs-TZ for HER2− mammary cells MCF-10A. Merge images represent the colocalization of DOX (red) and reporting nuclei (blue). Scale bar: 10 μm. |
In vivo/ex vivo Evaluation of Doxorubicin Delivery by DOX-SiNPs Compared to Caelyx
To confirm the targeting ability of our drug delivery system in vivo, fluorescence images of SK-BR-3 tumor bearing mice were captured at 1, 4 (images not showed) and 6 hours by Optical Imaging, after one single intravenous injection of DOX-SiNPs-TZ (1:8 Hc-TZ) in comparison with DOX-SiNPs and Caelyx. BC was subcutaneously implanted and the whole-body images could be used for the monitoring of DOX relative distribution to the tumor sites, among the several treatment groups. At 6 h post-injection, the acquisitions reported the maximum DOX uptake results to the tumor, for all nanoparticles formulations (data not shown). At this time point, as indicated in Figure 7A, in vivo images showed higher DOX accumulation at the tumor site for DOX-SiNPs-TZ and Caelyx, compared to DOX-SiNPs group. Fluorescence quantification, performed on images of excised tumors and tissues (Figure 7B), did not highlight any significant variations in tumor DOX distribution by the three nanoparticle types, confirming a slight increase in SiNPs-TZ and Caelyx treatment groups (values expressed as average efficiency in Figure 7C, or as tissues to muscle ratio in Figure 7D). In peripheral districts, all nanoparticles sets showed DOX concentration mainly in liver and kidney, as expected,34 with a notable increase in kidney for DOX-SiNPs-TZ probably due to the high HER2 receptor expression in renal tissue.36 These results indicated that DOX-SiNPs-TZ (1:8 Hc-TZ) nanoparticles are able to deliver DOX at tumor site comparably to Caelyx, after a single injection. On the basis of these data, a treatment schedule similar to that used for Caelyx was applied to SiNPs and SiNPs-TZ nanoparticles.
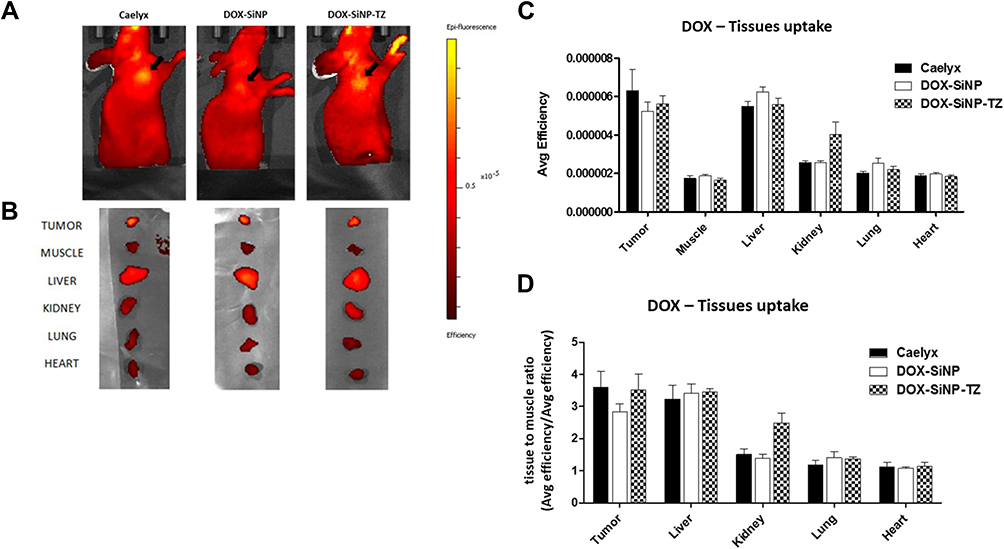 |
Figure 7 In vivo/ex vivo DOX biodistribution study in HER2+ tumor bearing mice by Optical Imaging (IVIS Spectrum in vivo imaging system). (A) Representatives in vivo images acquired at 6 h post-injection of DOX-loaded nanoparticles (Caelyx, DOX-SiNPs and DOX-SiNPs-TZ 1:8 Hc-TZ). Black arrows indicate the tumors. (B) Mice were sacrificed at 6 h p.i. and samples were dissected and immediately acquired (n = 3 mice per group). (C) Samples were assayed and ex vivo uptake results were expressed as average efficiency of fluorescence emission, and as (D) samples to muscle ratio of average efficiency of fluorescence emission. Mean values calculated per group ± SEM. |
Evaluation of Treatment Efficacy of DOX-SiNPs Compared to Caelyx
Female HER2+ tumor xenograft mice were subdivided into 4 treatment groups (Control: n. 5 mice; Caelyx: n. 10 mice; DOX-SiNPs: n. 6 mice and DOX-SiNPs-TZ,1:8 Hc-TZ: n. 9 mice) and when tumor volumes reached an average of about 85 mm3, mice received 1mg/Kg of DOX loaded in nanoparticles, once a week for six weeks of treatment. Treatment efficacy results, expressed as percent of tumor volume regression compared to starting treatment, reported after six weeks (Figure 8) a significant increase for DOX-SiNPs-TZ (1:8 Hc-TZ) group (55.7%) in comparison with Caelyx (34.5%, p < 0.001) and untargeted nanoparticles DOX-SiNPs (37%, p < 0.01). In addition, tumor growth inhibition (%TGI) was calculated for each treatment group in comparison with the control mice (Figure 9). Data showed, already after four weeks of treatment, a tumor growth inhibition higher than 50% exclusively in DOX-SiNPs-TZ (1:8 Hc-TZ) treated group, with an increase over time.
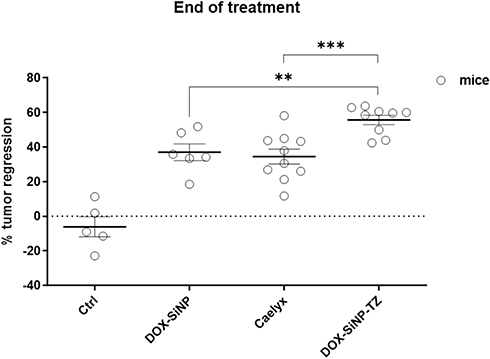 |
Figure 8 Treatment efficacy results, after six weeks of treatment, expressed as percentage of tumor regression compared to starting treatment. Four treatment groups (Ctrl: n. 5 mice; DOX-SiNPs: n. 6 mice; Caelyx: n. 10 mice and DOX-SiNPs-TZ: n. 9 mice), were weekly-injected i.v. with a dose of 1mg/kg of Doxorubicin loaded by both several nanoparticles formulation. Average values calculated per group ± SEM, (Student’s t-test; **p < 0.01 vs DOX-SiNPs and ***p < 0.001 vs Caelyx). |
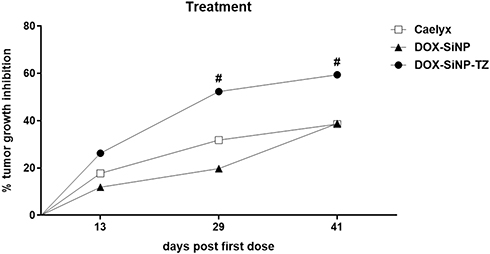 |
Figure 9 Treatment efficacy results, expressed as percentage of tumor growth inhibition (%TGI) compared to the control group, (#tumor growth inhibition > 50% is considered meaningful). |
Treatment response was also evaluated monitoring the glucose tumor metabolism, by in vivo [18F]FDG PET imaging. PET images quantification reported no significant modifications in [18F]FDG tumor uptake among the treatment groups, throughout the experimental times (before starting treatment, at three and six weeks after; Figure S4).
Proteomic Profiling and Treatment Response
In order to investigate the different treatment responses, proteomic profile was evaluated on tumor samples (n=3 mice per group, two replicates) among the four experimental groups (Control; Caelyx; DOX-SiNPs and DOX-SiNPs-TZ,1:8). Microflow liquid chromatography coupled with mass spectrometry (µLC-MS) identified a total of 1271 proteins. The complete list of proteins identified is reported in Supplementary Table S3.
The Venn diagrams illustrate the shared proteins among the treatment groups, considering proteins identified in at least two runs (Figure 10). Enrichment analysis of biological processes revealed that the majority of proteins modulated by treatments belong to cell growth, metabolism, energy, signal transduction and communication pathways (Figure 11A). Meanwhile, molecular function enrichment reported the main involving of structural and catalytic activities, as well as cytoskeleton and cell matrix constituents (Figure 11B).
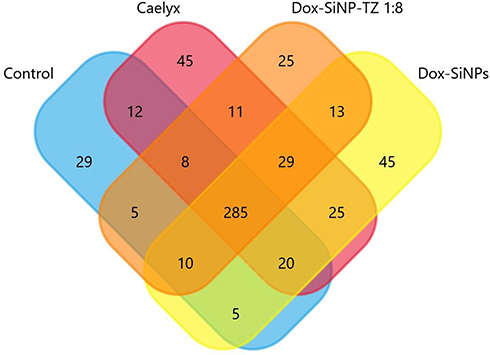 |
Figure 10 Venn diagram of proteins distribution found with a frequency at least of 2 in control (blue), Caelyx (pink), DOX-SiNPs (yellow) and DOX-SiNPs-TZ (orange). Areas of intersection contain proteins common to different conditions. |
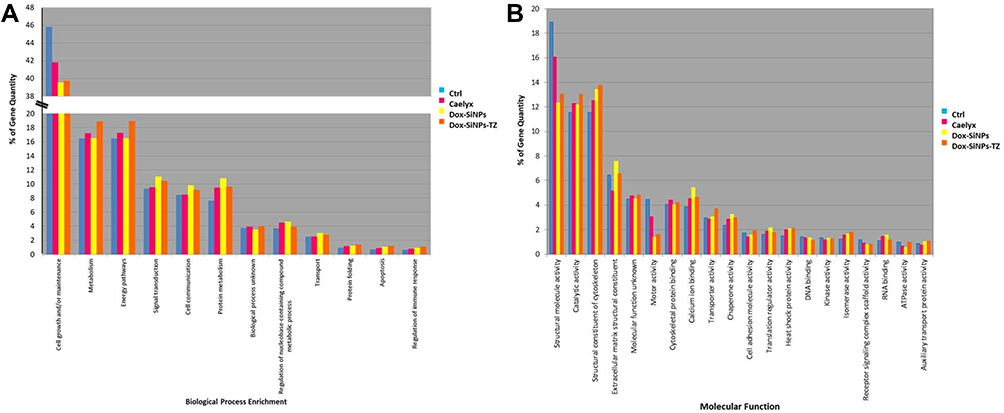 |
Figure 11 Enrichment analysis of biological processes and molecular functions of all identified proteins assessed by FunRich comparing the average PSMs of control samples and the average PSMs of the three nanoparticle treated samples. Panels A–B illustrate the percentage of proteins for each examined condition, reporting the elements significantly enriched in the GO categories: (A) biological process and (B) molecular function. Enrichment of at least 1% (based on gene/protein quantity) for one of the examined conditions is considered. |
An additional comparison on biological processes and molecular functions was performed between DOX-SiNPs-TZ and Caelyx groups, using FunRich quantity fold feature, in order to report the top enriched and/or depleted categories in the two examined conditions. As shown in Figure 12A), vesicles-mediated transport, cell migration and adhesion resulted enriched in DOX SiNPs-TZ, whereas cell motility, biogenesis and transcription processes appeared reduced in respect to Caelyx. Considering molecular functions (Figure 12B), DOX-SiNPs-TZ group showed an increased activity in glucosidase, DNA-directed DNA polymerase, tyrosine phosphatases, complement receptor and a decrease in helicase, transmembrane receptor tyrosine kinase, sulfotransferase, polysaccharide binding and nucleocytoplasmic transport activity, the latter was particularly affected. Overall, these results are in line with the higher effect on tumor growth reduction observed after DOX-SiNPs-TZ treatment. The alignment of the twenty-four protein lists obtained from the experimental runs, collected from the biological and technical replicates analysed, made it possible to create for each condition a unique list in which the peptide spectrum match average values (PSM*) of the identified proteins are reported. The mean PSM values assigned to each protein allowed to pairwise compared Caelyx, DOX-SiNPs and DOX-SiNPs-TZ respect to the Control samples and to estimate relative abundance of proteins by applying two algorithms of MAProMa software,31 DAve and DCI, representing the ratio and the confidence in differential expression, respectively. Using stringent filters described in M&M section to maximize the confidence of identification, a total of 88 proteins were found differentially expressed and reported in Figure 13 with selected details and in Suppl Table S4 in extended form.
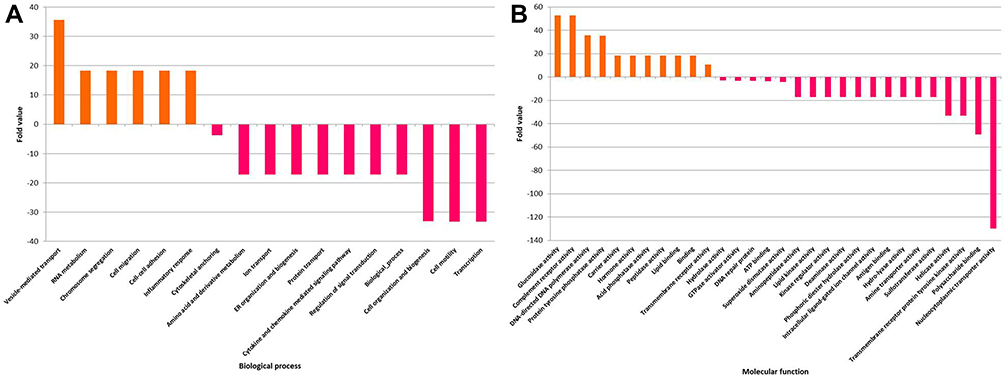 |
Figure 12 Histogram of the top (A) biological processes or (B) molecular function, enriched (positive values) and depleted (negative values) in DOX-SiNPs-TZ (orange bar) samples if compared versus Caelyx ones (magenta bar), selected on the basis of related protein quantities and of the set threshold (≥ 3 fold change ≤ −3). |
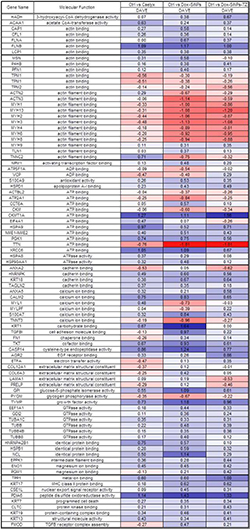 |
Figure 13 Significant changes in tumor tissue proteome of the three nanoparticle formulations, as determined by proteomic analysis. Differentially expressed proteins resulted from the MAProMa comparison of Caelyx, DOX-SiNPs and DOX-SiNPs-TZ 1:8 conditions versus control. In particular, each protein (identified in figure through its Gene Name) is marked by a color code, which is defined by the DAve value obtained in the three examined comparisons. The color is assigned according to a chromatic scale (reported in figure) which represents the confidence ranges of DAve values adopted (from −2.00 to 0 a gradient from red to white and from +2.00 to 0 a gradient from blue to white). Positive DAve values indicate proteins up-represented in nanoparticle formulations, while negative DAve values indicate proteins down-represented in nanoparticle formulations. It should be noted that proteins were primarily grouped according to their molecular function and secondarily by their gene name. The complete list of the reported proteins was extracted from the differential lists in Supplementary Table 4. |
The differential analysis revealed common or selective effects of the three Doxorubicine nanocarriers in comparison to vehicle solution. Specifically, 7 proteins resulted commonly upregulated in the three nanoparticle formulations compared to control (Figure 14A); 9, of which 6 up- and 3 down-regulated proteins, were mainly found dysregulated in DOX-SiNPs-TZ (Figure 14B); 11 and 8 proteins resulted respectively up- and down-differentially expressed at the same way in DOX-SiNPs and DOX-SiNPs-TZ groups (Figure 14C). A number of proteins related to programmed cell dead, magnesium/calcium ion binding, endopeptidase and GTPase/ATP-binding activity families are significantly increased in all treatment groups in comparison with control. Among these, of particular interest are the tumor and metastasis suppressor activity of Caspase-14 (CASP14) and Nucleoside diphosphate kinase (NME1) proteins, because they are well documented actors across a wide spectrum of human cancers including breast carcinomas.37,38 DOX-SiNPs and DOX-SiNPs-TZ treatment decreased the levels of Actinin 3 protein (ACTN3) and the whole Myosin protein family compared to Control and Caelyx groups. The Myosins and Actinin 3 proteins, belonging to actin filament binding cluster, are known to contribute in tumor progression and metastasis via their effects on cell adhesion and migration, and provide promising new targets for cancer therapies.39,40 The expression of other relevant oncogene proteins was reduced by DOX-SiNPs and DOX-SiNPs-TZ regimen compared to Control and Caelyx groups, such as Titin protein (TTN), relating to ATP binding proteins cluster.41 A similar trend was also observed for Troponin C (TNNC2) in DOX-SiNPs and DOX-SiNPs-TZ groups but only when compared to control mice, whereas in Caelyx group we observed an increase of its expression. The relationship between Troponin C overexpression and cancer has been assessed in breast tumors and in several types of malignancy.42 Moreover, DOX-SiNPs and DOX-SiNPs-TZ, but not Caelyx group, increased Filamin A (FLNA) protein (actin binding protein) levels. The role of Filamin A as inhibitor of tumor progression, through regulating BRCA1 expression in human breast cancer, has been recently clarified.43,44 Exclusively DOX-SiNPs administration reduced the expression of Sarco/Endoplasmic Reticulum ATPase 1 protein (ATP2A1), named SERCA, this protein plays an important role in the regulation of intracellular calcium levels. Inhibitors of SERCA increase cytosolic calcium levels, triggering various pathways with a resulting promotion of cell death.45 Similarly, DOX-SiNPs showed a significant decrease of Myosin light chain 1/3 protein (MYL1), a protein known to promote cell migration and invasion. Interestingly, MYL1 levels were increased by Caelyx treatment.46 Finally, silica nanoparticle (DOX-SiNPs and DOX-SiNPs-TZ) increased the expression of tumor suppressor the Transforming growth factor β (TGFBI)47 in comparison with Caelyx, however this effect was significant only for DOX-SiNPs group. Conversely, Annexin 2 expression (included into cadherin binding group) was reduced by DOX-SiNPs-TZ and Caelyx compared to DOX-SiNPs, and its increase is associated with poor prognosis and spread of cancers including breast carcinoma.48 Caelyx and DOX-SiNPs groups also showed an increase of some markers of malignancy and drug resistance in breast cancer, such as Keratine type II cytoskeletal 1 (KRT1)49 and Nucleolin proteins (NCL),50 for the latter protein this effect was particularly relevant in DOX-SiNPs group. Nucleolin binds the ErbB2/HER2 receptor enhancing the tumorigenicity and the relapse in HER2-positive breast cancer.50 These results suggest a lower probability of chemoresistance development during chemotherapy with HER2-targeted nanoparticles (DOX-SiNPs-TZ), in comparison to Caelyx and DOX-SiNPs. Furthermore, our findings reported a significant decrease of Prolargin (PRELP) and Laminin subunit alpha 1 (LMA1) levels, exclusively post DOX-SiNPs-TZ treatment setting. These extracellular matrix proteins, along with other proteoglycans, are known to be over-expressed in ovarian and breast cancer, playing an important role in tumor invasion and progression.51,52 Overall, we observed a relevant modulation of protein related to cancer cell growth, drug resistance and migration, whose balance might explain the higher in vivo efficacy observed in DOX-SiNPs-TZ group.
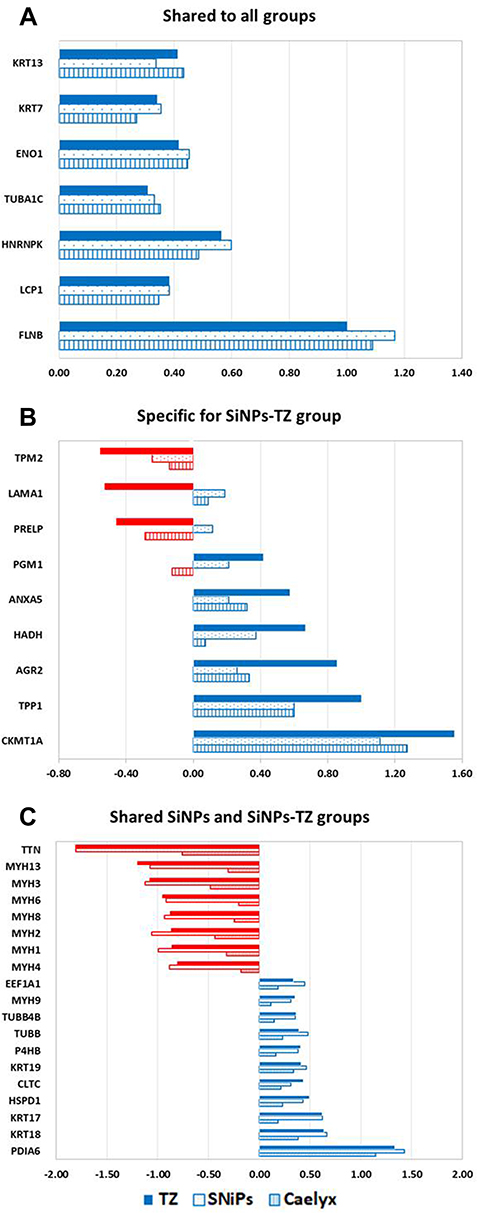 |
Figure 14 Selected differentially expressed proteins, comparing the three DOXorubicin carriers with the control. (A) Commonly up-regulated in the three nanoparticle formulations; (B) mainly found dysregulated in DOX-SiNPs-TZ (TZ); (C) proteins presenting similar behaviour in DOX-SiNPs (SiNPs) and DOX-SiNPs-TZ groups. DAve values (x-axis) blue/positive and red/negative correspond to up- and down-regulated proteins compared to control, respectively. Proteins with a variation greater than a fold change of 1.5 are considered. |
Discussion
Nowadays, the detection of HER2 receptor in BC and in its metastases is based on anatomical imaging techniques with several limitations in sensitivity and specificity.53 Moreover, phenotype assessment is performed using invasive procedures as biopsy, for the analysis of tumor tissue markers.54 Recently, the possibility to identify and measure soluble biomarkers as HER2 extracellular domain and circulating miRNA have improved patients’ stratification, with some limitations.55–57 In this study, we presented and evaluated a multifunctional silica nanoparticles-based system (SiNPs) able to act both as a SPECT imaging radiotracer and as a carrier for chemotherapy drugs. This theranostic system could successfully be applied for HER2+ BC lesions management, as previously reported.25 To this aim, we developed spherical SiNPs (hydrodynamic diameter ≈ 70–80 nm) conjugated with half-chain (Hc-TZ) of the humanized antibody trastuzumab (TZ), for specific targeting of HER2 overexpressing tumor cells. In our previous study,25 the SiNPs shell had been radiolabeled by NTA (nitrilotriacetic acid) linker procedure obtaining an enhanced targeting for HER2-positive BC cells and solid lesions, compared to EPR passive diffusion.58 In particular, we had demonstrated that targeted nanoparticles (99mTc-SiNPs-(NTA)-TZ) displayed a higher uptake in comparison with untargeted ones (99mTc-SiNPs-NTA) at 4 h post-injection, with a rapid decrease thereafter. We had postulated that this observed trend could be due to Hc-TZ mediated cellular internalization of 99mTc-SiNPs-(NTA)-TZ nanoparticles, followed by the lysosomal degradation of their radiolabeled shell with a consequent rapid washout of radioactivity. In the present study, we performed further investigations on in vivo biodistribution properties of SiNPs-TZ, by radiolabeling the nanoparticles at Hc-TZ site. In addition, we tested the ability of these nanoparticles to carry Doxorubicin (DOX) at tumor lesions and their in vivo treatment efficacy, after administration in a HER2-positive mouse model, in comparison with the clinical gold standard Caelyx. For the first aim, a new radiolabeling procedure was introduced and SiNPs-TZ nanoparticles were synthetized without the NTA (nitrilotriacetic acid) linker. In particular, SiNPs-TZ were radiolabeled directly on the histidine (His) residues of Hc-TZ in order to evaluate also the in vivo/ex vivo biodistribution of this component and to simplify the previous radiolabeling procedure. In a recent study,33 the authors demonstrated in HER2-positive breast cancer models that tumor targeting and therapeutic efficacy of gold spherical nanoparticles can be improved reducing the number of attached antibodies (TZ). Therefore, in order to test whether the reduction of the Hc-TZ number conjugated on SiNPs shell could improve the targeting efficiency, we realized two SiNPs-TZ kinds with different antibody half-chain (Hc-TZ) ratios per single nanoparticle, with 1:2 and 1:8 (as well in prior study) SiNPs:Hc-TZ. Interestingly, our biodistribution data reported a higher accumulation of SiNPs-TZ (1:8 Hc-TZ) compared to SiNPs-TZ (1:2 Hc-TZ) in tumor lesion. Differently from our previous findings, observed after the radiolabeling of nanoparticles shell, tumor uptake values remained stable over time (at 24 h p.i.). These results, together with ex vivo fluorescence microscopy acquisitions, confirmed our previous hypothesis of a stable presence into the tumor tissue of the SiNPs-TZ core.
Therefore, the highest tumor uptake values reported by SiNPs-TZ (1:8 Hc-TZ) group led us to choose this nanoparticle kind for further in vitro and ex vivo/in vivo investigations.
Explorative SPECT molecular imaging study showed a promising in vivo specificity of this system (SiNPs-TZ, 1:8 Hc-TZ) for non-invasive detection of HER2-positive tumor lesions, even at 1 h post-injection, with maximum uptake results at 4 h. At later time (24 h), due to low sensitivity of our SPECT system, no signal was detected.
Regarding therapeutic purpose, in vitro and ex vivo/in vivo distribution assay of Doxorubicin loaded nanoparticles showed that DOX-SiNPs-TZ were able to carry the chemotherapy drug (DOX) at tumor site. However, after a single injection, we failed to observe significant variations in Doxorubicin uptake in comparison with the clinical gold standard Caelyx or untargeted DOX-SiNPs. Notably, in vivo treatment efficacy study showed a significant improvement of tumor growth inhibition in mice treated with DOX-SiNPs-TZ compared to untargeted DOX-SiNPs and Caelyx groups. Considering that the concentration of Doxorubicin delivered to the tumor by several nanovectors was not significantly different, we investigated the enhancing of DOX-SiNPs-TZ treatment efficacy by proteomic analysis. Our proteomic assay showed a positive anticancer modulation by silica nanoparticles treatment groups (DOX-SiNPs and DOX-SiNPs-TZ) in comparison with Caelyx, on a series of protein related to tumor growth and invasion, in some cases with highest values in DOX-SiNPs group. However, this last formulation commonly to Caelyx induced an increase of several negative prognostic biomarkers, such as KRT1 or NCL, which were not observed (or at very low levels) after DOX-SiNPs-TZ treatment. Moreover, the active targeting by DOX-SiNPs-TZ induced the expression reduction of Prolargin (PRELP) and Laminin subunit alpha 1 (LMA1) proteins, hampering the tumor invasion and blocking potential mechanism of drug resistance, also avoiding the increase of Nucleolin protein levels.
In addition, the enrichment analysis showed an enhancement in functional and molecular pathways involved in antitumor effect, in favor to DOX-SiNPs-TZ.
Despite their complexity, our proteomic results suggest a potential benefit of DOX-SiNPs-TZ for therapeutic application in HER2-positive breast cancer.
Conclusions
Taken together, ex vivo/in vivo biodistribution results confirmed a good specificity of 99mTc-SiNPs-TZ nanoparticles in the detection of HER2-positive breast cancer lesions. The promising in vivo efficacy results could be due to the active internalization of DOX in cancer cells by targeted nanoparticles DOX-SiNPs-TZ, in comparison to the other two non-specific delivery systems (DOX-SiNPs and Caelyx). In addition, in vivo efficacy studies were confirmed by the results obtained from proteomic analysis. Although our preliminary results are encouraging, further in vivo investigation on different HER-positive BC models are needed, in order to confirm the potential use of SiNPs-TZ as a new theranostic agent for non-invasive detection and treatment of HER2-positive breast cancer.
Acknowledgments
This work was supported by a grant from the Italian Ministry of Education, University and Research (MIUR), NanoBreastImaging “Progetto Bandiera NanoMAX”. The MIUR is gratefully acknowledged for yearly FOE funding to the Euro-BioImaging Multi-Modal Molecular Imaging Italian Node (MMMI).
Disclosure
The authors report no conflicts of interest in this work.
References
1. Siegel RL, Miller KD, Jemal A. Cancer statistics, 2015. CA Cancer J Clin. 2015;65(1):5–29. doi:10.3322/caac.21254
2. Bray F, Ferlay J, Soerjomataram I, Siegel RL, Torre LA, Jemal A. Global cancer statistics 2018: GLOBOCAN estimates of incidence and mortality worldwide for 36 cancers in 185 countries. CA Cancer J Clin. 2018;68(6):394–424. doi:10.3322/caac.21492
3. Viale G. The current state of breast cancer classification. Ann Oncol. 2012;23:207–210. doi:10.1093/annonc/mds326
4. Koboldt DC, Fulton RS, McLellan MD, et al. Comprehensive molecular portraits of human breast tumours. Nature. 2012;490(7418):61–70.
5. Santagata S, Thakkar A, Ergonul A, et al. Taxonomy of breast cancer based on normal cell phenotype predicts outcome. J Clin Invest. 2014;124(2):859–870. doi:10.1172/JCI70941
6. DeSantis CE, Fedewa SA, Sauer AG, Kramer JL, Smith RA, Jemal A. Breast cancer statistics, 2015: convergence of incidence rates between black and white women. CA Cancer J Clin. 2016;66(1):31–42. doi:10.3322/caac.21320
7. Slamon DJ, Leyland-Jones B, Shak S, et al. Use of chemotherapy plus a monoclonal antibody against HER2 for metastatic breast cancer that overexpresses HER2. N Engl J Med. 2001;344(11):783–792. doi:10.1056/NEJM200103153441101
8. Murthy RK, Varma A, Mishra P, et al. Effect of adjuvant/neoadjuvant trastuzumab on clinical outcomes in patients with HER2-positive metastatic breast cancer. Cancer. 2014;120(13):1932–1938. doi:10.1002/cncr.28689
9. Hurvitz SA, Dirix L, Kocsis J. Phase II randomized study of trastuzumab emtansine versus trastuzumab plus docetaxel in patients with human epidermal growth factor receptor 2-positive metastatic breast cancer (vol 31, pg 1157, 2013). J Clin Oncol. 2013;31(9):2977. doi:10.1200/JCO.2012.44.9694
10. Barok M, Joensuu H, Isola J. Trastuzumab emtansine: mechanisms of action and drug resistance. Breast Cancer Res. 2014;16(2). doi:10.1186/bcr3621
11. Hurvitz SA, Martin M, Symmans WF, et al. Neoadjuvant trastuzumab, pertuzumab, and chemotherapy versus trastuzumab emtansine plus pertuzumab in patients with HER2-positive breast cancer (KRISTINE): a randomised, open-label, multicentre, Phase 3 trial. Lancet Oncol. 2018;19(1):115–126. doi:10.1016/S1470-2045(17)30716-7
12. Lee HB, Han W. Unique features of young age breast cancer and its management. J Breast Cancer. 2014;17(4):301–307. doi:10.4048/jbc.2014.17.4.301
13. Gerber B, Seitz E, Muller H, et al. Perioperative screening for metastatic disease is not indicated in patients with primary breast cancer and no clinical signs of tumor spread. Breast Cancer Res Tr. 2003;82(1):29–37. doi:10.1023/B:BREA.0000003917.05413.ac
14. Bick U, Helbich TH. Follow-up of patients with breast cancer: imaging of local recurrence and distant metastases. In: Hodler J, Kubik-Huch RA, von Schulthess GK, editors. Diseases of the Chest, Breast, Heart and Vessels 2019–2022: Diagnostic and Interventional Imaging. Cham (CH); 2019:167–178.
15. Yalcin B. Staging, risk assessment and screening of breast cancer. Exp Oncol. 2013;35(4):238–245.
16. Townsend DW. Physical principles and technology of clinical PET imaging. Ann Acad Med Singap. 2004;33(2):133–145.
17. Jafari SH, Saadatpour Z, Salmaninejad A, et al. Breast cancer diagnosis: imaging techniques and biochemical markers. J Cell Physiol. 2018;233(7):5200–5213. doi:10.1002/jcp.26379
18. Alcantara D, Leal MP, Garcia-Bocanegra I, Garcia-Martin ML. Molecular imaging of breast cancer: present and future directions. Front Chem. 2014;2. doi:10.3389/fchem.2014.00112
19. Henry KE, Ulaner GA, Lewis JS. Clinical potential of human epidermal growth factor receptor 2 and human epidermal growth factor receptor 3 imaging in breast cancer. Pet Clin. 2018;13(3):
20. Lim EK, Kim T, Paik S, Haam S, Huh YM, Lee K. Nanomaterials for theranostics: recent advances and future challenges. Chem Rev. 2015;115(1):327–394.
21. Choi HS, Frangioni JV. Nanoparticles for biomedical imaging: fundamentals of clinical translation. Mol Imaging. 2010;9(6):291–310. doi:10.2310/7290.2010.00031
22. Li CJ, Zhang YX, Wang LF, et al. A novel multivalent Tc-99m-labeled EG2-C4bp alpha antibody for targeting the epidermal growth factor receptor in tumor xenografts. Nucl Med Biol. 2015;42(6):547–554. doi:10.1016/j.nucmedbio.2015.01.011
23. Geng JL, Liu J, Liang J, Shi HB, Liu B. A general approach to prepare conjugated polymer dot embedded silica nanoparticles with a SiO2@CP@SiO2 structure for targeted HER2-positive cellular imaging. Nanoscale. 2013;5(18):8593–8601. doi:10.1039/c3nr02390g
24. Fiandra L, Mazzucchelli S, De Palma C, et al. Assessing the in vivo targeting efficiency of multifunctional nanoconstructs bearing antibody-derived ligands. ACS Nano. 2013;7(7):6092–6102. doi:10.1021/nn4018922
25. Rainone P, Riva B, Belloli S, et al. Development of Tc-99m- radiolabeled nanosilica for targeted detection of HER2-positive breast cancer. Int J Nanomedicine. 2017;12:3447–3461. doi:10.2147/IJN.S129720
26. Riva B, Bellini M, Corvi E, et al. Impact of the strategy adopted for drug loading in nonporous silica nanoparticles on the drug release and cytotoxic activity. J Colloid Interface Sci. 2018;519:18–26. doi:10.1016/j.jcis.2018.02.040
27. Del Guerra A, Bartoli A, Belcari N, et al. Performance evaluation of the fully engineered YAP-(S)PET scanner for small animal imaging. Ieee T Nucl Sci. 2006;53(3):1078–1083. doi:10.1109/TNS.2006.871900
28. Nomura E, Katsuta K, Ueda T, Toriyama M, Mori T, Inagaki N. Acid-labile surfactant improves in-sodium dodecyl sulfate polyacrylamide gel protein digestion for matrix-assisted laser desorption/ionization mass spectrometric peptide mapping. J Mass Spectrom. 2004;39(2):202–207. doi:10.1002/jms.578
29. De Palma A, Fanelli G, Cretella E, et al. Gcn5p and Ubp8p affect protein ubiquitylation and cell proliferation by altering the fermentative/respiratory flux balance in Saccharomyces cerevisiae. mBio. 2020;11(4). doi:10.1128/mBio.01504-20.
30. Kall L, Canterbury JD, Weston J, Noble WS, MacCoss MJ. Semi-supervised learning for peptide identification from shotgun proteomics datasets. Nat Methods. 2007;4(11):923–925. doi:10.1038/nmeth1113
31. Mauri P, Deho G. A proteomic approach to the analysis of RNA degradosome composition in Escherichia coli. Method Enzymol. 2008;447:
32. Pathan M, Keerthikumar S, Ang CS, et al. FunRich: an open access standalone functional enrichment and interaction network analysis tool. Proteomics. 2015;15(15):2597–2601. doi:10.1002/pmic.201400515
33. Colombo M, Fiandra L, Alessio G, et al. Tumour homing and therapeutic effect of colloidal nanoparticles depend on the number of attached antibodies. Nat Commun. 2016;7. Doi:10.1038/ncomms13818
34. Bose T, Latawiec D, Mondal PP, Mandal S. Overview of nano-drugs characteristics for clinical application: the journey from the entry to the exit point. J Nanopart Res. 2014;16(8). doi:10.1007/s11051-014-2527-7
35. Minotti G, Menna P, Salvatorelli E, Cairo G, Gianni L. Anthracyclines: molecular advances and pharmacologic developments in antitumor activity and cardiotoxicity. Pharmacol Rev. 2004;56(2):185–229. doi:10.1124/pr.56.2.6
36. Wang HL, Liu CY, Han J, et al. HER2 expression in renal cell carcinoma is rare and negatively correlated with that in normal renal tissue. Oncol Lett. 2012;4(2):194–198. doi:10.3892/ol.2012.727
37. Asselin-Labat ML, Sutherland KD, Vaillant F, et al. Gata-3 negatively regulates the tumor-initiating capacity of mammary luminal progenitor cells and targets the putative tumor suppressor caspase-14. Mol Cell Biol. 2011;31(22):4609–4622. doi:10.1128/MCB.05766-11
38. Mccorkle JR, Leonard MK, Kraner SD, et al. The metastasis suppressor NME1 regulates expression of genes linked to metastasis and patient outcome in melanoma and breast carcinoma. Cancer Genom Proteom. 2014;11(4):175–194.
39. Li YR, Yang WX. Myosins as fundamental components during tumorigenesis: diverse and indispensable. Oncotarget. 2016;7(29):46785–46812. doi:10.18632/oncotarget.8800
40. Yang XR, Pang YF, Zhang JL, et al. High expression levels of ACTN1 and ACTN3 indicate unfavorable prognosis in acute myeloid leukemia. J Cancer. 2019;10(18):4286–4292. doi:10.7150/jca.31766
41. Greenman C, Stephens P, Smith R, et al. Patterns of somatic mutation in human cancer genomes. Nature. 2007;446(7132):153–158. doi:10.1038/nature05610
42. Johnston JR, Chase PB, Pinto JR. Troponin through the looking-glass: emerging roles beyond regulation of striated muscle contraction. Oncotarget. 2018;9(1):1461–1482. doi:10.18632/oncotarget.22879
43. Sun P, Chen JW, Lu JB, Luo RZ, Li M, He JH. Characteristics of breast metastases from non-breast solid tumors in 22 patients from a southern Chinese population. Oncol Lett. 2018;15(3):3685–3693. doi:10.3892/ol.2018.7741
44. Xu YJ, Bismar TA, Su J, et al. Filamin A regulates focal adhesion disassembly and suppresses breast cancer cell migration and invasion. J Exp Med. 2010;207(11):2421–2437. doi:10.1084/jem.20100433
45. Mekahli D, Bultynck G, Parys JB, De Smedt H, Missiaen L. Endoplasmic-reticulum calcium depletion and disease. Csh Perspect Biol. 2011;3(6).
46. Suzuki E, Ota T, Tsukuda K, et al. nm23-H1 reduces in vitro cell migration and the liver metastatic potential of colon cancer cells by regulating myosin light chain phosphorylation. Int J Cancer. 2004;108(2):207–211. doi:10.1002/ijc.11546
47. Li BY, Wen GY, Zhao YL, Tong J, Hei TK. The role of TGFBI in mesothelioma and breast cancer: association with tumor suppression. Bmc Cancer. 2012;12. doi:10.1186/1471-2407-12-239
48. Chen CY, Lin YS, Chen CH, Chen YJ. Annexin A2-mediated cancer progression and therapeutic resistance in nasopharyngeal carcinoma. J Biomed Sci. 2018;25. doi:10.1186/s12929-018-0430-8
49. Caruso JA, Stemmer PM. Proteomic profiling of lipid rafts in a human breast cancer model of tumorigenic progression. Clin Exp Metastasis. 2011;28(6):529–540. doi:10.1007/s10585-011-9389-5
50. Wolfson E, Goldenberg M, Solomon S, Frishberg A, Pinkas-Kramarski R. Nucleolin-binding by ErbB2 enhances tumorigenicity of ErbB2-positive breast cancer. Oncotarget. 2016;7(40):65320–65334. doi:10.18632/oncotarget.11323
51. El Ayed M, Bonnel D, Longuespee R, et al. MALDI imaging mass spectrometry in ovarian cancer for tracking, identifying, and validating biomarkers. Med Sci Monit. 2010;16(8):BR233–BR245.
52. Leygue E, Snell L, Dotzlaw H, et al. Lumican and decorin are differentially expressed in human breast carcinoma. J Pathol. 2000;192(3):313–320. doi:10.1002/1096-9896(200011)192:3<313::AID-PATH694>3.0.CO;2-B
53. Gutierrez C, Schiff R. HER2: biology, detection, and clinical implications. Arch Pathol Lab Med. 2011;135(1):55–62. doi:10.5858/2010-0454-RAR.1
54. Perez EA, Cortes J, Gonzalez-Angulo AM, Bartlett JMS. HER2 testing: current status and future directions. Cancer Treat Rev. 2014;40(2):276–284. doi:10.1016/j.ctrv.2013.09.001
55. Leyland-Jones B, Smith BR. Serum HER2 testing in patients with HER2-positive breast cancer: the death knell tolls. Lancet Oncol. 2011;12(3):286–295. doi:10.1016/S1470-2045(10)70297-7
56. Graveel CR, Calderone HM, Westerhuis JJ, Winn ME, Sempere LF. Critical analysis of the potential for microRNA biomarkers in breast cancer management. Breast Cancer Target. 2015;7:59–79.
57. Ahlgren S, Wallberg H, Tran TA, et al. Targeting of HER2-expressing tumors with a site-specifically 99mTc-labeled recombinant affibody molecule, ZHER2:2395, with C-terminally engineered cysteine. J Nucl Med. 2009;50(5):781–789. doi:10.2967/jnumed.108.056929
58. Maeda H, Wu J, Sawa T, Matsumura Y, Hori K. Tumor vascular permeability and the EPR effect in macromolecular therapeutics: a review. J Control Release. 2000;65(1–2):271–284. doi:10.1016/S0168-3659(99)00248-5
 © 2021 The Author(s). This work is published and licensed by Dove Medical Press Limited. The full terms of this license are available at https://www.dovepress.com/terms.php and incorporate the Creative Commons Attribution - Non Commercial (unported, v3.0) License.
By accessing the work you hereby accept the Terms. Non-commercial uses of the work are permitted without any further permission from Dove Medical Press Limited, provided the work is properly attributed. For permission for commercial use of this work, please see paragraphs 4.2 and 5 of our Terms.
© 2021 The Author(s). This work is published and licensed by Dove Medical Press Limited. The full terms of this license are available at https://www.dovepress.com/terms.php and incorporate the Creative Commons Attribution - Non Commercial (unported, v3.0) License.
By accessing the work you hereby accept the Terms. Non-commercial uses of the work are permitted without any further permission from Dove Medical Press Limited, provided the work is properly attributed. For permission for commercial use of this work, please see paragraphs 4.2 and 5 of our Terms.