")
Back to Journals » Neuropsychiatric Disease and Treatment » Volume 15
2D-DIGE as a strategy to identify serum protein biomarkers to monitor pharmacological efficacy in dopamine-dictated states of Parkinson’s disease and schizophrenia
Authors Gupta AK, Kumar GK, Rani K, Pokhriyal R, Khan MI, Kumar DR, Goyal V, Tripathi M, Gupta R, Chadda RK, Vanamail P , Mohanty AK, Hariprasad G
Received 17 December 2018
Accepted for publication 19 February 2019
Published 24 April 2019 Volume 2019:15 Pages 1031—1044
DOI https://doi.org/10.2147/NDT.S198559
Checked for plagiarism Yes
Review by Single anonymous peer review
Peer reviewer comments 2
Editor who approved publication: Dr Roger Pinder
Video abstract presented by Gururao Hariprasad.
Views: 546
Ashish Kumar Gupta,1 Gaurav Khunger Kumar,1 Komal Rani,1 Ruchika Pokhriyal,1 Mohd Imran Khan,1 Domada Ratna Kumar,1 Vinay Goyal,2 Manjari Tripathi,2 Rishab Gupta,3 Rakesh Kumar Chadda,3 Perumal Vanamail,4 Ashok Kumar Mohanty,5 Gururao Hariprasad1
1Department of Biophysics, All India Institute of Medical Sciences, New Delhi 110029, India; 2Department of Neurology, All India Institute of Medical Sciences, New Delhi 110029, India; 3Department of Psychiatry, All India Institute of Medical Sciences, New Delhi 110029, India; 4Department of Biostatistics, All India Institute of Medical Sciences, New Delhi 110029, India; 5Proteomics Facility, National Diary Research Institute, Karnal, Haryana 132001, India
Objectives: Parkinson’s disease and schizophrenia are clinical scenarios that occur due to dopaminergic deficit and hyperactivity in the midbrain, respectively. Current pharmacological interventions for these two diseases therefore aim to restore normal dopamine levels in the midbrain. But during therapy, there is a overshooting of dopamine concentrations that result in hallucinations in Parkinson’s disease patients and extra-pyramidal symptoms in schizophrenic patients. This causes a lot of inconvenience to the patents and the clinicians. There are no tests currently available to monitor drug efficacy in these two neuropsychiatric diseases.
Materials and methods: Parkinson’s disease and schizophrenic naïve patients were recruited. Serum proteins isolated from these two clinical phenotypes were labeled with fluorescent cyanine dyes and analyzed by two-dimensional difference in gel electrophoresis proteomic experiment. Differentially expressed spots that had consistent expression pattern across five sets of biological replicate gels were trypsin digested and subjected to mass spectrometric analysis for protein identification. Validation experiments were done for the identified proteins using antibody-based assay on a patient cohort that included naïve, treated, and those who had side effects.
Results: Serum α- and β-globin chains were identified as differentially expressed proteins having threefold higher expressions in Parkinson’s patients as compared to schizophrenia. Interestingly, concentrations of these two proteins had an inverse correlation across clinical phenotypes in the dopaminergic spectrum. RBC contamination as a source for these proteins was ruled out.
Conclusion: There is a clear association of free serum globin with dopaminergic clinical states. This lays a platform for protein biomarker–based monitoring of pharmacological efficacy in Parkinson’s disease and schizophrenia.
Keywords: Parkinson’s disease, schizophrenia, gel-based proteomics, biomarkers, dopamine, pharmacological efficacy, difference gel electrophoresis
Introduction
Parkinson’s disease is a progressive neurodegenerative movement disorder characterized by slowed movements, resting tremors, disturbance of posture, and rigidity.1 Epidemiological studies have shown that its prevalence is approximately 0.3% of the whole population in industrialized nations.2 The estimated incidence of Parkinson’s disease in general population ranges from 1.5 to 26 per 100,000, except in Asian countries where the rate is lower, ie, 1.5–15.0 per 100,000 person-years.3–5 Parkinson disease is an age-related disorder with only 5%–10% of cases classified as young onset.6 The incidence of Parkinson’s disease, as well as the prevalence, also increases with age, with the peak incidence of Parkinson’s disease occurring between 70 and 79 years.7–10
Schizophrenia is a psychotic illness defined by a spectrum of symptoms including breakdown of thought process, deficit of emotions, auditory hallucinations, delusions, confused thoughts and speech.11 The prevalence is 0.3%–0.7% worldwide.12 The occurrence rate is 1.4 times more in males compared to females and typically appears earlier in men.11 For male populations, the peak ages of onset are 20–28 years and for female populations it is 26–32 years.13,14 Neighborhood and cultural variations in the incidence of schizophrenia have been reported and are consistent with classical sociological models of mental disorders.15,16 The WHO reported 20,000 deaths in 2010.17
Parkinson’s disease and schizophrenia are clinically diverse neurological diseases and are at the opposite ends of the dopaminergic activity spectrum in the midbrain. While death of dopamine-generating neurons is responsible for the motor symptoms of Parkinson’s disease, hyper-dopaminergic activity is the cause for the psychotic symptoms of schizophrenia.18 Accordingly, pharmacological medications in Parkinson’s disease and schizophrenia pertain to normalizing the levels of dopamine in the midbrain.19 Dopaminergic drugs in Parkinson’s disease aim to increase the availability of dopamine in the neurons of the midbrain, while anti-dopaminergic drugs reduce the activity of dopamine as a signal between neurons in the midbrain. However, during the course of Parkinson’s disease therapy, the dopamine levels tend to overshoot normal dopamine levels leading to hallucinations that are classical positive symptoms of schizophrenia.20 Likewise, the problem in using neuroleptic drugs in the treatment of schizophrenia is that these drugs lower the levels of dopamine, leading to low dopamine state and extra-pyramidal side effects.21 The problems pertaining to disease manifestation and the side effects resulting from dopamine-based pharmacological interventions have been comprehensively reviewed by our group.22
Currently, there are no laboratory tests available to guide treatment decisions or help predict adverse side effects of the drugs used, and clinicians are forced to rely completely on patient compliance and symptoms to understand the efficacy of the drug. As a result, there is a high chance of overshooting the point of normal dopaminergic state with patients succumbing to side effects, which is a disease at the other end of the dopaminergic spectrum.23 This poses a big challenge to the clinicians, as they get to know of the treatment side effects either from the patient relatives or from the patients themselves.24,25 Over the past few years, researchers have been trying to develop tools that can help in the evaluation of side effects resulting from pharmacotherapy in these two diseases. The investigations of grasping movements provide a sensitive measure to objectively evaluate extra-pyramidal side effects related to antipsychotic therapy.26 In another recent study, three clinical screening tools were used to detect drug-induced Parkinsonism in patients with advanced schizophrenia, but these tools were found to be very inadequate, with a sensitivity of around 60%.27 Parkinson’s disease–related psychosis is not adequately described by the existing criteria for psychotic disorders, and a provisional diagnostic criterion that defines a constellation of clinical features is not shared by other psychotic syndromes.28 However, these clinical parameters have not been fully validated for clinical application and form a starting point for epidemiological and pathophysiological studies.
Biomarkers are biological molecules that can be objectively measured and evaluated and are an indicator of biological processes and pharmacologic response in the human body.29–31 Clinical proteomics–based biomarker discoveries have gained substantial significance in both basic and clinical research and has already had a commendatory impact in many branches of medicine including neurology.32–34 While there have been a number of protein biomarkers for diagnosis or prognosis of Parkinson’s disease and schizophrenia, there has been no study to develop protein biomarkers to monitor drug therapy in these two diseases.35–39 In the recent past, our group has been looking into this aspect to provide valuable inputs in terms of protein biomarkers to monitor Parkinson’s disease and schizophrenia therapies.40,41 This makes a search for a reliable biomarker tool, which can assess the effectiveness of treatment responses and optimize pharmacological interventions in Parkinson’s disease and schizophrenia, very important and highly relevant.
The objectives of this study were i) to identify differentially expressed proteins in the naïve states of the two diseases, Parkinson’s and schizophrenia and ii) to validate their expression in clinical states of patients receiving treatment and those having side effects. We carried out two-dimensional difference in gel electrophoresis (2D-DIGE)-based comparative serum proteomic experiments to identify potential biomarkers that can help in precisely defining optimum drug efficacy for pharmacological interventions in the dopamine-dictated clinical states of Parkinson’s disease and schizophrenia. This research work has a translational value that would immensely help neurologists and psychiatrists in the management of patients with Parkinson’s disease and schizophrenia, respectively.
Methods
Ethics, patient selection criteria, and consent
The ethics committee at the All India Institute of Medical Sciences approved the study (reference no: IESC/T-418/26.08.2015), and the procedures followed were in accordance with the ethical standard formulated in the Helsinki declaration. Clinically suspected Parkinson’s disease and schizophrenia patients were screened at the Department of Neurology and Psychiatry, All India Institute of Medical Sciences, New Delhi. Before enrolment into the study, patients were told in detail about the purpose of the research and written informed consent was obtained. Patient names and file numbers were kept confidential and unique identification codes were given. Drug-naïve patients were those who had never undergone pharmacological treatment for the particular disease. Five milliliter of intravenous blood was drawn from the patients in blood collection tubes and then allowed to coagulate. The blood was then centrifuged at 4,000 rpm for 5 minutes at 4°C, and the serum was carefully separated and aliquoted into separate fresh microfuge tubes and stored at −80°C. Extreme care was taken during sample collection to avoid cellular contamination.
Patient inclusion and exclusion criteria
The inclusion criteria from the Unified Parkinson Disease Rating Scale (UPDRS) were used for screening of patients suspected of having Parkinson’s disease. While a score of zero represents no disability, a score of 199 on the UPDRS scale represents complete disability.42 The progress of symptoms in Parkinson’s disease patients was described using the Hoehn and Yahr scale and was graded from stage 1 to stage 5.43 ICD10 was used for diagnosis of schizophrenia.44 Patients with disease and other coexisting diseases or those receiving any other therapeutic interventions, including homeopathy medicines, were excluded.
Proteomics
Total protein from the serum of patients with Parkinson’s disease and schizophrenia was assayed using 2D-DIGE and following are the steps involved in serum DIGE-based proteomics (Figure 1).
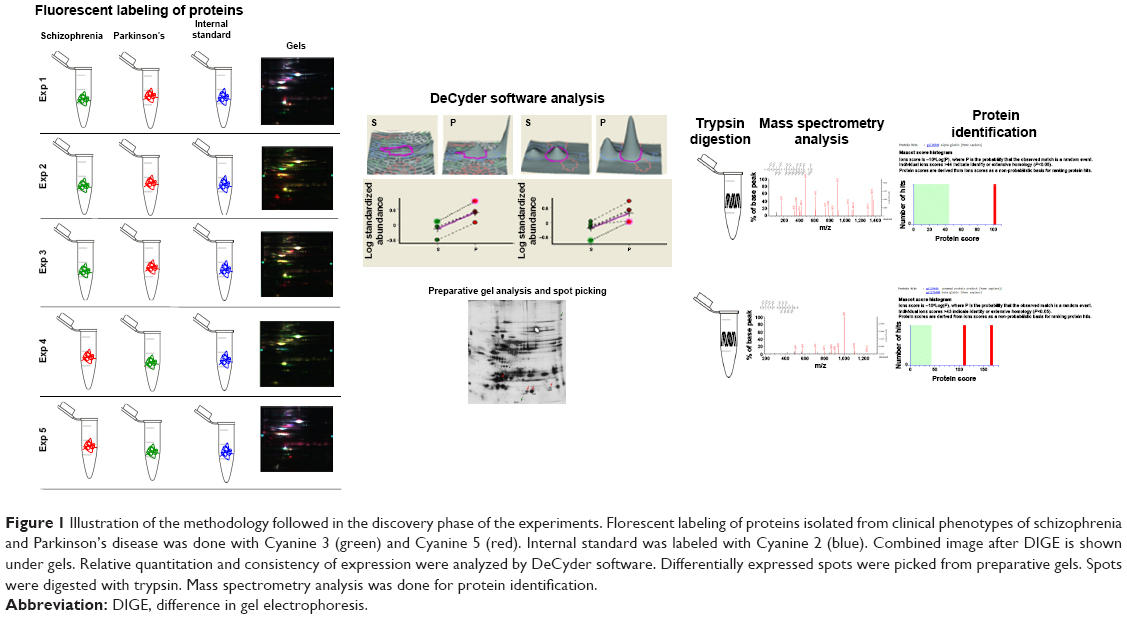 | Figure 1 Illustration of the methodology followed in the discovery phase of the experiments. Florescent labeling of proteins isolated from clinical phenotypes of schizophrenia and Parkinson’s disease was done with Cyanine 3 (green) and Cyanine 5 (red). Internal standard was labeled with Cyanine 2 (blue). Combined image after DIGE is shown under gels. Relative quantitation and consistency of expression were analyzed by DeCyder software. Differentially expressed spots were picked from preparative gels. Spots were digested with trypsin. Mass spectrometry analysis was done for protein identification. |
Sample processing
Individual serum samples were processed with Spintrap™ affinity column kit (GE Healthcare Bio-Sciences Corp., Piscataway, NJ, USA) according to instructions provided with the kit for removal of two high abundant proteins (albumin and IgG). The depleted serum fractions were then treated with 2D Clean Up kit (GE Healthcare) to remove salts and gel-interfering substances. Finally, the precipitate was solubilized in lysis solution (7 M urea, 2 M thiourea, 4% CHAPS). Total protein was quantified using Bradford reagent with bovine serum albumin as standard (GeNei™, Bengaluru, Karnataka, India).
Fluorescent labeling of serum protein
2D-DIGE experiments involve prelabeling of the samples before electrophoresis. Protein samples were labeled using CyDye DIGE fluors (Cy2, Cy3, Cy5) according to minimal labeling protocol provided by the manufacturer (GE Healthcare, Singapore). Five naïve Parkinson’s disease patients and five naïve schizophrenic patients were considered for analytical discovery phase of proteomic experiments (Table 1). Five separate experiments were performed to obtain five analytical replicates. Internal standard that comprised equal amount of protein from the ten samples was labeled using Cy2 dye. Fifty microgram of serum protein from either Parkinson’s disease or schizophrenic patients was labeled with 400 pM of either Cy3 or Cy5 for 40 minutes in dark at 4°C. Dye swapping was done to avoid dye and color bias as shown in Figure 1. L-lysine was used at 10 mM concentration for 10 minutes to quench the labeling reaction. Finally, the labeled protein samples were pooled together and final volume was adjusted to 250 μL with DeStreak™ rehydration solution (GE Healthcare).
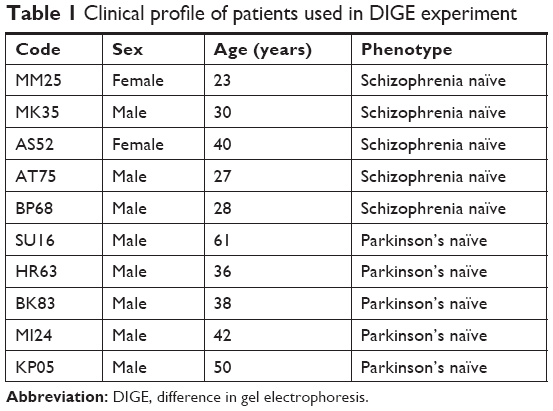 | Table 1 Clinical profile of patients used in DIGE experiment |
IPG strip rehydration
IPG buffer (pH: 3–10) was added to the protein sample and made to a final concentration of 0.5%. The sample was centrifuged at 16,000 g for 2–3 minutes and the suspension was loaded on a reswelling tray (Amersham Biosciences, Piscataway, NJ, USA). Immobiline Dry Gel Strip (13 cm) (IPG strips) of pH range 3–10 was used for isoelectric focusing. After removing the plastic cover on the IPG strip, gel surface was placed over the sample in the tray and submerged with cover fluid. For proper rehydration, the strips were kept overnight for 12–14 hours.
Isoelectric focusing
The rehydrated IPG strip was kept in a strip holder and subjected to isoelectric focusing in an Etan IPGphor 3 IEF systems (GE Healthcare) as per the following program: i) step mode, 200 V for 150 minutes, ii) gradient mode, 1,000 V for 90 minutes, iii) gradient mode, 8,000 V for 150 minutes, iv) step mode, 8,000 V until a total volt hours of 15,500 V hr was achieved. Temperature was set at 20°C, and during the run, strips were fully covered with mineral oil.
SDS PAGE
After the first dimension, each electro-focused strip was equilibrated in SDS equilibration buffer containing 50 mM Tris–HCl (pH 8.8), 6 M urea, 30% glycerol, 2% SDS, 0.02% bromophenol blue. The strip was first equilibrated for 15 minutes with 0.05% dithiothreitol prepared in 5 mL of SDS equilibration buffer at room temperature. The solution was discarded carefully and replaced with 1.25% iodoacetamide solution prepared in 5 mL SDS equilibration buffer for 15 minutes at room temperature. After equilibration, the strip was then transferred onto 12.5% homogeneous polyacrylamide gel casted on a SE 600 Ruby apparatus (Amersham Biosciences). Air bubbles were removed and the strip was sealed with PROTEAN® plus overlay agarose. Separation in SDS-PAGE was carried out with constant voltage set at 60 V for 60 minutes, followed by 100 V at 20°C till the bromophenol blue dye front was out of the gel. Five such gels were run as five biological replicates.
Image acquisition and analysis
Typhoon TRIO Variable Mode Imager (GE Healthcare) was used to visualize the labeled proteins. Cy2, Cy3, and Cy5 images were scanned at 488 nm/520 nm, 532 nm/580 nm, and 633 nm/670 nm, respectively. A photomultiplier tube (PMT) setting of 490–520 V with 200 μm/pixel resolution with high sensitivity was used to scan the gels. The scanned images were cropped to remove areas extraneous to the gel image using Image-Quant™ v 5.5 (Amersham Biosciences). DeCyder™ 2D version 7.0 (GE Healthcare) was used to process and analyze the gel images. The DeCyder differential in gel analysis (DIA) module was used for comparison of intensities of specific protein spots between samples with the internal standard within the same gel. The maximum number of spots was set to 2,500 for each co-detection procedure. The protein spots were co-detected and quantified automatically as 2-D DIGE image pairs, consequently linking the samples to its in-gel standard. Biological variation analysis (BVA) workspace was used to analyze the DIA workspaces. In BVA workspace, each Cy3 or Cy5 gel image was assigned a clinical phenotype, either Parkinson’s disease or schizophrenia, and the Cy2 images were classified as internal standards. The gel with the maximum spot count was classified as the master gel. In-gel standard from each image pair was used for matching between gels. Land marking was done in the gel images to accurately determine matching, and the potential spots of interest were manually confirmed. Statistical analysis was done using Student’s t-test for each matched spot set by comparing the mean and SD of protein abundance for a given protein spot.
Mass spectrometric analysis and protein identification
A total of 600 μg of pooled protein sample was used for preparative gel and stained for visualization with mass compatible silver stain (G Biosciences). Matched spots of interest were manually picked from the preparative gel. In-gel trypsinization was done overnight according to the manufacturer’s protocol (Promega Corporation, Fitchburg, WI, USA). Digestion buffer containing the peptides was obtained. A total of 100 μL of 50% acetonitrile in 1% formic acid was used to remove the additional peptides. After peptide extraction, the fractions were pooled and vacuum-dried. The peptide extract was resuspended in 20 μL of 50% acetonitrile and 0.1% trifluoroacetic acid (TFA). The resuspended peptides were mixed with α-cyano-4-hydroxycinnamic acid in a ratio of 1:1 and spotted on the matrix assisted laser desorption/ionization (MALDI) plate. MALDI data was obtained automatically over a mass range of 800–3,500 kDa in the reflector ion mode on an AB (Applied Biosystems) 4800 MALDI-TOF/TOF analyzer with 4,000 series explorer v3.5 software, using fixed laser intensity for 1,500 shots/spectrum, with a uniformly random spot search pattern. Collision energy is determined by the potential difference between acceleration voltage and floating collision cell, which was 1 KeV for all experiments. Air as collision gas was used such that nominally single collision was achieved. From each MS spectrum, the ten most abundant MS peaks were selected for MS/MS using an acquisition method that excludes ions with S/N less than 50, and which filtered out identical peaks detected in adjacent spots, selecting only the strongest precursor. To achieve the maximum signal intensity for low-abundance peptides, the precursor ions with the weakest S/N were first acquired. 1 KV MS/MS operating mode was employed; the relative precursor mass window was fixed at 250 (full width half mass), with metastable suppression enabled. Using fixed laser intensity, MS/MS acquisition of selected precursor was set to a maximum of 1,250 shots with 50 shots per sub-spectrum. The stop-condition criteria were fixed to a minimum of 100 S/N on more than seven peaks within the spectrum after a minimum of 1,000 shots. Peptide masses were searched with the MASCOT search engine against the NCBI nr human database for protein identification. A significant Mascot probability score (score >40; P<0.05) was set as a criterion for positive identification.
ELISA
The concentrations of α- and β-globins in serum were estimated using ELISA kits procured from Qayee-Bio (Shanghai, China) as per the manufacturer’s protocol. A standard curve was plotted and the serum concentrations of α- and β-globins were extrapolated from the graph using Graphpad PRISM (v6.01).
Statistical analysis
The statistical analysis of the data obtained was done using SPSS IBM version 20.0 (version 20.0; IBM Corporation, Armonk, NY, USA). Non-parametric Kruskal–Wallis test was done to compare serum globin concentrations among all the patient groups. Dunn’s test as a post hoc test was done to compare differences in each group. Chi-square test was used to compare frequencies of categorical variables. Bivariate spearman rank correlation coefficient was calculated to determine any significant correlation between the study variables. A two-sided probability of P<0.05 was considered as being statistically significant for all the tests. The values for area under the curve and the receiver operating characteristics (ROC) curve were obtained by numerical regression of the ROC curve.
Results
Clinical profile
The demographic and patient profiles of the serum samples used in DIGE, the discovery phase of the experiment and ELISA, and the validation phase of the experiment are highlighted in Tables 1 and 2. In case of sex distribution, the numbers are as per the fact that the incidence of these two dopamine-dictated clinical states largely affects the male population.45 As evident from these tables, the mean age of Parkinson’s disease patients was one and a half times more than that of schizophrenic patients. It should be noted that the incidence of Parkinson’s disease rapidly increased above the age of 60 years,2 whereas the incidence of schizophrenia was 16–25 years.46 The age was considered a factor that could affect protein expression and has been addressed by a statistical analysis that is discussed in subsequent paragraphs. The serum from healthy individuals was not considered for the study as they are not biologically on par with patients who are recovering from a neurological disease after medical intervention. The details of patients who presented with drug side effects are provided in Table 3. Drug-induced psychosis in Parkinson’s disease and drug-induced Parkinson’s disease in schizophrenia are well highlighted.
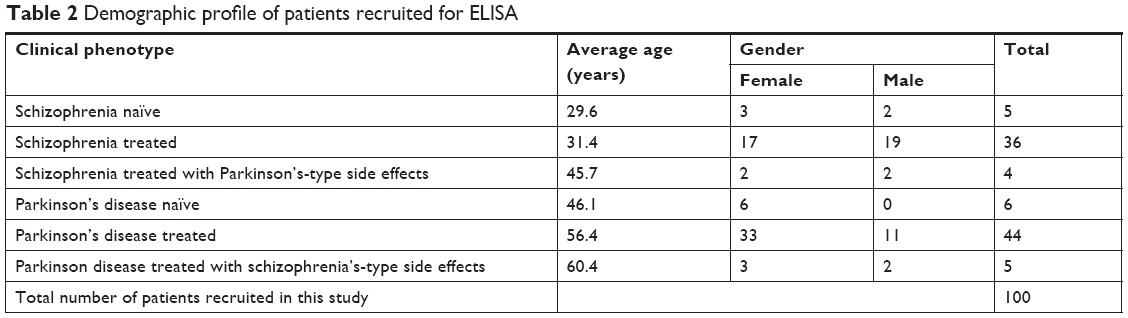 | Table 2 Demographic profile of patients recruited for ELISA |
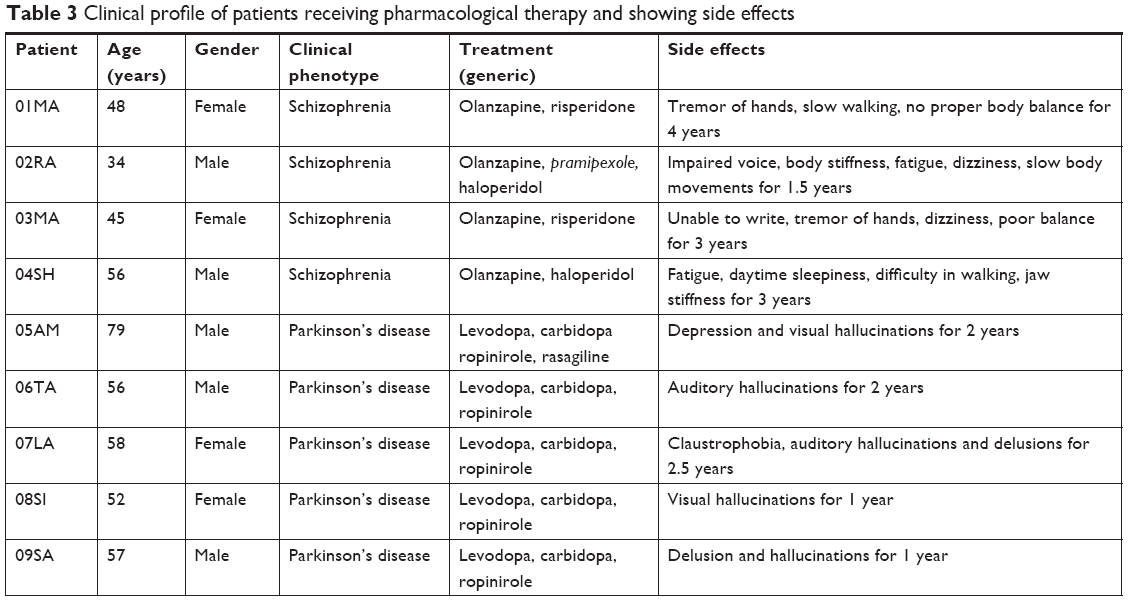 | Table 3 Clinical profile of patients receiving pharmacological therapy and showing side effects |
DIGE
Serum samples were depleted of albumin and globulin using an antibody-based affinity column. The eluted fractions on SDS-PAGE showed a decrease in the intensity of albumin and globulin bands and an increase in the intensity of rest of the proteins (Figure S1). Five sets of DIGE experiment were performed with the serum samples to delineate differential protein expression pattern (Figure 2). Three different gel images corresponding to the three protein samples of Parkinson’s disease, schizophrenia, and internal standard were generated for each gel. These 15 images so obtained were analyzed by the DeCyder software to mark differentially expressed proteins. Cy2-labeled gel image that had highest number of spots was assigned as master gel by DeCyder software. An average of 1,840 spots was observed on each 2D-DIGE gel. Proteins that were expressed to the same extent showed up as white-colored spots, whereas those that were expressed differentially showed up as either red- or green-colored spots. Of these, two spots were found with an average ratio of ±3.0, in all the five gels, using BVA module of DeCyder software (Student’s t-test, P-value <0.05). The magnified region of the gel showing these spots is depicted in Figure 3. The protein spots were differentiated from an artifact using 3D view mode on DeCyder. The two protein spot intensities were represented as well-defined cones with a circular base and a summit, with a consistent presence across all the five gels (Figure 4). A preparative gel with 600 μg protein was run; spots were matched with the analytical gels and picked for identification. Mass spectrometric analysis identified the two spots as α- and β-globin chains. The identification profile parameters and differential expression of these spots are given in Table 4 and their snapshots are shown in Figures S2 and S3.
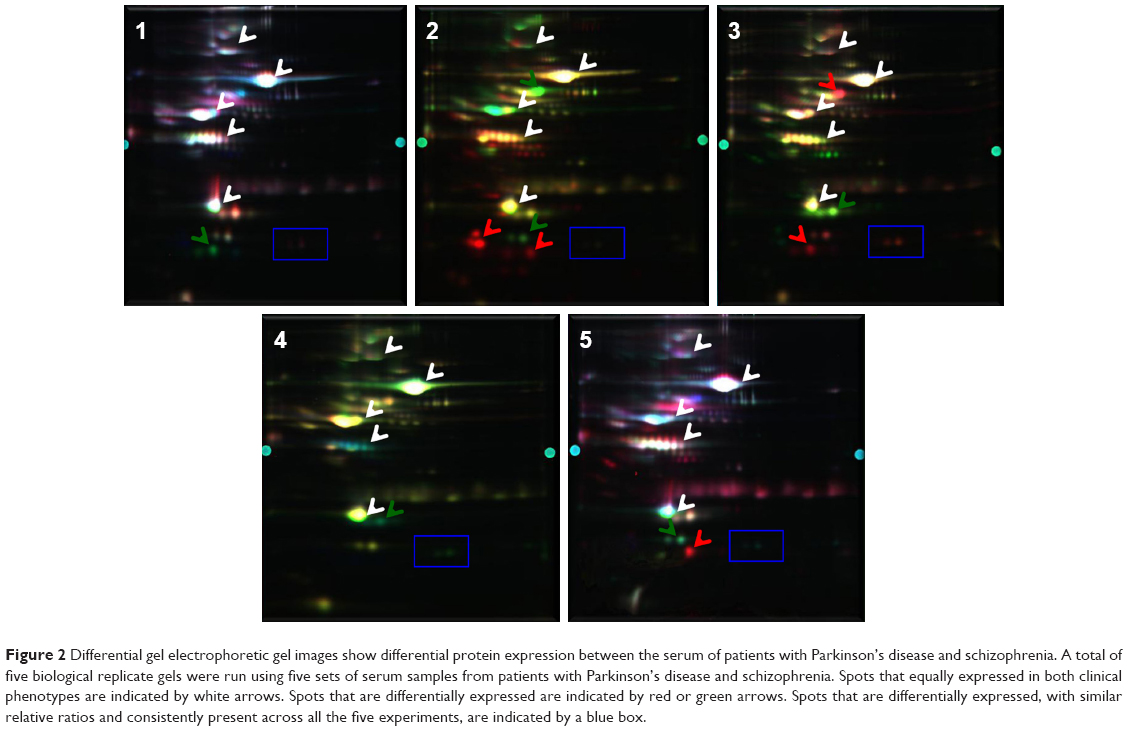 | Figure 2 Differential gel electrophoretic gel images show differential protein expression between the serum of patients with Parkinson’s disease and schizophrenia. A total of five biological replicate gels were run using five sets of serum samples from patients with Parkinson’s disease and schizophrenia. Spots that equally expressed in both clinical phenotypes are indicated by white arrows. Spots that are differentially expressed are indicated by red or green arrows. Spots that are differentially expressed, with similar relative ratios and consistently present across all the five experiments, are indicated by a blue box. |
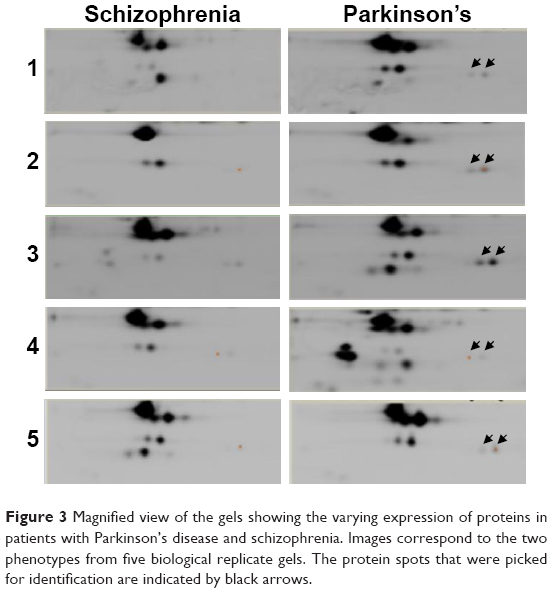 | Figure 3 Magnified view of the gels showing the varying expression of proteins in patients with Parkinson’s disease and schizophrenia. Images correspond to the two phenotypes from five biological replicate gels. The protein spots that were picked for identification are indicated by black arrows. |
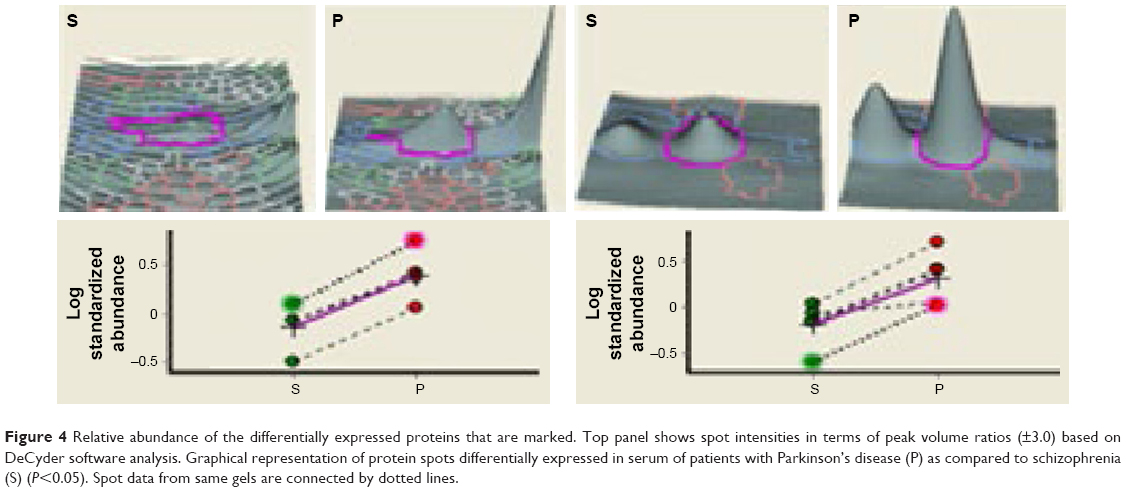 | Figure 4 Relative abundance of the differentially expressed proteins that are marked. Top panel shows spot intensities in terms of peak volume ratios (±3.0) based on DeCyder software analysis. Graphical representation of protein spots differentially expressed in serum of patients with Parkinson’s disease (P) as compared to schizophrenia (S) (P<0.05). Spot data from same gels are connected by dotted lines. |
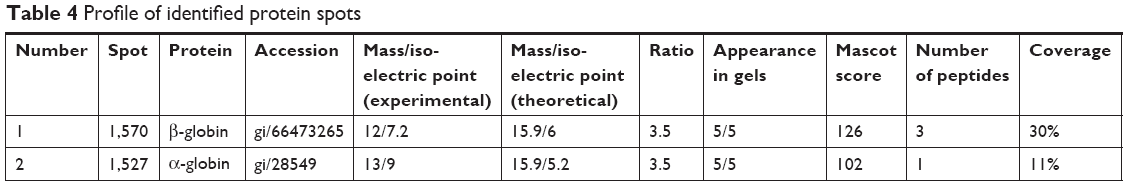 | Table 4 Profile of identified protein spots |
Validation of α- and β-globins as potential pharmacotherapeutic biomarkers for Parkinson’s disease and schizophrenia
The expressions of α- and β-globin were validated by ELISA to determine the concentrations of α- and β-globin across the six groups of patients who were naïve, treated, and who had Parkinson’s disease and schizophrenia with side effects. The expression of both α- and β-globin was significantly higher in naïve Parkinson’s disease patients compared to naïve schizophrenic patients. In addition, the expressions of both α- and β-globin were significantly higher in patients treated for Parkinson’s disease than in those treated for schizophrenia. Disease scoring, gender, and age had no effect on the expressions of α- and β-globin (Tables 5 and 6). The graphical representations of the ELISA studies are shown in Figure 5. β- and α-globin chains showed a threefold overexpression in the serum proteome of drug-naïve Parkinson’s disease patients as compared to drug-naïve schizophrenic patients. The concentrations of both proteins inversely correlated with mid-brain dopamine concentrations across the clinical phenotypes comprising of Parkinson’s disease naïve, Parkinson’s treated, Parkinson’s treated with schizophrenic side effects, schizophrenia treated with Parkinson’s disease-like side effects, schizophrenia treated and schizophrenia naïve patients, who represent a clinical spectrum resulting from a low to a high mid-brain dopamine concentration. The slopes of the two linear trend lines were −1.12 and −0.9, respectively, with R2 values of 0.86 and 0.81, respectively. The area under the curve and ROC curves were plotted to derive cut-off values that could differentiate the two clinical states with reasonable accuracy as shown in Table 7. The concentrations of globin chains were plotted against the duration of pharmacological intervention (Figure 6). Western blot analysis was carried out using an antibody against bisphosphoglycerate mutase, an enzyme that is expressed in high concentrations in RBC (Figure 7). This experiment was done to rule out any RBC contamination. Results showed a complete absence of signal in any of the samples.
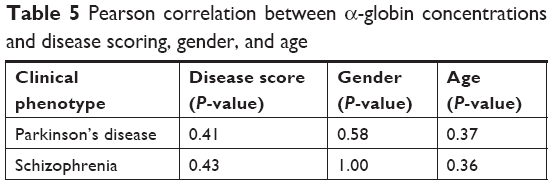 | Table 5 Pearson correlation between α-globin concentrations and disease scoring, gender, and age |
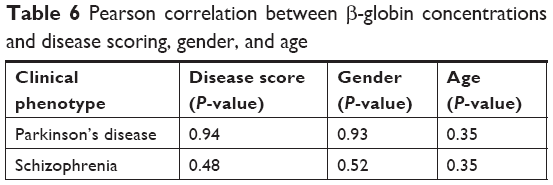 | Table 6 Pearson correlation between β-globin concentrations and disease scoring, gender, and age |
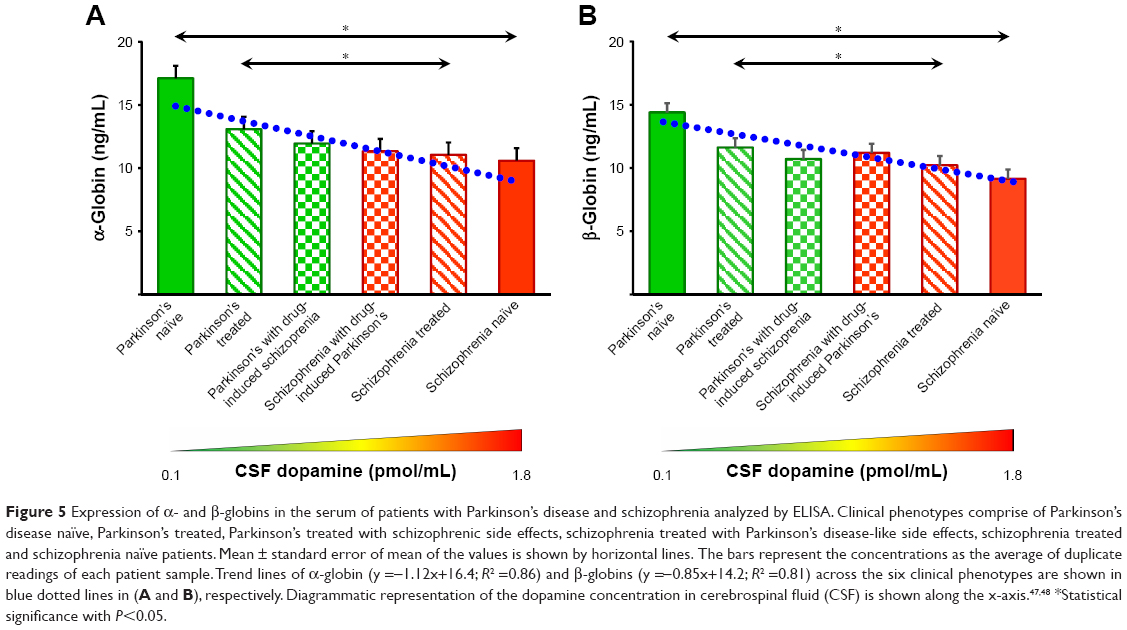 | Figure 5 Expression of α- and β-globins in the serum of patients with Parkinson’s disease and schizophrenia analyzed by ELISA. Clinical phenotypes comprise of Parkinson’s disease naïve, Parkinson’s treated, Parkinson’s treated with schizophrenic side effects, schizophrenia treated with Parkinson’s disease-like side effects, schizophrenia treated and schizophrenia naïve patients. Mean ± standard error of mean of the values is shown by horizontal lines. The bars represent the concentrations as the average of duplicate readings of each patient sample. Trend lines of α-globin (y =−1.12x+16.4; R2 =0.86) and β-globins (y =−0.85x+14.2; R2 =0.81) across the six clinical phenotypes are shown in blue dotted lines in (A and B), respectively. Diagrammatic representation of the dopamine concentration in cerebrospinal fluid (CSF) is shown along the x-axis.47,48 *Statistical significance with P<0.05. |
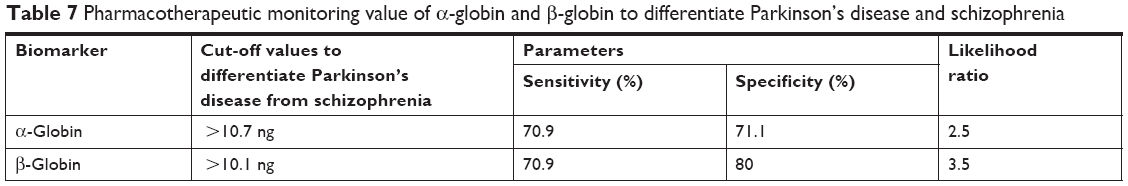 | Table 7 Pharmacotherapeutic monitoring value of α-globin and β-globin to differentiate Parkinson’s disease and schizophrenia |
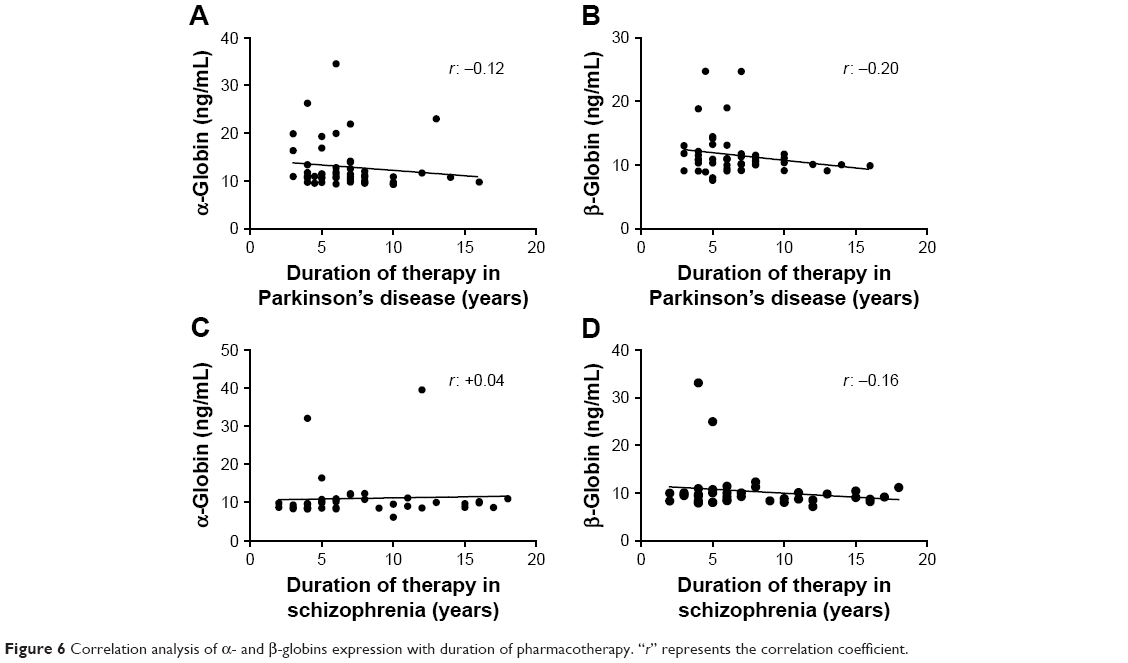 | Figure 6 Correlation analysis of α- and β-globins expression with duration of pharmacotherapy. “r” represents the correlation coefficient. |
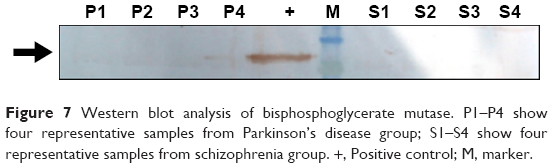 | Figure 7 Western blot analysis of bisphosphoglycerate mutase. P1–P4 show four representative samples from Parkinson’s disease group; S1–S4 show four representative samples from schizophrenia group. +, Positive control; M, marker. |
Discussion
A total of 100 patients with Parkinson’s disease and schizophrenia were recruited in the neurology and psychiatry outpatient department to procure serum samples. The patients included naïve and those treated by pharmacological interventions and those who had side effects due to medications. The naïve patients in the two clinical phenotypes represented two extreme end points of dopamine spectrum. Although samples from five naïve Parkinson’s disease patients and from five naïve schizophrenic patients were taken for discovery phase of DIGE experiments, all the 100 samples were considered for the validation phase of the experiment by ELISA.
Serum samples as a tissue for biomarker discovery has its own advantages: easy accessibility, non-invasiveness, and the ease of procedure. By contrast, serum samples also contain enormous amounts of albumin and immunoglobulin.49–51 2D-DIGE experiments were performed on serum proteins after depleting albumin and IgG to improve the resolution of the spots on the gels. To our knowledge, this is the first report on the DIGE analysis of the serum proteome of these two dopamine-related pathologies, Parkinson’s disease and schizophrenia. The relative difference in expression and consistency in variation across the biological replicates prompted the identification of two spots by mass spectrometric analysis as globin chains of hemoglobin. Validation by ELISA confirmed the differential expression and, interestingly, showed linearity with respect to dopaminergic spectrum. The slope and R2 values signified the extent and quality of correlation between the globin concentrations across the dopaminergic spectrum. The serum α-globin with a cut-off value of 10.7 ng/mL and serum β-globin with a cut-off value 10.1 ng/mL were shown to differentiate patients in the Parkinson’s disease domain from patients in the schizophrenic domain with a sensitivity and specificity of at least 70%. These values could be considered as possible indicators for impending side effects for patients receiving pharmacological therapy. Therefore, this appears to be the significant period for a clinician to alter the dose of the drug, change the medication, stop the medication, or return to alternate treatment remedies. Given the possible heterogeneity of patients with respect to the quality of pharmacological intervention, duration of therapy, patients’ compliance, and personal habits, the results are very encouraging with regard to the possible utility of these proteins to monitor drug efficacy. Although no strong conclusions could be drawn, the correlations of globin concentrations against the duration of therapy suggested that an interesting level of variation in globin chain concentrations was observed in both diseases. These results are consistent with the results of previous findings that showed a decreased β-globin levels in the serum of Parkinson’s disease patients receiving levodopa as a pharmacological therapy.52
Bisphosphoglycerate mutase is an enzyme unique to erythrocytes and is involved in the conversion of 1,3-bisphosphoglycerate, which is formed as an intermediate in glycolysis, into 2, 3 bisphosphoglycerate, which is used for oxygen transport.53 The absence of any signal for this protein in the Western blot experiment and because standard operating procedures were followed in procuring, storing, and processing of the serum samples, there is no possibility that the presence of these globin chains was due to in vitro RBC contamination. The results, therefore, provide sufficient evidence for the varying expressions of free circulating α- and β-globins across the mid-brain dopaminergic clinical spectrum. The plausible explanations for these findings are described by two observations. Firstly, Parkinson’s disease is closely related to oxidative stress in midbrain.54 There is an increased production of reactive oxygen species along with upregulation of anti-oxidative defense mechanisms in the systemic circulation in Parkinson’s disease, thereby indicating a strong correlation between chronic neurological oxidative stress and systemic reaction.55 By contrast, schizophrenic patients show a decreased production of anti-oxidative pathway molecules.56 Secondly, Parkinson’s disease has systemic manifestations that are reflected by an upregulation of inflammatory pathways.57 Whereas in schizophrenia, the inflammatory response is blunted as shown by the decreased production of cytokines.58 These two biological phenomena of oxidative stress and inflammation affect RBCs that lead to dysfunctional cells and hemolysis, which is the primary source of free serum hemoglobin.59,60 Though neuronal hemoglobin is expressed in the substantia nigra of patients with Parkinson’s disease, it highly is unlikely that the globin chains identified in this study corresponded to the neurological counterpart.61,62
Limitations
The limitations of the study and possible reasons for these limitations are as follows: i) a small sample size, which is due to difficulty in recruiting patients with the required criteria at a tertiary health care institute and ii) the identification of high abundant proteins is a limitation that is inherent to a gel-based proteomics approach for biomarker discovery.
Conclusion
2D-DIGE proteomics is an ideal platform to compare differential protein expression across the dopaminergic clinical spectrum of Parkinson’s disease and schizophrenia. α- and β-globin chains are found to be differentially expressed with a threefold higher expression in patients with Parkinson’s disease compared to those with schizophrenia. The expressions of these two proteins also correlate with the severity of the disease and duration of the treatment. The inverse relationship between globin expression and dopamine concentration in the brain holds value as a translational tool in the therapeutics of Parkinson’s disease; a dopamine-deficient state of brain, and schizophrenia; a dopamine-excessive state of brain. To our knowledge, this is the first study to compare the serum proteome of Parkinson’s disease and schizophrenia for identification of biomarkers to aid pharmacotherapy. Monitoring the concentrations of these two serum proteins should now be a useful translational tool for clinicians to efficiently and effectively treat Parkinson’s disease and schizophrenia.
Acknowledgment
GH acknowledges the Department of Science and Technology, Government of India, for the grant SB/SO/BB-0122/2013.
Disclosure
The authors report no conflicts of interest in this work.
References
de Lau LM, Breteler MM. Epidemiology of Parkinson’s disease. Lancet Neurol. 2006;5(6):525–535. doi:10.1016/S1474-4422(06)70471-9 | ||
Nussbaum RL, Ellis CE. Alzheimer’s disease and Parkinson’s disease. N Engl J Med. 2003;348(14):1356–1364. Erratum in: N Engl J Med. 2003;348(25):2588. DOI:10.1056/NEJM2003ra020003. | ||
Twelves D, Perkins KS, Counsell C. Systematic review of incidence studies of Parkinson’s disease. Mov Disord. 2003;18(1):19–31. doi:10.1002/mds.10305 | ||
Von Campenhausen S, Bornschein B, Wick R, et al. Prevalence and incidence of Parkinson’s disease in Europe. Eur Neuropsychopharmacol. 2005;15(4):473–490. doi:10.1016/j.euroneuro.2005.04.007 | ||
Muangpaisan W, Hori H, Brayne C. Systematic review of the prevalence and incidence of Parkinson’s disease in Asia. J Epidemiol. 2009;19(6):281–293. | ||
Van Den Eeden SK, Tanner CM, Bernstein AL, et al. Incidence of Parkinson’s disease: variation by age, gender, and race/ethnicity. Am J Epidemiol. 2003;157(11):1015–1022. | ||
Pringsheim T, Jette N, Frolkis A, et al. The prevalence of Parkinson’s disease: a systematic review and meta-analysis. Mov Disord. 2014;29(13):1583–1590. doi:10.1002/mds.25945 | ||
Driver JA, Logroscino G, Gaziano JM, Kurth T. Incidence and remaining lifetime risk of Parkinson disease in advanced age. Neurology. 2009;72(5):432–438. doi:10.1212/01.wnl.0000341769.50075.bb | ||
de Lau LM, Giesbergen PC, de Rijk MC, et al. Incidence of parkinsonism and Parkinson disease in a general population: the rotterdam study. Neurology. 2004;63(7):1240–1244. | ||
Bennett DA, Beckett LA, Murray AM, et al. Prevalence of parkinsonian signs and associated mortality in a community population of older people. N Engl J Med. 1996;334(2):71–76. doi:10.1056/NEJM199601113340202 | ||
Picchioni MM, Murray RM. Schizophrenia. BMJ. 2007;335(7610):91–95. doi:10.1136/bmj.39227.616447.BE | ||
van Os J, Kapur S. Schizophrenia. Lancet. 2009;374(9690):635–645. doi:10.1016/S0140-6736(09)60995-8 | ||
Castle D, Wessely S, Der G, Murray RM. The incidence of operationally defined schizophrenia in Camberwell, 1965–84. Br J Psychiatry. 1991;159:790–794. | ||
Kumra S, Shaw M, Merka P, Nakayama E, Augustin R. Childhood-onset schizophrenia: research update. Can J Psychiatry. 2001;46(10):923–930. doi:10.1177/070674370104601004 | ||
Jablensky A, Sartorius N, Ernberg G, et al. Schizophrenia: manifestations, incidence and course in different cultures. A World Health Organization ten-country study. Psychol Med Monogr. 1992;20:1–97. doi:10.1017/S0264180100000904 | ||
Kirkbride JB, Fearon P, Morgan C, et al. Neighbourhood variation in the incidence of psychotic disorders in Southeast London. Soc Psychiatry Psychiatr Epidemiol. 2007;42(6):438–445. doi:10.1007/s00127-007-0193-0 | ||
Lozano R, Naghavi M, Foreman K, et al. Global and regional mortality from 235 causes of death for 20 age groups in 1990 and 2010: a systematic analysis for the global burden of disease study 2010. Lancet. 2012;380(9859):2095–2128. doi:10.1016/S0140-6736(12)61728-0 | ||
Xia R, Mao ZH. Progression of motor symptoms in Parkinson’s disease. Neurosci Bull. 2012;28(1):39–48. doi:10.1007/s12264-012-1050-z | ||
Birtwistle J, Baldwin D. Role of dopamine in schizophrenia and Parkinson’s disease. Br J Nurs. 1998;7(14):832–834, 836, 838–841. doi:10.12968/bjon.1998.7.14.5636. | ||
Yabe I, Ohta M, Egashira T, et al. Effectiveness of zonisamide in a patient with Parkinson’s disease and various levodopa-induced psychotic symptoms. Neurol Clin Neurosci. 2014;2(6):201–203. doi:10.1111/ncn3.126 | ||
Bohlega SA, Al-Foghom NB. Drug-induced Parkinson`s disease. A clinical review. Neurosciences (Riyadh). 2013;18(3):215–221. | ||
Gupta AK, Swarnkar S, Khunger GK, et al. Dopamine based pharmaco-therapeutics of schizophrenia and Parkinson’s disease: two ends of one spectrum. Ann Pharmacol Pharm. 2017;2017(2):1109. | ||
Fernández CP, Aguilar S, Viçens V, et al. ECT in a patient with Parkinson’s disease and schizophrenia, with dopamine transporter visualization using 123I-ioflupane SPET. J Neural Transm. 2011;118(4):647–650. doi:10.1007/s00702-011-0615-8 | ||
Zahodne LB, Fernandez HH. Pathophysiology and treatment of psychosis in Parkinson’s disease: a review. Drugs Aging. 2008;25(8):665–682. doi:10.2165/00002512-200825080-00004 | ||
Fernandez HH, Trieschmann ME, Friedman JH. Treatment of psychosis in Parkinson’s disease: safety considerations. Drug Saf. 2003;26(9):643–659. doi:10.2165/00002018-200326090-00004 | ||
Nowak DA, Connemann BJ, Alan M, Spitzer M. Sensorimotor dysfunction of grasping in schizophrenia: a side effect of antipsychotic treatment? J Neurol Neurosurg Psychiatry. 2006;77(5):650–657. doi:10.1136/jnnp.2005.084749 | ||
Blanchet PJ, Normandeau L, Rompré PH. Comparing three screening tools for drug-induced parkinsonism in patients with advanced schizophrenia: a pilot study. Schizophr Res. 2012;137(1–3):230–233. doi:10.1016/j.schres.2012.01.013 | ||
Ravina B, Marder K, Fernandez HH, et al. Diagnostic criteria for psychosis in Parkinson’s disease: report of an NINDS, NIMH work group. Mov Disord. 2007;22(8):1061–1068. doi:10.1002/mds.21382 | ||
Hariprasad G, Hariprasad R, Kumar L, et al. Apolipoprotein A1 as a potential biomarker in the ascitic fluid for the differentiation of advanced ovarian cancers. Biomarkers. 2013;18(6):532–541. doi:10.3109/1354750X.2013.822561 | ||
Rukmangadachar LA, Makharia GK, Mishra A, et al. Proteome analysis of the macroscopically affected colonic mucosa of Crohn’s disease and intestinal tuberculosis. Sci Rep. 2016;6:23162. doi:10.1038/srep23162 | ||
Sehrawat U, Pokhriyal R, Gupta AK, et al. Proteomic analysis of advanced ovarian cancer tissue to identify potential biomarkers of responders and nonresponders to first-line chemotherapy of carboplatin and paclitaxel. Biomark Cancer. 2016;16(8):43–56. | ||
Rukmangadachar LA, Kataria J, Hariprasad G, et al. Two-dimensional difference gel electrophoresis (DIGE) analysis of sera from visceral leishmaniasis patients. Clin Proteomics. 2011;8(1):4. doi:10.1186/1559-0275-8-2 | ||
Kataria J, Rukmangadachar LA, Hariprasad G, et al. Two dimensional difference gel electrophoresis analysis of cerebrospinal fluid in tuberculous meningitis patients. J Proteomics. 2011;74(10):2194–2203. doi:10.1016/j.jprot.2011.06.020 | ||
Manral P, Sharma P, Hariprasad G, Chandralekha TM, Srinivasan A. Can apolipoproteins and complement factors be biomarkers of Alzheimer’s disease? Curr Alzheimer Res. 2012;9(8):935–943. | ||
Chahine LM, Stern MB, Chen-Plotkin A. Blood-based biomarkers for Parkinson’s disease. Parkinsonism Relat Disord. 2014;20:S99–S103. doi:10.1016/S1353-8020(13)70025-7 | ||
Sabherwal S, English JA, Föcking M, Cagney G, Cotter DR. Blood biomarker discovery in drug-free schizophrenia: the contribution of proteomics and multiplex immunoassays. Expert Rev Proteomics. 2016;13(12):1141–1155. doi:10.1080/14789450.2016.1252262 | ||
Halperin I, Morelli M, Korczyn AD, et al. Biomarkers for evaluation of clinical efficacy of multipotential neuroprotective drugs for Alzheimer’s and Parkinson’s diseases. Neurotherapeutics. 2009;6(1):128–140. doi:10.1016/j.nurt.2008.10.033 | ||
Lakhan SE, Kramer A. Schizophrenia genomics and proteomics: are we any closer to biomarker discovery? Behav Brain Funct. 2009;5:2. doi:10.1186/1744-9081-5-2 | ||
Sabherwal S, English JA, Focking M, et al. Blood biomarker discovery in drug-free schizophrenia: the contribution of proteomics and multiplex immunoassays. Expert Rev Proteomics. 2016;13(12):1141–1155. doi:10.1080/14789450.2016.1252262 | ||
Hariprasad G, Gupta AK, Pokhriyal RK, et al. Cerebrospinal fluid proteomics for identification of potential biomarkers to monitor pharmacological therapeutic efficacy in dopamine dictated disease states of Parkinson’s disease and schizophrenia. FASEB J. 2018;32(1 Suppl). | ||
Gupta AK, Rani K, Swarnkar S, et al. Evaluation of serum apolipoprotein E as a potential biomarker for pharmacological therapeutic efficacy monitoring in dopamine dictated disease spectrum of schizophrenia and Parkinson’s disease. J Cent Nerv Syst Dis. 2018;10:1–8. doi:10.1177/1179573518803585 | ||
Chou KL, Taylor JL, Patil PG. The MDS–UPDRS tracks motor and non–motor improvement due to sub-thalamic nucleus deep brain stimulation in Parkinson disease. Parkinsonism Relat Disord. 2013;19(11):966–969. doi:10.1016/j.parkreldis.2013.06.010 | ||
Goetz CG, Poewe W, Rascol O, et al. Movement disorder society task force report on the Hoehn and Yahr staging scale: status and recommendation. Mov Disord. 2004;19:1020–1028. doi:10.1002/mds.20213 | ||
Janca A, Ustün TB, Early TS, Sartorius N. The ICD-10 symptom checklist: a companion to the ICD-10 classification of mental and behavioural disorders. Soc Psychiatry Psychiatr Epidemiol. 1993;28(5):239–242. | ||
Loke JH, Harley V, Lee J. Biological factors underlying sex differences in neurological disorders. Int J Biochem Cell Biol. 2015;65:139–150. doi:10.1016/j.biocel.2015.05.024 | ||
Sham PC, MacLean CJ, Kendler KS. A typological model of schizophrenia based on age at onset, sex and familial morbidity. Acta Psychiatr Scand. 1994;89(2):135–141. | ||
Goldstein DS, Holmes C, Sharabi Y. Cerebrospinal fluid biomarkers of central catecholamine deficiency in Parkinson disease and other synucleinopathies. Brain. 2012;35:1900–1913. doi:10.1093/brain/aws055 | ||
Miller C, Kirchmair R, Troger J, et al. CSF of neuroleptic-naive first-episode schizophrenic patients: levels of biogenic amines, substance P, and peptides derived from om chromogranin A (GE-25) and secretogranin II (secretoneurin). Biol Psychiatry. 1996;39(11):911–918. doi:10.1016/0006-3223(95)00098-4 | ||
Roche S, Tiers L, Provansal M, et al. Depletion of one, six, twelve or twenty major blood proteins before proteomic analysis: the more the better? J Proteomics. 2009;72(6):945–951. doi:10.1016/j.jprot.2009.03.008 | ||
Zolotarjova N, Martosella J, Nicol G, et al. Differences among techniques for high-abundant protein depletion. Proteomics. 2005;5(13):3304–3313. doi:10.1002/pmic.200402021 | ||
Steel LF, Trotter MG, Nakajima PB, et al. Efficient and specific removal of albumin from human serum samples. Mol Cell Proteomics. 2003;2(4):262–270. doi:10.1074/mcp.M300026-MCP200 | ||
Sinha A, Patel S, Shukla R, Singh MP. Blood proteome profiling in case controls and Parkinson’s disease patients in Indian population. Clin Chim Acta. 2007;380:232–234. doi:10.1016/j.cca.2007.02.013 | ||
Pritlove DC, Gu M, Boyd CA, Randeva HS, Vatish M. Novel placental expression of 2,3-bisphosphoglycerate mutase. Placenta. 2006;27(8):924–927. doi:10.1016/j.placenta.2005.08.010 | ||
Varçin M, Bentea E, Michotte Y, et al. Oxidative stress in genetic mouse models of Parkinson’s disease. Oxid Med Cell Longev. 2012;2012. | ||
Ilić T, Jovanović M, Jovicić A, Tomović M. Oxidative stress and Parkinson’s disease. Vojnosanit Pregl. 1998;55(5):463–468. | ||
Yao JK, Keshavan MS. Antioxidants, redox signaling, and pathophysiology in schizophrenia: an integrative view. Antioxid Redox Signal. 2011;15(7):2011–2035. doi:10.1089/ars.2010.3603 | ||
Koziorowski D, Tomasiuk R, Szlufik S, Friedman A. Inflammatory cytokines and NT-proCNP in Parkinson’s disease patients. Cytokine. 2012;60(3):762–766. doi:10.1016/j.cyto.2012.07.030 | ||
Müller N, Schwarz MJ. Immune system and Schizophrenia. Curr Immunol Rev. 2010;6(3):213–220. | ||
Sudha K, Rao AV, Rao S, Rao A. Free radical toxicity and antioxidants in Parkinson’s disease. Neurol India. 2003;51(1):60–62. | ||
Pretorius E, Swanepoel AC, Buys AV, et al. Eryptosis as a marker of Parkinson’s disease. Aging (Albany NY). 2014;6(10):788–819. doi:10.18632/aging.100695 | ||
Biagioli M, Pinto M, Cesselli D, et al. Unexpected expression of alpha- and beta-globin in mesencephalic dopaminergic neurons and glial cells. Proc Natl Acad Sci U S A. 2009;106(36):15454–15459. doi:10.1073/pnas.0813216106 | ||
Codrich M, Bertuzzi M, Russo R, et al. Neuronal hemoglobin affects dopaminergic cells’ response to stress. Cell Death Dis. 2017;8(1):e2538. doi:10.1038/cddis.2017.518 |
Supplementary materials
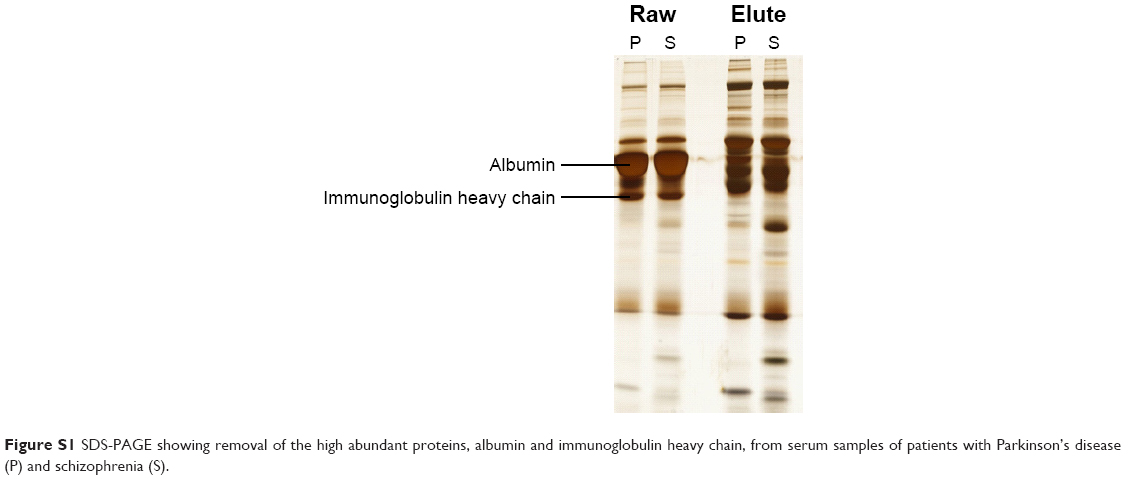 | Figure S1 SDS-PAGE showing removal of the high abundant proteins, albumin and immunoglobulin heavy chain, from serum samples of patients with Parkinson’s disease (P) and schizophrenia (S). |
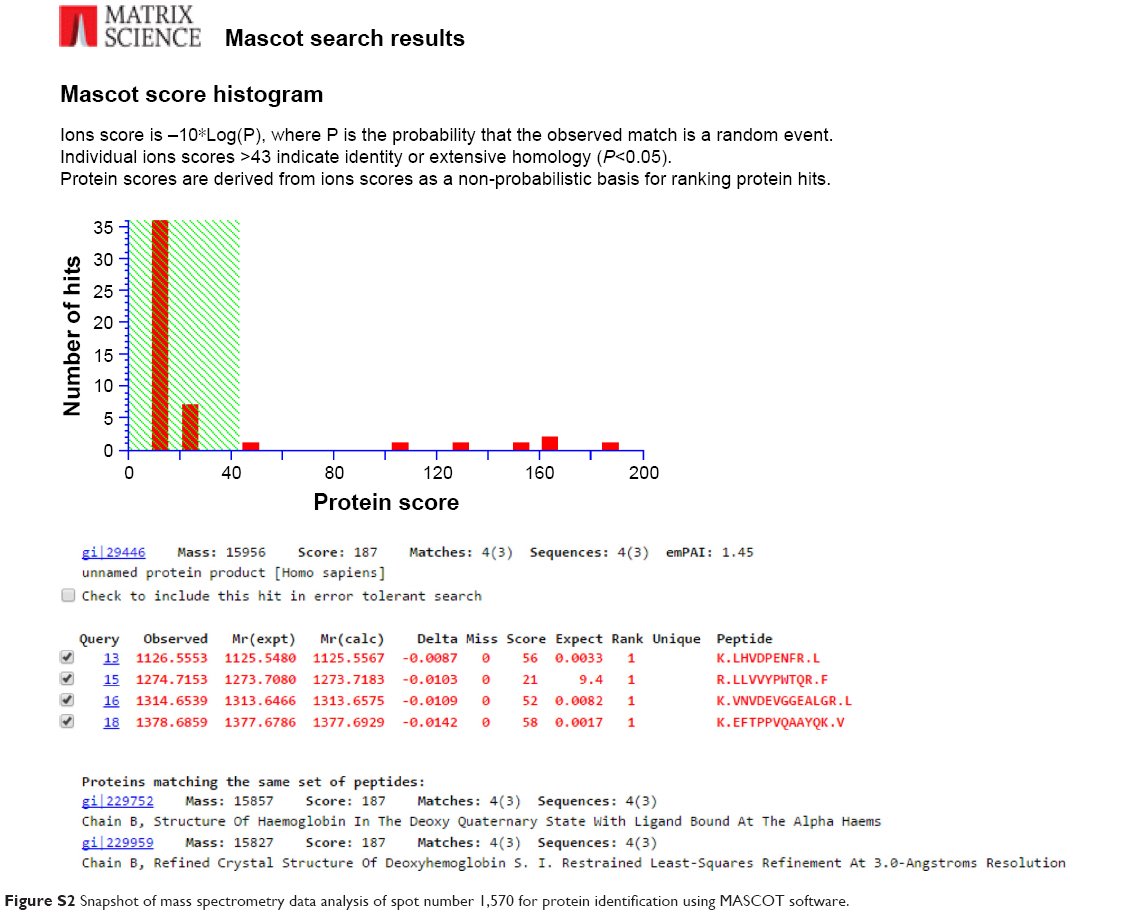 | Figure S2 Snapshot of mass spectrometry data analysis of spot number 1,570 for protein identification using MASCOT software. |
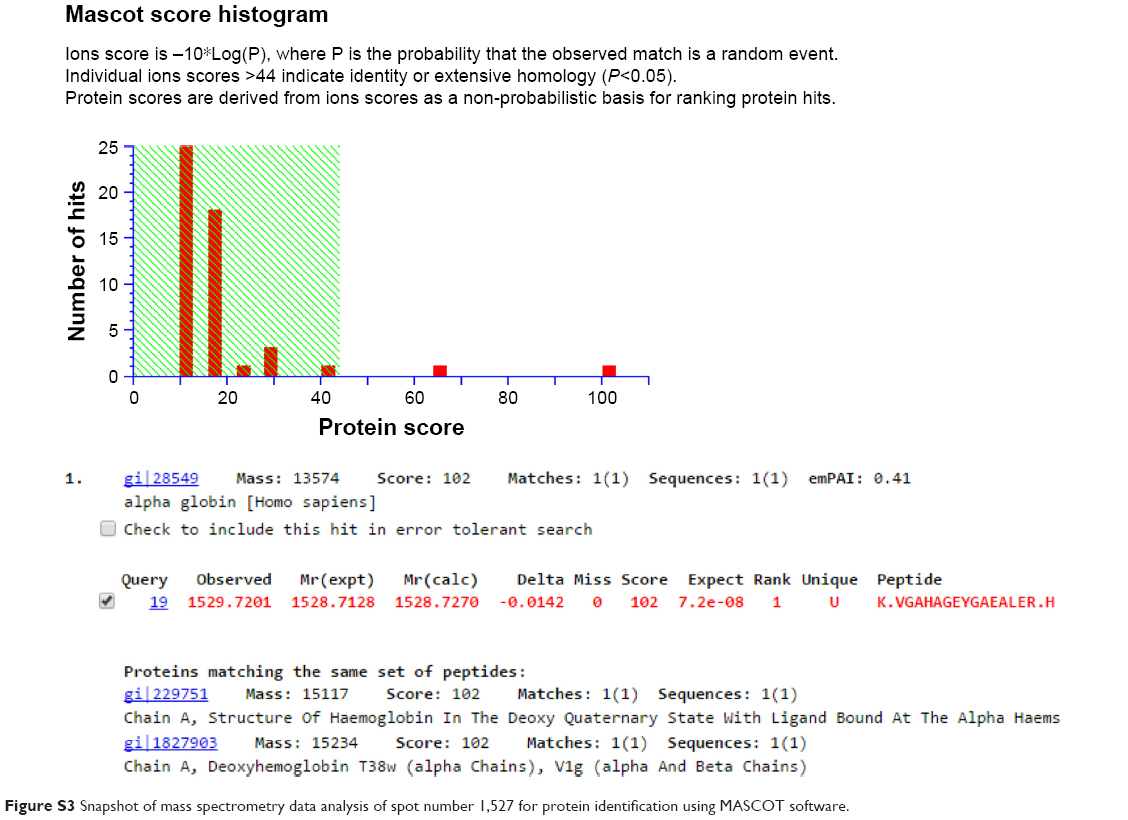 | Figure S3 Snapshot of mass spectrometry data analysis of spot number 1,527 for protein identification using MASCOT software. |
 © 2019 The Author(s). This work is published and licensed by Dove Medical Press Limited. The full terms of this license are available at https://www.dovepress.com/terms.php and incorporate the Creative Commons Attribution - Non Commercial (unported, v3.0) License.
By accessing the work you hereby accept the Terms. Non-commercial uses of the work are permitted without any further permission from Dove Medical Press Limited, provided the work is properly attributed. For permission for commercial use of this work, please see paragraphs 4.2 and 5 of our Terms.
© 2019 The Author(s). This work is published and licensed by Dove Medical Press Limited. The full terms of this license are available at https://www.dovepress.com/terms.php and incorporate the Creative Commons Attribution - Non Commercial (unported, v3.0) License.
By accessing the work you hereby accept the Terms. Non-commercial uses of the work are permitted without any further permission from Dove Medical Press Limited, provided the work is properly attributed. For permission for commercial use of this work, please see paragraphs 4.2 and 5 of our Terms.