")
Back to Journals » Neuropsychiatric Disease and Treatment » Volume 16
Altered Intrinsic Functional Connectivity of the Primary Visual Cortex in Patients with Corneal Ulcer: A Resting-State fMRI Study
Authors Hu SL , Tang LY, Fang JW , Su T , Ge QM , Lin Q , Li B, Shi WQ , Li QY, Liang RB, Shao Y
Received 13 November 2019
Accepted for publication 6 June 2020
Published 23 June 2020 Volume 2020:16 Pages 1571—1581
DOI https://doi.org/10.2147/NDT.S238463
Checked for plagiarism Yes
Review by Single anonymous peer review
Peer reviewer comments 2
Editor who approved publication: Dr Jun Chen
Shou-Long Hu,1,2,* Li-Ying Tang,3,* Jian-Wen Fang,2,* Ting Su,3 Qian-Min Ge,2 Qi Lin,2 Biao Li,2 Wen-Qing Shi,2 Qiu-Yu Li,2 Rong-Bin Liang,2 Yi Shao2
1National Center for Children’s Health, MOE Key Laboratory of Major Diseases in Children, Department of Ophthalmology, Beijing Children’s Hospital, Capital Medical University, Beijing 100045, People’s Republic of China; 2Department of Ophthalmology, The First Affiliated Hospital of Nanchang University, Jiangxi Province Clinical Ophthalmology Institute, Nanchang 330006, Jiangxi, People’s Republic of China; 3Department of Ophthalmology, Xiang’an Hospital of Xiamen University; Fujian Provincial Key Laboratory of Ophthalmology and Visual Science; Eye Institute of Xiamen University; Xiamen University School of Medicine, Xiamen 361102, Fujian Province, People’s Republic of China
*These authors contributed equally to this work
Correspondence: Yi Shao Email [email protected]
Purpose: To investigate differences in the functional connectivity (FC) of the primary visual cortex between patients with corneal ulcer (CU) and healthy controls (HCs) using resting-state functional magnetic resonance imaging.
Patients and Methods: A total of 30 patients with CU and 30 HCs were closely matched in terms of sex, age, and level of education. Two-sample t-test, receiver operating characteristic curve, and Pearson’s correlation coefficient analyses were used to determine the differences in FC between the two groups, the mean FC value of patients with CU and HCs, and the correlation between FC signal values and clinical manifestations in different brain regions of patients.
Results: The CU group showed significantly elevated FC in the left and right middle frontal gyri and lower FC with the right cuneus compared with the HC group. In addition, the FC of the right cingulate and left superior frontal gyri also increased in the CU group. The receiver operating characteristic curve revealed high diagnostic value in those brain regions.
Conclusion: CU involves aberrant FC of the primary visual cortex in different brain areas, including visual-related and cognitive-related regions. This finding may unveil the underlying neural mechanisms of impaired visual function in CU.
Keywords: corneal ulcer, functional magnetic resonance imaging, resting state, spontaneous brain activity, primary visual cortex
Introduction
Corneal ulcer (CU) is an inflammatory or even more severe corneal infection that involves the destruction of the corneal epithelium adjacent to the corneal stroma.1 CU is the main cause of monocular blindness in developing countries and the second leading cause of blindness and visual disability in Asia, Africa, and the Middle East, after cataract.1 The incidence of CU is higher in males than in females, and is mainly diagnosed in farmers (61.25%). Ocular trauma is the most common predisposing factor.2 Common symptoms include eye irritation (eg redness, eye pain, tears), photophobia, and visual impairment.3 The severity of these symptoms depends on the extent of corneal involvement. Slit lamp, sodium fluorescein staining, and confocal laser scanning microscope are the main detection methods in the current clinical process of CU diagnosis and treatment.4–6 These traditional methods are exclusively focused on the anterior segment of the eye, ignoring variations in the visual center and cerebral cortex.
The emergence of resting-state functional magnetic resonance imaging (rs-fMRI) technology provides a now-popular research tool for neuroscience. Owing to its high spatial resolution, absence of radioactivity, and ability to repeat examinations without risk, rs-fMRI has attracted considerable attention in research concerning ophthalmic diseases.7 fMRI studies have provided extensive neuroimaging evidence suggesting that patients with ocular conditions may have nerve tissue damage or cortical dysfunction.8–10 Functional connectivity (FC) is a measure of the temporal correlation between multiple regions of interest (ROIs), or an ROI and other voxels throughout the brain, reflecting the integration of brain function.11 Recent studies found abnormal spontaneous loss of function between the primary visual cortex (V1) and other cortices in strabismus,12,13 central retinal vein occlusion,14 glaucoma,15 and amblyopia.16 Visual information received by the retina is transmitted through the optic nerve and relayed by the lateral geniculate nucleus to the V1 of the occipital lobe in the form of optic radiation, that is, the striate region (V1). The V1 is the first station of information processing; thus, loss of function of this cortex results in decrease of input information to the advanced visual cortex. This process eventually leads to a decrease in the response of the advanced visual cortex to visual stimuli. Nevertheless, the inherent FC variation of the V1 in CU has not been revealed. Therefore, in this study, the FC method was used for the first time to explore the changes in the V1.
Patients and Methods
Participants
Thirty subjects with CU (16 males and 14 females) at the First Affiliated Hospital of Nanchang University (Nanchang, China) were enrolled in the study. The inclusion criteria were (1) duration of CU was ≥2 weeks; (2) absence of other ocular diseases (ie, retinal degeneration, cataract, glaucoma, amblyopia, strabismus, optic neuritis, etc.); (3) absence of parenchymal abnormalities as shown by MRI examination; and (4) visual analogue scores above moderate level.
The exclusion criteria were (1) long-term treatment of blindness; (2) presence of severe ocular complications (ie, corneal perforation, endophthalmitis, orbital cellulitis, etc.); (3) neuroplegic CU; (4) mental disorders (ie, anxiety disorder, emotional disorder, depression, sleep disorder, etc.); and (5) cases with inconsistent quality of functional data.
Twenty healthy controls (HCs) (16 males and 14 females) participated in the study and were matched by sex, age, and level of education with those included in the CU group. All HCs met the following criteria: 1) no history of ophthalmic diseases, and uncorrected or corrected visual acuity >0.8; 2) absence of abnormal brain parenchyma found by routine MRI examination; and 3) absence of neurological or psychiatric disorders.
This study was authorized by the Medical Ethics Committee of the First Affiliated Hospital of Nanchang University and complied with the tenets of the Declaration of Helsinki. All participants volunteered in the study and provided written informed consent.
MRI Parameters
All participants were scanned using a 3-Tesla MR scanner (Trio; Siemens, Munich, Germany) at the Department of Radiology of the First Affiliated Hospital. All participants were requested to remain awake, close their eyes, fix their heads in the appropriate position, and lie quietly on the examination bed without performing any tasks. During the scanning process, suitable earplugs and a sponge mat were used to fix the head and isolate noise. MRI data were collected, including conventional T1-weighted imaging (T1WI) and T2WI structure, magnetic resonance (cardiac MRI) data, scanned T1WI thin-layer high-resolution volumetric image data, and rs-fMRI data (blood oxygen level-dependent-fMRI [BOLD-fMRI]). Whole brain BOLD data in the resting state were collected using the gradient-recalled echo-planar imaging sequence. The parameters were echo time: 30 ms; repetition time: 2000 ms; field of view: 230 mm×230 mm; flip angle: 90º; matrix: 64×64; number of layers: 30; layer thickness: 4.0 mm; spacing: 1.2 mm; a total of 240 time points; and a total of 8 min and 6 s. The three-dimensional high-resolution T1WI volumetric image data were acquired using a three-dimensional spoiled gradient echo T1WI sequence. The parameters were repetition time: 1900 ms; echo time: 2.26 ms; layer thickness: 1 mm; layer spacing: 0 mm; matrix: 256×256; field of view: 240 mm×240 mm; and number of layers: 176. For each participant, the scanning range included the whole brain.
fMRI Data Processing
The first 10 volumes of each subject were discarded due to the signal reaching equilibrium. The acquired data were pre-filtered using MRIcro (www.MRIcro.com) to obtain functional images on the MATLAB R2012b (Math Works, Natick, MA, USA) platform, based on the Statistical Parametric Mapping 8 software package (The FIL Methods Group, Welcome Trust Centre for Human Neuroimaging, Institute of Neurology, UCL), using the Data Processing Assistant for Resting-State fMRI V2.3 software package BOLD original. Data from subjects whose head motion was >2 mm or for whom rotation exceeded 2°during scanning were excluded. The data were preprocessed using the probability map in a statistical parametric mapping anatomy toolbox. The V1 was extracted into the ROI, and resampled by 3 mm×3 mm×3 mm. Smoothing was performed with a 6 mm full-width-half-maximum Gaussian kernel. Data with linear trend were removed, and temporal band-pass was filtered (0.01–0.1 Hz). The FC was determined in the selected ROI and all voxels in the whole brain. The functional connection diagram reflects the functional connection between the V1 and the whole brain.
FC Analysis
ROIs were selected based on a previous study15 and analyzed using seed-based FC. The V1 center was selected as the seed point, and the Montreal Neurological Institute coordinates of the bilateral V1 were left (−8, −76, 10) and right (+7, −76, 10). The diameter of the spherome ROI was 10 mm (close to 27 cubic voxels), and Pearson’s correlation coefficients were calculated between the mean time course of the ROI and the time courses of all other brain voxels. Fisher’s z transformation analysis was applied to the Pearson’s correlation coefficients to obtain an approximately normal distribution for the subsequent statistical analysis.
Statistical Analysis
The SPSS Version 20.0 software (IBM Corp., Armonk, NY, USA) was used to analyze the clinical parameters of patients with CU (eg, age and weight, sex and handedness) in two groups through independent sample t-tests and chi-squared tests. For demographic and clinical measurements, the difference in FC between the CU and HC groups was compared using a two-sample t-test. For multiple comparisons using Gauss random field theory correction, p<0.01 denoted statistical significance. A receiver operating characteristic (ROC) curve was constructed for each statistically significant cerebral gyrus to estimate the mean FC value of different brain regions in patients with CU and HCs. The relationship between the average FC value of different brain areas and the behavioral outcome of patients with CU was examined through Pearson’s correlation coefficient analysis. A p<0.05 denoted statistical significance.
Results
Demographics and Behavioral Results
As shown in Table 1, there were no obvious differences between the two groups in body weight (p=0.828) and age (p=0.917).
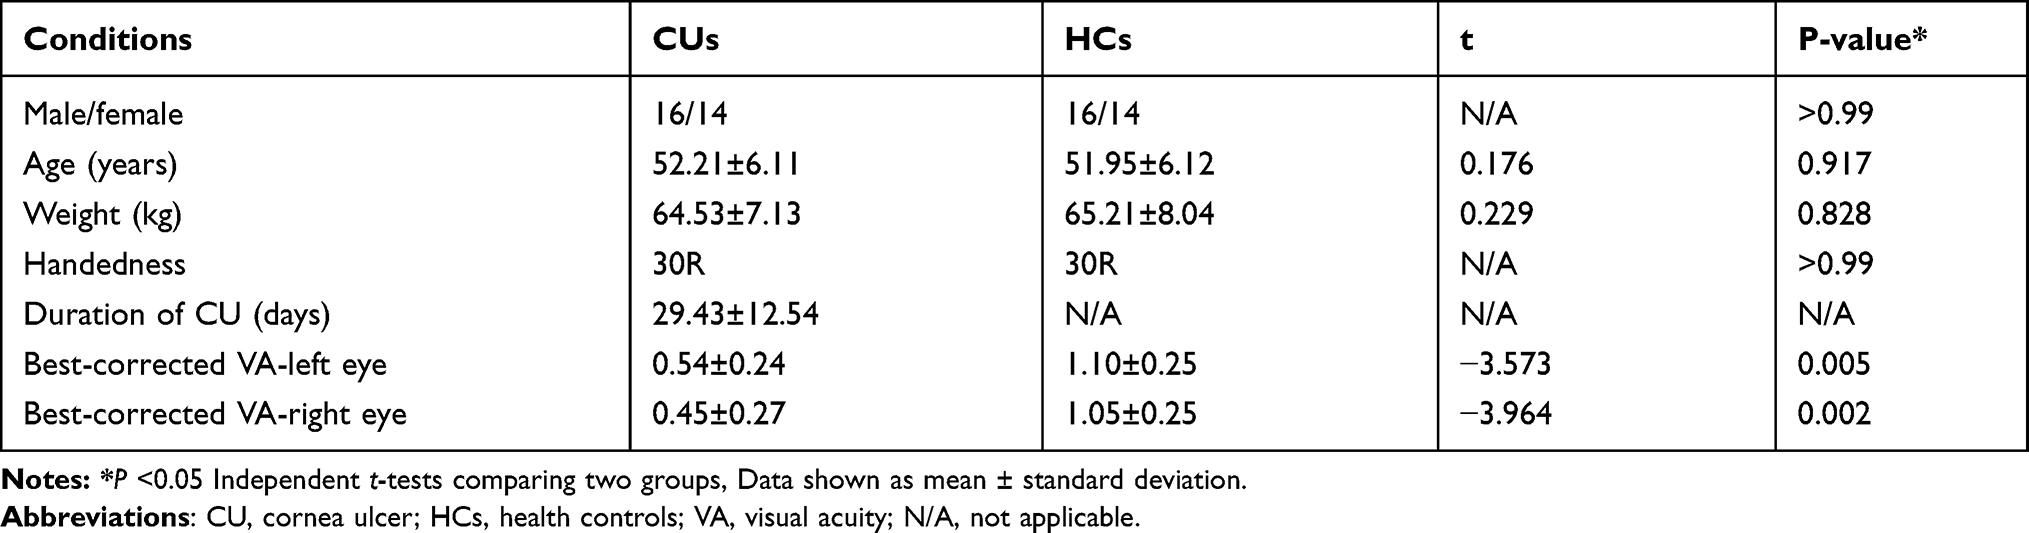 |
Table 1 Conditions of Participants Included in the Study |
FC Differences
The CU group showed increased FC between the left V1, left middle frontal gyrus, and right middle frontal gyrus compared with the HC group. However, they exhibited decreased FC in the left V1 and right cuneus (Figure 1, Table 2). In addition, patients with CU showed higher FC in the right V1, right cingulate gyrus, and left superior frontal gyrus. In contrast, they demonstrated lower FC with the right V1 and right cuneus (Figure 2, Table 2). However, there was no correlation found between the FC values of distinct cerebrum areas and their clinical manifestations in the CU group (p>0.05).
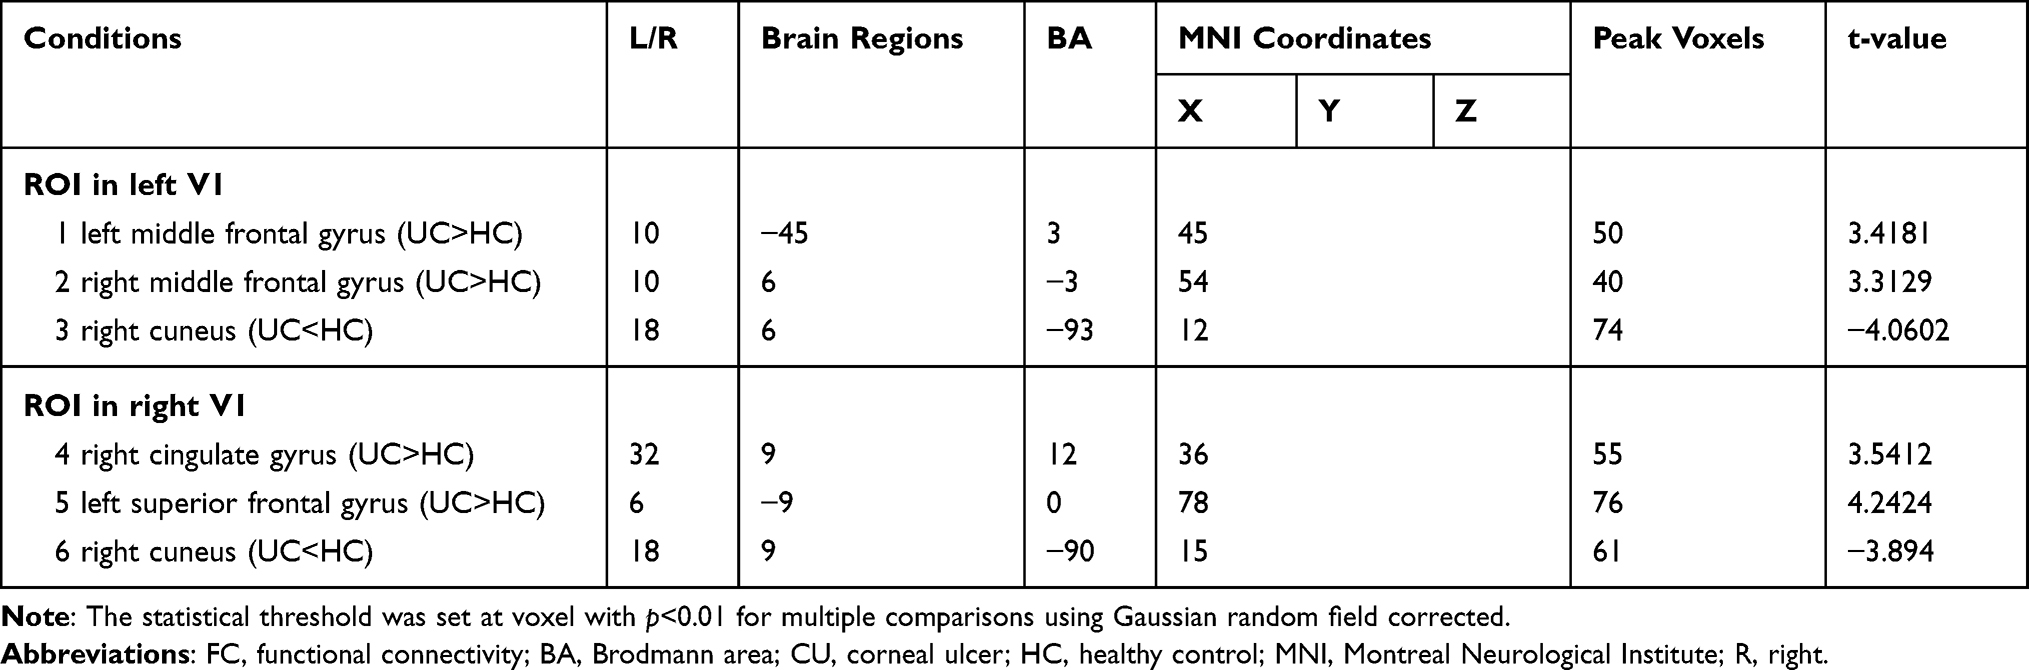 |
Table 2 Brain Regions with Significant Differences in FC Between CU Patients and HCs |
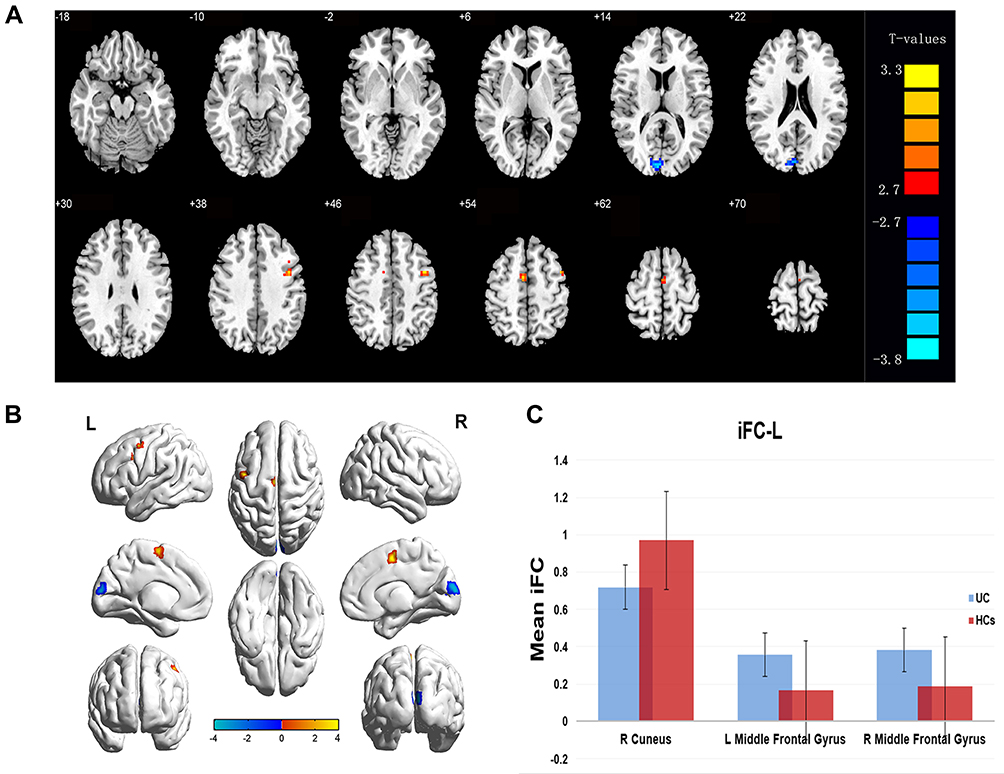 |
Figure 1 Differences in FC of the left V1 between patients with CU and HCs. Notes: (A and B) Notable differences in FC of the left V1 were observed. Red and blue regions represent higher and lower FC values, respectively. The significance level was set at voxel level p<0.01, Gaussian random field theory corrected. (C) The mean FC values of the left V1 between the CU and HC groups. Abbreviations: FC, functional connectivity; V1, primary visual cortex; CU, corneal ulcer; HC, healthy control. |
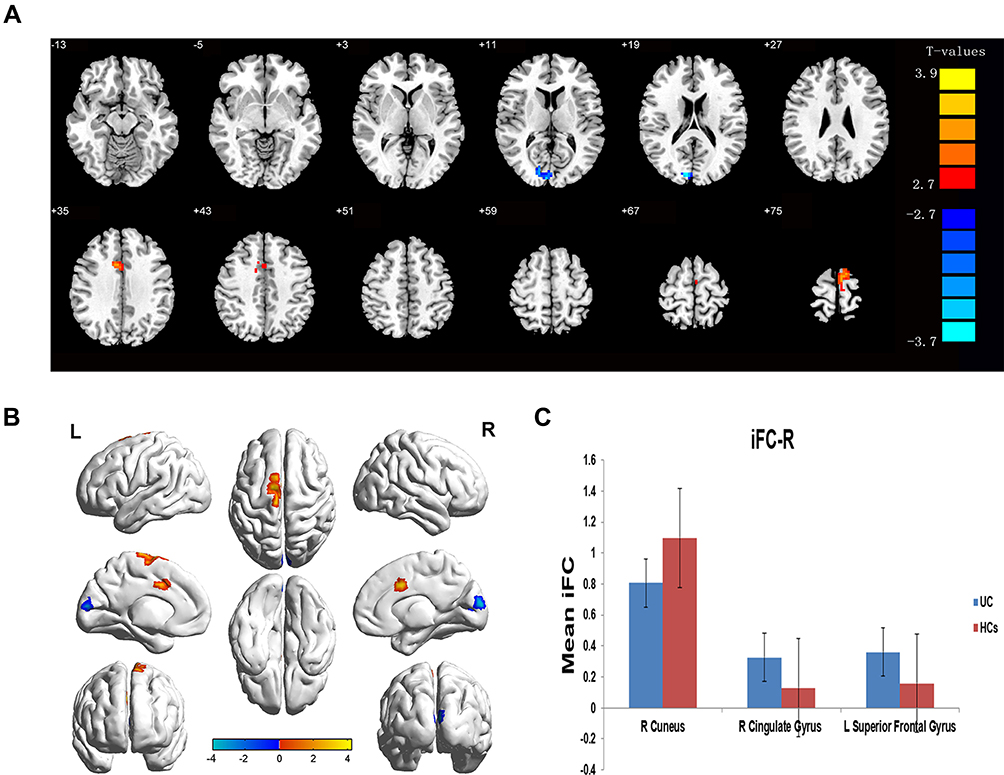 |
Figure 2 Differences in FC of the right V1 between patients with CU and HCs. Notes: (A and B) Significant differences in FC of the right V1 were observed. The red and blue regions indicate higher and lower FC values, respectively. The significance level was set at voxel level p<0.01, Gaussian random field theory corrected. (C) The mean FC values of the right V1 between the CU and HC groups. Abbreviations: FC, functional connectivity; V1, primary visual cortex; CU, corneal ulcer; HC, healthy control. |
ROC Curve
We hypothesized that FC values may be valuable biomarkers to differentiate patients with CU from HCs. Therefore, we used the ROC curve to obtain and analyze the FC values of various brain areas. The area under the ROC curve (AUC) indicated the diagnostic rate. In this study, the AUC of FC values were as follows: left middle frontal gyrus (0.825, p<0.001); right middle frontal gyrus (0.803, p<0.001); right cuneus (0.823, p<0.001) (Figure 3 FC1, left V1); right cingulate gyrus (0.825, p<0.001); left superior frontal gyrus (0.828, p<0.001); and right cuneus (0.809, p<0.001) (Figure 3 FC2, right V1).
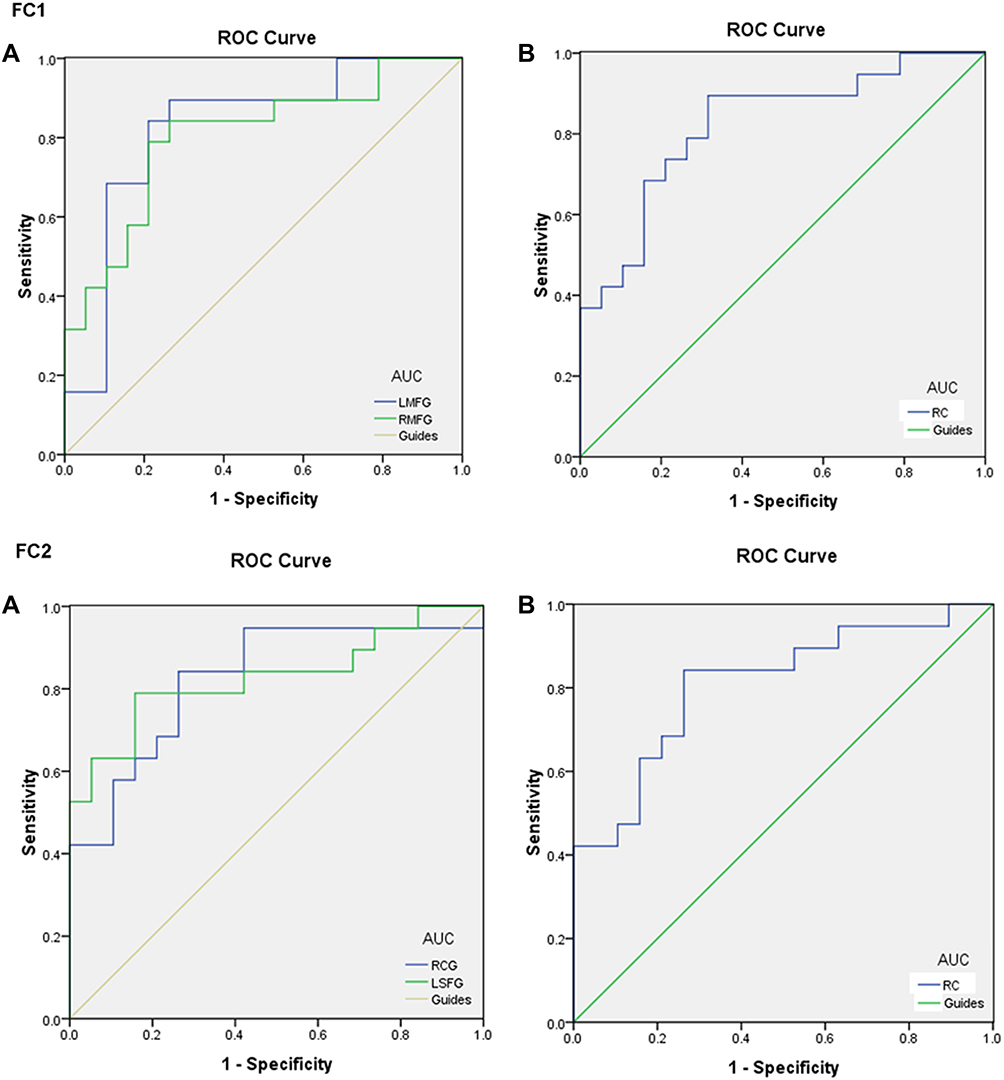 |
Figure 3 ROC curve analysis of the FC values in each paired subregion. Notes: In FC1 – (A) The AUCs of LMFG and RMFG were 0.825 (p<0.001; 95% CI: 0.684–0.967) and 0.803 (p<0.001; 95% CI: 0.661–0.946), respectively. (B) The AUC of RC was 0.823 (p<0.001; 95% CI: 0.689–0.957). In FC2 – (A) The AUCs of RCG and LSFG were 0.825 (p<0.001; 95% CI: 0.689–0.962) and 0.828 (p<0.001; 95% CI: 0.691–0.965), respectively. (B) The AUC of RC was 0.809 (p<0.001; 95% CI: 0.669–0.948). Abbreviations: FC, functional connectivity; ROC, receiver operating characteristic; AUC, area under the ROC curve; LMFG, left middle frontal gyrus; RMFG, right middle frontal gyrus; RC, right cuneus; RCG, right cingulate gyrus; LSFG, left superior frontal gyrus. |
Discussion
In this study, we hypothesized that in patients with CU, corneal pain may be caused by corneal ulceration, and prolonged pain may further lead to anxiety and depression, which further result in alterations in the cerebrum activity (Figure 4).
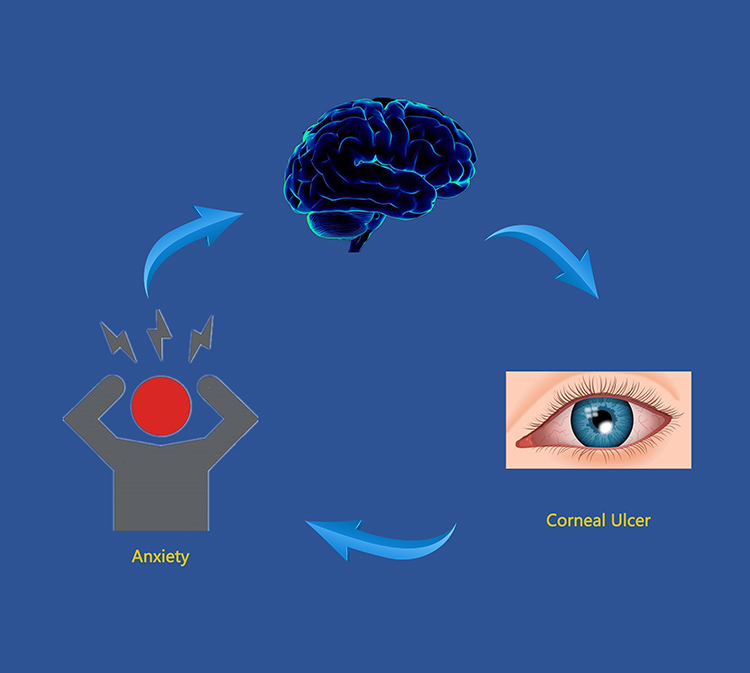 |
Figure 4 Relationship between MRI images and CU. Notes: The lesions in corneal ulcer lead to corneal pain, which leads to anxiety and depression, further leading to changes in the brain. Abbreviations: MRI, magnetic resonance imaging; CU, corneal ulcer. |
Seed-based FC is a reliable fMRI method to reveal the alterations of cerebral functional connectivity, exploring regional activity in the brain. Previous studies have been applied in some ocular diseases (Table 3) and revealed abnormal intrinsic FC between the V1 and the other regions.12,13,15-17
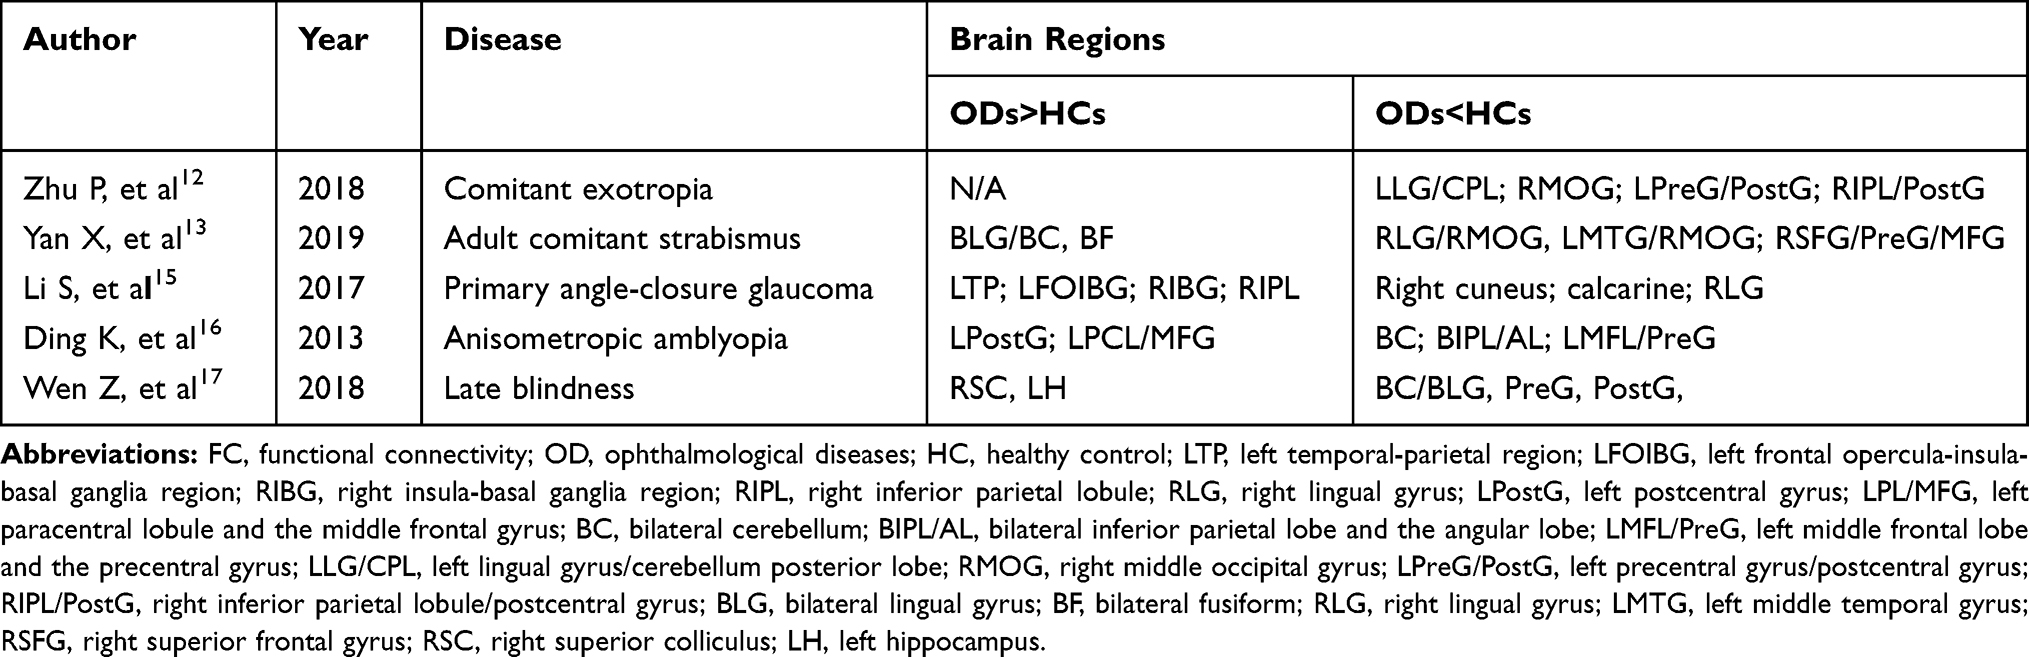 |
Table 3 FC Method Applied in Ocular Diseases |
FC determines whether there is a connection between areas of the brain and the strength of this connection. This approach is a new pattern of rs-fMRI for revealing changes in brain function connections. The present study demonstrated that spontaneous activity in different brain regions changed in patients with CU versus HCs. The FC values in the left V1, left middle frontal gyrus, and right middle frontal gyrus of the CU group were significantly increased. In contrast, the FC values in the left V1 and right cuneus were lower, and the visual function was impaired (Figure 5). Moreover, the CU group showed notably higher FC values between the right V1 and right cingulate gyrus, left superior frontal gyrus. However, they exhibited decreased FC values between the right V1 and right cuneus, accompanied by impaired visual function (Figure 6). Notably, there was no relationship between the mean FC values of diverse cerebrum regions and clinical manifestations in patients with CU.
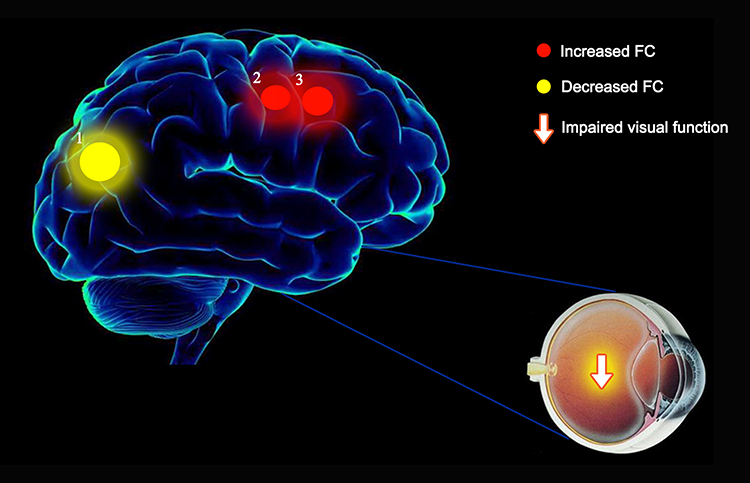 |
Figure 5 FC results of the left V1 in the CU group. FC of the left V1 of patients with CU in the 1-right cuneus (t=−4.0602) was decreased compared with that observed in HCs. In contrast, FC values in the 2-left middle frontal gyrus (t=3.4181) and 3-right middle frontal gyrus (t=3.3129) were increased to various extents. Note: The sizes of the spots denote the degree of quantitative changes. Abbreviations: FC, functional connectivity; V1, primary visual cortex; CU, corneal ulcer; HC, healthy control. |
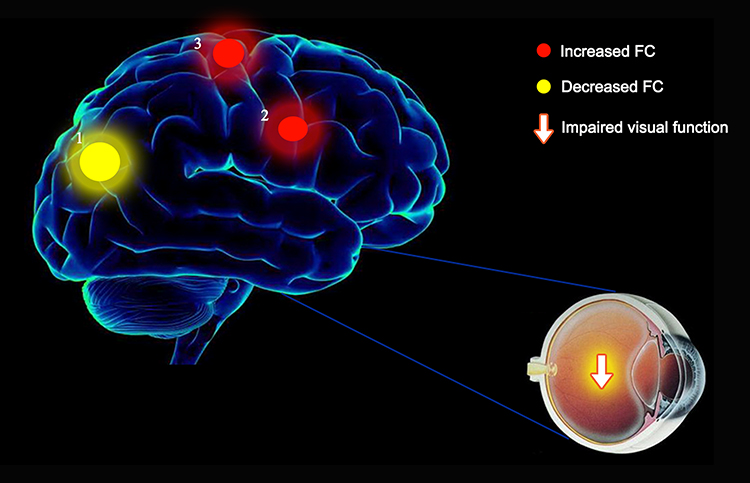 |
Figure 6 FC results of the right V1 in the CU group. FC of the right V1 of patients with CU in the 1-right cuneus (t=−3.8940) was decreased compared with that reported in HCs. In contrast, FC values in the 2-right cingulate gyrus (t=3.5412) and 3-left superior frontal gyrus (t=4.2424) were increased to various extents. Note: The sizes of the spots denote the degree of quantitative changes. Abbreviations: FC, functional connectivity; V1, primary visual cortex; CU, corneal ulcer; HC, healthy control. |
The AUC indicated the diagnostic rate. In this study, the following brain regions are more sensitive the AUC of FC values were as follows: left middle frontal gyrus, right middle frontal gyrus, right cuneus, right cingulate gyrus, left superior frontal gyrus, and right cuneus.
Analysis of Increased FC Values in the CU Group
The frontal lobe lies above the lateral sulcus and in front of the central sulcus, accounting for approximately one-third of the surface of the hemicerebrum. The middle frontal gyrus is located between the inferior and superior frontal sulci, in front of the precentral gyrus. The frontal eye field (FEF) is located around the intersection of the middle frontal gyrus with the precentral gyrus. Consolidated evidence from functional neuroimaging studies suggests that the middle frontal gyrus is responsible for scanning eye movements to achieve visual perception and consciousness, as well as autonomous eye movement.18–20 The FEF communicates indirectly with extraocular muscles through the structure of the paramedian pontine network.
A previous study showed that the FC value was increased between the V1 and middle frontal gyrus in patients with primary open-angle glaucoma.21
Another study showed that patients with CU had markedly increased regional homogeneity (ReHo) values in the left middle frontal gyrus.22 In addition, activation of FEF was reported in magnetic resonance studies of retinal detachment,23 age-related macular degeneration,24,25 progressive retinitis pigmentosa,26 and macular hole27 retinal-related diseases. Consistent with previous studies, the increased FC values between the bilateral V1 and left and right middle frontal gyri shown in this study reflected the activation of visual processing, suggesting the plasticity that compensates for CU-related visual input deficits.
The superior frontal gyrus is part of the frontal lobe, and the lateral part is bounded by the superior frontal sulcus.28 The fMRI evaluation revealed that it is involved in the process of self-awareness and cognition.29 A higher ReHo value, similar to that recorded in the left superior frontal (BA11), was found in patients with acute eye pain.30 A significant increase in cerebral blood flow in the superior frontal gyrus was also detected in patients with strabismus.31 However, studies have shown that patients with optic neuritis and central retinal vein occlusion have reduced brain activity in the superior frontal gyrus.32 In the present study, patients with CU exhibited significantly higher FC values on the right V1 and left frontal gyrus. This finding demonstrated that the patients had functional impairment in this brain region. Therefore, we further conclude that this functional alteration may be related to visual impairment in patients with CU, but the specific mechanism remains to be further studied.
The cingulate gyrus is a vital component of the limbic system. It can be divided into the anterior cingulate and posterior cingulate cortices, which are two completely distinct functional areas. The anterior cingulate gyrus is involved in numerous complex bodily processes, including the emotional, sensory and attention, and operational memory systems. The posterior cingulate gyrus and parahippocampal are closely related to memory formation, monitoring sensory, and stereotaxic functions. In a study of patients with strabismus, the degree centrality values of the bilateral anterior cingulate were significantly increased.33 However, in another study, patients with diabetic retinopathy had markedly lower ReHo values in the right anterior cingulate gyrus, right cuneus, bilateral anterior, and left middle frontal gyrus.34 In this study, patients with CU showed increased FC values in the right cingulate gyrus. However, the mechanism involved in this process remains to be explored.
Analysis of Lower FC Values in the CU Group
The cuneus is a wedge-shaped area located between the corpus callosum and the medial occipital fissure. It is the smallest lobe in the occipital lobe of the brain. The cuneus (Brodmann area 17) receives visual information from the contralateral superior retina representing the lower field of vision and is involved in basic visual processing. It has been reported that the cuneus is activated almost simultaneously with the V1 in response to a visual stimulus, and may act to modulate signals travelling from the V1 to the extrastriate cortices.35 Liao XL el et have reported that the right cuneus ReHo value of patients with diabetic retinopathy was significantly reduced.34 Studies showed that the wedge FC of female patients with glaucoma was reduced compared with that observed in healthy subjects.36 Moreover, the application of amplitude of low-frequency fluctuations for rs-fMRI revealed that the value of the bilateral cuneus in patients with primary open-angle glaucoma was decreased, and the spontaneous activity of the left cuneus was negatively correlated with the severity of the disease.37 Huang et al23 detected a significant decline in brain neural homogeneity in the cuneus of individuals with retinal detachment; of note, a similar decreasing trend in the cuneus was reported in acute open globe injury.38 Furthermore, patients with monocular blindness exhibited lower values of voxel-mirrored homotopic connectivity in the cuneus. Recent studies have shown that a decrease in FC between the bilateral V1 and right cuneus can indicate functional deficits in patients with CU, providing new evidence that CU may cause cuneus dysfunction.
However, this study also has limitations. Such as, the mechanism research is not presented in this study. So, we are looking forward to a series of molecular experiments to clarify the further mechanisms of CU.
Conclusion
The results of this study revealed that patients with CU had abnormal spontaneous activity in different brain areas. These findings may provide an in-depth understanding of neurological variations in patients with CU and reveal the potential mechanism of CU. The FC signal can be used as an effective biomarker for the detection of CU.
Acknowledgments
This study was supported by the National Natural Science Foundation of China (Nos: 81660158, 81460092, 81400372); the Natural Science Key Project of Jiangxi Province (No: 20161ACB21017).
Disclosure
This was not an industry-supported study. The authors report no conflicts of interest in this work.
References
1. Suwal S, Bhandari D, Thapa P, et al. Microbiological profile of corneal ulcer cases diagnosed in a tertiary care ophthalmological institute in Nepal. BMC Ophthalmol. 2016;16(1):209. doi:10.1186/s12886-016-0388-9
2. Bashir G, Shah A, Thokar MA, et al. Bacterial and fungal profile of corneal ulcers–a prospective study. Indian J Pathol Microbiol. 2005;48(2):273–277.
3. Omari AA, Mian SI. Adenoviral keratitis. Curr Opin Ophthalmol. 2018;29(4):365–372. doi:10.1097/ICU.0000000000000485
4. Courrier E, Lepine T, Hor G, et al. Size of the lesions of superficial punctate keratitis in dry eye syndrome observed with a slit lamp. Cornea. 2016;35(7):1004–1007. doi:10.1097/ICO.0000000000000846
5. Bekiesinska-Figatowska M, Helwich E, Rutkowska M, et al. Magnetic resonance imaging of neonates in the magnetic resonance compatible incubator. Arch Med Sci. 2016;12:1064–1070. doi:10.5114/aoms.2016.61913
6. Vaddavalli PK, Garg P, Sharma S, et al. Role of confocal microscopy in the diagnosis of fungal and acanthamoeba keratitis. Ophthalmology. 2011;118(1):29–35. doi:10.1016/j.ophtha.2010.05.018
7. Shi W, Zhu P, Shao Y. The application of functional magnetic resonance imaging in ophthalmology. Am J Transl Res. 2020;4(1):19–33.
8. Wang H, Chen T, Ye L, et al. Network centrality in patients with acute unilateral open globe injury: a voxel‑wise degree centrality study[J]. Mol Med Rep. 2017;16(6):8295–8300. doi:10.3892/mmr.2017.7635
9. Ouyang J, Yang L, Huang X, et al. The atrophy of white and gray matter volume in patients with comitant strabismus: evidence from a voxel-based morphometry study. Mol Med Rep. 2017;16(3):3276–3282. doi:10.3892/mmr.2017.7006
10. Tan G, Dan ZR, Zhang Y, et al. Altered brain network centrality in patients with adult comitant exotropia strabismus: a resting-state fMRI study. J Int Med Res. 2018;46(1):392–402. doi:10.1177/0300060517715340
11. Zhang XD, Jiang XL, Cheng Z. Decreased coupling between functional connectivity density and amplitude of low frequency fluctuation in non-neuropsychiatric systemic lupus erythematosus: a resting-stage functional MRI study. Mol Neurobiol. 2017;54(7):5225–5235. doi:10.1007/s12035-016-0050-9
12. Zhu PW, Huang X, Ye L, et al. Altered intrinsic functional connectivity of the primary visual cortex in youth patients with comitant exotropia: a resting state fMRI study. Int J Ophthalmol. 2018;11(4):668–673. doi:10.18240/ijo.2018.04.22
13. Yan X, Wang Y, Xu L, et al. Altered functional connectivity of the primary visual cortex in adult comitant strabismus: a resting-state functional MRI study. Curr Eye Res. 2019;44(3):316–323. doi:10.1080/02713683.2018.1540642
14. Wu YY, Yuan Q, Li B, et al. Altered spontaneous brain activity patterns in patients with retinal vein occlusion indicated by the amplitude of low-frequency fluctuation: a functional magnetic resonance imaging study. Exp Ther Med. 2019;18(3):2063–2071. doi:10.3892/etm.2019.7770
15. Li S, Li P, Gong H, et al. Intrinsic functional connectivity alterations of the primary visual cortex in primary angle-closure glaucoma patients before and after surgery: a resting-state fMRI study. PLoS One. 2017;12(1):e0170598. doi:10.1371/journal.pone.0170598
16. Ding K, Liu Y, Yan X, Lin X, Jiang T. Altered functional connectivity of the primary visual cortex in subjects with amblyopia. Neural Plast. 2013;2013:612086. doi:10.1155/2013/612086
17. Wen Z, Zhou FQ, Huang X, Dan HD, Xie BJ, Shen Y. Altered functional connectivity of primary visual cortex in late blindness. Neuropsychiatr Dis Treat. 2018;14:3317–3327. doi:10.2147/NDT.S183751
18. Vernet M, Quentin R, Chanes L, et al. Frontal eye field, where art thou? Anatomy, function, and non-invasive manipulation of frontal regions involved in eye movements and associated cognitive operations. Front Integr Neurosci. 2014;8:66.
19. Fernandes HL, Stevenson IH, Phillips AN, et al. Saliency and saccade encoding in the frontal eye field during natural scene search. Cereb Cortex. 2014;24(12):3232–3245. doi:10.1093/cercor/bht179.
20. Brown MR, Vilis T, Everling S. Isolation of saccade inhibition processes: rapid event-related fMRI of saccades and nogo trials. Neuroimage. 2008;39(2):793–804. doi:10.1016/j.neuroimage.2007.09.035
21. Dai H, Morelli JN, Ai F, et al. Resting-state functional MRI: functional connectivity analysis of the visual cortex in primary open-angle glaucoma patients. Hum Brain Mapp. 2013;34(10):2455–2463. doi:10.1002/hbm.22079
22. Man-Wei X, Liu H-M, Tan G, et al. Altered regional homogeneity in patients with corneal ulcer: a resting-state functional MRI study. Front Neurosci. 2019;13:743. doi:10.3389/fnins.2019.00743
23. Huang X, Li D, Li H-J, et al. Abnormal regional spontaneous neural activity in visual pathway in retinal detachment patients: a resting-state functional MRI study. Neuropsychiatr Dis Treat. 2017;13:2849–2854. doi:10.2147/NDT.S147645
24. Little DM, Thulborn KR, Szlyk JP. An fMRI study of saccadic and smooth-pursuit eye movement control in patients with age-related macular degeneration. Invest Ophthalmol Vis Sci. 2008;49(4):1728–1735. doi:10.1167/iovs.07-0372
25. Szlyk JP, Little DM. An fMRI study of word-level recognition and processing in patients with age-related macular degeneration. Invest Ophthalmol Vis Sci. 2009;50(9):4487–4495. doi:10.1167/iovs.08-2258
26. Yoshida M, Origuchi M, Urayama S, et al. fMRI evidence of improved visual function in patients with progressive retinitis pigmentosa by eye-movement training. Neuroimage Clin. 2014;5:161–168. doi:10.1016/j.nicl.2014.02.007
27. Hamamatsu T, Nakagawa Y, Tamai M, Ito M. Visual processing in patients with macular hole. Tohoku J Exp Med. 2000;190(4):249–260. doi:10.1620/tjem.190.249
28. Li W, Qin W, Liu H, et al. Subregions of the human superior frontal gyrus and their connections. Neuroimage. 2013;78:46–58. doi:10.1016/j.neuroimage.2013.04.011
29. Goldberg I, Harel M, Malach R. When the brain loses its self: prefrontal inactivation during sensorimotor processing. Neuron. 2006;50(2):329–339. doi:10.1016/j.neuron.2006.03.015
30. Tang LY, Li HJ, Huang X, et al. Assessment of synchronous neural activities revealed by regional homogeneity in individuals with acute eye pain: a resting-state functional magnetic resonance imaging study. J Pain Res. 2018;11:843–850. doi:10.2147/JPR.S156634
31. Huang X, Zhou S, Su T, et al. Resting cerebral blood flow alterations specific to the comitant exophoria patients revealed by arterial spin labeling perfusion magnetic resonance imaging. Microvasc Res. 2018;120:67–73. doi:10.1016/j.mvr.2018.06.007
32. Shao Y, Cai FQ, Zhong YL, et al. Altered intrinsic regional spontaneous brain activity in patients with optic neuritis: a resting-state functional magnetic resonance imaging study. Neuropsychiatr Dis Treat. 2015;11:3065–3073. doi:10.2147/NDT.S92968
33. Dai P, Zhang J, Wu J, et al. Altered spontaneous brain activity of children with unilateral amblyopia: a resting state fMRI study. Neural Plast. 2019;2019:3681430. doi:10.1155/2019/3681430
34. Liao XL, Yuan Q, Shi WQ, et al. Altered brain activity in patients with diabetic retinopathy using regional homogeneity: a resting-state fMRI study. Endocr Pract. 2019;25(4):320–327. doi:10.4158/EP-2018-0517
35. Vanni S, Tanskanen T, Seppä M, Uutela K, Hari R. Coinciding early activation of the human primary visual cortex and anteromedial cuneus. Proc Natl Acad Sci U S A. 2001;98(5):2776–2780. doi:10.1073/pnas.041600898
36. Peng Z, Jieqiong W, Ting L, Ningli W, Junfang X, Huiguang H. Abnormal interhemispheric resting-state functional connectivity in primary open-angle glaucoma. Conf Proc IEEE Eng Med Biol Soc. 2016;2016:4055–4058.
37. Li T, Liu Z, Li J, et al. Altered amplitude of low-frequency fluctuation in primary open-angle glaucoma: a resting-state fMRI study. Invest Ophthalmol Vis Sci. 2015;56(1):322–329. doi:10.1167/iovs.14-14974
38. Ye L, Wei R, Huang X, et al. Reduction in interhemispheric functional connectivity in the dorsal visual pathway in unilateral acute open globe injury patients: a resting-state fMRI study. Int J Ophthalmol. 2018;11(6):1056–1062. doi:10.18240/ijo.2018.06.26
 © 2020 The Author(s). This work is published and licensed by Dove Medical Press Limited. The full terms of this license are available at https://www.dovepress.com/terms.php and incorporate the Creative Commons Attribution - Non Commercial (unported, v3.0) License.
By accessing the work you hereby accept the Terms. Non-commercial uses of the work are permitted without any further permission from Dove Medical Press Limited, provided the work is properly attributed. For permission for commercial use of this work, please see paragraphs 4.2 and 5 of our Terms.
© 2020 The Author(s). This work is published and licensed by Dove Medical Press Limited. The full terms of this license are available at https://www.dovepress.com/terms.php and incorporate the Creative Commons Attribution - Non Commercial (unported, v3.0) License.
By accessing the work you hereby accept the Terms. Non-commercial uses of the work are permitted without any further permission from Dove Medical Press Limited, provided the work is properly attributed. For permission for commercial use of this work, please see paragraphs 4.2 and 5 of our Terms.