")
Back to Journals » Drug Design, Development and Therapy » Volume 9
Visual detection of glial cell line-derived neurotrophic factor based on a molecular translator and isothermal strand-displacement polymerization reaction
Authors Zhang L, Xing T, Du L, Li Q, Liu W, Wang J, Cai J
Received 21 October 2014
Accepted for publication 3 December 2014
Published 31 March 2015 Volume 2015:9 Pages 1889—1896
DOI https://doi.org/10.2147/DDDT.S76192
Checked for plagiarism Yes
Review by Single anonymous peer review
Peer reviewer comments 2
Editor who approved publication: Prof. Dr. Wei Duan
Li-Yong Zhang,1,* Tao Xing,1,* Li-Xin Du,1,* Qing-Min Li,2 Wei-Dong Liu,1 Ji-Yue Wang,1 Jing Cai3
1Department of neurosurgery, Liaocheng People’s Hospital, Liaocheng, Shandong, People’s Republic of China; 2Department of Neurosurgery, Tai’an Central Hospital, Tai’an, Shandong, People’s Republic of China; 3Department of Neurosurgery, LinYi People Hospital, LinYi, Shandong, People’s Republic of China
*These authors contributed equally to this work
Background: Glial cell line-derived neurotrophic factor (GDNF) is a small protein that potently promotes the survival of many types of neurons. Detection of GDNF is vital to monitoring the survival of sympathetic and sensory neurons. However, the specific method for GDNF detection is also un-discovered. The purpose of this study is to explore the method for protein detection of GDNF.
Methods: A novel visual detection method based on a molecular translator and isothermal strand-displacement polymerization reaction (ISDPR) has been proposed for the detection of GDNF. In this study, a molecular translator was employed to convert the input protein to output deoxyribonucleic acid signal, which was further amplified by ISDPR. The product of ISDPR was detected by a lateral flow biosensor within 30 minutes.
Results: This novel visual detection method based on a molecular translator and ISDPR has very high sensitivity and selectivity, with a dynamic response ranging from 1 pg/mL to 10 ng/mL, and the detection limit was 1 pg/mL of GDNF.
Conclusion: This novel visual detection method exhibits high sensitivity and selectivity, which is very simple and universal for GDNF detection to help disease therapy in clinical practice.
Keywords: lateral flow biosensor, molecular translator, isothermal strand-displacement polymerization reaction
Introduction
Glial cell line-derived neurotrophic factor (GDNF) is a small protein that potently promotes the survival of many types of neurons and is able to prevent apoptosis of motor neurons induced by axotomy. The detection of GDNF is vital to monitoring the survival and maintenance of sympathetic and sensory neurons.1–6 Several approaches have so far been devised for the detection of GDNF. Conventional antibody-based methods, including Western blotting, dot blotting, immunohistochemistry, and enzyme-linked immunosorbent assay, are widely used analytical approaches in both clinical diagnosis and biological research.7 However, these methods always suffer from the limitations of long assay time, complex experimental procedures, high cost, and low sensitivity. Therefore, continuing efforts have been made to seek ideal methods for rapid, sensitive, low-cost, and user-friendly detection of GDNF.
A molecular translator can be employed as a signal transducer by highly converting the input target molecules into unique output deoxyribonucleic acid (DNA) for signal amplification. For example, Picuri et al8 have developed a novel nucleic acid detection method through converting any target nucleic acids to a predesigned output DNA. Li et al9–11 and Zhang et al12,13 have designed a molecular translator base on binding induced DNA assembly for fluorescence detection of protein, including prostate-specific antigen and platelet-derived growth factor (PDGF). Although these approaches are effective, most of them are time-consuming, laborious, and high cost with low sensitivity.
Recently, lateral flow biosensors (LFBs) have attracted considerable research interest because of their simple assay procedure, user-friendly platform, short assay time, and cost-effectiveness. The result of the assay can be observed by naked eyes within 15 minutes, and quantitative analysis can be realized by recording the color intensity of the red band on the test zone with a portable LFB reader.14,15 Isothermal strand-displacement polymerization reaction (ISDPR) is a commonly used approach for DNA signal amplification due to its robustness and simplicity.16 In this work, for the first time, we propose an LFB for detecting GDNF with a molecular translator and ISDPR. We employ a molecular translator to convert the protein signal to a DNA signal, which can be further amplified by ISDPR.
Materials and methods
Materials
GDNF and rabbit anti-GDNF polyclonal antibody, bovine serum albumin (BSA), streptavidin, and gold nanoparticles (AuNPs) (5 nm, 10 nm, and 20 nm) were purchased from Sigma-Aldrich (Steinheim, Germany). The polymerase Klenow fragment exo- and deoxynucleoside triphosphates (dNTPs) were obtained from New England Biolabs (Ipswich, MA, USA). Other chemicals were purchased from standard commercial sources and were of analytical grade. All buffer solutions used in this study were prepared in our laboratory with ultrapure water.
The oligonucleotide sequences were synthesized and purified through high-performance liquid chromatography by Shanghai Sangon Biological Engineering Technology & Services Co. Ltd (Shanghai, People’s Republic of China). The oligonucleotide sequences are listed in Table 1.
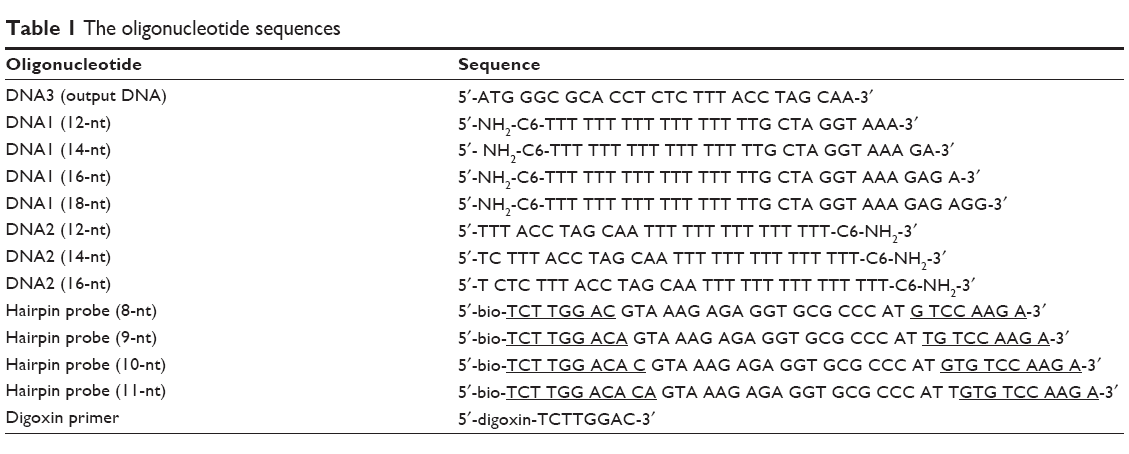 | Table 1 The oligonucleotide sequences |
Preparation of anti-GDNF antibody–DNA1/DNA2 conjugates
The conjugates were prepared by 1-ethyl-3-(3-dimethylaminopropyl)-carbodiimide and N-hydroxysuccinimide (EDC/NHS) activity. Briefly, 20.6 mg EDC and 11.5 mg NHS were mixed in 1 mL of water for 10 minutes. From this solution, 10 μL was added to 200 μL of 500 μg/mL rabbit anti-GDNF polyclonal antibody, rabbit antitransforming growth factor [TGF]-α, anti-TGF-β, antiepidermal growth factor [EGF], anti-insulin-like growth factor [IGF]-I, and antifibroblast growth factor [FGF]) polyclonal antibodies solution in carbonate buffer, pH 11, and reacted for 2 hours. The solution was then centrifuged for 5 minutes at 4,000 r/min and washed twice with 200 μL of water for 5 minutes at 4,000 r/min before being brought up to a final volume of 200 μL with water. Final protein concentrations were determined with a Pierce GCATM protein assay kit.
Preparation of the LFB
The LFB was fabricated as shown in Figure 1C. The biosensor consisted of a sample pad, a conjugate pad, a nitrocellulose membrane, and an absorbent pad. The sample pad (1.7×30 cm) was prepared by soaking a glass fiber pad in sample pad buffer (pH 8.0) (1% Triton, 2% BSA, 3% glucose, and 50 mM boric acid). The sample pad was then dried at room temperature. The conjugate pad (fiberglass: 0.8×30 cm) was prepared by dispensing a desired volume of AuNP–antidigoxin conjugates onto the glass fiber using a dispenser. The conjugate pad was dried at room temperature for 12 hours and stored at 4°C. Streptavidin (1 mg/mL) and rabbit antimouse immunoglobulin G (IgG) antibody (30 μL, 1 mg/mL) were dispensed onto the nitrocellulose membrane to form a test zone and a control zone, respectively, with a lateral flow dispenser. The distance between the test zone and the control zone was approximately 5 mm. The membrane was dried at room temperature for 12 hours and stored at 4°C. Finally, the four components of the lateral flow DNA biosensor were assembled on plastic adhesive backing (6×30 cm). Each part overlapped by 2 mm to ensure solution migration through the strip during the assay. Strips were cut into 3 mm width with a paper cutter.
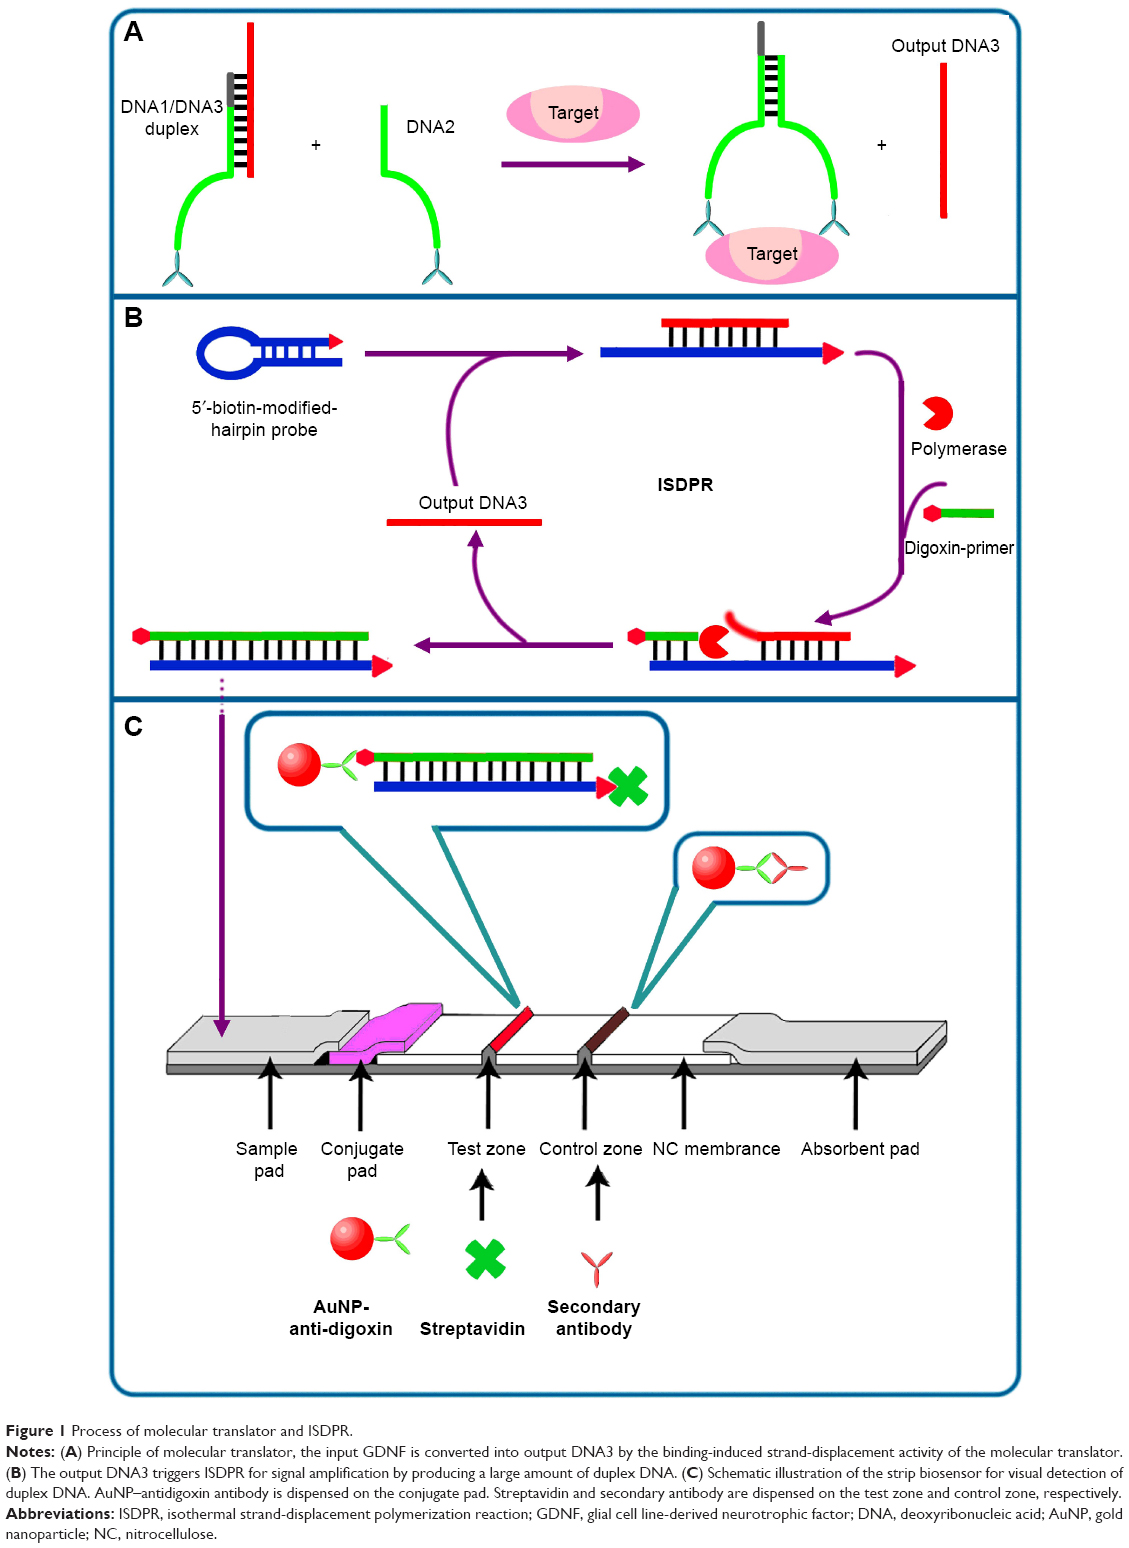 | Figure 1 Process of molecular translator and ISDPR. |
Detection of GDNF by LFB
A DNA probe for the molecular translator was prepared at a final concentration of 5 μM by mixing 20 μL 50 μM mouse anti-GDNF antibody conjugated DNA1 with 13.3 μL 50 μM output DNA3 in 166.7 μM Tris–ethylenediaminetetraacetic acid (TE) buffer (containing 10 mM MgCl2 and 0.05% Tween 20), heating to 90°C for 5 minutes, and allowing solution to cool down to 25°C slowly in a period of 3 hours. Strand displacement of molecular translator was performed in 20 μL TE buffer, 10 nM DNA1/DNA3 complex, 10 nM DNA2. The reaction mixture was incubated at 25°C for 45 minutes.
ISDPR was performed in a 25 μL 50 nM Tris-HCl (pH 8.0) buffer containing 50 nM short primer, 3U polymerase Klenow fragment exo-, 50 μM dNTPs, 6% dimethyl sulfoxide, 0.1% BSA, 1 mM DTT, 5 mM MgCl2, and 2 μL of product of strand displacement of molecular translator. This mixture was incubated at 42°C for 30 minutes. Finally, the ISDPR product was loaded onto the sample pad together with 20 μL PBS. The red bands were observed within 5 minutes, and the biosensor was scanned with a portable LFB reader. The optical intensities of the test zone and the control zone were recorded simultaneously by the reader, which automatically located the red bands in a fixed reaction area and then measured strip parameters such as peak height and area integral.
Process of molecular translator and ISDPR
For the process of molecular translator and strand-displacement amplification, DNA1 conjugated with the GDNF antibody is initially hybridized to DNA3 to form a stable DNA1/DNA3 duplex. DNA2 sequences are designed in such a way that the complementary sequences between DNA1 and DNA2 are 4-nt shorter than the complementary sequences between DNA1 and DNA3. In the absence of GDNF, the strand displacement activity is poor between DNA2 and DNA3 at 25°C, and the displacement of output DNA3 by competing DNA2 is extremely minimal. However, in the process of GDNF, the binding of the same target protein to its antibodies that are coupled with DNA1 and DNA2 brings DNA1 and DNA2 to a close proximity, resulting in an increasing in their local effective concentration. This process triggers the strand-displacement reaction between DNA2 and DNA3. As a result, the output DNA3 is released for the next signal amplification (Figure 1A).
The releasing output DNA3 recognizes and hybridizes with the loop region of the hairpin probe, which is composed of an eleven base pair stem, a 25-nt loop, and a biotin at the 5′ end, causing the hairpin probe to undergo a conformational change and leading to stem separation. The digoxin-coupled primer (8-nt) complementary to the stem region of the hairpin probe at the 3′ end thus anneals with the open stem and triggers a polymerization reaction in the presence of dNTPs and DNA polymerase. In the process of primer extension, the output DNA3 is released by DNA polymerase with strand-displacement activity, after which complementary DNA is synthesized, leading to the formation of a hairpin–DNA complex. To start the next cycle, the releasing output DNA3 hybridizes with another hairpin probe, triggering another polymerization reaction. Through this cyclic reaction comprising release of output DNA3 and hybridization of output DNA3 with remaining hairpin probe, a great amount of duplex DNA products with a biotin and digoxin tag at the 5′ end are synthesized. The hairpin probe retains its original stem-loop structure in the absence of GDNF, the primer is unable to anneal to the hairpin to initiate a polymerization, and no duplex DNA is produced (Figure 1B).
An LFB consists of four components: sample pad, conjugate pad, nitrocellulose membrane, and absorption pad. The antidigoxin antibodies conjugated with AuNPs are dispensed on the conjugate pad. Streptavidin and goat antimouse IgG antibody (secondary body) are dispensed on the nitrocellulose membrane, respectively, to form the test zone and the control zone. The sample solution containing the ISDPR product and running buffer is applied on the sample pad of the LFBs. The solution migrates along the LFB by capillary action to the conjugate pad, where antidigoxin–AuNP conjugates have been deposited. Antidigoxin antibody couples with digoxin of the ISDPR duplex DNA product to form a biotin–duplex DNA–digoxin–antidigoxin–AuNP complex. The complexes are captured at the test zone by the specific reaction between preimmobilized streptavidin and biotin. The accumulation of AuNPs on the test zone is then visualized as a characteristic red band. Excess antidigoxin–AuNP conjugates continue to migrate and are captured at the control zone by immunoreactions between antidigoxin antibody and the preimmobilized secondary antibody on the AuNP surface, thus forming a second red band. In the absence of GDNF, no ISDPR duplex DNA product is produced; therefore, no red band is observed at the test zone. In this case, the red band at the control zone indicates that the LFB is working properly. Visual detection is performed by observing the color change caused by the accumulation of AuNPs on the test zone, and quantitative detection can be realized by recording the color intensity of the red band on the test zone with a portable LFB reader (Figure 1C).
Statistical analysis
The data in this study were analyzed with SPSS statistics software version 19.0 (IBM Corporation, Armonk, NY, USA). The comparison between groups was analyzed by independent t-tests. A P-value of less than 0.05 was considered as statistical significance.
Results
Principle of visual detection of GDNF
The molecular translator is composed of target recognition elements (DNA1 and DNA2) and a signal output element (DNA3), which is illustrated in Figure 1A. The output DNA3 triggers ISDPR for signal amplification by producing a large amount of duplex DNA (Figure 1B). Figure 1C illustrates the schematic illustration of the strip biosensor for visual detection of duplex DNA.
Verification of the signal amplification of ISDPR
We investigated the optical response of 10 nM DNA3 on the LFB with and without ISDPR amplification. In the case without ISDPR, there was no polymerase in the reaction buffer. As shown in Figure 2, the response of the sample with ISDPR was 35 times higher compared with that without ISDPR or the blank group (P<0.01).
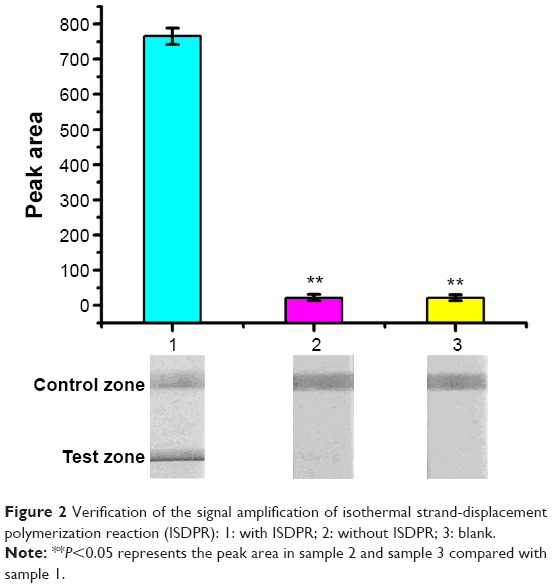 | Figure 2 Verification of the signal amplification of isothermal strand-displacement polymerization reaction (ISDPR): 1: with ISDPR; 2: without ISDPR; 3: blank. |
Optimization of ISDPR
The experimental parameters, such as ISDPR temperature and reaction time that could affect the analytical performance, were optimized systematically. We compared the Signal to Noise (S/N) ratio of 10 ng mL−1 and 1 ng mL−1 GDNF with four different ISDPR temperatures (25°C, 37°C, 42°C, and 50°C). As shown in Figure 3A, the S/N ratios increased with increasing reaction temperature in the range from 25°C to 42°C. The S/N ratio decreased when the temperature was over 42°C.
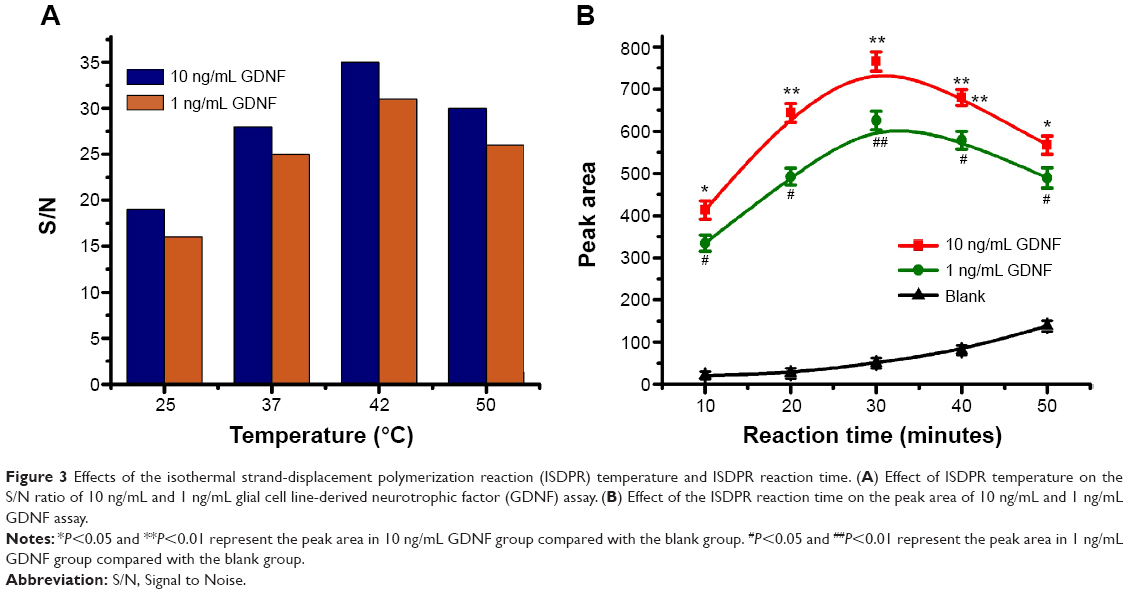 | Figure 3 Effects of the isothermal strand-displacement polymerization reaction (ISDPR) temperature and ISDPR reaction time. (A) Effect of ISDPR temperature on the S/N ratio of 10 ng/mL and 1 ng/mL glial cell line-derived neurotrophic factor (GDNF) assay. (B) Effect of the ISDPR reaction time on the peak area of 10 ng/mL and 1 ng/mL GDNF assay. |
As shown in Figure 3B, the optical response elevated gradually with the augmenting of reaction time from 10 minutes to 30 minutes. The peak area of the 10 ng/mL GDNF and 1 ng/mL GDNF was significantly higher compared with the blank group (Figure 3B, P<0.05). Further increasing the reaction time led to the increasing background signal. A longer reaction time at 42°C may cause stem separation of the hairpin probe, even in the absence of output DNA3, resulting in a high background signal. The results indicated that 30 minutes is the optimal reaction time (Figure 3B).
Analytical performances
We have examined the sensitivity and dynamic range of the LFB using different concentrations of GDNF under optimal conditions. As shown in Figure 4A, the color intensities of the red bands on the test zone increased with the increasing of GDNF concentrations. No distinct red band was observed on the test zone in the absence of GDNF. For quantitative detections, the optical responses were further confirmed by recording the color intensities of the red bands by a portable strip reader. The peak areas versus the incremental concentrations of GDNF have been plotted in Figure 4B, which followed a sigmoid increase. The resulting calibration curve shows that the peak areas are proportional to the logarithm of GDNF concentrations in the range from 1 pg mL−1 to 10 ng mL−1 (Figure 4C).
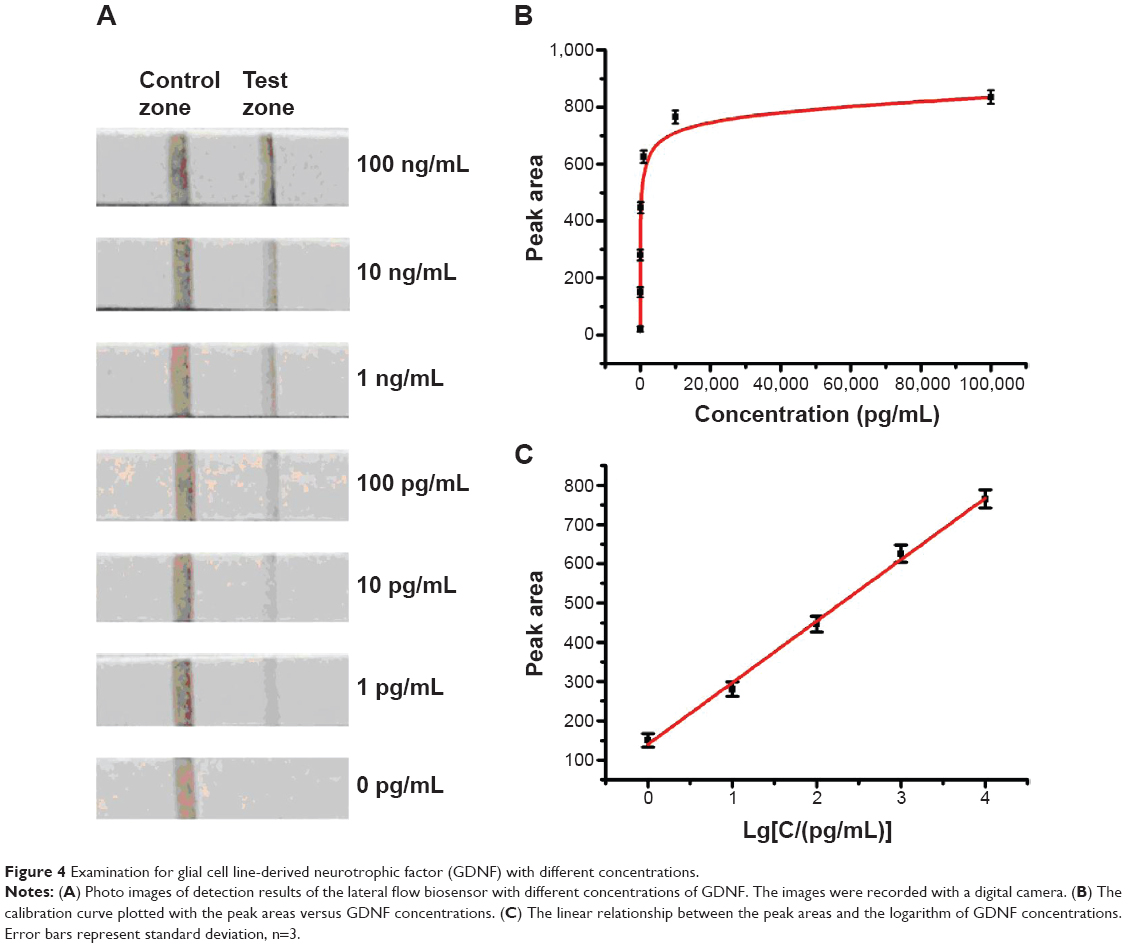 | Figure 4 Examination for glial cell line-derived neurotrophic factor (GDNF) with different concentrations. |
The specificity of the LFB for GDNF was studied by testing the responses of the assay to other kinds of growth factors, including PDGF, TGF-α, TGF-β, EGF, IGF-I, and αFGF, which are similar to GDNF. As shown in Figure 5A, 1 ng/mL GDNF produced a visible bright red band on the test zone of LFB, whereas all other growth factors at a concentration of 100 ng/mL did not yield a red band on the test zone of LFB.
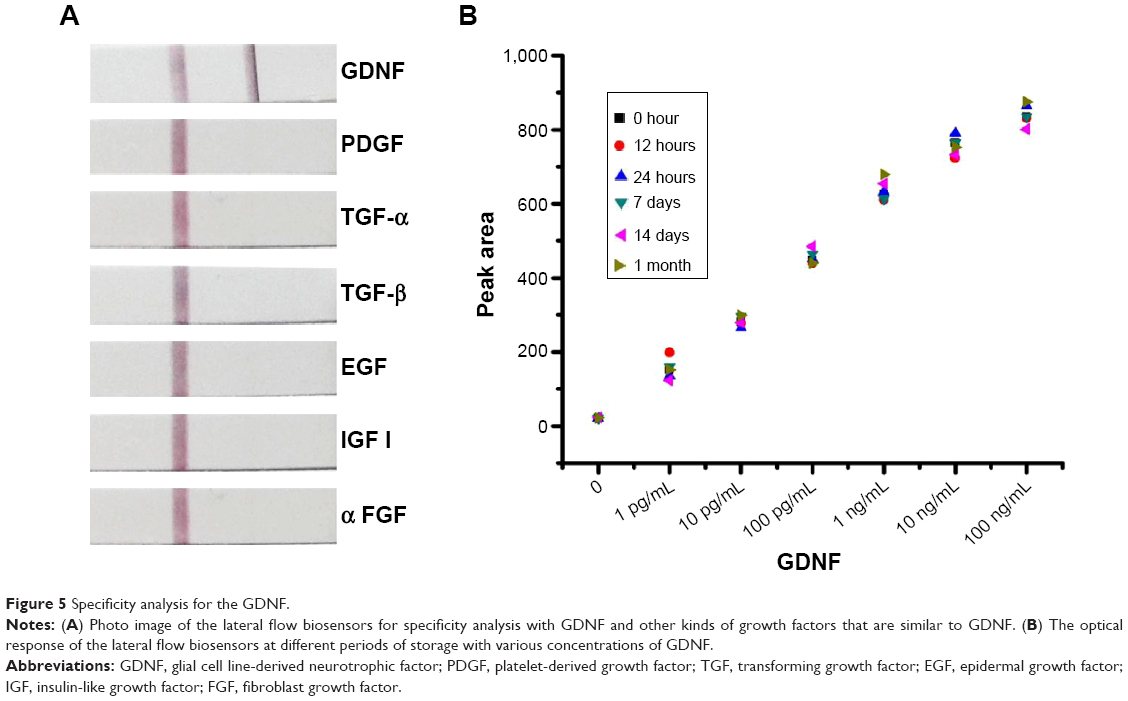 | Figure 5 Specificity analysis for the GDNF. |
We studied the stability and performance of LFBs after different periods of storage. The prepared LFBs were sealed and stored at 37°C for the following time periods: 12 hours, 24 hours, 14 days, and 1 month. As shown in Figure 5B, there were no significant performance differences among different storage times, indicating that the stability of the assay is acceptable.
Discussion
A molecular translator can be employed as a signal transducer by highly converting the input target molecules into a unique output DNA for signal amplification.17,18 ISDPR is a commonly used approach for the DNA signal amplification.16–18 Therefore, we combined the molecular translator and ISDPR method to detect the GDNF in cells.
In this work, ISDPR was used to produce a large amount of digoxin- and biotin-coupled duplex DNA for visual detection of GDNF. Compared with the solutions without ISDPR, the response of the sample with ISDPR was 35 times higher. These results showed that the ISDPR did occur as expected for signal amplification. These results were consistent with Liu et al’s19 reports.
Figure 3A shows that the S/N ratios increased with increasing reaction temperatures in the range from 25°C to 42°C, however S/N ratios decreased with temperatures over 42. These results could be explained by conformational change of the hairpin probe at high temperature, which leads to the stem separation of the hairpin probe. The primer can anneal with the open hairpin probe and trigger a polymerization reaction, even in the absence of output DNA3, resulting in a high background signal. Therefore, an ISDPR temperature of 42°C was selected in the following experiments.
The process of signal amplification by ISDPR is strongly affected by the reaction time. Usually, the ISDPR can be enhanced with increasing the reaction time. In this study, 30 minutes was selected as the reaction time throughout the experiments to obtain the highest signal.
As shown in Figure 4, the red band on the test zone was observed with as little as 1 pg mL−1 of GDNF, which can be considered the limit of detection. Based on the molecular weight of GDNF (13.5 kDa), the limit of detection was calculated to be 74 fM. The detection limit of our proposed approach is two orders of magnitude better than the antibody-based immunoassay.7 Generally, human basal serum GDNF concentrations are between 20 pg/mL and 30 pg/mL. This LFB holds great promise in monitoring GDNF by naked eyes with its superior detection sensitivity and large dynamic range.
From the results of Figure 5A, 1 ng/mL GDNF produced a visible bright red band, while the other growth factors (such as TGF-α, TGF-β, EGF, IGF-I, and αFGF) did not yield a red band even at a concentration of 100 ng/mL. These results indicated that our constructed LFB exhibited excellent selective response to GDNF. Our results also showed that this method is very stable after different periods of storage.
Conclusion
In summary, we have successfully fabricated an LFB for amplified detection of GDNF using a molecular translator for converting the input protein to output DNA signal and ISDPR for signal amplification. Compared with other reported antibody-based immunoassays, the sensitivity of the LFB developed here is higher. By using this assay, GDNF as low as 1 pg mL−1 could be detected by naked eyes within 30 minutes. The response of the optimized assay is highly linear over a range of 1 pg/mL to 10 ng/mL. This new GDNF detection method is expected to be a great potential platform for the detection of protein, which would be valuable for clinical therapy for some diseases related to GDNF.
Disclosure
The authors received no financial support for the research, authorship, and/or publication of this article. The authors declare no conflicts of interest in this work.
References
di Nuzzo L, Orlando R, Nasca C, Nicoletti F. Molecular pharmacodynamics of new oral drugs used in the treatment of multiple sclerosis. Drug Des Devel Ther. 2014;8:555–568. | ||
Feng S, Zhuang M, Wu R. Secretion of nerve growth factor, brain-derived neurotrophic factor, and glial cell-line derived neurotrophic factor in co-culture of four cell types in cerebrospinal fluid-containing medium. Neural Regen Res. 2012;7(36):2907–2914. | ||
Li W, Yang C, Lu J, et al. Tetransrine protects mouse retinal ganglion cells from ischemic injury. Drug Des Devel Ther. 2014;8:327–339. | ||
Salio C, Ferrini F, Muthuraju S, Merighi A. Presynaptic modulation of spinal nociceptive transmission by glial cell line-derived neurotrophic factor (GDNF). J Neurosci. 2014;34(41):13819–13833. | ||
Zhang HY, Song N, Jiang H, Bi MX, Xie JX. Brain-derived neurotrophic factor and glial cell line-derived neurotrophic factor inhibit ferrous iron influx via divalent metal transporter 1 and iron regulatory protein 1 regulation in ventral mesencephalic neurons. Biochim Biophys Acta. 2014;1843(12):2967–2975. | ||
Zhang J, Tan H, Jiang W, Zuo Z. Amantadine alleviates postoperative cognitive dysfunction possibly by increasing glial cell line-derived neurotrophic factor in rats. Anesthesiology. 2014;121(4):773–785. | ||
Neubert H, Muirhead D, Kabir M, Grace C, Cleton A, Arends R. Sequential protein and peptide immunoaffinity capture for mass spectrometry-based quantification of total human β-nerve growth factor. Anal Chem. 2013;85(3):1719–1726. | ||
Picuri JM, Frezza BM, Ghadiri MR. Universal translators for nucleic acid diagnosis. J Am Chem Soc. 2009;131(26):9368–9377. | ||
Li F, Lin Y, Le XC. Binding-induced formation of DNA three-way junctions and its application to protein detection and DNA strand displacement. Anal Chem. 2013;85(22):10835–10841. | ||
Li F, Zhang H, Lai C, Li XF, Le XC. A molecular translator that acts by binding-induced DNA strand displacement for a homogeneous protein assay. Angew Chem Int Ed Engl. 2012;51(37):9317–9320. | ||
Li F, Zhang H, Wang Z, Li X, Li XF, Le XC. Dynamic DNA assemblies mediated by binding-induced DNA strand displacement. J Am Chem Soc. 2013;135(7):2443–2446. | ||
Zhang H, Li F, Li XF, Le XC. Yoctomole detection of proteins using solid phase binding-induced DNA assembly. Methods. 2013;64(3):322–330. | ||
Zhang H, Li XF, Le XC. Binding-induced DNA assembly and its application to yoctomole detection of proteins. Anal Chem. 2012;84(2):877–884. | ||
He Y, Zeng K, Zhang S, et al. Visual detection of gene mutations based on isothermal strand-displacement polymerase reaction and lateral flow strip. Biosens Bioelectron. 2012;31(1):310–315. | ||
Lie P, Liu J, Fang Z, Dun B, Zeng L. A lateral flow biosensor for detection of nucleic acids with high sensitivity and selectivity. Chem Commun. 2012;48(2):236–238. | ||
Guo Q, Yang X, Wang K, et al. Sensitive fluorescence detection of nucleic acids based on isothermal circular strand-displacement polymerization reaction. Nucleic Acids Res. 2009;37(3):e20. | ||
Luo M, Li N, Liu Y, et al. Highly sensitive and multiple DNA biosensor based on isothermal strand-displacement polymerase reaction and functionalized magnetic microparticles. Biosens Bioelectron. 2014;55:218–323. | ||
Kim YW, Kim EY, Jeon D, et al. Differential microRNA expression signatures and cell type-specific association with Taxol resistance in ovarian cancer cells. Drug Des Devel Ther. 2014;8:293–314. | ||
Liu J, Lai T, Mu K, Zhou Z. Strip biosensor for amplified detection of nerve growth factor-beta based on a molecular translator and catalytic DNA circuit. Analyst. 2014;139(19):4874–4878. |
 © 2015 The Author(s). This work is published and licensed by Dove Medical Press Limited. The full terms of this license are available at https://www.dovepress.com/terms.php and incorporate the Creative Commons Attribution - Non Commercial (unported, v3.0) License.
By accessing the work you hereby accept the Terms. Non-commercial uses of the work are permitted without any further permission from Dove Medical Press Limited, provided the work is properly attributed. For permission for commercial use of this work, please see paragraphs 4.2 and 5 of our Terms.
© 2015 The Author(s). This work is published and licensed by Dove Medical Press Limited. The full terms of this license are available at https://www.dovepress.com/terms.php and incorporate the Creative Commons Attribution - Non Commercial (unported, v3.0) License.
By accessing the work you hereby accept the Terms. Non-commercial uses of the work are permitted without any further permission from Dove Medical Press Limited, provided the work is properly attributed. For permission for commercial use of this work, please see paragraphs 4.2 and 5 of our Terms.