")
Back to Journals » Clinical Ophthalmology » Volume 8
Utility values for glaucoma in Brazil and their correlation with visual function
Authors Guedes R, Guedes V, Freitas S, Chaoubah A
Received 4 January 2014
Accepted for publication 10 February 2014
Published 12 March 2014 Volume 2014:8 Pages 529—535
DOI https://doi.org/10.2147/OPTH.S60105
Checked for plagiarism Yes
Review by Single anonymous peer review
Peer reviewer comments 2
Ricardo Augusto Paletta Guedes,1–3 Vanessa Maria Paletta Guedes,1–3 Sirley Maria Freitas,2 Alfredo Chaoubah1
1Federal University of Juiz de Fora, 2Paletta Guedes Ophthalmological Center, 3Santa Casa de Misericórdia Hospital, Juiz de Fora, Brazil
Purpose: We sought to identify the utility values in a group of Brazilian patients with primary open-angle glaucoma (POAG), and to assess its impact on visual acuity (VA) and mean deviation index values.
Materials and methods: This was a cross-sectional study of consecutive patients with POAG, who were interviewed using three methods for obtaining utility values: time trade-off (TTO), standard gamble anchored at risk of death (SG1), and standard gamble anchored at risk of blindness (SG2). Visual function variables (VA and mean deviation index in the better eye) and sociodemographic characteristics (age, sex, race, and educational level) were also obtained for statistical analysis.
Results: The mean age (± standard deviation) of the study population (n=227) was 65.7 (±15.1) years. Mean utility values for the entire population were 0.82 from TTO, 0.90 from SG1, and 0.93 from SG2 (P<0.0001). Age, race, and sex had no influence on the utility values. Higher education tended to predict higher values by TTO, but not by SG1 or SG2. Visual function variables had an influence on utility values. The more advanced the visual loss, whether measured by VA or perimetry, in the better eye, the lower the utility values by all three methods.
Conclusion: We obtained utility values for Brazilian patients with POAG, as well as specific values for different levels of vision loss.
Keywords: primary open-angle glaucoma, visual acuity, quality of life, utility, disease severity
Introduction
Primary open-angle glaucoma (POAG) is the leading cause of irreversible blindness worldwide and in Brazil.1,2 There will be a future trend for a significant increase in both the prevalence and incidence of glaucoma, due to the increase in world population and increased life expectancy.1–3 With this, the impact of this disease and its consequences will be even greater for health systems and society.4
The goal of treatment of POAG is to maintain the quality of life of individuals at a socially acceptable cost.5 Quality of life is a complex and multidimensional concept, which includes a person’s health status, physical and psychological well-being, and social, role, and cognitive functioning.6 In medicine, it is linked to several dimensions, from patients’ concern about the disease and its consequences, through the functional damage caused by the disease, to the discomfort caused by the treatment.5
The quality of life of individuals can be assessed by generic or disease-specific instruments.6–8 Instruments are defined as generic when they were developed for the general population, and aim to evaluate a person’s health-related quality of life. Conversely, when an instrument was specifically developed for a certain field (eg, ophthalmology) or a disease (eg, glaucoma), it aims to assess a restricted dimension of a person’s total quality of life (eg, vision-related quality of life or glaucoma-related quality of life), and it should only be used in that specific population.6–8
Utility values are a very important generic measure to assess the impact of a disease on the health status of the individual. Utility characterizes a person’s perception of quality of life on a scale from 0 to 1, and its measurement quantifies the strength of a person’s preference for a health state.9,10 Utility values were developed in order to allow a comparison of quality of life between different health states (eg, patients with different diseases).11,12 Utility values have some very important and useful characteristics, such as that they are sensitive to small changes in health, reproducible, easy to apply in a short time, easily understood by patients, and have good internal validity.11,12
They are also very often used for economic evaluations in health technology assessment, as they allow the calculation of quality-adjusted life years. Assigning utility values for a particular health state in a given population makes it possible to perform cost-utility studies, the most suitable for comparison of therapeutic strategies.13,14 The most common form of health economic evaluation is cost-effectiveness analysis, where the benefit of the intervention is characterized by a tangible gain (in natural units, such as a year of life saved, 1 mmHg intraocular pressure reduction, etc). Cost-utility analysis is a particular form of cost-effectiveness analysis, in which effectiveness is measured as quality-adjusted life years.9 The Brazilian Ministry of Health has encouraged more and more comparative cost-effectiveness and cost-utility studies in order to improve the efficiency of the Brazilian public health system.14
Utility values can differ in different populations,15–17 and the determination of utility values for glaucoma in the Brazilian population has not been done yet, nor has the best method to determine it in our population been established.
The aim of our study was to identify utility values for a group of Brazilian patients with POAG through three methods: time trade-off (TTO), standard gamble (SG) anchored in risk of death (SG1), and SG anchored in risk of blindness (SG2), and to check the impact of visual acuity (VA) and mean deviation index (MDI) of computerized perimetry in the better eye on these values.
Materials and methods
Consecutive glaucoma patients receiving care in a referral glaucoma clinic were recruited by the researchers between April and September 2010, according to the following inclusion criteria: over 18 years old, with POAG, and under glaucoma treatment for at least 1 year.
Exclusion criteria were refusal to participate in the study, cognitive inability to answer the research questions, lack of data in the chart, having undergone glaucoma surgery during the past 3 months, and visual impairment by any other eye condition than glaucoma. All study participants signed an informed consent form.
The interviews were conducted by a single researcher, trained specifically for this study and masked to the clinical information. The interviews took place before the consultation to avoid any influence of the medical evaluation results on the responses related to quality of life. Patients were treated anonymously (identified by the record number).
First of all, patients answered questions about their level of education. A caregiver assisted illiterate patients with the interview and with the utility exercise, but the interviewer strongly avoided any caregiver influence on the answers. Subsequently, they responded to the questions for obtaining utility values by the TTO and SG methods. These values were obtained through a face-to-face interview, where the interviewer presented the questions on paper to the patients. The questions were presented in a random order to minimize fatigue. In the SG method, the researcher showed a panel with percentages (ranging from 0 to 100%, with increments of 5%), on which the patient had to point out with a pen the chosen percentage. In the TTO method, patients were asked two questions about their expected life expectancy (the number of remaining years they expected to live) and also the number of years they were willing to trade in return for perfect health. In the SG method, patients had to assign the highest risk (in percentage) of death (SG1) or blindness (SG2) they would be willing to assume in return for a complete cure for glaucoma. The SG method was performed in two ways: with an exchange for a restoration to perfect health taken against the risk of death (SG1) or the risk of blindness (SG2).10,16,17
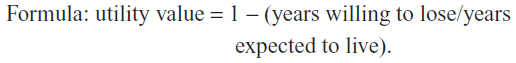
The series of questions and the way to obtain utility values through these questions can be found in the “Supplementary material” section. Utility values ranged from 0 (death) to 1 (perfect health), and we did not consider negative utility values (health states perceived as worse than death).
The variables sex, age, race, antiglaucomatous treatment in progress, history of previous eye surgery, VA, and MDI of computerized visual perimetry (Humphrey®; Carl Zeiss Meditec, Jena, Germany) were obtained from the medical records. We divided the population into three groups according to VA in the better eye: >0.5, between 0.5 and 0.1, and <0.1. We also divided the patients into three groups based on MDI in the better eye: MDI ≥−6.00 dB; −6.00< MDI ≥−12.00 dB, and MDI <−12.00 dB.
Statistical analysis was performed using SPSS version 13.0 (SPSS, Chicago, Il, USA), always seeking a significance level of 95%. Clinical characteristics of the study population were assessed using the means (± standard deviation) and proportions of the variables studied. Comparisons of utility value means were made by a nonparametric test (Kruskal–Wallis test), because of the expected distribution of values (not a normal distribution). Associations between variables were tested using the Spearman correlation test for numerical variables, and χ2 tests for categorical variables. Potential confounding variables, such as age, race, sex, and level of education, were tested and controlled for when necessary. This study was submitted for review and was approved by the ethics committee of the Federal University of Juiz de Fora.
Results
Of the 283 patients who met the inclusion criteria and were invited to participate in the study, 227 (80.2%) agreed and formed the study population. The characteristics of the study population are shown in Table 1. The mean (± standard deviation) of the utility values for the entire population was 0.8195 (±0.2053) using TTO, 0.9009 (±0.1614) using SG1, and 0.9345 (±0.1437) using SG2 (P<0.0001, Kruskal–Wallis test).
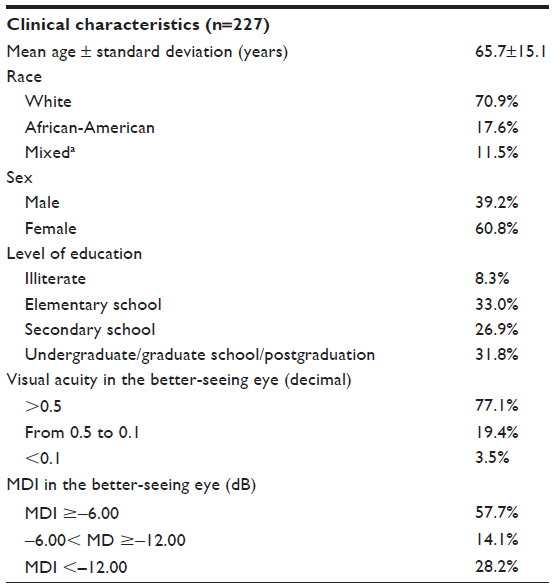 | Table 1 Clinical characteristics of the study population |
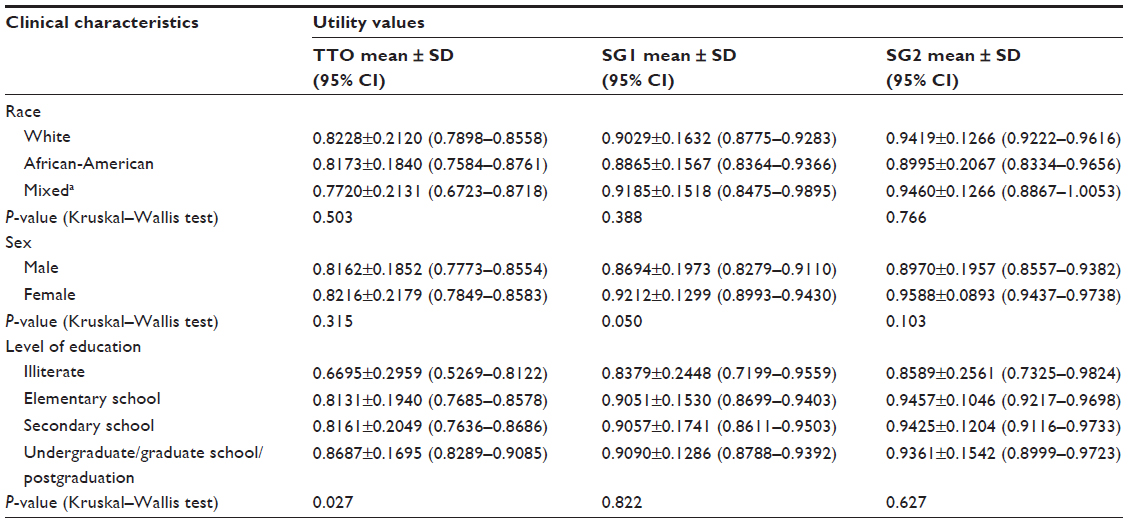
Mean utility values according to race, sex, and level of education, which are potential confounding variables, are demonstrated in Table 2. There were no statistical differences in the mean utility values according to these variables, except for level of education with the TTO method (P=0.027, Kruskal–Wallis test). When we excluded the illiterate group, TTO mean utility values showed no statistical difference among the remaining groups (P=0.207, Kruskal–Wallis test). This indicated that the illiterate group was responsible for that difference. Age, another potential confounding variable, was not correlated with mean utility variables in any of the studied methods. The r-values were as follows: TTO, r=0.067 (P=0.316, Spearman test); SG1 r=0.056 (P=0.404, Spearman test); and SG2, r=0.002 (P=0.982, Spearman test).
 | Table 2 Mean utility values according to race, sex, and level of education |
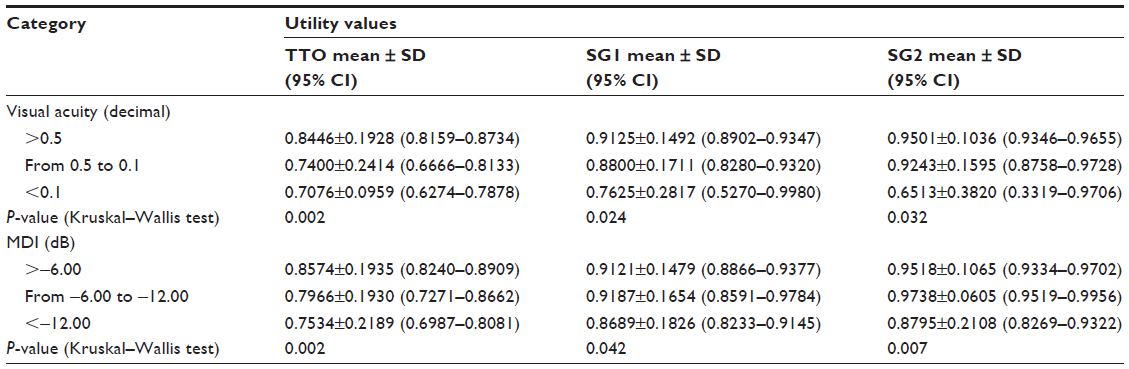
Table 3 shows mean utility values by VA and MDI in the better-seeing eye. These values were statistically different when patients were separated according to VA and MDI in the better eye by all three methods: TTO, SG1, and SG2. The worse the visual function, whether measured by visual acuity or perimetry, in the better eye, the lower the mean utility value.
 | Table 3 Mean utility values by visual function (visual acuity and MDI categories) in the better-seeing eye |
With the TTO method, 135 of 227 respondents (59.5%) agreed to exchange some remaining years of their life for a life free of glaucoma. In the SG method, 55.9% of patients (127/227) accepted some risk of death to be free of glaucoma, while only 44.9% (102/227) accepted some risk of blindness for the same goal.
MDI in the better eye was correlated with mean utility values with all three methods, but the correlation was not strong. In the TTO method, r=0.243 (P<0.001, Spearman test). For the other two methods, SG1 and SG2, values were as follows: r=0.214 (P=0.002, Spearman test) and r=0.171 (P=0.013, Spearman test), respectively.
VA in the better eye was also correlated with mean utility values with TTO (r=0.242, P<0.0001, Spearman test) and SG1 (r=0.155, P=0.019, Spearman test), but not with the SG2 method (r=0.086, P=0.196, Spearman test).
Discussion
We identified mean utility values for patients with POAG in the Brazilian population, using three different methods: TTO, SG1, and SG2. This has never been done previously, and our results may help future outcomes and health economics research in glaucoma in Brazil.
Utility values can be obtained directly through the methods used in this study (TTO and SG), or indirectly by deriving them from the scores obtained through such instruments as the Short Form (36) Health Survey or the EuroQol (EQ-5D).10,11,13,14 Our preference was for the use of direct methods, because these had never been performed in our population.
We decided to perform the SG method in two different ways in order to test whether there would be differences for patients when facing the risk of dying (SG1) or the risk of going blind (SG2). Following previous research in the literature, we used as the upper anchor perfect health, and the lower anchor death (SG1) or blindness (SG2).14,16,17 In our study, most patients accepted some risk of death (55.9%) in comparison with blindness (44.9%), leading us to believe that for some glaucoma patients, dying would be preferred to going blind. This indirectly reflects the high value and importance attributed to vision by individuals, sometimes even greater than life itself. However, this assumption needs to be confirmed in a proper specifically designed study to investigate this relationship between the fear of blindness versus the fear of dying.
In the TTO method, more than half of respondents (59.5%) agreed to exchange some remaining years of life for perfect health without glaucoma. In 2001, Jampel found different results from ours.15 According to his assessment, only 20% of respondents would be willing to lose some remaining years of life for perfect vision. Here, there may be differences in the characteristics of the study population, but also in the method. He used as an upper anchor perfect vision, and we used perfect health.
There are no studies in the Brazilian population that aimed to identify utility values for patients with glaucoma. We found only one study in the ophthalmology field, conducted at the Federal University of Paraná and presented as a personal communication at the 2006 World Ophthalmology Congress, that identified utility values for a diabetic population.18 In that study, the researchers used both the TTO and SG methods.
Our utility value results are comparable to some studies in the literature and different from others. We found values of 0.82 by TTO, 0.90 by SG1, and 0.93 by SG2. Saw et al found very similar results for a Chinese population in Singapore.16 They found 0.88, 0.94, and 0.95 for TTO, SG1, and SG2, respectively. In the US, Jampel found 0.91 for TTO.15 In India, Gupta et al found the following slightly different values, respectively, for TTO, SG1, and SG2: 0.64, 0.86, 0.97.17 These differences underscore the need to regionalize data on utility values and avoid imported values from other populations. This reinforces the importance of our results.
Age, sex, race, and level of education are potential confounding variables, which could have affected our results. Mean utility values were not correlated with age in any of the studied methods (TTO, SG1, or SG2), so our results were not influenced by age. The literature shows that females generally have slightly higher utility values than males. In a study conducted in Singapore, women scored higher by all three methods.16 In our study, we found different results. There was no significant statistical difference in the mean utility values using all methods with regard to sex. Race did not interfere with utility values, as there was no statistical difference for mean utility values within the race categories, and we can use our results for the Brazilian population as a whole with no particular relevance to race. It has been shown in other studies that level of education has an influence on utility values.16,17 The higher the educational level, the higher the utility value assigned. We found that there was a difference in the mean utility values by the TTO method, but not by the SG1 or SG2 methods. When we reanalyzed our data, excluding the illiterate group, the difference disappeared. Therefore, our TTO results may not represent all levels of education, and should not be used for illiterates.
Visual function in the better-seeing eye has an important impact on a patient’s quality of life.6,8,15 Both VA and MDI values are important surrogates for glaucoma patients’ quality of life. This has been determined in other studies in the literature.15–17,19 The worse the vision in the better eye, the lower the utility values. We found a statistically significant difference in mean utility values according to both VA and MDI in the better-seeing eye. This must be taken into account when conducting cost–utility studies in glaucoma. Visual function status, classified by MDI, or VA in the better eye, of the study population must be properly identified to allow the assignment of the correct utility value.
Correlations between both VA and MDI and mean utility values were statistically significant, but fairly weak (around 24% at best). This reiterates that patients’ quality of life depends on many other aspects and dimensions beyond VA and MDI.
In our study, we did not assess the presence of systemic comorbidities, which can have an influence on utility values assigned by patients. This could be a limitation to our findings; however, we followed the guidance of Brown et al, who in a study published in 2002 evaluated 390 patients and found no difference in utility values according to the presence or absence of systemic comorbidities.20 Another limitation is that some of the variables have a small number of patients in one category, such as VA <0.1 (only 3.5% of the patients) and the illiterate group (only 8.3% of the patients). Therefore, our results could not be representative for those specific categories.
During the interviews, the researcher responsible for conducting the questions noted some difficulty by our patients in understanding the concept of risk and expressing it in terms of percentage, which was necessary for evaluation by SG. Therefore, the values obtained by SG should be used with caution and require validation from other studies.
In conclusion, this study was able to obtain the utility values for a Brazilian population with POAG through three different methods, as well as establish the mean utility values for different stages of visual function, based on VA or MDI.
Acknowledgment
This research project was approved by the Ethics Committee in Research of the Federal University of Juiz de Fora, having received the opinion number 004/2010 on March 9, 2010.
Disclosure
The authors report no conflicts of interest in this work.
References
Quigley HA, Broman AT. The number of people with glaucoma worldwide in 2010 and 2020. Br J Ophthalmol. 2006;90(3):262–267. | |
Resnikoff S, Pascolini D, Etya’ale D, et al. Global data on visual impairment in the year 2002. Bull World Health Organ. 2004;82(11):844–851. | |
Leske MC. Open-angle glaucoma – an epidemiologic overview. Ophthalmic Epidemiol. 2007;14(4):166–172. | |
Varma R, Lee PP, Goldberg I, Kotak S. An assessment of the health and economic burdens of glaucoma. Am J Ophthalmol. 2011;152(4):515–522. | |
European Glaucoma Society. Terminology and Guidelines for Glaucoma. 3rd ed. Ghent: EGS; 2008. Available from: http://www.eugs.org/eng/EGS_guidelines.asp. Accessed February 16, 2014. | |
Zanlonghi X, Arnould B, Bechotille A, et al. [Glaucoma and quality of life]. J Fr Ophthalmol. 2003;26 Spec 2:2S39–2S44. French. | |
Tripop S, Pratheepawanit N, Asawaphureekorn S, Anutangkoon W, Inthayung S. Health related quality of life instruments for glaucoma. J Med Assoc Thai. 2005;88 Suppl 9:S155–S162. | |
Severn P, Fraser S, Finch T, May C. Which quality of life score is best for glaucoma patients and why? BMC Ophthalmol. 2008;8:2. | |
Kymes SM. An introduction to decision analysis in the economic evaluation of the prevention and treatment of vision-related diseases. Ophthalmic Epidemiol. 2008;15(2):76–83. | |
Lee BS, Kymes SM, Nease RF Jr, Sumner W, Siegfried CJ, Gordon MO. The impact of anchor point on utilities for 5 common ophthalmic diseases. Ophthalmology. 2008;115(5):898–903. | |
Tsevat J. What do utilities measure? Med Care. 2000;38(Suppl 9):II160–II164. | |
Brown M. Utility analysis tells all. Br J Ophthalmol. 2005;89(10):1233. | |
Brown GC, Brown MM, Sharma S, et al. Value-based medicine and ophthalmology: an appraisal for cost-utility analysis. Trans Am Ophthalmol Soc. 2004;102:177–188. | |
Ministry of Health of Brazil. Methodological Guidelines: Health Technology Assessment Appraisals. Brasilia: Ministry of Health; 2009. | |
Jampel HD. Glaucoma patients’ assessment of their visual function and quality of life. Trans Am Ophthalmol Soc. 2001;99:301–317. | |
Saw SM, Gazzard G, Eong KG, Oen F, Seah S. Utility values in Singapore Chinese adults with primary open-angle and primary angle-closure glaucoma. J Glaucoma. 2005;14(6):455–462. | |
Gupta V, Srinivasan G, Mei SS, Gazzard G, Sihota R, Kapoor KS. Utility values among glaucoma patients: an impact on the quality of life. Br J Ophthalmol. 2005;89(10):1241–1244. | |
Sakata V, Mozena A, Yabumoto C, Hopker L, Sato MT. A comparative study of “time trade-off” and “standard gamble” methods for evaluating quality of life in a diabetic population. Poster presented at: XXX World Ophthalmology Congress; February 19–24, 2006; São Paulo, Brazil. | |
Kobelt G, Jonsson B, Bergström A, Chen E, Lindén C, Alm A. Cost-effectiveness analysis in glaucoma: what drives utility? Results from a pilot study in Sweden. Acta Ophthalmol. 2006;84(3):363–371. | |
Brown MM, Brown GC, Sharma S, Hollands H, Landy J. Quality of life and systemic comorbidities in patients with ophthalmic disease. Br J Ophthalmol. 2002;86(1):8–11. |
Supplementary materials
Road map of questions for obtaining utility values
Time trade-off method (TTO)
1) How many years do you expect to live? ______.
2) Imagine that there is a new treatment for glaucoma that can restore your health in a perfect way. This treatment does not exist and is imaginary. Lesions of glaucoma would disappear and there would be no need for glaucoma treatment for life. The treatment always works, but decreases your lifetime. In short, it improves your quality of life, but decreases your lifetime. What is the maximum number of years you would be willing to give up if you could receive this treatment and have your perfect health for the years you have left? _______.
Standard gamble 1 method (SG1)
Imagine that there is a treatment that can return your life to normal. All glaucoma injuries disappear, and there would be no more need for treatment for the rest of your life. This treatment is imaginary and does not exist. When it works, patients return to have perfect health for the rest of their lives. When it does not work, the patient dies immediately. What is the highest percentage of death that you would accept before undergoing this treatment for vision loss? ________.

Standard gamble 2 method (SG2)
Imagine the same situation before, only when the treatment does not work, rather than lead to death, it leads to complete and irreversible blindness. In short, the treatment restores perfect health or leads to blindness. What is the highest percentage of risk of blindness that you would accept before undergoing this treatment for vision loss? ________.
 © 2014 The Author(s). This work is published and licensed by Dove Medical Press Limited. The full terms of this license are available at https://www.dovepress.com/terms.php and incorporate the Creative Commons Attribution - Non Commercial (unported, v3.0) License.
By accessing the work you hereby accept the Terms. Non-commercial uses of the work are permitted without any further permission from Dove Medical Press Limited, provided the work is properly attributed. For permission for commercial use of this work, please see paragraphs 4.2 and 5 of our Terms.
© 2014 The Author(s). This work is published and licensed by Dove Medical Press Limited. The full terms of this license are available at https://www.dovepress.com/terms.php and incorporate the Creative Commons Attribution - Non Commercial (unported, v3.0) License.
By accessing the work you hereby accept the Terms. Non-commercial uses of the work are permitted without any further permission from Dove Medical Press Limited, provided the work is properly attributed. For permission for commercial use of this work, please see paragraphs 4.2 and 5 of our Terms.