")
Back to Journals » OncoTargets and Therapy » Volume 8
Using an innovative multiple regression procedure in a cancer population (Part I): detecting and probing relationships of common interacting symptoms (pain, fatigue/weakness, sleep problems) as a strategy to discover influential symptom pairs and clusters
Authors Francoeur R
Received 18 April 2014
Accepted for publication 9 June 2014
Published 22 December 2014 Volume 2015:8 Pages 45—56
DOI https://doi.org/10.2147/OTT.S66465
Checked for plagiarism Yes
Review by Single anonymous peer review
Peer reviewer comments 2
Richard B Francoeur1,2
1School of Social Work and the Center for Health Innovation, Adelphi University, Garden City, NY, USA; 2Center for the Psychosocial Study of Health and Illness, Columbia University, New York, NY, USA
Background: The majority of patients with advanced cancer experience symptom pairs or clusters among pain, fatigue, and insomnia. Improved methods are needed to detect and interpret interactions among symptoms or diesease markers to reveal influential pairs or clusters. In prior work, I developed and validated sequential residual centering (SRC), a method that improves the sensitivity of multiple regression to detect interactions among predictors, by conditioning for multicollinearity (shared variation) among interactions and component predictors.
Materials and methods: Using a hypothetical three-way interaction among pain, fatigue, and sleep to predict depressive affect, I derive and explain SRC multiple regression. Subsequently, I estimate raw and SRC multiple regressions using real data for these symptoms from 268 palliative radiation outpatients.
Results: Unlike raw regression, SRC reveals that the three-way interaction (pain × fatigue/weakness × sleep problems) is statistically significant. In follow-up analyses, the relationship between pain and depressive affect is aggravated (magnified) within two partial ranges: 1) complete-to-some control over fatigue/weakness when there is complete control over sleep problems (ie, a subset of the pain–fatigue/weakness symptom pair), and 2) no control over fatigue/weakness when there is some-to-no control over sleep problems (ie, a subset of the pain–fatigue/weakness–sleep problems symptom cluster). Otherwise, the relationship weakens (buffering) as control over fatigue/weakness or sleep problems diminishes.
Conclusion: By reducing the standard error, SRC unmasks a three-way interaction comprising a symptom pair and cluster. Low-to-moderate levels of the moderator variable for fatigue/weakness magnify the relationship between pain and depressive affect. However, when the comoderator variable for sleep problems accompanies fatigue/weakness, only frequent or unrelenting levels of both symptoms magnify the relationship. These findings suggest that a countervailing mechanism involving depressive affect could account for the effectiveness of a cognitive behavioral intervention to reduce the severity of a pain, fatigue, and sleep disturbance cluster in a previous randomized trial.
Keywords: depression, moderated regression, multicollinearity, sickness behavior, statistical interaction, symptom cluster
Erratum for this paper has been published.
Background
Common physical symptoms of pain, fatigue, and sleep disturbance in cancer may be triggered or perpetuated by cell products (cytokines), interventions (side effects from chemotherapy, radiation, surgery, and medications), and even by concurrent symptoms (symptom clusters). These factors may interact in numerous ways to generate and sustain these symptoms. The functioning of hypothalamus–pituitary–adrenal activation, the autonomic nervous system, and circadian rhythms involve a wide range of cytokines and fatigue-related diurnal rhythms,1,2 some of which either alter sleep2,3 or pain,4 or are influenced by sleep2,5 or pain.6 In advanced cancer, cytokines from tumors and bone metastases play greater roles in perpetuating these symptoms, as do side effects from curative chemotherapy, radiation, and surgery. In addition, high doses of opioid medications to control pain may lead to daytime fatigue and sleepiness by disrupting the sleep cycle, which in turn may interfere with opioid drug metabolism and lead to increased pain.7
As these symptoms are precipitated, they may form symptom clusters and become mutually reinforcing;8,9 however, our understanding of cancer-symptom clusters remains limited despite steadily increasing peer-reviewed studies over the past decade.10 In the oncology literature, the term “symptom cluster” is commonly used in a broad and collective sense to refer to symptoms in the same individual that may co-occur as a pair of two symptoms or as a cluster with more than two symptoms. This article adopts this convention, except when the context clarifies that the traditional, more specific definitions for “symptom pair” and “symptom cluster” are intended.
Much of the progress on symptom clusters comes from empirical studies based on factor analysis, principal component analysis, or cluster analysis (Miaskowski et al10 provide an overview). These methods classify symptoms together that occur in the same individuals without distinctions due to symptom severity, however the relationship of a symptom to other symptoms within a symptom cluster, or to patient outcomes, may depend upon its severity or distress.11 In addition, subjective decisions required of the analyst often affect the number and composition of factors, principal components, or clusters, and differences in statistical methods for conducting cluster analysis hinder cross-study comparisons. The most serious limitation of these methods may be that they are not designed to model the multidimensional, dynamic nature of cancer-symptom clusters, where “symptoms may participate in different clusters depending on severity and treatment”.12 Furthermore, it is not enough to know that certain symptoms cluster together: it is important to know how symptoms influence one another, how they interact, when they do. Symptom cluster research needs to begin addressing the dynamic nature of symptoms, since the same symptom could have different impacts on other symptoms depending upon its level or severity.
The use of multiple regression to test interaction terms, or moderated regression analysis (MRA), is a more appropriate procedure for detecting and elucidating the nature of these dynamic aspects of symptom clusters. MRA detects more targeted symptom clusters with fewer symptoms, and within specific ranges of symptom severity, that are mutually influential (ie, interact statistically), in contrast to these other methods that identify clusters across a broader number of symptoms, and that necessarily span the full range within each symptom, without providing any basis that the symptoms within each cluster are mutually influential. The more targeted symptom clusters from MRA may yield insights into particular dynamic contexts which may inform how to target screening efforts to particular patient subgroups; individuals at greater risk for developing negative outcomes can be identified more easily and followed more closely. There may also be potential for symptom-specific interventions to provide crossover relief of other symptoms in the cluster.11 These crossover impacts could improve key outcomes, such as depression, anxiety, cognitive or physical functioning, polypharmacy, adherence to care, mortality, and costs of care.
It follows that an accepted definition of a symptom cluster is when co-occurring symptoms share a common influence on an outcome.13 In the current study, I conduct MRA to explore associations among responses to symptom items within the clinical sample, based on detecting statistical interactions of mutually influential physical symptoms that synergistically predict depressive affect. I introduce and apply a promising new procedure – sequential residual centering (SRC) – which I developed to eliminate “inessential” multicollinearity (the shared or overlapping variation among the main one-way predictor terms and derivative interaction terms that constitute an interaction effect).14 SRC partials away the inflationary influence of inessential multicollinearity on the standard errors (SEs) of regression-slope coefficients, which otherwise limits the capacity of MRA to detect interaction effects, including those that reveal symptom clusters. In the current study, SRC is applied to investigate statistical interactions among the most prevalent co-occurring symptoms documented in the cancer population (ie, pain, fatigue/weakness, sleep difficulties). However, the procedure is also promising for evaluating: 1) additional symptoms, signs, or biomarkers (eg, fever14) to further qualify this symptom interaction across cancer patient subgroups; and 2) other statistical interactions among other symptoms, signs, or biomarkers that form pairs or clusters.
Materials and methods
Sample, measures, and analysis
The data for the secondary analyses of the current study, collected as part of a primary study funded by the National Cancer Institute (Hospice Program grant CA48635), involved a sample of 268 individuals with recurrent cancer who were initiating outpatient palliative radiation to reduce pain from bone metastasis. Participants provided informed consent. The University of Pittsburgh institutional review board approved the protocol.15 The Adelphi University institutional review board exempted these data for secondary analysis from review.
Medical team providers referred participants from five hospitals in a northeastern US city. Table 1 reports sample characteristics. Participants were at least 30 years old, assessed by their oncologists to be beyond cure, although not deemed terminally ill, and had a prognosis of a year or more; they likely differed in diagnosis and treatment stage. Men and women were almost equally represented; ages ranged from 30 to 90 years, with half aged 65 years or older. Comorbid health conditions ranged from none (28.5%), to one (25.8%), to two or more (45.7%).15
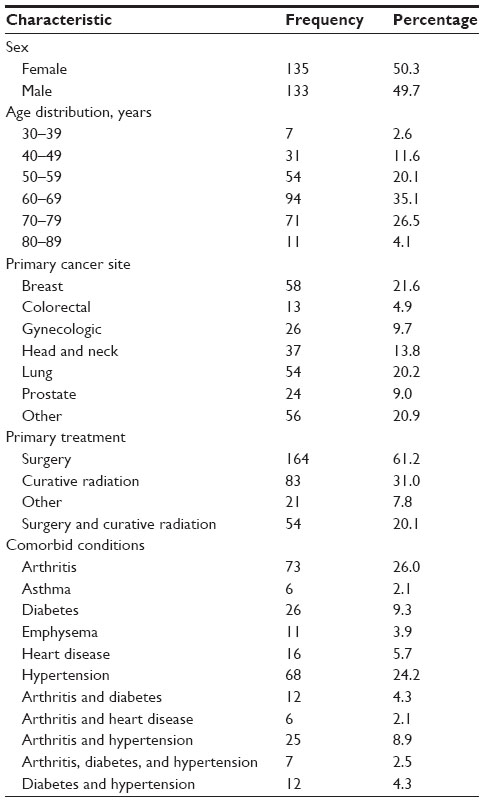 | Table 1 Sample characteristics (n=268) |
A large share (41.8%) of primary cancers were in the breast (21.6%) or lung (20.2%); however, metastasis to other sites also appears to play an important role in influencing symptom experience:
[…] the breast (12.3%) and lung (17.2%) comprise less than a third of all sites of palliative radiation, whereas sites of the neck (8.6%), pelvis/hip (11.2%), prostate (4.5%), and spine/lumbar-low (4.1%) comprise between a fourth and a third of all sites. The remaining 42.1% were among thirty-five other sites across the body. These findings reveal evidence that more than two-thirds of the sites for palliative radiation do not involve the breast or lung […]16
The original investigators describe the structured home interviews to complete survey items; the interviewers were trained in correct procedures for administering the structured interview protocol and coding the responses.15 Participant perceptions of the degree of difficulty in controlling several physical symptoms (each as a single-item) during the past month (the Likert-scaled categories were: complete, a lot, some, a little, and none) are common measures derived from previous studies.15 These items are used in the current study because different lines of converging evidence in the literature collectively attest to the reliability and validity of self-reported, ordinal, single-item measures for degree of control across several physical symptoms.16
The survey included all 20 items from the Center for Epidemiologic Studies-Depression (CES-D) inventory; these ordinal items were categorized based on how frequently they occurred during the past week (rarely, some of the time, much of the time, most of the time).15 As in previous work with these data,16 an additive index of depressive affect was created in the current study from five CES-D items of negative affect (ie, sad, blue, crying, depressed, lonely), three CES-D items of negative affect within interpersonal and situational contexts (ie, bothered, fearful, failure), and three reverse-coded CES-D items of positive affect (ie, hopeful, happy, enjoyed life). Because the remaining somatic items from the CES-D are also symptoms of cancer, they were excluded from depressive affect to prevent confounded relationships with the physical symptom items that constitute independent variables and interactions in MRA. In these survey data, the internal consistency for the eleven CES-D items that constitute depressive affect is very good (α=0.83), which is very close to α=0.85 in the entire CES-D.16 The validity of the depressive affect index is supported by the use of items reflecting positive and negative affect similar to those from two other validated depression scales and by consistent psychometric properties for the constructs of positive and negative affect within the CES-D (see Francoeur16 for details).
Symptom pairs and clusters were based on physical symptoms (pain, fatigue/weakness, sleep problems) over the past month that served as components of two-way and three-way statistical interaction terms, which predicted depressive affect over the past week using moderated regression. A few participants did not surpass the minimum threshold for clinically significant depressive symptoms, based on a total CES-D score between 0 and 10, and were excluded from the moderated regression. All statistical analyses were conducted using SPSS version 19.
Moderated regression and the sequential residual centering procedure
For many years, the use of mean centering in MRA was the recommended approach for conditioning away inessential multicollinearity; however, in recent years, it has been proven that mean centering merely masks (and does not condition away) the inessential multicollinearity that undermines statistical power to detect real relationships.17–19 In response, I developed and validated SRC,14 which is applied in the current study for effective and unbiased conditioning of inessential multicollinearity from the raw regression.
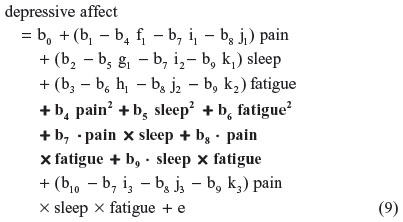
As an illustration, I specify here a three-way (ie, second-order) raw regression of depressive affect on symptom interactions among pain, sleep, and fatigue:
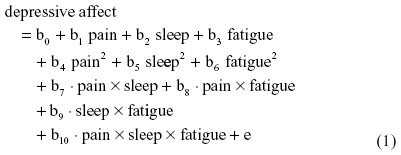
where b0 is the intercept and e is the residual.
In SRC, a regression equation is first estimated by residually centering the three-way interaction term. It is then reestimated by residually centering only the related two-way (quadratic and interaction) terms. In a subsequent reestimation, only the related one-way terms are residually centered. In each reestimation, the residual centered terms should not only partial out lower-order terms, but also all higher-order term(s) in order to be consistent with terms that were factored from the original regression and any prior reestimations.
For instance, nonbiased estimates of the two-way terms are derived in residualizing regressions:


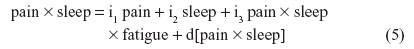


where the last term in every equation (preceded by “d”) is the residual.
Although Equations 5–7 residually center the two-way interaction terms, it may not be clear why the three-way interaction term pain × sleep × fatigue is also specified as a predictor in each of these equations. These specifications partial out the inessential multicollinearity this three-way interaction term shares with each derivative two-way interaction term that is being residually centered. Otherwise, inessential multicollinearity within the overall SRC regression (to be derived next) would remain between each residual centered two-way interaction term and this three-way interaction term. Therefore, the specification of this three-way interaction in Equations 5–7 will result in nonbiased regression slopes (b) for all derivative, residual-centered, two-way interaction terms within the overall SRC regression, which also includes pain × sleep × fatigue, represented by Equations 8 and 9.
Equations 2–7 can be reexpressed to derive d[pain2], d[sleep2], d[fatigue2], d[pain × sleep], d[pain × fatigue], and d[sleep × fatigue], which substitute in Equation 1. I reestimate this raw regression as an SRC regression, factoring out the variance in these two-way terms that are shared with derivative terms:
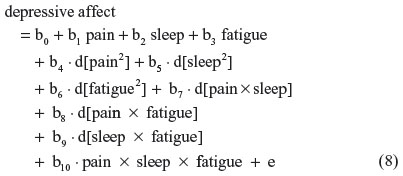
Finally, substituting Equations 2–7 into 8, this residual centered regression is equal to:
All six two-way terms (in bold) are unchanged (ie, non-biased). Similarly, unchanged (ie, nonbiased) derivations result when SRC is applied separately to the one-way or three-way terms. This result is expected because multicollinearity does not bias estimates of regression-slope parameters (unless it is extremely high), even as it inflates SEs.20 Therefore, SRC is expected to yield b-estimates that are identical to those derived from the raw regression in Equation 1. This property was demonstrated in simulated data with different shaped distributions.14 If the three-way interaction term was not also specified in Equations 5–7, the regression-slope parameter estimates in Equations 8 and 9 for the two-way interaction terms – ie, b7, b8, and b9 – would shift as a result of this specification bias. The SEs for these regression-slope parameters do not change either, and their overall variance inflation factor (VIF) values fall to the value of the essential VIF (EVIF), because inessential multicollinearity is alleviated. Moreover, this pattern of nonbiased derivations of regression-slope parameters and SEs, along with reduced VIF values (contrast VIF and EVIF), strictly obtains across each order (ie, one-way, two-way, three-way) of predictors.14 I will use these reduced VIF values (EVIF) later in this section to derive the “essential” portion of each SE estimate that is not inflated by “inessential” multicollinearity. The lower values of these essential SEs (ESEs) will be used in place of the corresponding inflated SEs.
SRC conditions out the inessential multicollinearity among the highest-order interaction term and each of the successively lower-order derivative terms, eg, in Equation 9. This multicollinearity should be expected and constitutes “inessential ill-conditioning”, due to the inclusion of overlapping terms that tap overall effects and derivative subgroup effects. In the absence of SRC, eg, in raw regression (Equation 1), inessential ill-conditioning results in inflated VIF values.
In the final step, I return to the raw regression to condition away inessential ill-conditioning from each predictor or interaction term, ie, the portion of shared variation with related derivative terms that serves to inflate the SE. The EVIF values from the series of SRC regressions, such as Equation 9, are applied within the raw regression (Equation 1) to determine the ESE for each b-parameter, ie, the estimated SE in the raw regression that is influenced by essential ill-conditioning but not by inessential ill-conditioning. For any predictor or interaction term (eg, pain × fatigue), the variance of the b-parameter estimate is related to the VIF, as shown by Shieh:18
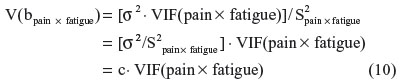
where σ2 is the variance of the regression residual term and S2pain × fatigue is the sum of the squared mean-centered values for pain × fatigue.
In place of software output for σ2 and S2pain × fatigue, the value for c can be calculated directly using the raw regression output for V(bpain × fatigue) and VIF(pain × fatigue), as follows: c = V(bpain × fatigue)/VIF(pain × fatigue).
Then, substituting the EVIF value for bpain × fatigue (from the SRC regression) into Equation 10 in place of VIF(pain × fatigue), while retaining the value for c, yields the essential V(bpain × fatigue):essential V(bpain × fatigue) = c · EVIF(pain × fatigue). Taking the square root of the essential V(bpain × fatigue) yields the ESE of the bpain × fatigue parameter. Finally, when testing the statistical significance of bpain × fatigue, I replace the SE from the raw regression with ESE, to yield a larger z statistic (in absolute value).
Results
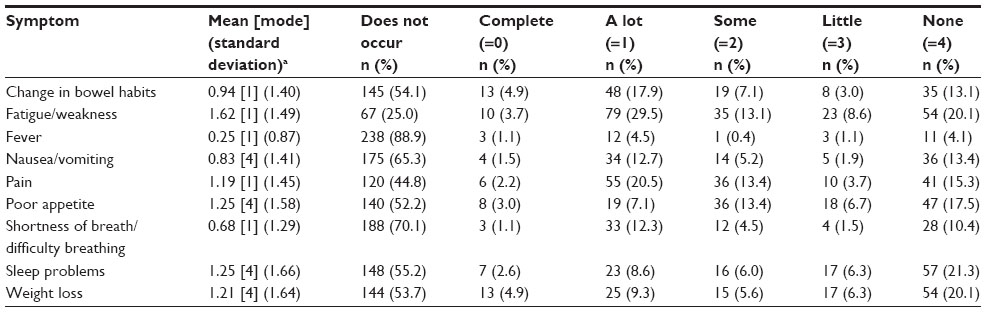
Frequencies of physical symptoms and depressive affect are reported in Tables 2 and 3. All symptom distributions were highly skewed, with most participants reporting complete control of each symptom.
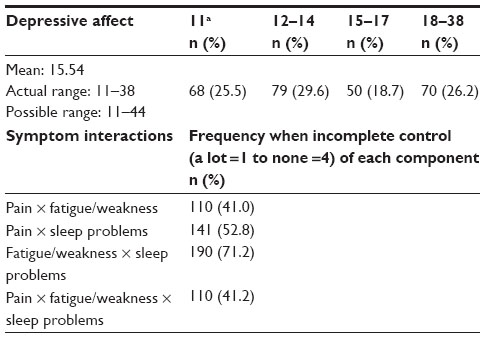
Whether based on sex or age, frequencies for pain × fatigue/weakness (when there are no sleep problems) and pain × fatigue/weakness × sleep problems did not vary much across demographic subgroups within each interaction. The demographic subgroup frequencies for pain × fatigue/weakness were similar (55 females, 55 males, 58 reporting an age less than 65 years, and 52 reporting an age of at least 65 years), as are those for pain × fatigue/weakness × sleep problems (33 females, 35 males, 39 reporting an age less than 65 years, and 29 reporting an age of at least 65 years).
 | Table 2 Extent of symptom control (n=268) |
 | Table 3 Extent of depressive affect and frequencies of symptom interactions (n=268) |
In each interaction, frequencies based on the number of co-occurring conditions also remained similar when no or one comorbidity was reported; however, an increase did occur when there were two comorbidities. The comorbidity-subgroup frequencies for pain × fatigue/weakness were 32 with no comorbidity, 27 with one comorbidity, and 51 with two or more comorbidities, while for pain × fatigue/weakness × sleep problems, the frequencies were 22 with no comorbidity, 18 with on comorbidity, and 28 with two or more comorbidities.
The linear effects of common symptoms, quadratic effects of specific symptoms that are components of symptom interactions, and specific symptom interactions together predict depressive affect in the moderated regression reported in Table 4. As expected, relevant parameter estimates were identical in the raw and SRC regressions; however, unlike the raw regression, the SRC descriptive (1A) and explanatory (1B) regressions resulted in statistical significance of pain × fatigue × sleep at P<0.05.
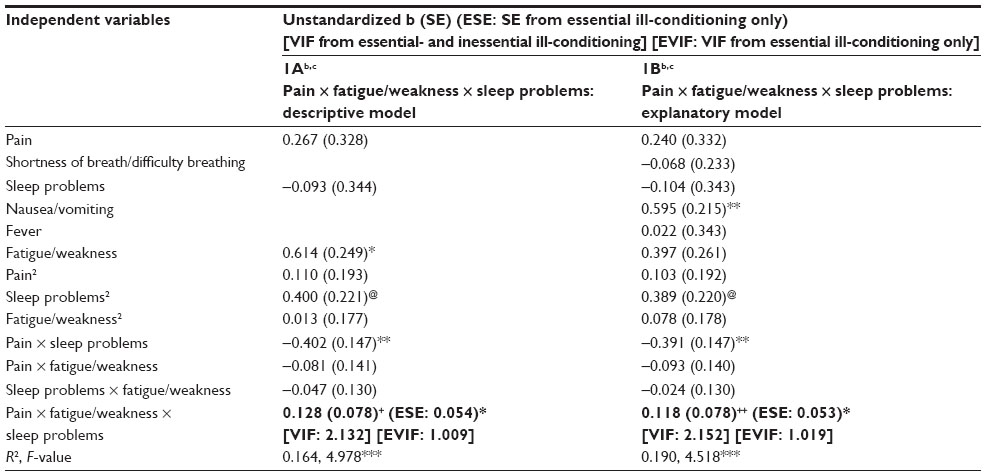 | Table 4 Depressive affect predicted by physical symptoms and symptom interactionsa |
The regression-slope parameters were probed using the expanded zero slope comparison21 – an extension of a follow-up procedure by Nye and Witt22 to interpret two-way interaction effects – in order to interpret the three-way interaction effects (see Supplementary material). These analyses revealed the pain–depressive affect relationship to be aggravated (magnified) when there was 1) low-to-moderate control over fatigue/weakness in the context of complete control over sleep problems, and 2) no control over fatigue/weakness in the context of some-to-no control over sleep problems. Otherwise, the relationship weakens (buffering) as control over either symptom diminishes.
Discussion
For each predictor, the SRC regression may yield a lower VIF value, which is equivalent to the EVIF. The EVIF captures the extent of essential multicollinearity within the standard error of a given b-parameter. It permits us to calculate a lower SE for the corresponding b-parameter in the raw regression (ie, the ESE) based only on the portion of the data constituting the original raw predictor variable that does not contribute to inessential multicollinearity in the raw regression. The ESE reduces the probability value of the slope coefficient (from P=0.128 to P<0.05) for the three-way interaction term in both the descriptive regression (based on the interaction and derivative terms only) and the explanatory regression (which also controls other related symptoms), which is sufficient to alter the statistical conclusion validity and study inferences regarding a symptom pair and cluster. Moreover, several probability values fell, and often dramatically, across the one-way, quadratic, and interaction terms in the original study that developed and validated SRC using 1) small and large samples (simulated and real), 2) predictors with different distributions, and 3) regression coefficients with different patterns.14 Therefore, moderated regression with SRC appears to hold much scope for improving statistical conclusion validity and study inferences in investigations of symptom and biomarker pairs and clusters, as well as other areas of synergistic interaction in oncology and palliative and end-of-life care.
As measures of multicollinearity, the VIF, EVIF, SE, and ESE are based on the entire sample. It is not possible to determine whether reduced multicollinearity results for specific subgroups based on pathology or other adjuvant treatment type (previous surgical intervention, ongoing chemotherapy), since estimation of VIF and EVIF values for separate subgroups would require that many more predictors be specified within the regression equation in order to represent the subgroup and the extended interaction terms within the subgroup. This more complex regression specification would not be feasible using the fairly small study sample: even if estimates could be obtained, their external validity would be suspect, since many would be based on only a few participants. However, when mediator terms (sex, age [<65 years versus 65 years and older], and comorbidities [0, 1, and 2 or more]) are added separately and together to the explanatory regression, only minor shifts occur in the slope parameter and SE for the three-way interaction term. Therefore, there is no evidence to suggest that the relationship between pain–fatigue/weakness–sleep problems and depressive affect occurs disproportionately within sex, age, or comorbidity subgroups.
The post hoc analysis (see Supplementary material) affords expanded insight into the synergistic interaction among pain, fatigue/weakness, and sleep problems within the entire sample. In the context of complete control over sleep problems, the pain–depressive affect relationship was aggravated (magnified) when there was complete to some control over fatigue/weakness (ie, a partial range of the symptom pair based on pain and fatigue/weakness). Curiously, as control over fatigue/weakness continued to decrease, the slope of the pain–depressive affect relationship became weakened (buffered). In earlier work on symptom interactions,16 I suggested fatigue may demonstrate a threshold effect that reduces awareness of pronounced pain.
The reverse occurred as sleep problems also increased (ie, the symptom pair becomes a cluster):at first, the slope of the pain–depressive affect relationship became weakened (buffered) when control over fatigue/weakness diminished from complete to a little, but then became aggravated (magnified) as control over sleep problems diminished between some and none and there was no control over fatigue/weakness. Therefore, the threshold effect (buffering) is not maintained when control over these comoderating symptoms is marginal or lacking. In this context, the threshold could be confounded in part by measurement error in participants’ responses when there is higher control over both of these closely related symptoms, an issue I will address shortly. However, these findings also suggest a mechanism to account for the effectiveness of a cognitive behavioral (CB) intervention that reduced the severity of a pain, fatigue, and sleep disturbance cluster in a randomized control trial.23 By increasing control over these cluster symptoms, CB may shift these individuals from experiencing an aggravated (magnified) relationship with depressive affect and into the threshold range of a buffered relationship. In addition, CB is a common and well-researched treatment for depression. Therefore, CB could trigger: 1) a drop in depressive affect (an indicator of the physiological response of malaise during sickness behavior), which in turn mediates the reduced severity of the cluster symptoms; and/or 2) the reduced severity of the cluster symptoms directly, which then leads to lower depressive affect (a mental health outcome reflecting illness-related depression).
The use of SRC in the MRA suggests some interesting implications for measurement of the predictor variables. The psychometric perspective that attributes estimation bias and potential faulty inferences to “measurement error in variables” suggests that the use of self-reported, single-item symptom measures could be a study weakness. In particular, some participants may have found it difficult to discriminate fatigue/weakness from daytime sleepiness. If this is true, there may be some misclassification between these two symptoms; a symptom inventory for one of both of these symptoms would have been useful to partial out this measurement error. On the other hand, the competing econometric perspective of “errors in the equation” attributes estimation bias and faulty inferences to “model misspecification”, which include distortions from multicollinearity.20 SRC conditions away inessential multicollinearity in interaction terms and their derivative terms in order to derive unbiased parameter SE estimates.
Because the extent and influence of actual measurement errors in variables (ie, not inferred from psychometric models) is rarely known, the psychometric and econometric perspectives usually cannot be compared. There may be indirect clues, however. The need for psychometric solutions within regression models should be questioned when overall scores from validated symptom scales improve sensitivity in detecting effects that arise more from overcoming inessential multicollinearity within an SRC regression – especially when replacing the scale with a key symptom item results in similar or improved findings – than from overcoming the presumed confounding effects of measurement errors in scale items within the raw regression. The need for psychometric solutions should also be questioned when they lead to faulty inferences about symptom clusters when essential multicollinearity remains. (These issues also apply to regression-based structural equation models where latent construct predictors are indicated by the items of the symptom scale).
It follows then that researchers should not automatically assume that single-item symptom measures may engender high levels of measurement error that lead to faulty inferences about symptom clusters. Francoeur,16 for instance, summarized different lines of converging evidence in the literature that attest to the reliability and validity of self-reported, ordinal, single-item measures of symptom control. The larger issue regarding the adequacy and limitations of single-item symptom measures remains unsettled in the absence of a sufficient body of careful studies investigating the real impacts of known measurement error in symptom data. Future studies should also assess whether the performance of single-item measures depends on the use of true versus hybrid ordinal scales; true ordinal scales are based on discretely bounded, rank-ordered categories, while hybrid ordinal scales incorporate an underlying continuous dimension across the ordinal categories, such as the symptom-control items in the current study.
Finally, it may not be necessary to estimate every SRC regression for any given moderated regression, as we might otherwise assume given the comprehensive derivation of the SRC procedure. In many cases, the SRC regressions for post hoc analyses of patient profiles can be conducted more efficiently. Note that the overall interaction effect is based not only on a statistically significant highest-order interaction term (the three-way interaction term in this study) but necessarily incorporates all lower-order derivative terms (two- and one-way terms in this study), regardless of whether they are also statistically significant. This inherent property suggests an approach for conducting only the SRC runs that are necessary (also, see Francoeur14), assuming specification of only a single highest-order interaction term, as in each of the Table 2 regressions:
- Estimate the regression that residually centers the highest-order interaction term in order to obtain the b-parameter and ESE of this highest-order term. The z statistic based on the ESE signals whether or not the highest-order interaction term is statistically significant.
- If the highest-order interaction term is statistically significant, estimate the raw regression (ie, without SRC) to obtain the b-parameters and SEs of all remaining terms. The b-parameter and SE of the highest-order term should be identical in this raw regression and in the residually centered regression.
- With the exception of the highest-order interaction term, if any remaining terms have inflated VIF values in the raw regression exceeding a value of 10, estimate the SRC regression separately and sequentially for each lower-order set of terms revealing one or more inflated VIF values. For terms with inflated VIF values, base z statistics on the ESE. Inspect the EVIF values to assess whether any remaining essential multicollinearity is problematic.
Conclusion
This study demonstrates that SRC reduces multicollinearity and improves statistical conclusion validity by providing unbiased regression-slope coefficients and reduced SEs for one-way predictors and their derivative quadratic and interaction terms, a prerequisite for post hoc analysis to reveal symptom pairs and clusters by identifying the nature (aggravating, buffering) of interaction effects across patient subgroups. Specifically, in contrast to the original raw regression, SRC detects a statistically significant relationship involving a set of concurrent, interacting physical symptoms (pain, fatigue/weakness, sleep problems) and depressive affect. In contrast to calls for multisite investigations of subgroup effects that cannot be detected in underpowered small samples, the current study was feasible because SRC capitalizes on statistical power by eliminating inessential multicollinearity within this small to moderate-size sample, thereby improving the capacity to detect derivative or subgroup effects. SRC is promising for investigations of pairs and clusters of symptoms and biomarkers, as well as in other areas of synergistic interaction in palliative and end-of-life care and the broad field of oncology.
Acknowledgments
I thank Richard Schulz, MD (Professor of Psychiatry, Director of the University Center for Social and Urban Research, Director of Gerontology, and Associate Director of the Institute on Aging at the University of Pittsburgh) for the opportunity to use secondary data from advanced cancer patients (Hospice Program Grant, CA48635, National Cancer Institute) in the analyses reported in this article. Portions of this paper were presented at the International Symposium on Supportive Care in Cancer (June 2012) of the Multinational Association of Supportive Care in Cancer, New York, NY, USA, and at the 65th Annual Scientific Meeting (November 2012) of the Gerontological Society of America, San Diego, CA, USA.
Disclosure
The author reports no conflicts of interest in this work.
References
Raison CL, Borisov AS, Woolwine BJ, Massung B, Vogt G, Miller AH. Interferon-α effects on diurnal hypothalamic-pituitary-adrenal axis activity: Relationship with pro-inflammatory cytokines and behavior. Mol Psychiatry. 2010;15(5):535–547. | |
Bryant PA, Trinder J, Curtis N. Sick and tired: does sleep have a vital role in the immune system? Nat Rev Immunol. 2004;4(6):457–467. | |
Vgontzas AN, Chrousos GP. Sleep, the hypothalamic-pituitary-adrenal axis, and cytokines: multiple interactions and disturbances in sleep disorders. Endocrinol Metab Clin North Am. 2002;31(1):15–36. | |
Watkins LR, Maier SF. Beyond neurons: evidence that immune and glial cells contribute to pathological pain states. Physiol Rev. 2002;82(4):981–1011. | |
Kapsimalis F, Richardson G, Opp MR, Kryger M. Cytokines and normal sleep. Curr Opin Pulm Med. 2005;11(6):481–484. | |
Üçeyler N, Valenza R, Stock M, Schedel R, Sprotte G, Sommer C. Reduced levels of antiinflammatory cytokines in patients with chronic widespread pain. Arthritis Rheum. 2006;54(8):2656–2664. | |
Dimsdale JE, Norman D, DeJardin D, Wallace MS. The effects of opioids on sleep architecture. J Clin Sleep Med. 2007;3(1):33–36. | |
Edwards RR, Almeida DM, Klick B, Haythornthwaite JA, Smith MT. Duration of sleep contributes to next-day pain report in the general population. Pain. 2008;137(1):202–207. | |
Gupta A, Silman AJ, Ray D, et al. The role of psychosocial factors in predicting the onset of chronic widespread pain: results from a prospective population-based study. Rheumatology. 2007;46:666–671. | |
Miaskowski C, Aouizerat BE, Dodd M, Cooper B. Conceptual issues in symptom clusters research and their implications for quality-of-life assessment in patients with cancer. J Natl Cancer Inst Monogr. 2007;(37):39–46. | |
Miaskowski C, Dodd M, Lee K. Symptom clusters: the new frontier in symptom management research. J Natl Cancer Inst Monogr. 2004;(32):17–21. | |
Kirkova J, Walsh D. Cancer symptom clusters – a dynamic construct. Support Care Cancer. 2007;15(9):1011–1013. | |
Fox SW, Lyon D. Symptom clusters and quality of life in survivors of ovarian cancer. Cancer Nurs. 2007;30(5):354–361. | |
Francoeur RB. Could sequential residual centering resolve low sensitivity in moderated regression? Simulations and cancer symptom clusters. Open J Stat. 2013;3(6A):24–44. | |
Schulz R, Williamson GM, Knapp JE, Bookwala J, Lave J, Fello M. The psychological, social, and economic impact of illness among patients with recurrent cancer. J Psychosoc Oncol. 1995;13(3):21–45. | |
Francoeur RB. The relationship of cancer symptom clusters to depressive affect in the initial phase of palliative radiation. J Pain Symptom Manage. 2005;29(2):130–155. | |
Aiken LS, West SG. Multiple Regression: Testing and Interpreting Interactions. Newbury Park (CA):Sage; 1991. | |
Shieh G. Clarifying the role of mean centring in multicollinearity of interaction effects. Br J Math Stat Psychol. 2011;64(3):462–477. | |
Echambadi R, Hess JD. Mean-centering does not alleviate collinearity problems in moderated regression models. Mark Sci. 2007;26(3):438–445. | |
Kennedy P. A Guide to Econometrics. 4th ed. Cambridge (MA):MIT; 1998. | |
Francoeur RB. Interpreting interactions of ordinal or continuous variables in moderated regression using the zero slope comparison: tutorial, new extensions, and cancer symptom applications. Int J Soc Sys Sci. 2011;3(1–2):137–158. | |
Nye LG, Witt LA. Interpreting moderator effects: substitute for the signed coefficient rule. Educ Psychol Meas. 1995;55(1):27–31. | |
Kwekkeboom KL, Abbott-Anderson K, Cherwin C, Roiland R, Serlin RC, Ward SE. Pilot randomized controlled trial of a patient-controlled cognitive-behavioral intervention for the pain, fatigue, and sleep disturbance symptom cluster in cancer. J Pain Symptom Manage. 2012;44(6):810–822. |
Supplementary material
In the following post hoc analysis, I interpret the three-way interaction effects from model 1B in Table 4 by probing regression-slope parameters using the expanded zero slope comparison procedure.1 Specifically, I interpret the nature of comoderation by fatigue/weakness across the various levels of sleep problems:

Setting ∂y′/∂x =0:

Select w where |−0.093 + 0.118w| is highest in absolute value: (whigh =4, wlow =0).
a. At whigh=4: z0,w= 4 =3.493
The z0,w=4 is inside the actual range of z values (0–4).
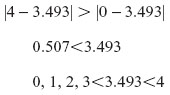
When there is no control over sleep problems (w=4), fatigue/weakness buffers the pain–depressive affect relationship when there is complete control to a little control of fatigue/weakness (ie, z=0, 1, 2, 3), and magnifies the pain–depressive affect relationship when there is no control of fatigue/weakness (ie, z=4).
b. At w=3: z0,w=3 =3.574
The z0,w=4 is inside the actual range of z values (0–4).
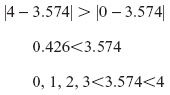
When there is a little control over sleep problems (w=3), fatigue/weakness buffers the pain–depressive affect relationship when there is complete control to a little control of fatigue/weakness (ie, z=0, 1, 2, 3), and magnifies the pain–depressive affect relationship when there is no control of fatigue/weakness (ie, z=4).
c. At w=2: z0,w=2 =3.790
The z0,w=2 is inside the actual range of z values (0–4).
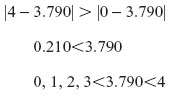
When there is some control over sleep problems (w=2), fatigue/weakness buffers the pain–depressive affect relationship when there is complete control to a little control of fatigue/weakness (ie, z=0, 1, 2, 3), and magnifies the pain–depressive affect relationship when there is no control of fatigue/weakness (ie, z=4).
Combining a, b, and c
When there is some control to no control over sleep problems (w=2, 3, or 4), fatigue/weakness buffers the pain–depressive affect relationship when there is complete control to a little control of fatigue/weakness (ie, z=0, 1, 2, 3), and magnifies the pain–depressive affect relationship when there is no control of fatigue/weakness (ie, z=4).
d. At w=1: z0,w=1 =6.040
The z0,w=1 is outside the actual range of z values (0–4).
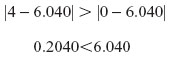
When there is a lot of control over sleep problems (w=1), fatigue/weakness buffers the pain–depressive affect relationship over the full range of fatigue/weakness, from complete control to no control (ie, z=0–4).
e. At w=0: z0,w=0 =2.581
The z0,w=0 is inside the actual range of z values (0–4).
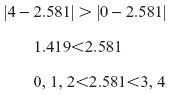
When there is complete control over sleep problems (w=0), fatigue/weakness magnifies the pain–depressive affect relationship when there is complete control to some control of fatigue/weakness (ie, z=0, 1, 2), and buffers the pain–depressive affect relationship when there is a little control to no control of fatigue/weakness (z=3, 4).
Reference
Francoeur RB. Interpreting interactions of ordinal or continuous variables in moderated regression using the zero slope comparison: tutorial, new extensions, and cancer symptom applications. Int J Soc Sys Sci. 2011;3(1–2):137–158. |
 © 2014 The Author(s). This work is published and licensed by Dove Medical Press Limited. The full terms of this license are available at https://www.dovepress.com/terms.php and incorporate the Creative Commons Attribution - Non Commercial (unported, v3.0) License.
By accessing the work you hereby accept the Terms. Non-commercial uses of the work are permitted without any further permission from Dove Medical Press Limited, provided the work is properly attributed. For permission for commercial use of this work, please see paragraphs 4.2 and 5 of our Terms.
© 2014 The Author(s). This work is published and licensed by Dove Medical Press Limited. The full terms of this license are available at https://www.dovepress.com/terms.php and incorporate the Creative Commons Attribution - Non Commercial (unported, v3.0) License.
By accessing the work you hereby accept the Terms. Non-commercial uses of the work are permitted without any further permission from Dove Medical Press Limited, provided the work is properly attributed. For permission for commercial use of this work, please see paragraphs 4.2 and 5 of our Terms.