")
Back to Journals » International Journal of Nanomedicine » Volume 9 » Issue 1
Use of electrical impedance spectroscopy to detect malignant and potentially malignant oral lesions
Authors Murdoch C, Brown B, Hearnden V, Speight P, D'Apice K, Hegarty A, Tidy J, Healey TJ, Highfield P, Thornhill M
Received 14 March 2014
Accepted for publication 3 May 2014
Published 23 September 2014 Volume 2014:9(1) Pages 4521—4532
DOI https://doi.org/10.2147/IJN.S64087
Checked for plagiarism Yes
Review by Single anonymous peer review
Peer reviewer comments 3
Craig Murdoch,1 Brian H Brown,6 Vanessa Hearnden,1 Paul M Speight,3 Katy D’Apice,1,2 Anne M Hegarty,2 John A Tidy,4 T Jamie Healey,5 Peter E Highfield,7 Martin H Thornhill1,2
1Unit of Oral and Maxillofacial Medicine and Surgery, University of Sheffield School of Clinical Dentistry, Sheffield, United Kingdom; 2Unit of Oral Medicine, Charles Clifford Dental Hospital, Sheffield Teaching Hospitals National Health Service Foundation Trust, Sheffield, United Kingdom; 3Unit of Oral and Maxillofacial Pathology, University of Sheffield School of Clinical Dentistry, Sheffield, United Kingdom; 4Department of Gynaecological Oncology, 5Department of Medical Physics, Royal Hallamshire Hospital, Sheffield, United Kingdom; 6University of Sheffield Medical School, Beech Hill Road, Sheffield, United Kingdom; 7Zilico Ltd., The MedTECH Centre, Rutherford House, Manchester Science Park, Manchester, United Kingdom
Abstract: The electrical properties of tissues depend on their architecture and cellular composition. We have previously shown that changes in electrical impedance can be used to differentiate between different degrees of cervical dysplasia and cancer of the cervix. In this proof-of-concept study, we aimed to determine whether electrical impedance spectroscopy (EIS) could distinguish between normal oral mucosa; benign, potentially malignant lesions (PML); and oral cancer. EIS data were collected from oral cancer (n=10), PML (n=27), and benign (n=10) lesions. EIS from lesions was compared with the EIS reading from the normal mucosa on the contralateral side of the mouth or with reference spectra from mucosal sites of control subjects (n=51). Healthy controls displayed significant differences in the EIS obtained from different oral sites. In addition, there were significant differences in the EIS of cancer and high-risk PML versus low-risk PML and controls. There was no significant difference between benign lesions and normal controls. Study subjects also deemed the EIS procedure considerably less painful and more convenient than the scalpel biopsy procedure. EIS shows promise at distinguishing among malignant, PML, and normal oral mucosa and has the potential to be developed into a clinical diagnostic tool.
Keywords: oral cancer, head and neck cancer, potentially malignant lesions, dysplasia, impedance spectroscopy
Introduction
Cancers of the lip and oral cavity are the ninth most common cancers worldwide, with approximately 260,000 new cases and 127,000 deaths reported in 2008.1 This year alone, it is estimated that there will be 28,000 new cases and 5,500 deaths in the United States attributable to oral squamous cell carcinoma (OSCC).2 The worldwide incidence is increasing,3 and the disease has a poor prognosis, with less than 55% overall 5-year survival.4–6 Treatment of OSCC often requires disfiguring surgical treatment and/or radiotherapy or chemotherapy. However, if it is detected early, the prognosis and outcome are considerably improved, with up to a 90% 5-year survival rate.
Many oral cancers are preceded by potentially malignant lesions (PML). Clinically, these present most often as white (leukoplakia) or, occasionally, red (erythroplakia) oral lesions affecting the oral mucosa.4 The reported incidence and prevalence of PML vary markedly between different regions of the world, with incidence levels ranging from 0.6 to 30.2/1,000 people and prevalence between 1%–5% of a given population, depending on the location of the study.5 Although PML are relatively common, only a small percentage (5%–15%) progress to cancer,5,6 and although clinical signs, such as a nonhomogeneous surface or a stippled appearance, suggest higher risk for malignant transformation, there are currently no reliable clinical indicators to predict which lesions will progress to cancer. Current good practice dictates that all suspicious oral lesions be surgically biopsied and subjected to histopathological assessment for evidence of oral epithelial dysplasia (OED). Using the World Health Organization (WHO) classification,7 pathologists use certain cell and tissue morphological characteristics to grade OED as no, mild, moderate, or severe dysplasia or carcinoma in situ. The severity of OED is currently regarded by many as the most reliable indicator of the risk for malignant change in a PML.8–10 Recently, a binary system for grading OED has been proposed.11 Although not widely accepted yet, this binary grading scheme divides lesions with OED into just two categories: high-risk OED and low-risk OED. The authors claim this reduces interobserver variability in lesion grading and results in better sensitivity and specificity for predicting which lesions with OED will undergo malignant change.11,12 Binary classification of OED lesions may also fit the needs of clinicians better when it comes to making critical management decisions about lesions; for example, should the lesion be kept under observation (low-risk OED) or be excised (high-risk OED)?
A major limitation to the use of biopsy and histopathological analysis for assessing PML is that most oral lesions show no signs of OED, so many patients may receive a biopsy unnecessarily. This increases the cost of managing PML and may have a detrimental physical and psychological effect on patients. Also, although the severity of OED may be predictive of the risk for malignant change, the grading of OED is highly subjective and liable to considerable inter- and intraexaminer variation.12,13 This is compounded by the sampling error that occurs in identifying the optimal site to biopsy, particularly with large or multiple lesions. Multiple biopsies can be difficult to perform, are invasive, and are often unacceptable to the patient. As a result, the degree of OED identified in the biopsy specimen may not reflect the degree of OED elsewhere in the lesion or at other sites in the mouth. Furthermore, the taking of a biopsy and its histopathological assessment are both time-consuming and resource-intensive. Therefore, there is considerable interest in the development of novel, rapid, noninvasive, point-of-care, quantitative methods of assessing lesions that are not so dependent on the subjective assessment of OED, which could help reduce diagnostic variability and improve patient care.
Patients presenting with PML pose considerable management problems for clinicians. For the majority of lesions that have less severe OED, management usually consists of watchful waiting and reduction of risk habits (smoking, alcohol consumption, etc), as excision of PML may not reduce the risk for malignant change.14 However, clinical observation is poor at detecting worsening OED and early malignant change. Although regular repeat biopsies would be more effective than clinical observation alone, the timing of these is difficult, and they are subject to the same issues of sampling error, subjectivity, and variability in grading. In addition, regular rebiopsy is costly and unpleasant for the patient. There would be enormous benefit in terms of monitoring disease progression and response to treatment, as well as reducing cost in having less invasive point-of-care assessment tools that would permit more regular longitudinal monitoring of PML, particularly if this can be done noninvasively chair side, with the results instantly available.
Several adjunctive techniques are available to aid visual examination of PML. These include chemiluminescence, acetowhite staining of tissues, tissue staining with toluidine blue or Lugol’s iodine, and veloscope visualization.15–18 The sensitivity and specificity of each of these methodologies is sufficiently low that they are not promoted as diagnostic tests in their own right but, rather, as aids to the identification of lesions that should be subject to biopsy. Recently, there has been much interest in developing electrical and optical devices to assess oral PML. Imaging techniques such as optical coherence tomography and narrow band imaging that are able to detect changes in the cellular structure of the oral epithelium have been used to assess PML.19,20 Electrical impedance spectroscopy (EIS) has recently been developed as a new point-of-care diagnostic screening tool for the detection and assessment of cervical dysplasia and early cervical cancer.21 All biological tissues have electrical impedance that is a function of frequency because tissues contain components (cells, matrix, etc) that have both resistive and capacitive (charge storage) properties. Both the size of the impedance and the dependence of impedance on frequency are related to tissue composition, and so different tissue structures are associated with different frequency bands within an impedance spectrum. At high frequencies (>1 GHz), molecular structure is the determining factor, whereas at low frequencies (<100 Hz), charge accumulation at large membrane interfaces dominates. At frequencies of a few kilohertz to 1 MHz, sometimes referred to as the β-dispersion region, cell structures are the main determinant of tissue impedance. Within the β-dispersion region, low-frequency current passes around the cells, and the resistance to flow will depend on the cell spacing and cellular arrangement of the tissue. However, at higher frequencies, the current can penetrate the cell membranes, and therefore passes through cells, as well as extracellular spaces. Here, the resistance to flow is determined by intracellular volume and nuclear size.
The relationship between tissue structure and imposed electrical current flow in cervical tissues has already been demonstrated,22–24 and EIS is able to successfully detect cervical cancer and precancer in these tissues.21,25 There are similarities between cervical cancer/precancer and oral cancer/PML both histologically and clinically, so this new method for detecting cervical epithelial dysplasia may be equally applicable to oral lesions. The overall objective of this proof-of-concept study was to determine whether EIS has the potential to correctly identify oral lesions in patients in whom the diagnosis was confirmed by biopsy and histopathology.
Materials and methods
This study was approved by the National Research Ethics Service (no. 11/H0903/4) and the University of Sheffield Research Ethics Committee and was conducted in compliance with the Helsinki Declaration. Each subject agreed to participate in the study with signed, informed consent.
Study and control subjects
A total of 47 study subjects were recruited from patients attending the oral medicine clinic at the Charles Clifford Dental Hospital, Sheffield Teaching Hospitals National Health Service Foundation Trust, Sheffield, United Kingdom. Patients were recruited in a nonconsecutive manner. EIS spectra were obtained from patients with lesions more than 8 mm in diameter and in whom the histopathological diagnosis was already known. Patients with pacemakers, those younger than 16 years, and those with lesions smaller than 8 mm in diameter were excluded from the study. The presence of OED in lesions was identified and graded using the WHO classification system.7 Lesions were categorized as having oral squamous cell carcinoma (n=10), severe dysplasia (n=7), moderate dysplasia (n=10), mild dysplasia (n=10), or benign lesions (n=10; consisting of lichen planus [n=4], hyperkeratosis [n=3], lichenoid reaction [n=2], and chronic hyperplastic candidiasis [n=1]). The histological tissue sections were then reanalyzed and the OED regraded, using the binary classification system,11 into OSCC (n=10), high-risk dysplasia (n=13), low-risk dysplasia (n=14), or benign (n=10). In a further analysis, we grouped the lesions with OSCC or high-risk dysplasia together into a high-risk lesion group (n=23) and those lesions that had low risk dysplasia or were benign into a low-risk lesion group (n=24).
In total, 75 lesional EIS spectra were available for analysis. In 18 of the 47 patients, two measurements were made from the lesion, and in five patients, three measurements were made. In all cases, the mean of the measurements made from each lesion was used in analysis. In addition, 47 measurements were made from clinically normal appearing mucosa at the same site as the lesion, but on the contralateral side of the mouth.
Controls (n=51) consisted of healthy volunteers with no previous history of oral mucosal disease. In the control subjects, EIS spectra were obtained from 12 different anatomical sites in the mouth (right/left buccal mucosa, right/left gingiva, midline labial mucosa, vermillion, right/left lateral tongue, midline dorsum of tongue, midline ventral tongue, floor of mouth, and hard palate) to cover both keratinized and nonkeratinized mucosa (Figure 1). Additional demographic information for all subjects was also collected (Table 1).
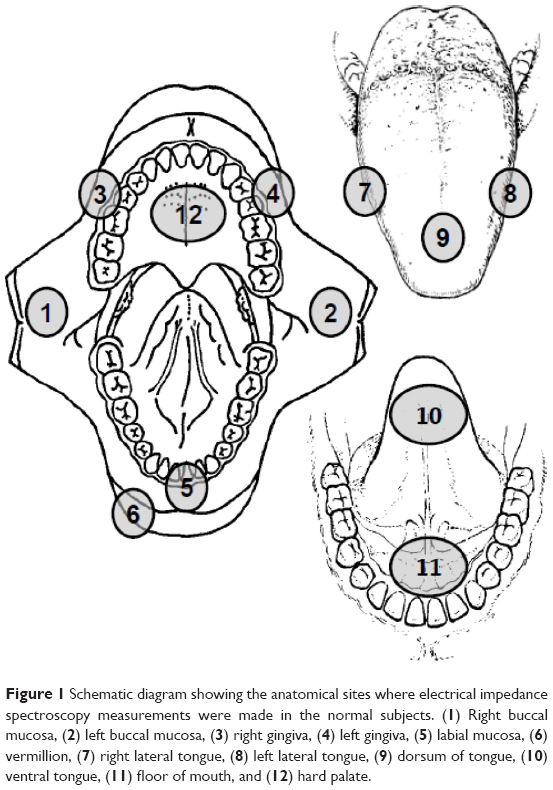 | Figure 1 Schematic diagram showing the anatomical sites where electrical impedance spectroscopy measurements were made in the normal subjects. (1) Right buccal mucosa, (2) left buccal mucosa, (3) right gingiva, (4) left gingiva, (5) labial mucosa, (6) vermillion, (7) right lateral tongue, (8) left lateral tongue, (9) dorsum of tongue, (10) ventral tongue, (11) floor of mouth, and (12) hard palate. |
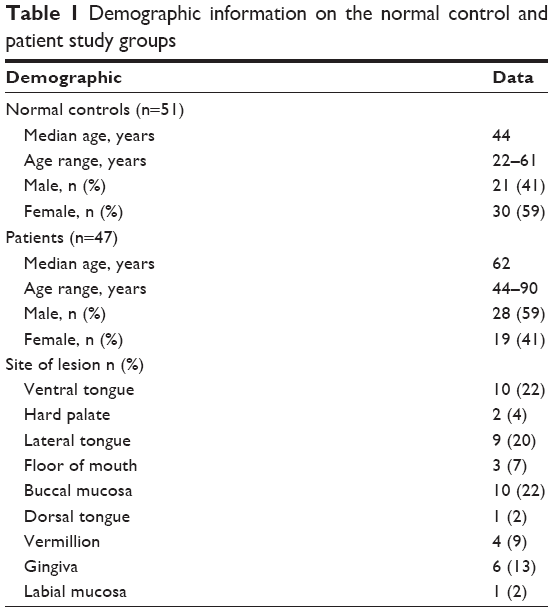 | Table 1 Demographic information on the normal control and patient study groups |
Study subjects also completed a questionnaire after biopsy and after the EIS readings were taken. Individuals were asked to evaluate the pain or discomfort they experienced with the scalpel biopsy and EIS readings. They were also asked how easy/convenient the procedures were. Measurements were made using a 100-point sliding scale chart in which 0 represented no discomfort or a very convenient procedure and 100 represented maximum discomfort or a very inconvenient procedure.
EIS measurement
The EIS device consists of a handheld unit, a base station for downloading data to a laptop, a single-use sheath covering the snout of the handheld unit, and associated software (Figure 2). To take oral measurements, the 5.5-mm-diameter tip of the sheathed snout was placed in contact with the oral lesion or control tissue, as described previously when taking measurements of cervical mucosa.26,27 The tip of the sheathed snout has four gold electrodes that are set at a constant diameter and spacing to achieve a defined flow of current into the tissue. The electrodes were placed gently on the lesion or normal oral mucosa, and a four-electrode transfer impedance measurement was made. In this process, the current (<12 μA p–p) is passed between an adjacent pair of electrodes, and the voltage is then measured between the remaining pair. The frequency of the applied current ranges from 0.076–625 kHz in 14 binary steps, and the minimum time required to record the full frequency spectrum is 20 ms. Measurements were only acquired if five internal quality control assessments were passed. Data were captured in real-time and immediately downloaded via the base station to a computer for analysis.
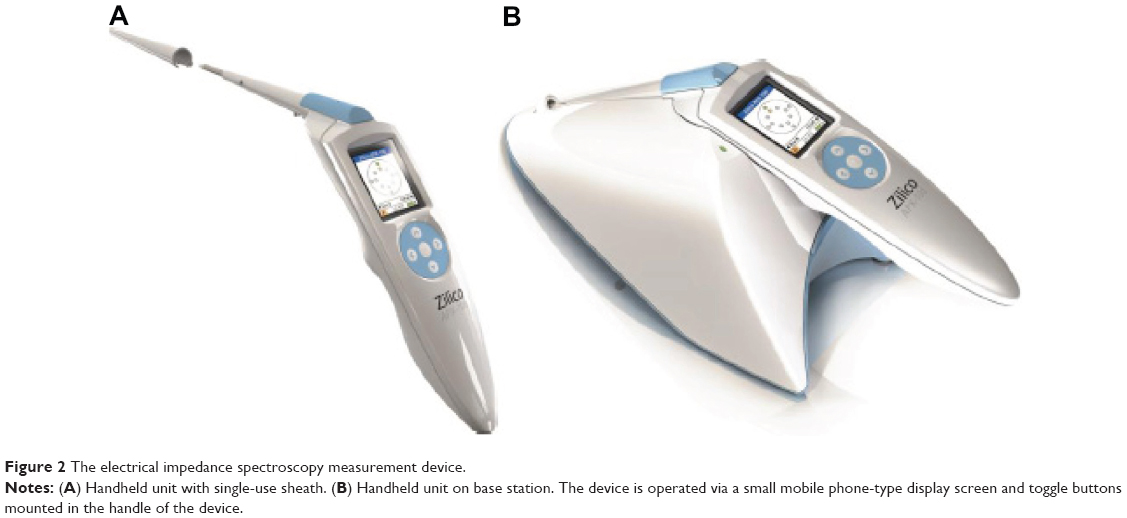 | Figure 2 The electrical impedance spectroscopy measurement device. |
The median EIS spectra from all 51 control subjects were constructed for each of the 12 oral mucosal sites and used as templates to which the patient spectra for the same site were compared. These templates were used in a similar manner to those previously generated from finite element modeling of cervical tissues.21 Each measured spectrum from a lesion was matched to the normal control template generated for the same anatomical site as the lesion. This matching generates a number between −2 and +2, where 0 represents a perfect impedance match between lesion and control template. The match was calculated as twice the mean difference between the measured and template spectral values, divided by the sum of the measured and template values. The sign indicates whether the recorded impedance was less than (−) or greater than (+) the control template. The matching only used the frequencies between 305–312,000 Hz, as the extreme frequencies were subject to larger errors than the midfrequencies. For analysis purposes, we were interested only in the size of the difference between the recorded impedances and the control template. Thus, unsigned data were used to produce the scatterplots and receiver operating characteristic (ROC) curves.
In addition to comparing lesional EIS data with that of normal controls, we compared lesional impedance readings with readings taken from an area of normal oral mucosa in the same patient and at the same site as the lesion, but on the contralateral side of the mouth (ie, an internal control).
Statistical analysis
The ROC curves were plotted using MATLABTM (The MathWorks Inc., Natick, MA, USA). Statistically significant differences in the data were calculated using a two-tailed, nonparametric Mann–Whitney U-test, using PRISM 6.01 (GraphPad Software Inc., La Jolla, CA, USA), and data were considered significantly different if P≤0.05.
Results
Normal control data
Of 612 measurements that were attempted from the 51 normal subjects, 565 spectra were recorded and 500 spectra were available for analysis after the application of in-built quality control checks by the EIS device. On the 47 occasions when spectra could not be recorded, it was because of difficulties in placing the probe such that all four electrodes made consistent contact with the tissue. On 65 occasions, although spectra were recorded, they were rejected because the impedances were outside the expected range of measurement. Where measurements were made from the same anatomical site on both sides of the mouth (buccal mucosa, gingiva, and lateral tongue), the results were combined. Figure 3 depicts the median spectra recorded for the nine different anatomical sites analyzed and shows clear differences between the different anatomical sites, particularly at frequencies between 1.2–39 kHz where the impedance was between 500–2,500 Ω. Table 2 gives a statistical comparison of the median spectra for the nine anatomical sites and shows that there were significant differences in the median spectral data between many of the sites analyzed.
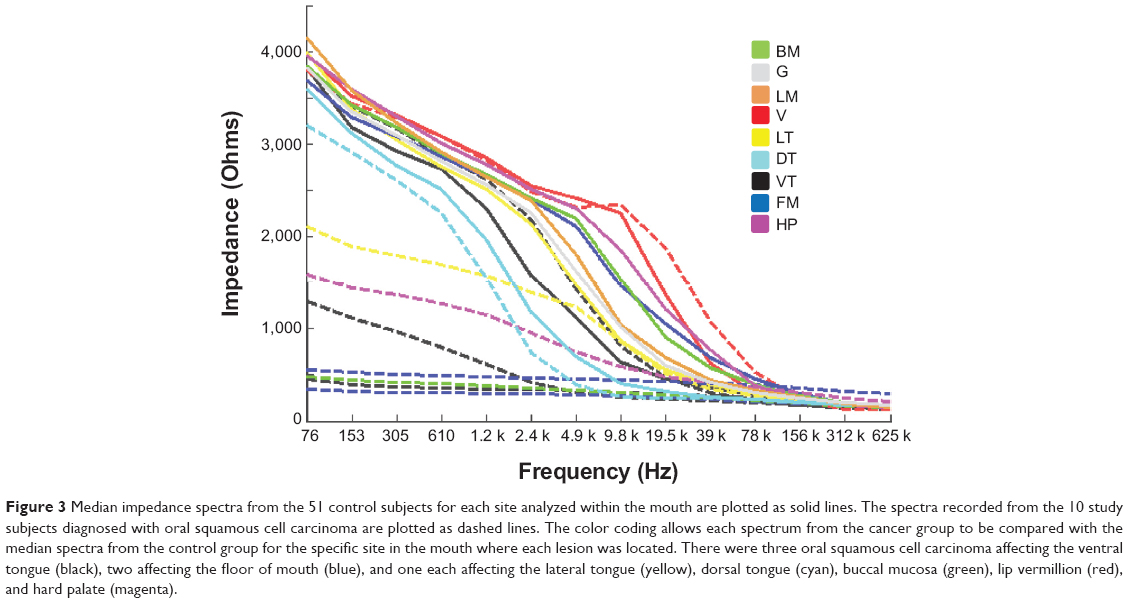 | Figure 3 Median impedance spectra from the 51 control subjects for each site analyzed within the mouth are plotted as solid lines. The spectra recorded from the 10 study subjects diagnosed with oral squamous cell carcinoma are plotted as dashed lines. The color coding allows each spectrum from the cancer group to be compared with the median spectra from the control group for the specific site in the mouth where each lesion was located. There were three oral squamous cell carcinoma affecting the ventral tongue (black), two affecting the floor of mouth (blue), and one each affecting the lateral tongue (yellow), dorsal tongue (cyan), buccal mucosa (green), lip vermillion (red), and hard palate (magenta). |
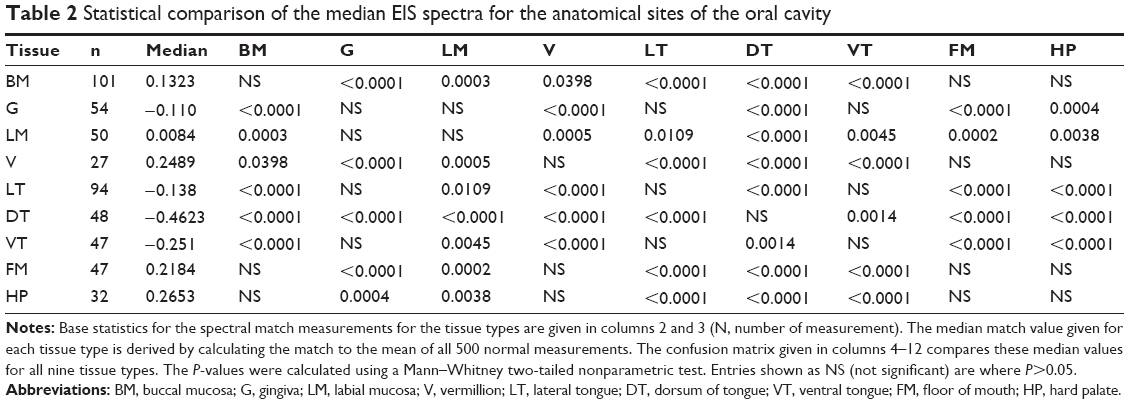 | Table 2 Statistical comparison of the median EIS spectra for the anatomical sites of the oral cavity |
Patient data
Ten patients had OSCC lesions. Three of these affected the ventral tongue, two the floor of mouth, and one each the lateral tongue, dorsal tongue, buccal mucosa, vermillion, and hard palate. EIS readings taken from the lesions of patients diagnosed with OSCC showed that 80% of these lesions had considerably lower impedance spectra when compared with the median spectra recorded from the same oral mucosal site in the control subjects (Figure 3). The median spectra for the normal compared with cancerous tissue showed substantial separation in the low-frequency regions, particularly below 4.9 kHz, and in four cases, the impedance levels in the tumors did not read above baseline values of around 500 Ω.
EIS readings for lesion compared with control subjects
Data points in the scatterplots in Figure 4 each show the difference in the spectra obtained for the lesion compared with the control template spectra for the same anatomical site. For example, if a lesion measurement was taken from the hard palate, then it was matched with the control template for the hard palate of control subjects. In Figure 4A, the lesion data have been categorized according to the WHO grading of OED. The EIS readings for the oral cancer, severe dysplasia, and moderate dysplasia lesions were significantly different from those obtained from the same anatomical site in the control subjects (P=0.0002, P=0.0338, and P=0.0067, respectively). In contrast, EIS readings from the mild dysplasia and benign lesions showed no significant difference from readings taken at the same anatomical site in controls. In Figure 4B, the lesion data were categorized according to the binary grading of OED. Significant differences were observed in the EIS readings for the oral cancer (P=0.0002), high-risk dysplasia (P=0.0057), and low-risk dysplasia (P=0.0253) lesions compared with readings from the same anatomical site in controls. In Figure 4C, the lesions were recategorized again into high-risk lesions (oral cancer + high-risk dysplasia) and low-risk lesions (low-risk dysplasia and benign). Readings for the high-risk lesion group were significantly different from both the low-risk lesion group (P=0.0408) and the same anatomical site in controls (P=0.0001), but there was no significant difference in the readings taken from the low-risk lesion group and the same anatomical site in control subjects.
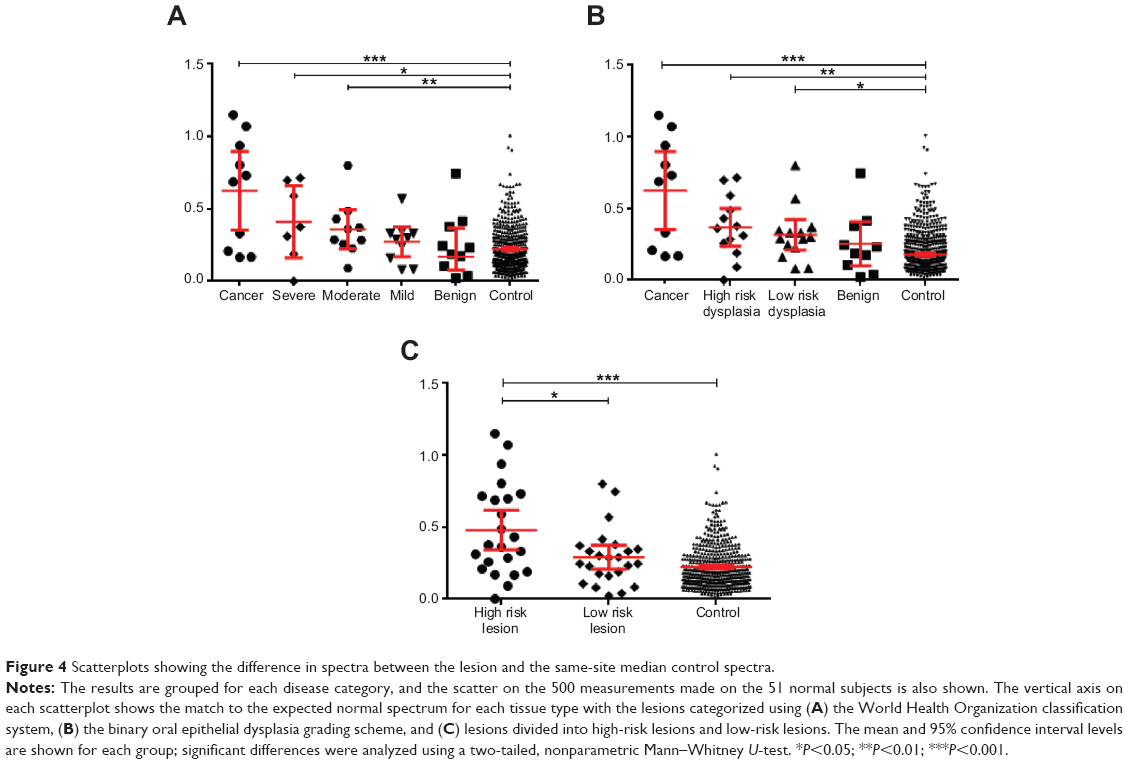 | Figure 4 Scatterplots showing the difference in spectra between the lesion and the same-site median control spectra. |
EIS readings for lesions compared with contralateral normal mucosa in the same patient
To determine whether the EIS readings taken from the lesions of study subjects were different from clinically appearing healthy mucosa from the same individual, EIS measurements from the lesions were matched to those taken from the same anatomical site but on the contralateral side of the mouth (Figure 5). When the lesions were categorized according to the WHO grading of OED, EIS readings taken from oral cancers were significantly different from moderate dysplasia (P=0.0431), mild dysplasia (P=0.0068), and benign (P=0.0288) lesions, but not from lesions with severe dysplasia. In addition, readings from severe dysplasia lesions were significantly different from benign lesions (P=0.033), but not significantly different when compared with moderate or mild dysplasia lesions (Figure 5A). When the lesions were recategorized using the binary grading of OED, significant differences in EIS readings were observed between oral cancers and low-risk dysplasia (P=0.0031) and benign (P=0.0288) lesions. A significant difference was also found between high-risk and low-risk dysplasia lesions (P=0.0222), but not between low-risk dysplasia and benign lesions (Figure 5B). When the lesions were recategorized again into high-risk lesions (oral cancer + high-risk dysplasia) and low-risk lesions (low-risk dysplasia + benign), EIS readings taken from the high-risk lesions were highly significantly different from readings taken from low-risk lesions (P=0.0009) (Figure 5C). We found no significant differences in the EIS readings taken from the nonlesional contralateral side of the mouth of patients and the same tissue site in control subjects.
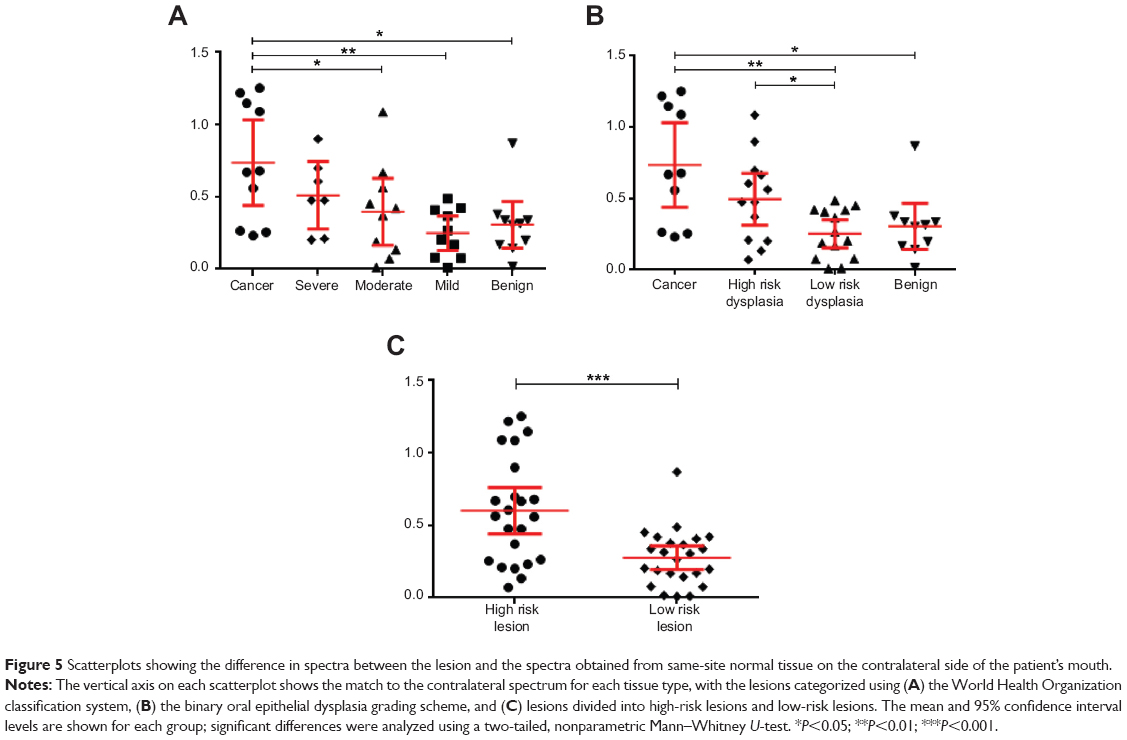 | Figure 5 Scatterplots showing the difference in spectra between the lesion and the spectra obtained from same-site normal tissue on the contralateral side of the patient’s mouth. |
Assessment of EIS performance
To assess the performance of the EIS measurements as a means of identifying disease, ROC curves were derived from the EIS data. Figure 6A examines the performance of EIS in distinguishing high-risk lesions (oral cancer + high-risk dysplasia) from low-risk lesions (low-risk dysplasia + benign) when lesional spectra are compared with those from the same anatomical site in controls. It results in an area under the curve (AUC) of 0.674 (95% confidence intervals, 0.518–0.830; P=0.0411). The point that is marked by the arrow equates to a sensitivity of 65.2%, a specificity of 62.5%, and a positive likelihood ratio of 1.74 (Figure 6A). This point corresponds to the highest likelihood ratio that also gives sensitivity greater than 60%. When instead, lesional spectra were compared with normal oral mucosa on the contralateral side of the mouth (Figure 6B), the AUC for discriminating high-risk lesions from low-risk lesions is 0.776 (95% confidence interval, 0.638–0.913; P=0.001). The point that is marked by the arrow corresponds to a sensitivity of 65.2%, a specificity of 91.7%, and a positive likelihood ratio of 7.83 (Figure 6B). Again, this point corresponds to the highest likelihood ratio that also gives sensitivity greater than 60%.
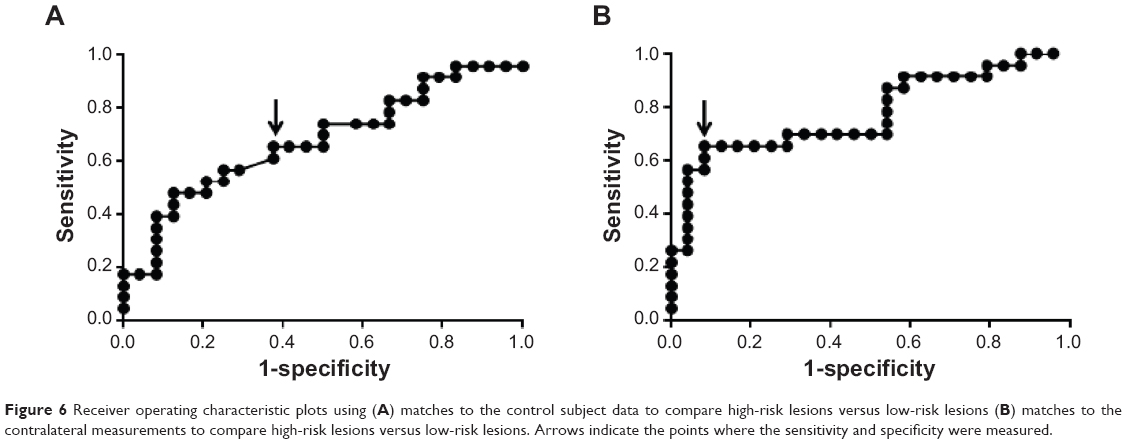 | Figure 6 Receiver operating characteristic plots using (A) matches to the control subject data to compare high-risk lesions versus low-risk lesions (B) matches to the contralateral measurements to compare high-risk lesions versus low-risk lesions. Arrows indicate the points where the sensitivity and specificity were measured. |
Procedure acceptability
Study subjects were asked to mark on a sliding scale from 1 to 100 how painful and also how convenient the scalpel biopsy and EIS procedures were. Of study subjects, 85% rated the EIS measurements as having very low or no pain at all (a mark ≤20), whereas only 24% found the scalpel biopsy had this level of comfort. In contrast, only 2% of study subjects experienced severe pain (a mark of ≥60) with the EIS reading, whereas this level increased to 26% for the scalpel biopsy. Similarly, 89% of study subjects found the EIS measurement-taking procedure very convenient, whereas this value decreased to 41% for the scalpel biopsy procedure.
Discussion
Novel, noninvasive ways to discriminate among oral cancer, potentially malignant, and benign lesions are being developed to expedite diagnosis, improve monitoring of lesions, and reduce the need for biopsies, and so improve patient care. Current methods are based on improving lesion visualisation,15–18 imaging technology,19,20 or the use of brush biopsy followed by cytological analysis.28 However, recent studies have shown that normal oral keratinocytes and oral dysplastic and oral squamous cell carcinoma cell lines cultured as both monolayers and as organotypic models can be distinguished from one another on their electrical impedance-based properties.29–31 This suggests that impedance-based methods may have potential use in oral lesion diagnostics. We have recently shown that EIS can discriminate among normal tissue, cervical dysplasia, and early cervical cancer in the clinic.21 Therefore, this proof-of-concept study aimed to establish whether EIS could discriminate among normal healthy oral mucosa, oral PML, and oral cancer in patients in real-time.
Our results show clear differences in the median recorded electrical impedance spectra for normal oral mucosa at the nine different anatomical sites we studied in our control subjects. Impedance is expected to fall with increasing frequency as more electrical current passes through the capacitance of the cell membranes. The rate at which this effect occurs will depend on cell shapes and sizes, as well as the spacing between cells. A highly structured tissue such as stratified oral squamous epithelium is expected to have higher impedances at low frequencies because the epithelium consists of tightly bound cells. We anticipated that the median impedance spectra would be particularly high in keratinized tissues but would be lower for nonkeratinized mucosa. We found that the impedance spectra recorded were consistent with this reasoning. For example, orthokeratinized tissues such as the vermillion and hard palate give the highest impedance readings, whereas nonkeratinized tissues such as the ventral tongue, lateral tongue, and labial mucosa give much lower readings (see Figure 3). Surprisingly, the specialized keratinized mucosa of the dorsum of the tongue gave particularly low impedance readings. However, this may be because of the highly irregular structures (filiform and fungiform papillae) found in this epithelium.
The electrode spacing used in the measurement probe dictates the depth to which current will penetrate the tissue. Modeling has shown that the tissue, down to a depth of about 500 μm, will dominate the impedance spectrum.22 Cancer, severe and moderate dysplasia of squamous epithelia, disrupts the normal epithelial architecture and stratification, and we would expect to see a decrease in the impedance measurements for these lesions. We have previously observed such changes in readings taken from cervical squamous epithelium in the premalignant phases of disease.21,23,27 In the current study, measurements taken from oral cancer tissues also showed a large and significant (P<0.0002) decrease in spectral impedances in the majority of cases we tested. This suggests that EIS has the potential to discriminate between normal healthy mucosa and cancerous tissue. The largest differences in impedance spectra between healthy and most cancer tissues were observed at low frequencies. Sun et al33 recently analyzed the bioimpedance of patients with tongue cancer over frequencies ranging from 20 Hz to 5 MHz and compared these with the tongue readings taken from healthy controls. In their study, Sun and colleagues found that the differences in impedance readings between cancers and normal tissue were at their greatest at frequencies between 20 Hz and 50 kHz.32,33 This is in agreement with the data presented in this study, although we found that the differences in spectra between cancerous and normal tissue extended to frequencies of up to 300 kHz, after which the spectra became similar. In addition, we found that the EIS readings for the oral cancer, severe dysplasia, and moderate dysplasia lesions were significantly different from those obtained from the same anatomical site in the control subjects. When we compared the lesional readings with those for same-site normal tissue on the contralateral side of the mouth, we found that the EIS readings from oral cancers were significantly different from those taken from moderate dysplasia, mild dysplasia, and benign lesions, but not from lesions with severe dysplasia. However, in this proof-of-concept study, EIS was unable to distinguish satisfactorily between the different grades of dysplasia and benign lesions or between benign and normal mucosa when analyzed using the WHO classification system. This may be because the architectural changes in the epithelium between these types of lesions are too subtle for the EIS device to detect or because the number of subjects in this study was inadequate to pick up any significant differences.
We recategorized the lesions, using the binary OED grading system. We did this for two reasons: first, there is increasing evidence to show that the binary system has superior reproducibility and less inter- and intraexaminer variation in the grading of OED compared with the WHO system,12,34 and second, it is claimed that it is a better predictor of the potential for malignant change in a lesion.12,34 When recategorized, we found significant differences in the EIS readings for the oral cancer, high-risk and low-risk dysplasia lesions compared with the same anatomical site in controls. When instead we compared the lesional readings with those for the same-site normal tissue on the contralateral side of the mouth, we also found significant differences in EIS readings between oral cancers and low-risk dysplasia and benign lesions, as well as between high-risk and low-risk dysplasia lesions. Indeed, discrimination between adjacent grades of lesion was slightly better using the binary grading of OED compared with the WHO grading scheme. In part, this is likely to be because there are only four categories of lesion in the binary scheme compared with five in the WHO scheme. This means that the sample size increases in some categories and helps improve the significance of any difference in EIS readings between these categories.
Finally, we recategorized the lesions into two groups: high-risk lesions (oral cancers + high-risk dysplasia) and low-risk lesions (low-risk dysplasia + benign). We did this because this categorization is of some importance in distinguishing how lesions should be managed clinically. Most would consider that high-risk lesions need urgent intervention, with lesion excision as a minimum, whereas low-risk lesions are likely to be managed conservatively with risk modification and long-term monitoring for disease progression. Categorized in this way, EIS readings for the high-risk lesion group were significantly different from both the low-risk lesion group and the same anatomical site in controls. However, when instead we compared the lesional readings with those for same-site normal tissue on the contralateral side of the mouth, we observed highly significant differences in the EIS readings taken from high-risk lesions and low-risk lesions (P=0.0009). This is intriguing, as EIS matched data for contralateral versus control subjects showed no significant difference even though field characterization may be an issue in patients with PML.35 However, these data appear to suggest that taking measurements from the clinically healthy-appearing oral mucosa on the contralateral side of the mouth to the oral lesion may act as a better control than median data collected from a healthy population. This may be because the control data are taken from the general population and will be composed of several compounding factors such as differences in age, ethnicity, and oral health that all have a profound influence on the oral mucosa. The median of these differences are unlikely to act as a better control than an individual’s own healthy oral mucosa in-built control, which will be exactly age-matched, ethnically matched, oral health-matched, and risk factor-matched to the disease site. However, taken together, these data clearly show that the EIS device can distinguish high-risk lesions from low-risk lesions and so is likely to be a useful clinical aid in lesion management.
It is important to note that the matching method used to compare differences in each measured spectrum with either the same-site control subject template or the measurement from the patient’s contralateral side of the mouth does not distinguish between positive and negative changes in the spectra. Although Figure 3 shows that in the cancer group, the diseased spectra predominately show lower impedances than the control subjects, in some cases patients with dysplasia showed an increase in the measured impedances. This may reflect the differences in tissue architecture between these two groups, where dysplasia is composed of atypical epithelia cells on an intact basement membrane, whereas in oral carcinoma lesions, the basement membrane is breached by invading oral cancer cells. It is therefore likely that the EIS readings are different for dysplasia compared with cancer because of differences in the basement membrane structure that will dramatically alter the flow of electrical current. In contrast, this increase in impedance is not found in cervical premalignancy.27 The presence of inflammatory cells within malignant uroepithelium was reported to significantly change the impedance spectra compared with normal uroepithelium.36 However, we did not observe such changes in this study, as there were no significant changes in the spectra of patients diagnosed with lichen planus (a condition in which marked numbers of inflammatory cells are present in the epithelium) compared with controls.
The ROC curve given in Figure 6B shows that the EIS data can be used to distinguish high-risk lesions from low-risk lesions with an AUC of 0.776. This figure may be compared with the AUCs quoted by Tidy et al21 of 0.740 and 0.783 for the EIS separation of high-grade cervical intraepithelial neoplasia from noncervical intraepithelial neoplasia.21 Figure 6B also shows that a sensitivity of 65.3% and a specificity of 91.7% can be achieved in separating the high-risk and low-risk lesion groups.
This study used an unblinded case-control study design with a small number of cases in each group, so it could be argued that review and selection bias may have a small but important effect on the data presented, and therefore the overall accuracy of the diagnostic test. Even so, the data shown in this relatively small proof-of-concept study is very encouraging and clearly shows that EIS can distinguish between cancer and normal oral epithelium and, more important, between high-risk and low-risk lesions, and therefore has potential for use as a diagnostic tool to detect oral cancer or monitor oral PML. Moreover, the EIS procedure was found to be markedly more pain-free and convenient for patients compared with the scalpel biopsy. However, the study has also identified several areas for further work. The equipment used for recording the electrical impedance spectra was designed to take measurements from the cervix and not from the mouth. As a result, access to some oral tissue sites was problematic, and in these tissues it was difficult to ensure good contact for all four probe electrodes. This was especially evident for the hard palate because of the undulating surface of the rugae and the curved surface of the gingiva. This resulted in failure to record a spectrum in almost 10% of cases. Further spectra had to be rejected when they failed internal quality control checks by the device. The probe design needs to be modified to improve access to oral tissues and electrode contact with the oral mucosa. This would significantly increase the proportion of successful EIS readings. In addition, the lowest-frequency measurements were subject to high errors and so had to be rejected from the analysis. It is possible that device sensitivity and specificity can be improved by selection of a frequency range more suited to oral use.
Construction of finite element computer models using data from the existing literature and from measurements made on a wide range of histopathology sections from oral squamous epithelium, different stages of dysplasia, and other lesions could also be used to identify what changes will cause an increase in spectral impedance. These models could also be used to provide spectral templates to be used in clinical analysis of measured spectra.22 However, data presented in this study show a better separation of the diseased and control groups when comparing the lesion spectrum with a measurement taken from the contralateral side of the mouth than when using the normal templates. Whatever the method of analysis to be used, a much larger prospective clinical trial is needed using a device specifically modified for oral use.
We conclude that EIS shows promise in helping to identify oral cancer and potentially malignant oral lesions in the primary care situation, for aiding decisions on lesion management, and also potentially for helping to identify the best site to biopsy and for monitoring lesions for disease progression over time.
Acknowledgments
This report is independent research commissioned by the National Institute for Health Research Invention for Innovation (i4i) program (grant no. II-3A-1109-10015). The views expressed in this publication are those of the authors and not necessarily those of the National Health Service, the National Institute for Health Research, or the Department of Health.
Disclosure
JAT and BHB hold patents related to the technology, are shareholders in Zilico Ltd., and receive consultancy fees. PEH is technical director and a shareholder of Zilico Ltd. All other authors report no conflicts of interest in this work.
References
Ferlay J, Shin HR, Bray F, Forman D, Mathers C, Parkin DM. Estimates of worldwide burden of cancer in 2008: GLOBOCAN 2008. Int J Cancer. 2010;127(12):2893–2917. | ||
Siegel R, Ma J, Zou Z, Jemal A. Cancer statistics, 2014. CA Cancer J Clin. 2014;64(1):9–29. | ||
Johnson NW, Jayasekara P, Amarasinghe AA. Squamous cell carcinoma and precursor lesions of the oral cavity: epidemiology and aetiology. Periodontol 2000. 2011;57(1):19–37. | ||
Warnakulasuriya S, Johnson NW, van der Waal I. Nomenclature and classification of potentially malignant disorders of the oral mucosa. J Oral Pathol Med. 2007;36(10):575–580. | ||
Napier SS, Speight PM. Natural history of potentially malignant oral lesions and conditions: an overview of the literature. J Oral Pathol Med. 2008;37(1):1–10. | ||
Lee JJ, Hong WK, Hittelman WN, et al. Predicting cancer development in oral leukoplakia: ten years of translational research. Clin Cancer Res. 2000;6(5):1702–1710. | ||
Barnes LEJ, Reichart P, Sidransky D. World Health Organisation classification of tumours. Pathology and genetics of tumours of the head and neck. Lyon: IARC Press; 2005. | ||
Speight PM. Update on oral epithelial dysplasia and progression to cancer. Head Neck Pathol. 2007;1(1):61–66. | ||
Dionne KR, Warnakulasuriya S, Binti Zain R, Cheong SC. Potentially malignant disorders of the oral cavity: Current practice and future directions in the clinic and laboratory. Int J Cancer. 2014;n/a. | ||
Dost F, Lê Cao K, Ford PJ, Ades C, Farah CS. Malignant transformation of oral epithelial dysplasia: a real-world evaluation of histopathologic grading. Oral Surg Oral Med Oral Pathol Oral Radiol. 2014;117(3): 343–352. | ||
Kujan O, Oliver RJ, Khattab A, Roberts SA, Thakker N, Sloan P. Evaluation of a new binary system of grading oral epithelial dysplasia for prediction of malignant transformation. Oral Oncol. 2006;42(10): 987–993. | ||
Kujan O, Khattab A, Oliver RJ, Roberts SA, Thakker N, Sloan P. Why oral histopathology suffers inter-observer variability on grading oral epithelial dysplasia: an attempt to understand the sources of variation. Oral Oncol. 2007;43(3):224–231. | ||
Abbey LM, Kaugars GE, Gunsolley JC, et al. Intraexaminer and interexaminer reliability in the diagnosis of oral epithelial dysplasia. Oral Surg Oral Med Oral Pathol Oral Radiol Endod. 1995;80(2):188–191. | ||
van der Waal I. Potentially malignant disorders of the oral and oropharyngeal mucosa; present concepts of management. Oral Oncol. 2010; 46(6):423–425. | ||
Awan Kh, Yang Y, Morgan P, Warnakulasuriya S. Utility of toluidine blue as a diagnostic adjunct in the detection of potentially malignant disorders of the oral cavity – a clinical and histological assessment. Oral Dis. 2012;18(8):728–733. | ||
Awan KH, Morgan PR, Warnakulasuriya S. Evaluation of an autofluorescence based imaging system (VELscope™) in the detection of oral potentially malignant disorders and benign keratoses. Oral Oncol. 2011;47(4):274–277. | ||
Awan KH, Morgan PR, Warnakulasuriya S. Utility of chemiluminescence (ViziLite™) in the detection of oral potentially malignant disorders and benign keratoses. J Oral Pathol Med. 2011;40(7):541–544. | ||
Maeda K, Suzuki T, Ooyama Y, et al. Colorimetric analysis of unstained lesions surrounding oral squamous cell carcinomas and oral potentially malignant disorders using iodine. Int J Oral Maxillofac Surg. 2010;39(5):486–492. | ||
Lee CK, Chi TT, Wu CT, Tsai MT, Chiang CP, Yang CC. Diagnosis of oral precancer with optical coherence tomography. Biomed Opt Express. 2012;3(7):1632–1646. | ||
Yang SW, Lee YS, Chang LC, Hwang CC, Chen TA. Diagnostic significance of narrow-band imaging for detecting high-grade dysplasia, carcinoma in situ, and carcinoma in oral leukoplakia. Laryngoscope. 2012;122(12):2754–2761. | ||
Tidy JA, Brown BH, Healey TJ, et al. Accuracy of detection of high-grade cervical intraepithelial neoplasia using electrical impedance spectroscopy with colposcopy. BJOG. 2013;120(4):400–410. | ||
Walker DC, Brown BH, Blackett AD, Tidy J, Smallwood RH. A study of the morphological parameters of cervical squamous epithelium. Physiol Meas. 2003;24(1):121–135. | ||
Brown BH, Tidy JA, Boston K, Blackett AD, Smallwood RH, Sharp F. Relation between tissue structure and imposed electrical current flow in cervical neoplasia. Lancet. 2000;355(9207):892–895. | ||
O’Connell MP, Tidy J, Wisher SJ, Avis NJ, Brown BH, Lindow SW. An in vivo comparative study of the pregnant and nonpregnant cervix using electrical impedance measurements. BJOG. 2000;107(8):1040–1041. | ||
Abdul S, Brown BH, Milnes P, Tidy JA. A clinical study of the use of impedance spectroscopy in the detection of cervical intraepithelial neoplasia (CIN). Gynecol Oncol. 2005;99(3)(suppl 1):S64–S66. | ||
Brown BH, Milnes P, Abdul S, Tidy JA. Detection of cervical intraepithelial neoplasia using impedance spectroscopy: a prospective study. BJOG. 2005;112(6):802–806. | ||
Abdul S, Brown BH, Milnes P, Tidy JA. The use of electrical impedance spectroscopy in the detection of cervical intraepithelial neoplasia. Int J Gynecol Cancer. 2006;16(5):1823–1832. | ||
Scheifele C, Schmidt-Westhausen AM, Dietrich T, Reichart PA. The sensitivity and specificity of the OralCDx technique: evaluation of 103 cases. Oral Oncol. 2004;40(8):824–828. | ||
Yang L, Arias LR, Lane TS, Yancey MD, Mamouni J. Real-time electrical impedance-based measurement to distinguish oral cancer cells and non-cancer oral epithelial cells. Anal Bioanal Chem. 2011;399(5): 1823–1833. | ||
Mulhall HJ, Labeed FH, Kazmi B, Costea DE, Hughes MP, Lewis MP. Cancer, pre-cancer and normal oral cells distinguished by dielectrophoresis. Anal Bioanal Chem. 2011;401(8):2455–2463. | ||
Mulhall HJ, Hughes MP, Kazmi B, Lewis MP, Labeed FH. Epithelial cancer cells exhibit different electrical properties when cultured in 2D and 3D environments. Biochim Biophys Acta. 2013;1830(11):5136–5141. | ||
Ching CT, Sun TP, Huang SH, et al. A preliminary study of the use of bioimpedance in the screening of squamous tongue cancer. Int J Nanomedicine. 2010;5:213–220. | ||
Sun TP, Ching CT, Cheng CS, et al. The use of bioimpedance in the detection/screening of tongue cancer. Cancer Epidemiol. 2010;34(2): 207–211. | ||
Nankivell P, Williams H, Matthews P, et al. The binary oral dysplasia grading system: validity testing and suggested improvement. Oral Surg Oral Med Oral Pathol Oral Radiol. 2013;115(1):87–94. | ||
Califano J, van der Riet P, Westra W, et al. Genetic progression model for head and neck cancer: implications for field cancerization. Cancer Res. 1996;56(11):2488–2492. | ||
Smallwood RH, Keshtkar A, Wilkinson BA, Lee JA, Hamdy FC. Electrical impedance spectroscopy (EIS) in the urinary bladder: the effect of inflammation and edema on identification of malignancy. IEEE Trans Med Imaging. 2002;21(6):708–710. |
 © 2014 The Author(s). This work is published and licensed by Dove Medical Press Limited. The full terms of this license are available at https://www.dovepress.com/terms.php and incorporate the Creative Commons Attribution - Non Commercial (unported, v3.0) License.
By accessing the work you hereby accept the Terms. Non-commercial uses of the work are permitted without any further permission from Dove Medical Press Limited, provided the work is properly attributed. For permission for commercial use of this work, please see paragraphs 4.2 and 5 of our Terms.
© 2014 The Author(s). This work is published and licensed by Dove Medical Press Limited. The full terms of this license are available at https://www.dovepress.com/terms.php and incorporate the Creative Commons Attribution - Non Commercial (unported, v3.0) License.
By accessing the work you hereby accept the Terms. Non-commercial uses of the work are permitted without any further permission from Dove Medical Press Limited, provided the work is properly attributed. For permission for commercial use of this work, please see paragraphs 4.2 and 5 of our Terms.