")
Back to Journals » International Journal of Nanomedicine » Volume 10 » Issue 1
Uptake of bright fluorophore core-silica shell nanoparticles by biological systems
Authors Zane A, McCracken C, Knight D, Young T, Lutton A, Olesik J, Waldman J, Dutta P
Received 22 October 2014
Accepted for publication 26 November 2014
Published 20 February 2015 Volume 2015:10(1) Pages 1547—1567
DOI https://doi.org/10.2147/IJN.S76208
Checked for plagiarism Yes
Review by Single anonymous peer review
Peer reviewer comments 4
Editor who approved publication: Dr Thomas Webster
Andrew Zane,1 Christie McCracken,2 Deborah A Knight,2 Tanya Young,1 Anthony D Lutton,3 John W Olesik,3 W James Waldman,2 Prabir K Dutta1
1Department of Chemistry and Biochemistry, 2Department of Pathology, 3School of Earth Sciences, The Ohio State University, Columbus, OH, USA
Abstract: Nanoparticles are used in a variety of consumer applications. Silica nanoparticles in particular are common, including as a component of foods. There are concerns that ingested nanosilica particles can cross the intestinal epithelium, enter the circulation, and accumulate in tissues and organs. Thus, tracking these particles is of interest, and fluorescence spectroscopic methods are well-suited for this purpose. However, nanosilica is not fluorescent. In this article, we focus on core-silica shell nanoparticles, using fluorescent Rhodamine 6G, Rhodamine 800, or CdSe/CdS/ZnS quantum dots as the core. These stable fluorophore/silica nanoparticles had surface characteristics similar to those of commercial silica particles. Thus, they were used as model particles to examine internalization by cultured cells, including an epithelial cell line relevant to the gastrointestinal tract. Finally, these particles were administered to mice by gavage, and their presence in various organs, including stomach, small intestine, cecum, colon, kidney, lung, brain, and spleen, was examined. By combining confocal fluorescence microscopy with inductively coupled plasma mass spectrometry, the presence of nanoparticles, rather than their dissolved form, was established in liver tissues.
Keywords: quantum dots, dyes, optical spectroscopy, NMR, zeta potential, mouse model, macrophages, Caco-2, nanoparticles in foods
Introduction
Nanoparticles are being increasingly used in a wide variety of industrial, environmental, and consumer applications. This has led to considerable interest in understanding how nanoparticles interact with biological systems, as well as their effects and fate in the environment. Nanoparticle interactions with biological/environmental systems are dependent on their material properties, including size1–4 and surface charge.5–7
Silicon dioxide (silica) is a commonly used material in food, pharmaceutical, chemical, and consumer goods.8–13 The Project on Emerging Nanotechnologies Consumer Products Inventory attempts to catalog these products, which at this time includes 41 products using or claiming to use nanosilica.14 Seven of the listed products are cosmetics and dietary supplements. In the food industry, silica is used as an anticaking agent and to clarify liquids.15 Although silica particles used in foods (a common silica commercial material is E551) typically have an average size of a few hundred nanometers, they have a broad size distribution. Food-grade silica is reported to contain up to 33% silica with a size less than 200 nm, leading to an estimated intake of 1.8 mg/kg of body weight/day of nanosize silica particles.16,17 Other uses of silica are in coatings, paints, and cleaning supplies. Another nanoparticle commonly found in many foods is titania.18 Despite the increased interest in using nanoparticles in food, the US Food and Drug Administration currently has no specific regulations related to nanoparticles. A 2012 draft guidance suggested that food manufacturers investigate the safety of foods incorporating nanoparticles, but at present, on the basis of studies of their larger counterparts, many of the inorganic nanoparticles are generally regarded as safe for use in foods.19 There is increasing evidence, however, that ingested nanoparticles can traverse the intestinal epithelium, enter the portal and systemic circulation, and accumulate in tissues and organs.3–5 In particular, silica has been found in liver tissues, and a transport model has been proposed.20,21
Thus, tracking nanoparticles as they interact with the biological milieu and in the environment is of interest. Optical spectroscopic methods can be used to study the fate of nanoparticles in real time, especially if the particles can be imaged. However, many nanoparticles used in the commercial world, such as titania, zinc oxide, and silica, are intrinsically nonfluorescent. These nanoparticles can be functionalized with a fluorescent component and used as a trackable model system simulating real particles. However, because nanoparticle interactions with the host system depend on surface properties, it is important that the model particle’s surface characteristics remain similar to the commercial particles. This necessitates that the fluorescent probes remain within these model particles and do not leach into the solution or migrate/bind to the particle surface. In such cases, the interactions of the model nanoparticle with the biological systems may not be representative of the commercial samples.
Silica nanoparticle synthesis is a well-developed field typically involving ammonia-catalyzed hydrolysis of an alkyl silicate, followed by condensation. The sol-gel-based Stöber synthesis is the most common process,22,23 and modifications of this synthesis in which the hydrolysis takes place in a reverse microemulsion water-in-oil droplet is also widely practiced.24
These methods have been used to incorporate fluorescent probes in silica nanoparticles.2,25–30 Recent publications show evidence of silica nanoparticle dissolution, including from the inside, leaving hollow spheres.31 This poses an obvious problem for dye encapsulation: the dye will leach out of the particles. The instability is size-dependent and is more pronounced with smaller nanoparticles, especially in biologic media.32 A more recent development in nanosilica synthesis is the use of weakly basic amino acids such as lysine and arginine in place of ammonia.33 Using this strategy, dense, stable coatings of dye-incorporated silica have been synthesized that minimize dye leakage.32
There are a variety of fluorophores that can be encapsulated within the silica coating for biological studies. The variables desired are good fluorescence stability, lack of photobleaching, stability in biological media, bright fluorescence/high quantum yield (QY), and a range of emission wavelengths. Fluorescence emission in the near-infrared region is beneficial for the analysis of biological tissues.34
In this article, we focus on Rhodamine 6G, Rhodamine 800, and CdSe/CdS/ZnS quantum dots (QDs). Rhodamine 6G is a commonly available organic dye with very strong emission (90% QY) at 558 nm.35 Rhodamine 800 is a dye with a 25% QY and an emission maximum at 700 nm.36 The near-infrared fluorescence emission allows for noninvasive whole-body in vivo imaging. Rapid synthesis of QDs using microwave radiation is of current interest,37 and we have recently reported aqueous-based synthesis of CdSe/CdS/ZnS QD by microwave irradiation with a 40% QY, with a λem of 574 nm.38 Using these three fluorophores, we define the conditions for synthesis of stable, bright fluorescent core/silica shell nanoparticles. The surface characteristics, morphology, and optical properties of these composite nanoparticles are established. Internalization of the optimally prepared fluorophore/silica nanoparticle by a murine alveolar macrophage cell line and a human intestinal epithelial cell line, C2BBe1, which is relevant to the digestive system, is studied. Finally, the fate of orally administered fluorophore/silica nanoparticles in mice, especially the movement of particles from the gastrointestinal tract to tissues, is examined. With the QD/silica, fluorescence microscopy can confirm the location within tissues, and if combined with elemental analysis of the Cd/Si ratio by inductively coupled plasma mass spectrometry (ICP-MS), we can unequivocally determine that the silica nanoparticle, rather than its dissolved counterpart, has been transported to the tissues from the digestive system.
Experimental section
Materials
Cadmium chloride hemipentahydrate (CdCl2·2.5 H2O; >98%), sodium borohydride (NaBH4; 99%), tetraethyl orthosilicate (TEOS, 98%), L-Arginine (>98%), Rhodamine 6G (99% dye content), Rhodamine 800, and silica nanoparticles (12 nm, surface area 175–225 m2/g, purity 99.8%) were obtained from Aldrich (Milwaukee, WI, USA). Zinc chloride (ZnCl2; 99.99%), 3-mercaptopropionic acid (MPA), and selenium powder (Se; 99.5+%, 200 mesh) were obtained from Acros (Geel, Belgium). Sodium hydroxide (NaOH) and ammonium hydroxide (NH4OH; 28%–30%) were obtained from Mallinckrodt Chemicals (Phillipsburg, NJ, USA). All chemicals were used without further purification. The H2O used in this study was purified by a Barnstead NANOpure Infinity ultrapure water system (Dubuque, IA, USA).
QD synthesis
CdSe/CdS/ZnS QDs were first prepared using a previously published synthesis38 (included in the Supplementary materials).
Fluorophore entrapment by arginine-driven reaction
Dye/silica
A suspension of commercial silica nanoparticles was treated with the dye, and then L-arginine was added, followed by TEOS. Reaction concentrations were 1.36×10⁻³ M Rhodamine 6G, 1.32×10⁻⁴ M Rhodamine 800, 2.81×10⁻³ M arginine, and 8.78×10⁻⁵ M TEOS in water. The solution was capped tightly and stirred slowly (100 rpm) in a 70°C oil bath for 48 hours. The resulting particles were washed twice with ethanol and then with water. Details are provided in the Supplementary materials.
QD/silica
To a solution of QDs, L-arginine was added, followed by TEOS. Reaction concentrations were 2.81×10⁻³ M arginine, 8.78×10⁻⁵ M TEOS, and 478 nM QDs in water. The solution was capped tightly and stirred slowly (100 rpm) in a 70°C oil bath for 48 hours. The resulting particles were washed twice with ethanol and then twice with water. Details are provided in the Supplementary materials.
Particle characterization
Optical properties
Ultraviolet (UV)/visible absorption and fluorescence spectra were measured for particles diluted 10:1 with water. Spectra were recorded with a Shimadzu UV-2501PC spectrophotometer (Shimadzu Corporation, Kyoto, Japan). Fluorescence measurements were recorded with a Horiba Jobin-Yvon Fluorolog 3, using 5 nm slit widths for the emission and excitation monochromators with a 0.3 second integration time. Excitation wavelengths were 375 nm for QD/silica, 480 nm for Rhodamine 6G/silica, and 635 nm for Rhodamine 800/silica. A photomultiplier tube detector (Horiba Jobin-Yvon FL-1703) was used for QD/silica and Rhodamine 6G/silica, and a CCD detector (Horiba Jobin-Yvon Synapse) was used for the near-infrared Rhodamine 800/silica (Horiba, Kyoto, Japan).
QYs were measured using a Quanta-Phi integrating sphere attachment (Horiba Jobin-Yvon) for the Fluorolog 3.
Infrared spectroscopy
Diffuse reflectance infrared Fourier transform spectroscopy measurements were taken using a Perkin Elmer Spectrum 400 spectrometer (PerkinElmer Inc., Waltham, MA, USA). Samples were prepared by grinding approximately 1% by weight sample in KBr (potassium bromide) and measuring against a pure KBr background. All samples were dried for 2 days in a Millrock Benchtop Manifold Freeze Drier (Millrock Technology, Inc., Kingston, NY, USA), followed by vacuum drying for at least 12 hours at 110°C.
Nuclear magnetic resonance spectroscopy
High-resolution nuclear magnetic resonance (NMR) spectra were collected at room temperature, using a Bruker DSX spectrometer (Bruker, Billerica, MA, USA) operating at 300.13 and 59.62 MHz for 1H and 29Si, respectively. The 29Si chemical shifts were referenced to tetramethylsilane (TMS) (δ 29Si=0 ppm). The 29Si cross polarization magic angle spinning (CP-MAS) NMR spectra of the samples were obtained using a Bruker two-channel probe in a 4 mm rotor spun at 5 kHz. All CP-MAS spectra were carried out with a proton-to-silicon cross-polarization time of 5 milliseconds, relaxation delay of 5 seconds, and ~100 kHz proton decoupling.
Zeta potential and isoelectric point measurement
Zeta potentials were measured (Zetasizer Nano ZS, Malvern Instruments Ltd, Malvern, UK) for coated and uncoated particles suspended at 50 ppm in water. Samples were titrated against 1 M HCl, using attached autotitrator (Malvern MPT-1) set to record three zeta potential measurements every 0.3 pH units. Isoelectric point (IEP) values were determined by the Malvern software as the point where the zeta potential crossed a value of 0 mV.
Electron microscopy
High-resolution transmission electron microscopy (TEM) images were obtained using a Tecnai-F20 system (FEI™, Hillsboro, OR, USA). Particles were washed twice by centrifugation and replacement of supernatant, resuspended in a dilute solution of ethanol, and deposited onto a lacey-carbon-coated copper grid.
Biological imaging of final particles
Human intestinal epithelial cells (C2BBe1) and murine macrophage cells (MH-S) were acquired and propagated as described earlier (also included in the Supplementary materials).39 All animal experiments were approved by The Ohio State University Institutional Animal Care and Use Committee (protocol 2012A00000020). Female mice 8–12 weeks of age were purchased from Charles River Laboratories (Raleigh, NC, USA). When mice were received, they were provided food and water ad libitum. For the first experiment (in which mice were administered Rhodamine 6G/silica and Rhodamine 800/silica), mice were fed Teklad Global Rodent Diet 2016 (Harlan Laboratories, Indianapolis, IN, USA) for 10 days before nanoparticle administration to minimize autofluorescence in the mice from their diet. In a later experiment (with Rhodamine 6G/silica and QD/silica), mice were fed the Teklad AIN-93M Purified Diet (Harlan Laboratories) for 10 days before nanoparticle administration to further reduce the autofluorescence caused by their diet.
Rhodamine 6G/silica and QD/silica were administered by oral gavage to mice once daily, for four total administrations. Food was taken from mice several hours before each administration to empty the stomach. In the first experiment, Rhodamine 6G/silica and Rhodamine 800/silica were administered in 100 μL total volume at doses of 1 mg each. In the second experiment, Rhodamine 6G/silica and QD/silica were administered in doses of 0.1 and 0.67 mg, respectively (again, 100 μL total volume). Rhodamine 6G/silica, Rhodamine 800/silica, and QD/silica were suspended in water and sonicated using a Sonics Vibra-Cell sonicator (Sonic Materials, Inc., Norwalk, CT, USA), pulsing for 1 second on, 1 second off for approximately 15 seconds to minimize particle agglomeration immediately before administration. Mice were killed 3 hours after the final silica particle administration by carbon dioxide asphyxiation. Organs were excised and frozen in Tissue-Tek OCT Compound embedding medium (Sakura Finetek, Torrance, CA, USA). Organ blocks in OCT were sectioned onto microscope slides using a Microm HM505E cryostat (Microm International GbmH, Walldorf, Germany) at a thickness of 0.4 μm for fixation and staining for confocal microscopy.
A control mouse was kept under the same conditions as the mice administered Rhodamine 6G/silica and Rhodamine 800/silica or Rhodamine 6G/silica and QD/silica for the duration of the experiment but was not administered particles. This mouse was killed first to prevent contamination of its harvested organs with fluorescent nanoparticles. The organs of the control mouse were sectioned, stained, and examined by confocal fluorescence microscopy in the same manner as the organs from the silica nanoparticle-treated mice. Minimal green fluorescence was observed in control tissues, but any signal observed in control tissue was assumed to be autofluorescence and was used to help determine the optimal microscope settings for the differentiation of real signal and for comparison with tissue from treated animals. Tissues including kidney, spleen, and especially liver displayed greater background autofluorescence because of blood cells, but the gastrointestinal tract tissues, lung, and brain tissue showed very little background fluorescence.
Confocal microscopy
All staining was performed at room temperature by a procedure reported earlier (also described in the Supplementary materials). Mounting media was allowed to cure overnight before analysis using a four-laser confocal LSM 700 microscope (Carl Zeiss Microscopy Ltd, Germany).
Si, Cd measurements in liver by ICP-MS
Approximately 0.3 g of each of the wet liver samples was digested in 7 mL concentrated nitric acid (GFS Chemicals, Veritas Low Trace Metals, Columbus, OH, USA) and 3 mL concentrated ultrapure hydrogen peroxide (GFS Chemicals, Veritas Low Trace Metals) at 190°C for 10 minutes in a closed vessel, using an Ethos 320 microwave digestion system (Milestone, Bergamo, Italy), and then diluted to a total volume of 100 mL with deionized water. The digested samples were measured using an Element 2 Inductively Coupled Plasma-Sector Field Mass Spectrometer (ThermoFinnigan, Bremen, Germany). Si was measured at a resolving power (R=m/Δm) of 300, and Cd was measured at a resolving power of 4,000. Solution calibration standards were prepared by dilution from commercial standard solutions (CPI International, Inc, Palo Alto, CA, USA). Next, 10 ppb indium was added to each standard and sample solution and used as an internal standard. A dilute suspension of QD/silica nanoparticles was also measured to compare the Cd/Si concentration ratio with that measured in the digested liver samples.
Results
Fluorophore entrapment by base-driven hydrolysis
Fluorescent silica particles were synthesized using hydrolysis of TEOS by arginine in the presence of organic dyes or QDs, as depicted in Figures 1 and 2. Because of the positive charge of the two dyes, they electrostatically bind to the surface of commercially obtained nanosilica cores, and the entire composite is then encapsulated within a silica framework formed by the base-catalyzed hydrolysis and condensation of TEOS (Figure 1). The reason for choosing the commercial silica particles as the core is that their morphology is more representative of the particles present in real samples. For QDs, direct growth of silica shell on the QD, using arginine as the base (Figure 2), was carried out. The QDs were prepared by a recently reported microwave process with QY of 40% and a size of 5 nm,38 as shown in the TEM in Figure 2.
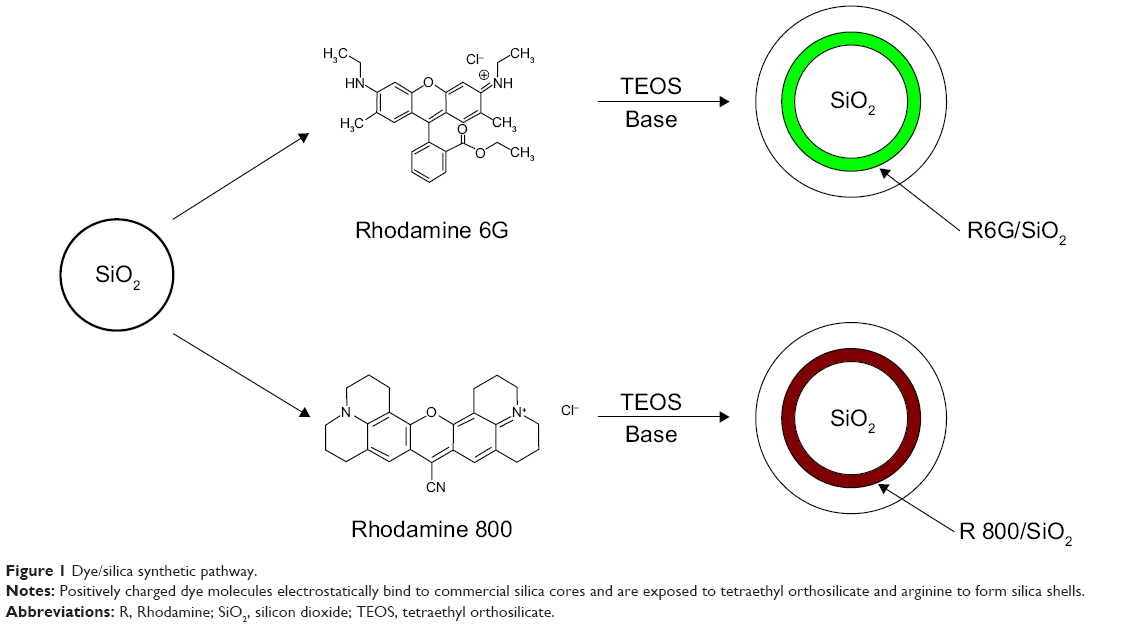 | Figure 1 Dye/silica synthetic pathway. |
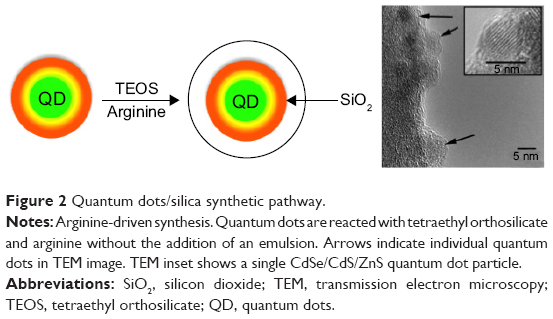 | Figure 2 Quantum dots/silica synthetic pathway. |
Experiments with arginine as base
Rhodamine 800
The synthesis depicted in Figure 1 was performed using arginine (2.81×10⁻³ M). In the case of Rhodamine 800 particles, the fluorescence was not strong enough to obtain a QY, so the fluorescence intensity as a function of dye and TEOS concentration was monitored. Rhodamine 800 concentrations of 6.59×10⁻⁴, 1.32×10⁻³, and 2.64×10⁻³ M were used. Increasing the dye concentration higher than 1.32×10⁻³ M resulted in decreased fluorescence intensity (Figure S1). With TEOS, the following concentrations were used: 4.39×10⁻⁶, 8.78×10⁻⁶, 8.78×10⁻⁵, and 4.39×10⁻⁴ M, with 8.78×10⁻⁵ M TEOS being the optimal concentration (Figure S2). All further studies were performed with the particles obtained using 1.32×10⁻³ M dye and 8.78×10⁻⁵ M TEOS. Figure 3A shows the TEM of the starting silica particle (diameter, 20±5 nm), and Figure 3B shows the Rhodamine 800/silica particle with a diameter of 32±15 nm. As shown in Figure 3C, there was no loss in fluorescence intensity on incubation of Rhodamine 800/silica in phosphate-buffered saline (PBS) media (pH=7.4) for a week.
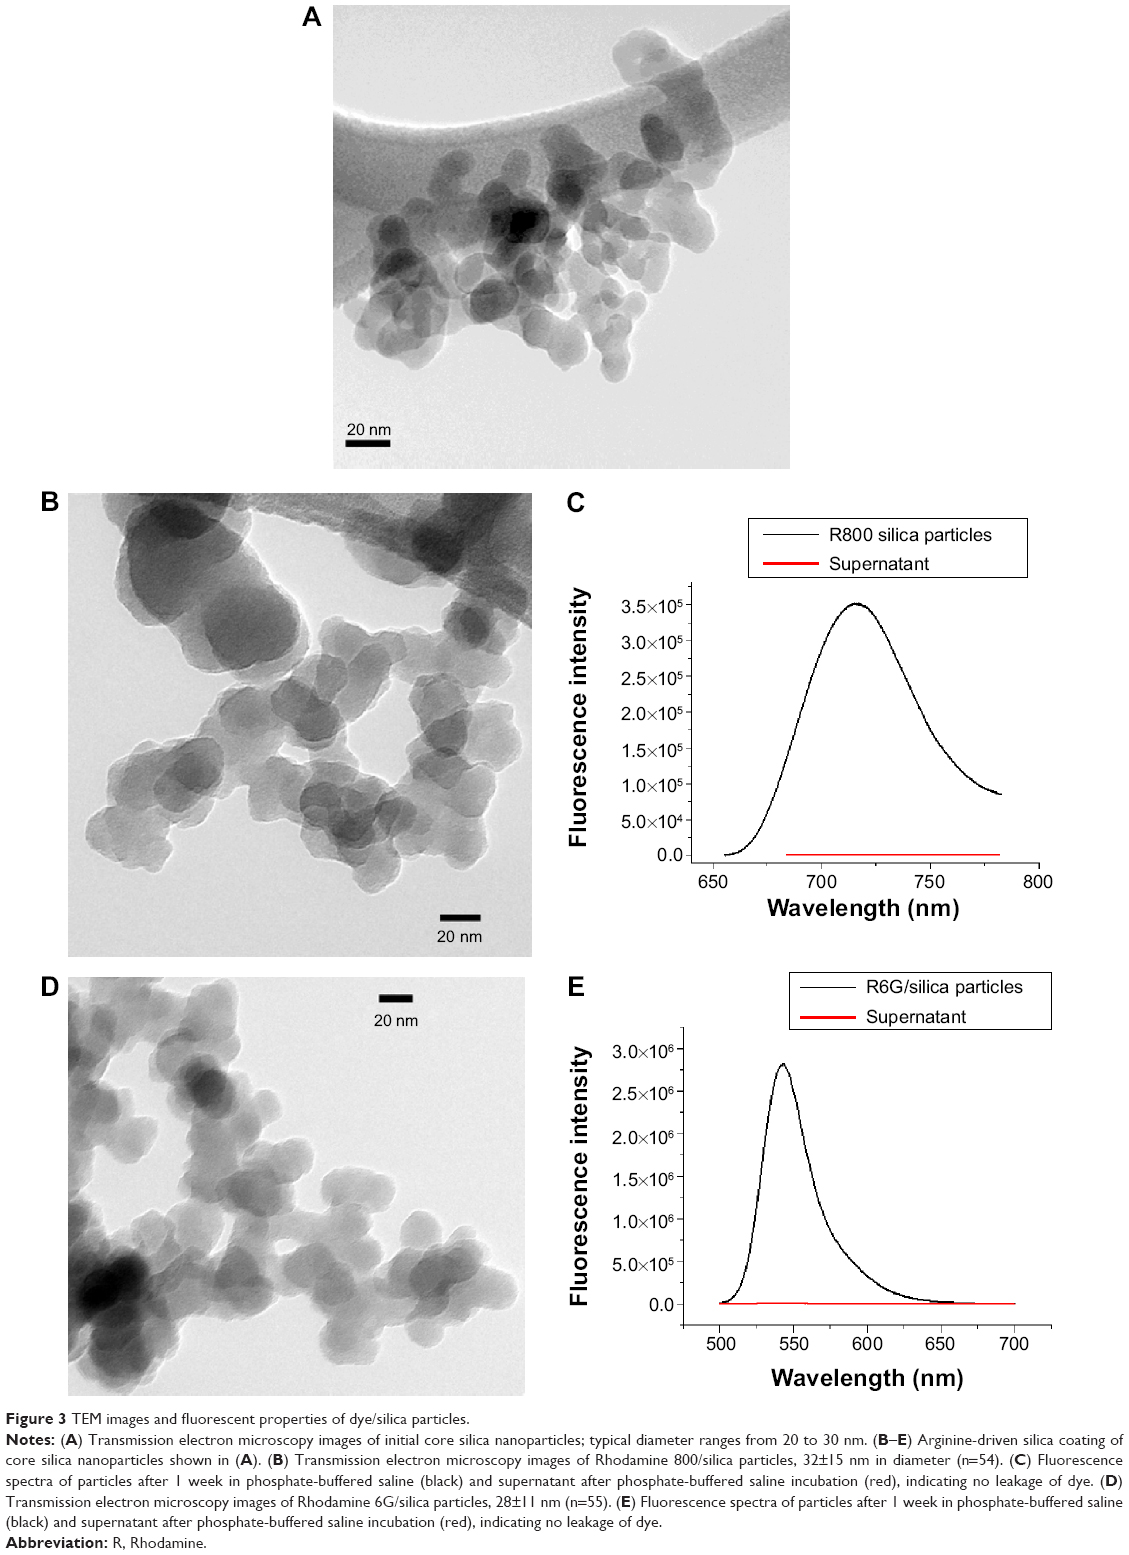 | Figure 3 TEM images and fluorescent properties of dye/silica particles. |
Rhodamine 6G
For optimization of the Rhodamine 6G/silica particle synthesis conditions, QYs were measured in each step. The optimal TEOS concentration of 8.78×10⁻⁵ M from the Rhodamine 800 particles was also used for Rhodamine 6G. Particles synthesized with Rhodamine 6G concentrations of 6.82×10⁻⁴ and 1.36×10⁻³ M had QYs of 7% and 20%, respectively. With 2.73×10⁻³ M Rhodamine 6G, the seed silica particles aggregated and were not suitable for coating. Therefore, all further studies were carried out with the particles obtained with 1.36×10⁻³ M Rhodamine 6G. Figure 3D shows the TEM of the Rhodamine 6G/silica particle, with an average size of 28±11 nm. These Rhodamine 6G/silica samples were stable against dye leakage in PBS (pH=7.4) media for 1 week (Figure 3E).
QDs
Figure 4 shows TEM images of QD/silica particles synthesized using 9.38×10⁻⁴, 2.81×10⁻³, 5.63×10⁻³, and 1.13×10⁻² M arginine, using the method depicted in Figure 2. As the concentration of arginine increases, the particles become more aggregated, with more QDs per silica particle. At 5.63×10⁻³ and 1.13×10⁻² M, many large strands of coated QDs are seen, rather than spherical particles, with primary particle sizes of 29±5 and 31±8 nm, respectively. At 2.81×10⁻³ M, spherical particles with an average diameter of 29±6 nm and 0–4 QDs per particle are primarily seen, with fewer strand-like structures. The 9.38×10⁻⁴ M arginine sample showed only spherical particles with an average diameter of 22±3 nm and 0–4 QDs per particle.
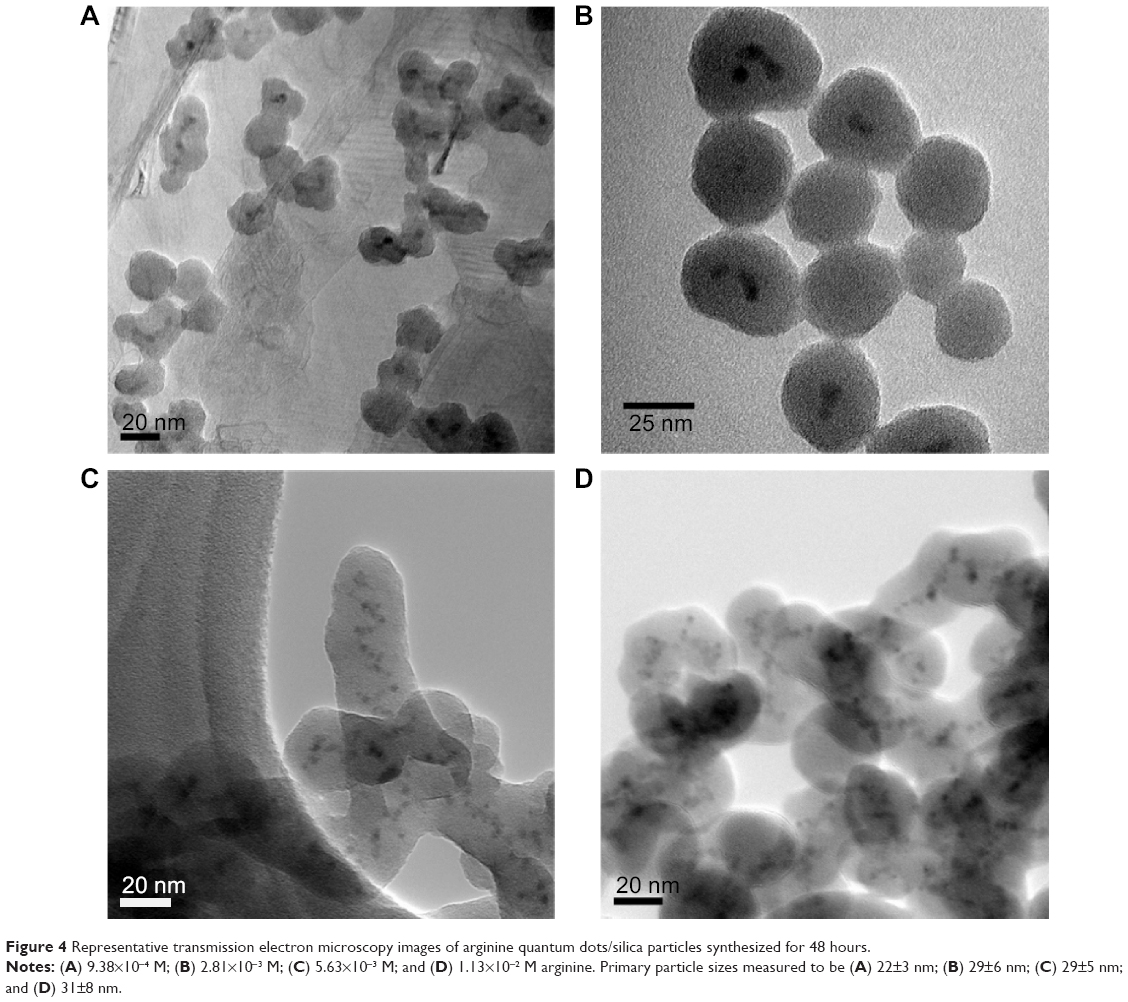 | Figure 4 Representative transmission electron microscopy images of arginine quantum dots/silica particles synthesized for 48 hours. |
Table 1 summarizes the QYs and average sizes of these particles. The sample prepared with 9.38×10⁻⁴ M arginine has close to a single QD per silica particle, but a QY of 8%. The 2.81×10⁻³ M sample had the highest QY, at 25%, whereas the 5.63×10⁻³ and 1.13×10⁻² M samples, which showed significant QD aggregation, both had QYs of 7%.
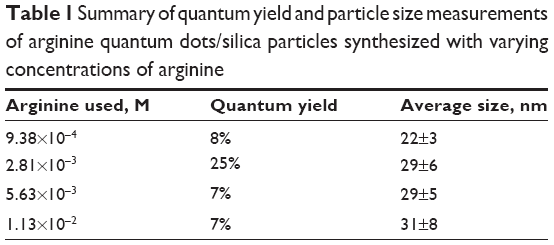 | Table 1 Summary of quantum yield and particle size measurements of arginine quantum dots/silica particles synthesized with varying concentrations of arginine |
The optimized QD/silica (QY of 25%) exhibited stable fluorescence throughout the 7 days of suspension in PBS (pH=7.4), as shown in Figure 5.
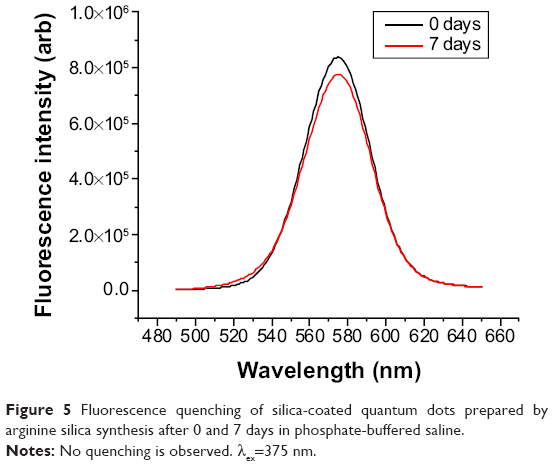 | Figure 5 Fluorescence quenching of silica-coated quantum dots prepared by arginine silica synthesis after 0 and 7 days in phosphate-buffered saline. |
Characterization
Zeta potential
The surface charge characteristics of the two dye and QD/silica particles were compared with commercial silica by analyzing their zeta potential across a range of pH values. These titrations are shown in Figure 6; all particles start at a zeta potential of approximately -30 mV at a pH of 5 and approach a neutral zeta potential of 0 mV near a pH value of 1–2. This suggests that the synthesized dye/silica and QD/silica particles are comparable in surface functionality, and in the case of the dye/silica particles, there are no positively charged dye molecules on the silica surface.
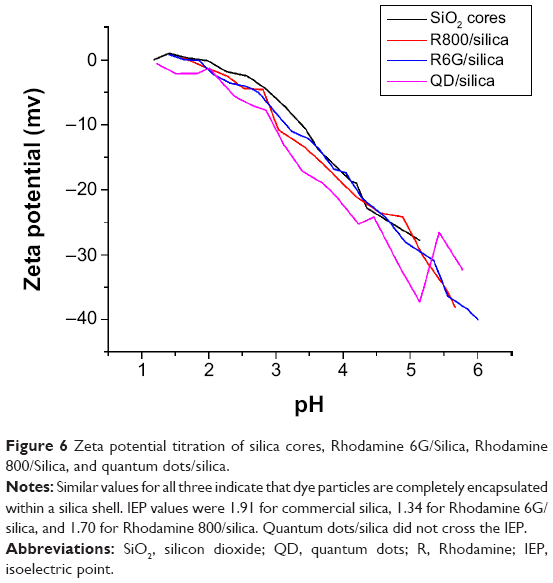 | Figure 6 Zeta potential titration of silica cores, Rhodamine 6G/Silica, Rhodamine 800/Silica, and quantum dots/silica. |
Optical properties
UV/visible and fluorescence
Figure 7 shows a comparison of the UV/visible absorption and fluorescence spectra of Rhodamine 6G, Rhodamine 800, and QDs before and after silica coating using arginine. For Rhodamine 6G (Figure 7A and B), on silica coating, there is the appearance of a shoulder at 500 nm in the absorption spectrum, and the emission maxima are blue-shifted from 552 to 543 nm. For Rhodamine 800 (Figure 7C and D), on silica coating, two absorption bands at 697 and 635 nm are observed, with the 635 nm peak becoming dominant. The fluorescence peak of Rhodamine 800 is red-shifted from 711 to 716 nm on coating. For QD/silica (Figure 7E and F), the absorption and emission spectra remain unchanged on silica coating.
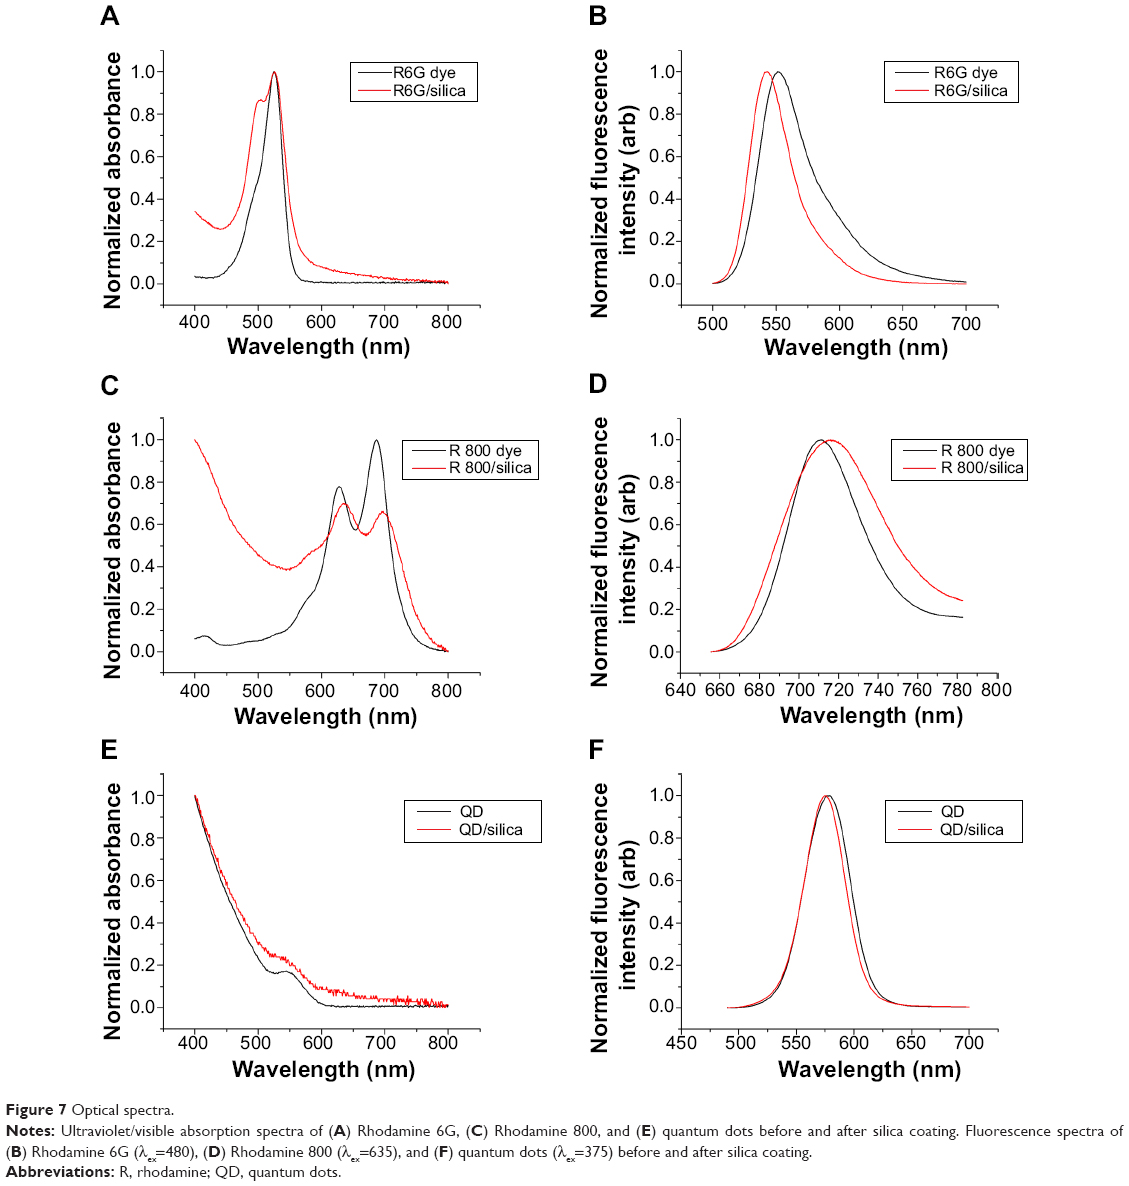 | Figure 7 Optical spectra. |
Infrared
Figure S3A compares the diffuse reflectance infrared Fourier transform spectroscopy spectra of lyophilized samples of arginine-based Rhodamine 6G and QD/silica particles in the 700–1,000 cm−1 range (the entire spectra are shown in Figure S4, and peaks at 800, 963, 1,104, and 1,206 cm−1 closely match literature values40). Of particular interest is the 963 cm−1 in-plane stretching Si-O vibration attributed to Si-O-H groups, indicating silanol groups on these samples.
NMR
Figure S3B shows the 29Si CP-MAS NMR spectra of the arginine-derived Rhodamine 6G and QD/silica particles. Silicon atoms within the silica framework have four different coordinations, depending on the number of bridging oxygen atoms, commonly denoted as Q1, Q2, Q3, and Q4, with an increasing number of OSi groups bonded to the silicon.41 The Q2 and Q3 peaks in Figure S3B indicate the presence of silanols.
Biological studies
In vitro studies
The internalization of QD/silica and Rhodamine 6G/silica by the mouse macrophage cell line MH-S was readily observed by confocal fluorescence microscopy. After 24 hours of treatment, both dye/silica and QD/silica were observed in almost all macrophage cells surrounding the nucleus, but not within the nucleus (Figure S5). C2BBe1 cells are an intestinal epithelial cell line originally cloned from the human colon cancer cell line Caco-2. These cells are widely used as an in vitro model for normal intestinal epithelium.39 After both QD/silica and Rhodamine 6G/silica treatments, silica particles were internalized by cells and are visible in the cytoplasm of cells surrounding the nucleus (Figure S6).
In vivo studies
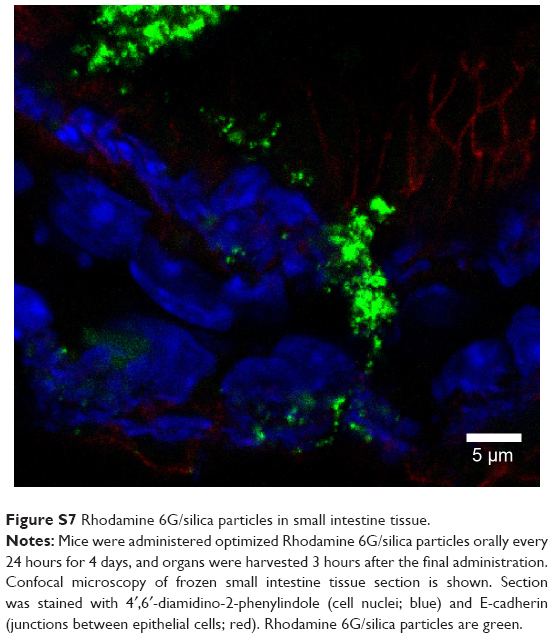
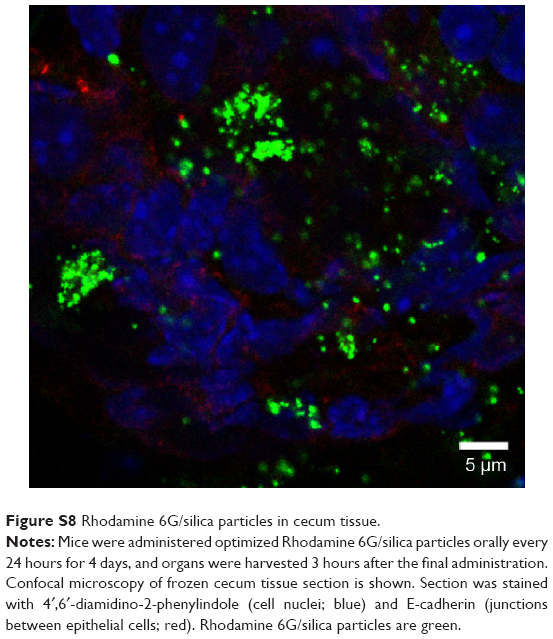
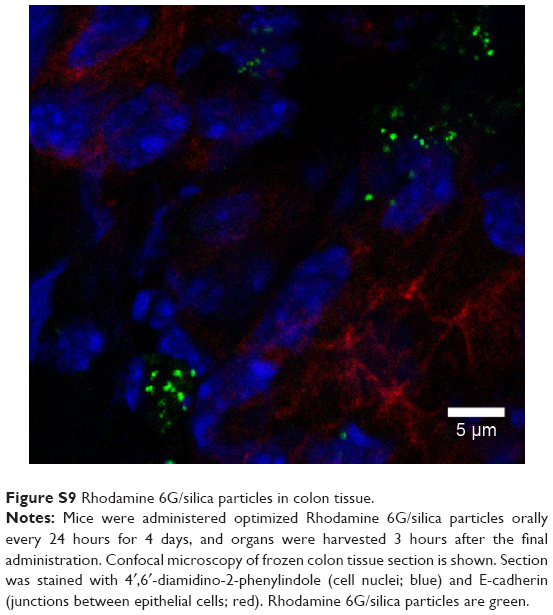
Nanoparticles (Rhodamine 6G/silica and Rhodamine 800/silica, 1 mg each) were orally administered to mice. Figure 8A shows a fluorescence image of the stomach of a mouse administered silica four times over the 4 hours before death. The stomach appears to be full of Rhodamine 6G/silica (Rhodamine 800 could not be imaged with the microscope). These particles appeared to be contained in the stomach contents but were generally not internalized by the cells lining the stomach. Rhodamine 6G/silica was also observed in intestinal sections of a mouse treated daily for 4 days (1 mg) and killed 4 hours after the final treatment (Figure S7). The particles were readily visible in cecum (Figure S8) and colon (Figure S9). The dye/silica particles visible in these sections are often near the edge of the lumen of the gastrointestinal tract, indicating that they may be trapped in the mucus layer that protects the epithelial cell lining. It is not surprising to find orally administered particles throughout the gastrointestinal tract as they pass through the digestive system. To determine whether particles traversed the intestinal epithelium and entered the circulation to gain access to other tissues/organs, confocal fluorescence images of sectioned kidney, lung, brain, and spleen were taken, as shown in Figure 8B–E, respectively. Rhodamine 6G/silica signal was found in all of these tissues. In contrast, only background fluorescence was observed in a control mouse not administered any of the particles (described in the Experimental Section).
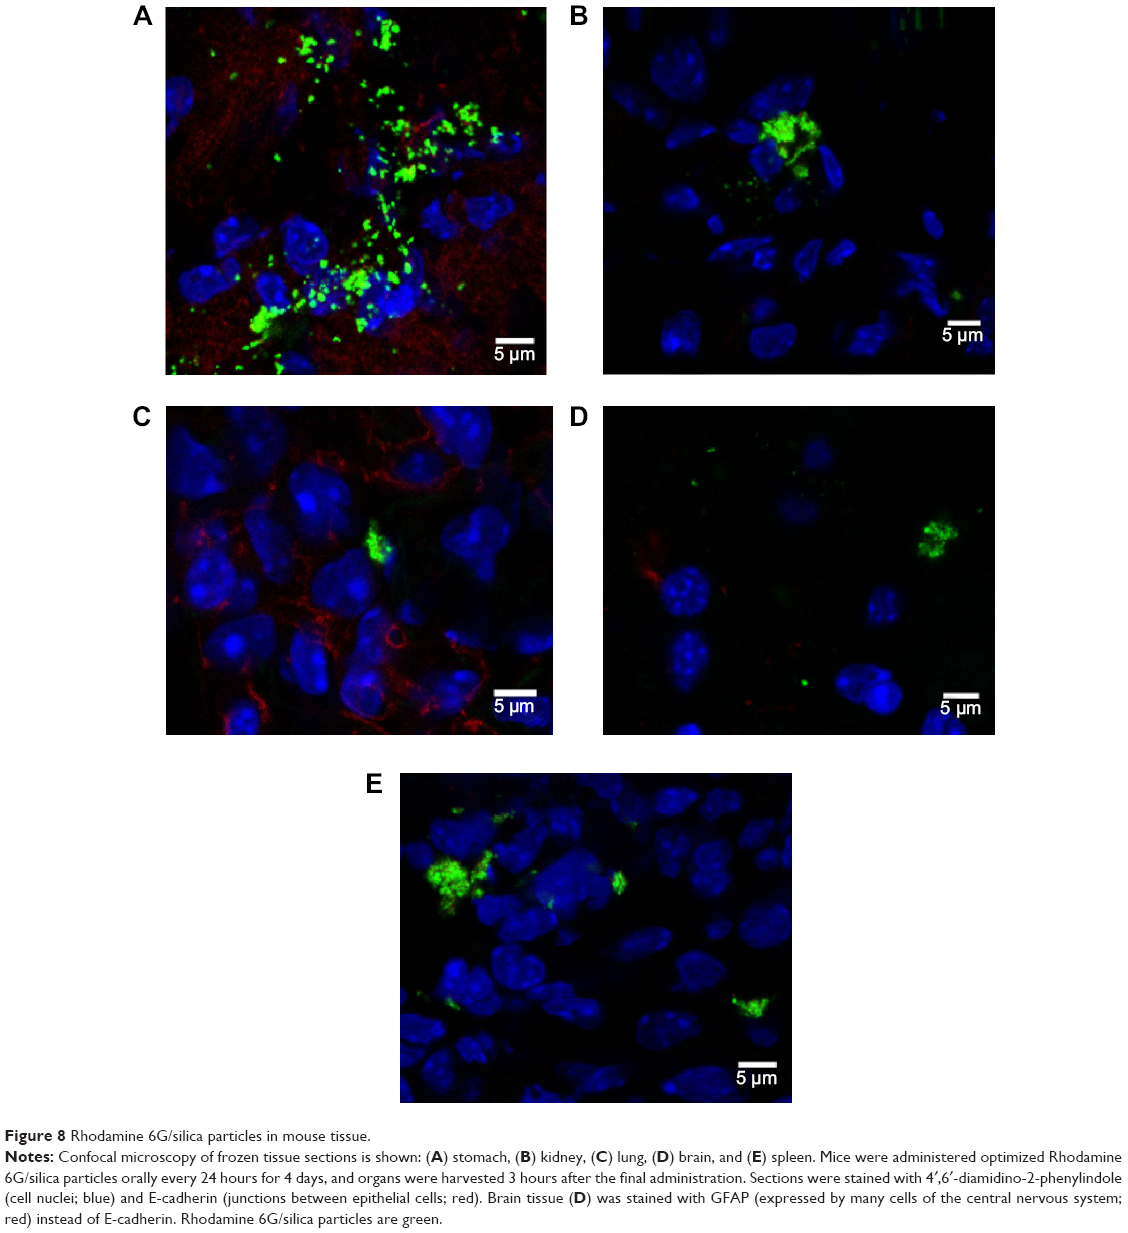 | Figure 8 Rhodamine 6G/silica particles in mouse tissue. |
In another experiment, a dilute mixture of Rhodamine 6G/silica (0.1 mg) and QD/silica (0.67 mg) were administered once a day, for four total administrations. Confocal fluorescence microscopy demonstrated the presence of particles in the stomach, as well as in the liver. Figure 9A shows the fluorescence image of a liver tissue section, indicating the presence of silica particles. Liver tissues were also digested and analyzed by ICP-MS. Figure 9B shows the Cd/Si ratio of the liver compared with the as-synthesized samples of the QD/silica. The absolute concentrations for QD/silica were 1.9 ppm Cd and 150 ppm Si in a diluted QD/silica nanoparticle suspension, and for liver tissue, they were 6.2 ppb Cd and 480 ppb Si in the solution digests. The fact that the Cd/Si ratio is similar for the as-synthesized QD and the liver indicates unequivocally that the liver section examined by ICP-MS contains the QD/silica nanoparticles, rather than a dissolved silicate.
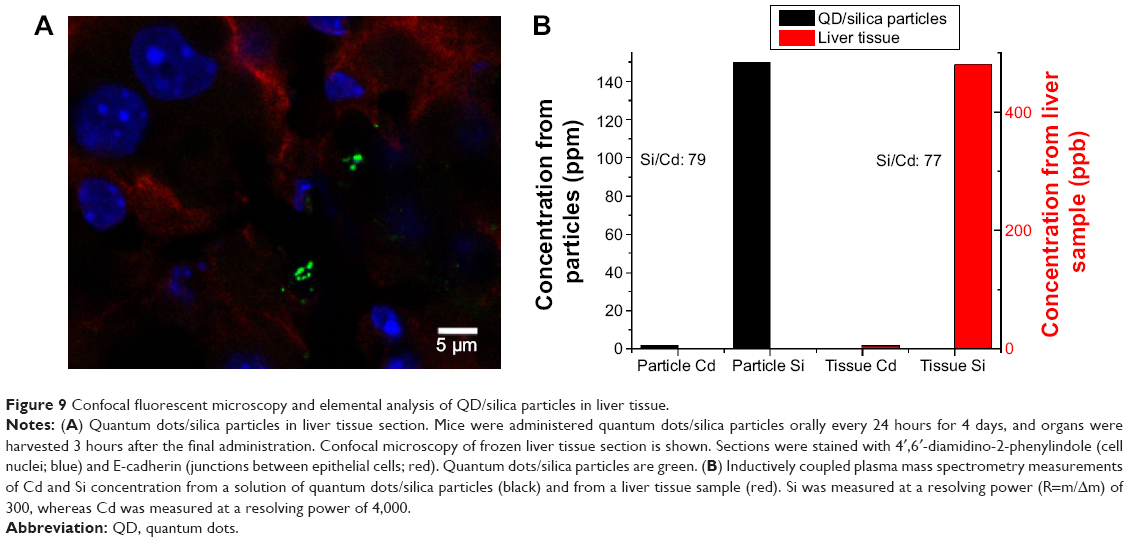 | Figure 9 Confocal fluorescent microscopy and elemental analysis of QD/silica particles in liver tissue. |
Discussion
Production of fluorescent dye-modified silica is an extensively researched field. A large number of dyes have been conjugated to silica nanoparticles, primarily by covalent linkage, and used in biological research for imaging and targeting specific cells by appropriate surface modification of the silica.30 There are also reports of bioanalysis and biodetection using fluorescently labeled silica particles.30 Different synthesis protocols are reported, but most studies do not report QY values for bound dye, which would allow for direct comparison of the syntheses. In addition to brightness, the stability of the particles and their ability to retain dyes for certain applications is crucial. Ammonia-based Stöber or the microemulsion method for silica nanoparticles usually results in porous silica shells.31,42 Recent studies have reported that use of basic amino acids such as lysine and arginine result in more dense shells.32,33 In this article, our interest is to simulate commercial silica particles, and so the dye needs to be encapsulated within the silica.
Stability of fluorophore/silica particles
Using arginine as base produced particles with stable fluorescence properties (Figures 3 and 5) and no dye leaching or quenching of the QD, even after 1 week in PBS solution. The stability of arginine-synthesized silica particles with entrapped dyes has been previously noted and attributed to slower reaction kinetics, allowing for complete hydrolysis of TEOS in silica monomers and condensation to form larger particles.32 We report that the arginine method also leads to silica-entrapped QD with stable fluorescence.
Optical characteristics of dye/silica particles
Figure 1 shows the structures of the Rhodamine 6G and Rhodamine 800 dyes; both have a positive charge and associate with the negatively charged silica seed surface (Figure 1) by electrostatic interactions. The optimum concentration for the highest fluorescence intensity for the final dye/silica particle was 1.32×10⁻³ M for Rhodamine 800 and 1.36×10⁻³ M for Rhodamine 6G. Above this concentration, the silica seeds aggregated because dye adsorption leads to a decrease in surface charge, and the repulsion between the silica particles is reduced. There was also an ideal TEOS concentration of 8.78×10⁻⁵ M for optimum fluorescence (Figure S2). We speculate that at higher concentrations, the anionic hydrolyzed silicate species can bind the positive dye molecules, removing them from the seed core before condensation on the core.
Mechanism of QD incorporation into the QD/silica system
The optimum QD/silica was obtained using 2.81×10⁻³ M arginine and has a QY of 25% (Table 1).
With CdTe QDs, an increase of initial QY from 8%–10% to 15% on silanization has been noted,28 but the stability of the particles was not examined. In another study focused on conferring stability to the CdSe QD, multiple shell layers were required, and a complex seven-layer shell structure had a QY of 47.8%, whereas in particles with simpler shell structures, the shell allowed penetration of reactants that quenched the fluorescence of the QDs.29
The TEM in Figure 4 shows that as the arginine concentration gradually increases from 9.38×10⁻⁴ to 1.13×10⁻² M, the number of QDs in the silica particle increases, and at the highest concentrations of arginine, the silica coating actually occurs on chains of QDs. Figure 10 explains the presence of multiple QDs in a single silica particle. The initial Si-OH groups on the QDs (formed by replacing the MPA) can condense with similar groups on neighboring QDs, forming dimers and higher-order chains. Thus, the extent of connectivity for a particular QD concentration will be dependent on the concentration of silicate species in the medium. The silicate concentration increases with arginine concentration. The larger number of silicate groups on the QD favors the connectivity between the QDs (Figure 10B). There have been several previous observations that have noted that increase in the hydrolyzing base concentration introduces QD aggregation.25,27,43,44 With the lowest concentration of arginine (9.38×10⁻⁴ M), there was almost one QD per silica particle, but the coating was not thick enough for stable fluorescence (Table 1).
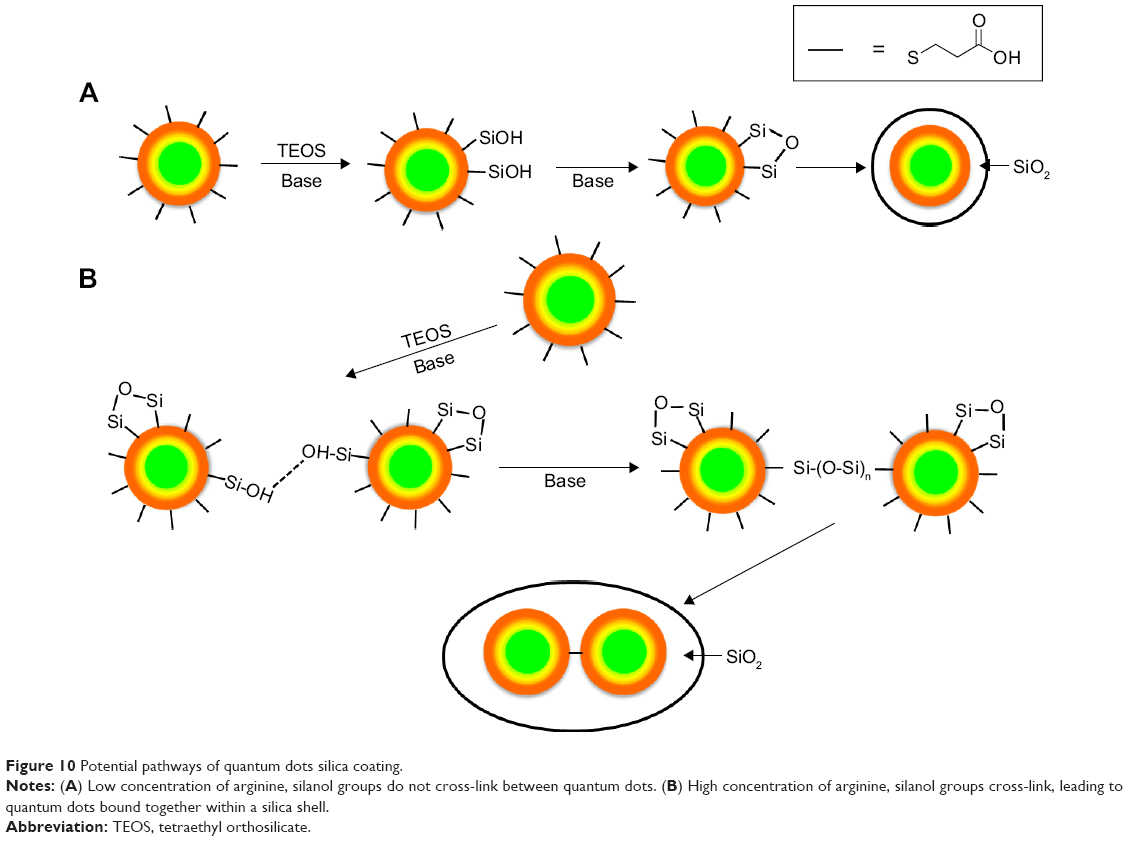 | Figure 10 Potential pathways of quantum dots silica coating. |
Application of the fluorescent silica particles in biological studies
Particles that leach dye or in which the QD fluorescence is not stable are not suitable for imaging studies. The other relevant characteristics are the size and surface charge of the nanoparticles, which determine their behavior in biological systems.1–7 Thus, if dye particles are associated with the particle surface, they can change the surface characteristics. We have shown that negatively charged QDs quickly associated with cell surface scavenger receptors, whereas positively charged QDs did not.7 Zeta potential versus pH titrations shown in Figure 6 confirm that the surface properties of the dye/silica, as well as QD/silica nanoparticles, are comparable to the commercial silica particles. Infrared and NMR (Figures S3 and S4) indicate the presence of silanol groups. Thus, both the arginine-derived dye/silica and QD/silica particles developed in this study are suitable for simulating commercial silica particles as they traverse through a biological system either in vitro or in vivo.
The dye/silica as well as the QD/silica particles are taken up by both macrophages and the intestinal epithelial cell line C2BBe1 (Figures S5 and S6). The epithelial cell line is of particular importance because it is relevant to nanoparticle ingestion.39 We have reported that titania, silica, and zinc oxide are internalized by C2BBe1 cells, indicating that there is the potential that particles can translocate from the gastrointestinal tract into the circulation and gain access to other organs/tissues.39 We have also noted, using a simulated digestion, that silica particles aggregate in stomach conditions (pepsin solution at pH 2), but then deagglomerate in intestinal conditions (neutral solutions of pancreatin and bile salts).39
The present dye/silica and QD/silica particles with similar surface characteristics as commercial silica particles afforded a way to track these particles in vivo by fluorescence microscopy. On introduction of the Rhodamine 6G dye/silica particles into the gastrointestinal tract of mice via gavage, we noted the presence of particles in several tissues both in and out of the digestive system. In the digestive system, we observed particles in the stomach, small intestine, cecum, and colon (Figures 8A, S7–S9). We also observed particles in the kidney, lung, brain, and spleen, indicating that these particles do enter the systemic circulation and subsequently localize within several organs (Figure 8B–E). A control mouse not administered particles just exhibited background fluorescence in these tissues. A previous study has noted that oral exposure to commercial silica nanoparticles in mice resulted in liver toxicity.20,21 Uptake of thiol-coated negatively charged silica particles of sizes ranging from 95 to 1,050 nm by Peyer’s patches in mice has been examined.2 Although such particles can be targeted toward specific cells because of their surface functionality, their uptake is not representative of silica nanoparticles presented in foods.
The QD/silica nanoparticle provided us with another novel opportunity that addresses a long-term issue in tracking nanoparticles in living systems.16,17 The presence of ingested silica from foods in tissues is usually determined by elemental analysis. However, the elemental analysis does not address what the source of silica is: Did it come from a nanoparticle? The issue relates to how nanosilica particles present in the gastrointestinal tract are observed: whether as dissolved silicate species or in their pristine nanoform, which will have major implications in their toxicity.16 By gavage, we introduced low levels of Rhodamine 6G/silica and QD/silica into the stomach, and then by fluorescence microscopy, we observed fluorescent particles in the liver (Figure 9A). However, there was no way to distinguish whether the dye or the QD/silica (or both) are being observed by microscopy. Pieces of the liver were also examined using ICP-MS. As Figure 9B shows, the Cd/Si ratio of the liver portion is very similar to that of the free QD/silica particle, suggesting that the observed silica particles contain QD, and not the dye. Thus, by exploiting the unique Cd/Si ratio of the QD, ICP-MS of the QD/silica-containing tissues did confirm that the silica indeed came from the particles that were introduced by gavage, and not from the background. There are two possible reasons why we detect the QD, rather than the dye. The first reason could be the size: the QD/silica is 22 nm, and the dye/silica is 28 nm. Size-dependent internalization of nanoparticles in tissues in rats administered nanoparticles by gavage is well known.3,4 However, considering the closeness in size, this may not be the main reason behind the preferential uptake of the QD. A more likely reason is that the QD/silica is present at a concentration about seven times that of the dye/silica.
Two studies have noted the presence of CdTe QD/silica and CdHgTe QD/silica particles in various organs after direct injection into the bloodstream via the tail vein.28,45 The present study is more relevant to ingested nanoparticles in food and to passage of nanoparticles through the gastrointestinal tract.
Conclusion
We show here that an arginine-based silica shell synthesis is appropriate for encapsulation of QDs and Rhodamine-family dyes. Particles showed no dye leaching or fluorescence quenching within 1 week of exposure to biological conditions. These particles were strongly fluorescent, with QYs of 20% and 25% for Rhodamine 6G and QD/silica particles, respectively. Zeta potential titrations indicate that the surfaces of these fluorophore/silica nanoparticles are similar to commercial particles, making them suitable for monitoring the fate of these particles in biological systems. The fluorophore/silica particles were readily imaged in macrophages and epithelial cells. Particles were detected via fluorescence in several nongastrointestinal organs of mice, such as kidney, lung, brain, and spleen, after oral exposure, indicating that some population of the silica nanoparticles translocates across the digestive tract after ingestion. For the QD/silica particles, the ICP-MS and analysis of Cd/Si ratio can unequivocally identify the presence of nanoparticles in tissues. We have shown here that stable fluorescent silica nanoparticles with similar surface characteristics as commercial silica particles can enter circulation on ingestion, indicating a need for further study of their bioaccumulation and potential toxicity.
Acknowledgment
We acknowledge funding from the US Department of Agriculture/National Institute of Food and Agriculture (2011-67021-30360) for this research. PKD and WJW are senior authors and have directed this research.
Disclosure
The authors report no conflicts of interest in this work.
References
Jiang W, Kim BYS, Rutka JT, Chan WCW. Nanoparticle-mediated cellular response is size-dependent. Nat Nanotechnol. 2008;3(3):145–150. | ||
Awaad A, Nakamura M, Ishimura K. Imaging of size-dependent uptake and identification of novel pathways in mouse Peyer’s patches using fluorescent organosilica particles. Nanomedicine (Lond). 2012;8(5):627–636. | ||
Desai MP, Labhasetwar V, Amidon GL, Levy RJ. Gastrointestinal uptake of biodegradable microparticles: effect of particle size. Pharm Res. 1996;13(12):1838–1845. | ||
Jani P, Halbert GW, Langridge J, Florence AT. Nanoparticle uptake by the rat gastrointestinal mucosa: quantitation and particle size dependency. J Pharm Pharmacol. 1990;42(12):821–826. | ||
Warheit DB, Webb TR, Reed KL, Frerichs S, Sayes CM. Pulmonary toxicity study in rats with three forms of ultrafine-TiO2 particles: differential responses related to surface properties. Toxicology. 2007;230(1):90–104. | ||
Waldman WJ, Kristovich R, Knight DA, Dutta PK. Inflammatory properties of iron-containing carbon nanoparticles. Chem Res Toxicol. 2007;20(8):1149–1154. | ||
Nagy A, Zane A, Cole SL, Severance M, Dutta PK, Waldman WJ. Contrast of the biological activity of negatively and positively charged microwave synthesized CdSe/ZnS quantum dots. Chem Res Toxicol. 2011;24(12):2176–2188. | ||
Duncan TV. Applications of nanotechnology in food packaging and food safety: barrier materials, antimicrobials and sensors. J Colloid Interface Sci. 2011;363(1):1–24. | ||
Das M, Saxena N, Dwivedi PD. Emerging trends of nanoparticles application in food technology: Safety paradigms. Nanotoxicology. 2009;3(1):10–18. | ||
Fröhlich E, Roblegg E. Models for oral uptake of nanoparticles in consumer products. Toxicology. 2012;291(1–3):10–17. | ||
Wang H, Du L-J, Song Z-M, Chen X-X. Progress in the characterization and safety evaluation of engineered inorganic nanomaterials in food. Nanomedicine (Lond). 2013;8(12):2007–2025. | ||
Chun AL. Will the public swallow nanofood? Nat Nanotechnol. 2009;4(12):790–791. | ||
Stamm H, Gibson N, Anklam E. Detection of nanomaterials in food and consumer products: bridging the gap from legislation to enforcement. Food Addit Contam Part A Chem Anal Control Expo Risk Assess. 2012;29(8):1175–1182. | ||
Project on Emerging Nanotechnologies. Consumer Products Inventory. Available from: http://www.nanotechproject.org/cpi/. Accessed May 19, 2014. | ||
Peters R, Kramer E, Oomen AG, et al. Presence of nano-sized silica during in vitro digestion of foods containing silica as a food additive. ACS Nano. 2012;6(3):2441–2451. | ||
Dekkers S, Krystek P, Peters RJ, et al. Presence and risks of nanosilica in food products. Nanotoxicology. 2011;5(3):393–405. | ||
Dekkers S, Bouwmeester H, Bos PMJ, Peters RJB, Rietveld AG, Oomen AG. Knowledge gaps in risk assessment of nanosilica in food: evaluation of the dissolution and toxicity of different forms of silica. Nanotoxicology. 2013;7(4):367–377. | ||
Weir A, Westerhoff P, Fabricius L, Hristovski K, von Goetz N. Titanium dioxide nanoparticles in food and personal care products. Environ Sci Technol. 2012;46(4):2242–2250. | ||
US Food and Drug Administration. Guidance for Industry: Assessing the Effects of Significant Manufacturing Process Changes, Including Emerging Technologies, on the Safety and Regulatory Status of Food Ingredients and Food Contact Substances, Including Food Ingredients that Are Color Additives. Silver Spring, MD: US Food and Drug Administration. Available from: http://www.fda.gov/Food/GuidanceRegulation/GuidanceDocumentsRegulatoryInformation/IngredientsAdditivesGRASPackaging/ucm300661.htm. Accessed June 9, 2014. | ||
van der Zande M, Vandebriel RJ, Groot MJ, et al. Sub-chronic toxicity study in rats orally exposed to nanostructured silica. Part Fibre Toxicol. 2014;11(1):8. | ||
van Kesteren PC, Cubadda F, Bouwmeester H, et al. Novel insights into the risk assessment of the nanomaterial synthetic amorphous silica, additive E551, in food. Nanotoxicology. 2014:1–10. | ||
Stöber W, Fink A, Bohn E. Controlled growth of monodisperse silica spheres in the micron size range. J Colloid Interface Sci. 1968;26(1):62–69. | ||
Rahman IA, Padavettan V. Synthesis of Silica Nanoparticles by Sol-Gel: Size-Dependent Properties, Surface Modification, and Applications in Silica-Polymer Nanocomposites – A Review. J Nanomater. 2012;2012:132424. | ||
Osseo-Asare K, Arriagada FJ. Preparation of SiO2 nanoparticles in a non-ionic reverse micellar system. Colloids Surf. 1990;50:321–339. | ||
Darbandi M, Thomann R, Nann T. Single Quantum Dots in Silica Spheres by Microemulsion Synthesis. Chem Mater. 2005;17(23):5720–5725. | ||
Daberkow T, Meder F, Treccani L, Schowalter M, Rosenauer A, Rezwan K. Fluorescence labeling of colloidal core–shell particles with defined isoelectric points for in vitro studies. Acta Biomater. 2012;8(2):720–727. | ||
Chu M, Sun Y, Xu S. Silica-coated quantum dots fluorescent spheres synthesized using a quaternary “water-in-oil” microemulsion system. J Nanopart Res. 2008;10(4):613–624. | ||
Ma N, Marshall AF, Gambhir SS, Rao J. Facile synthesis, silanization, and biodistribution of biocompatible quantum dots. Small. 2010;6(14):1520–1528. | ||
Zhang B, Gong X, Hao L, Cheng J, Han Y, Chang J. A novel method to enhance quantum yield of silica-coated quantum dots for biodetection. Nanotechnology. 2008;19(46):465604. | ||
Bae SW, Tan W, Hong J-I. Fluorescent dye-doped silica nanoparticles: new tools for bioapplications. Chem Commun (Camb). 2012;48(17):2270–2282. | ||
Park S-J, Kim Y-J, Park S-J. Size-dependent shape evolution of silica nanoparticles into hollow structures. Langmuir. 2008;24(21):12134–12137. | ||
Mahon E, Hristov DR, Dawson KA. Stabilising fluorescent silica nanoparticles against dissolution effects for biological studies. Chem Commun (Camb). 2012;48(64):7970–7972. | ||
Yokoi T, Sakamoto Y, Terasaki O, Kubota Y, Okubo T, Tatsumi T. Periodic arrangement of silica nanospheres assisted by amino acids. J Am Chem Soc. 2006;128(42):13664–13665. | ||
Frangioni JV. In vivo near-infrared fluorescence imaging. Curr Opin Chem Biol. 2003;7(5):626–634. | ||
Magde D, Wong R, Seybold PG. Fluorescence quantum yields and their relation to lifetimes of Rhodamine 6G and fluorescein in nine solvents: improved absolute standards for quantum yields. Photochem Photobiol. 2002;75(4):327–334. | ||
Alessi A, Salvalaggio M, Ruzzon G. Rhodamine 800 as reference substance for fluorescence quantum yield measurements in deep red emission range. J Lumin. 2013;134:385–389. | ||
Han H, Francesco GD, Maye MM. Size Control and Photophysical Properties of Quantum Dots Prepared via a Novel Tunable Hydrothermal Route. J Phys Chem C. 2010;114(45):19270–19277. | ||
Zane A, McCracken C, Knight DA, Waldman WJ, Dutta PK. Spectroscopic Evaluation of the Nucleation and Growth for Microwave-Assisted CdSe/CdS/ZnS Quantum Dot Synthesis. J Phys Chem C. 2014;118(38):22258–22267. | ||
McCracken C, Zane A, Knight DA, Dutta PK, Waldman WJ. Minimal intestinal epithelial cell toxicity in response to short- and long-term food-relevant inorganic nanoparticle exposure. Chem Res Toxicol. 2013;26(10):1514–1525. | ||
Al-Oweini R, El-Rassy H. Synthesis and characterization by FTIR spectroscopy of silica aerogels prepared using several Si(OR)4 and R′′Si(OR′)3 precursors. J Mol Struct. 2009;919(1–3):140–145. | ||
El Rassy H, Pierre AC. NMR and IR spectroscopy of silica aerogels with different hydrophobic characteristics. J Non-Cryst Solids. 2005;351(19–20):1603–1610. | ||
Costa CAR, Leite CAP, Galembeck F. Size Dependence of Stöber Silica Nanoparticle Microchemistry. J Phys Chem B. 2003;107(20):4747–4755. | ||
Gerion D, Pinaud F, Williams SC, et al. Synthesis and Properties of Biocompatible Water-Soluble Silica-Coated CdSe/ZnS Semiconductor Quantum Dots†. J Phys Chem B. 2001;105(37):8861–8871. | ||
Buiculescu R, Hatzimarinaki M, Chaniotakis NA. Biosilicated CdSe/ZnS quantum dots as photoluminescent transducers for acetylcholinesterase-based biosensors. Anal Bioanal Chem. 2010;398(7–8):3015–3021. | ||
Chen H, Cui S, Tu Z, Gu Y, Chi X. In vivo monitoring of organ-selective distribution of CdHgTe/SiO2 nanoparticles in mouse model. J Fluoresc. 2012;22(2):699–706. |
Supplemental materials
Experimental section
Fluorophore entrapment by arginine-driven reaction
Dye/silica
A 30 mL, 10 ppm solution of dye was sonicated to ensure dissolution. Thirty milligrams of commercial silica nanoparticles (Sigma Aldrich; ~20 nm) were added and the solution was placed in an ultrasonic bath for 30 minutes, resulting in silica particles electrostatically bound by the dye. The solution was then placed in a small polypropylene bottle with a Teflon stir bar. Fifteen milligrams L-arginine were added, and the solution was stirred for 15 minutes until fully dissolved. Six hundred microliters tetraethyl orthosilicate (TEOS) were slowly added to the solution, which resulted in two phases: TEOS on top and water/arginine/silica-dye below. Reaction concentrations were 1.36×10⁻³ M Rhodamine 6G, 1.32×10⁻³ M Rhodamine 800, 2.81×10⁻³ M arginine, and 8.78×10⁻⁵ M TEOS in water. The solution was capped tightly and stirred slowly (100 rpm) in a 70°C oil bath for 48 hours. After the reaction, the TEOS layer was no longer present and the solution appeared cloudy compared with the original clear silica-dye solution. The resulting particles were washed twice with ethanol and then with water by centrifuging at 50,000×g, removing supernatant, and replacing with new solvent. The solid was washed until fluorescence was not detected in the discarded supernatant. The solution was covered with aluminum foil and stored at 4°C until needed. If allowed to sit for several days, particles required sonication to resuspend.
Quantum dots/silica
A previously synthesized solution of quantum dots was diluted to 1 mg particles/mL (30 mL total) in a small polypropylene bottle. Fifteen milligrams L-arginine were added, and the solution was stirred for several minutes until dissolved. Six hundred microliters TEOS were slowly added to the solution, which resulted in two phases: TEOS on top and water/arginine/quantum dots (QDs) below. Reaction concentrations were 2.81×10⁻³ M arginine, 8.78×10⁻⁵ M TEOS, and 478 nM QDs in water. The solution was capped tightly and stirred slowly (100 rpm) in a 70°C oil bath for 48 hours. After reaction, the TEOS layer was no longer present and the solution appeared cloudy compared with the original clear QD solution. The resulting particles were washed twice with ethanol and then twice with water by centrifuging at 50,000×g (Beckman-Coulter Allegra 64R; Beckman Coulter Inc., Brea, CA, USA), removing supernatant, and replacing with new solvent. The solution was covered with aluminum foil and stored at 4°C until needed. If allowed to sit for several days, particles required sonication to resuspend.
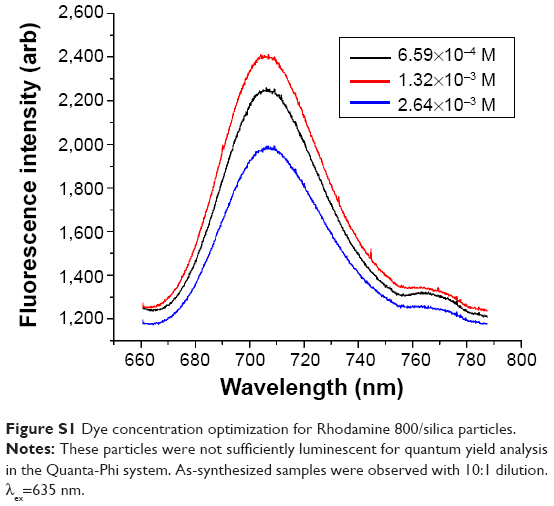 | Figure S1 Dye concentration optimization for Rhodamine 800/silica particles. |
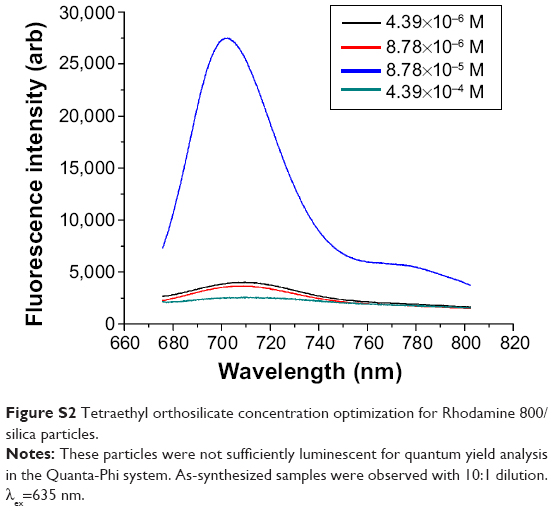 | Figure S2 Tetraethyl orthosilicate concentration optimization for Rhodamine 800/silica particles. |
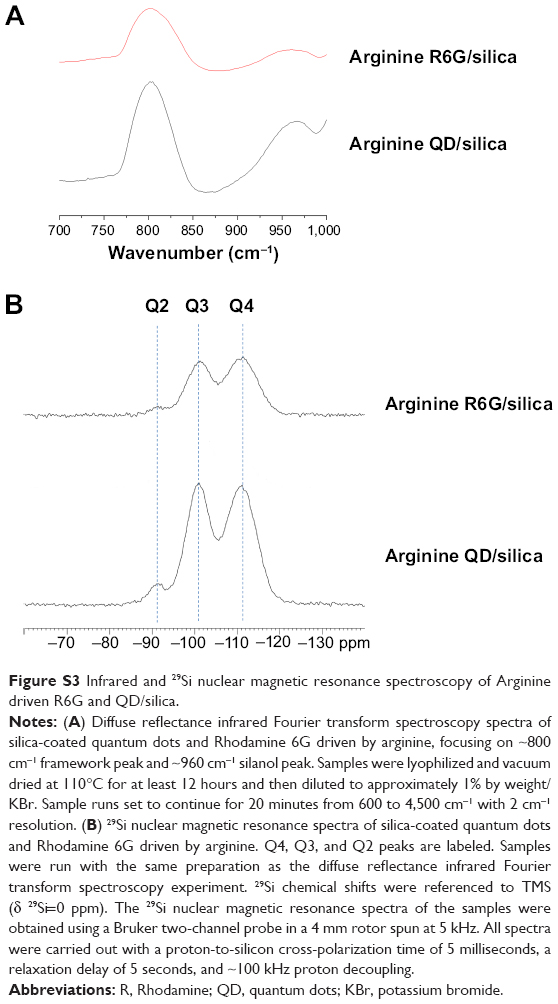 | Figure S3 Infrared and 29Si nuclear magnetic resonance spectroscopy of Arginine driven R6G and QD/silica. |
Quantum dot synthesis
Materials
Cadmium chloride hemipentahydrate (CdCl2·2.5 H2O; >98%) and sodium borohydride (NaBH4; 99%) were obtained from Aldrich (Milwaukee, WI, USA). Zinc chloride (ZnCl2; 99.99%), 3-mercaptopropionic acid (MPA), and selenium powder (Se; 99.5+%, 200 mesh) were obtained from Acros (Geel, Belgium). Sodium hydroxide (NaOH) and ammonium hydroxide (NH4OH, 28%–30%) were obtained from Mallinckrodt Chemicals (Phillipsburg, NJ, USA). All chemicals were used without further purification. The H2O used in this study was purified by a Barnstead NANOpure Infinity ultrapure water system (Dubuque, IA, USA).
CdSe/CdS/ZnS quantum dots were first prepared using a previously published synthesis.
Precursor solutions
Cadmium/MPA
A 250 mL solution of 1.05 mM Cd and 5.26 mM MPA was prepared by adding 60 mg cadmium chloride hemipentahydrate and 114.5 μL MPA to approximately 225 mL water. The pH was adjusted to 9.5 with 1 M NaOH, and the volume was adjusted to 250 mL in a volumetric flask. The final solution was stored in a plastic bottle and wrapped in aluminum foil.
Zn(NH3)42+
A 25 mL solution of 26.67 mM Zn(NH3)42+ was prepared using anhydrous zinc chloride and ammonium hydroxide. The hygroscopic zinc chloride was dried in a vacuum oven for 1 hour at 200°C and capped before weighing. To minimize error in weighing resulting from absorption of water from the air, approximately 90.9 mg zinc chloride was quickly added to a previously weighed beaker containing 20 mL water. Ammonium hydroxide was then added drop wise. A white precipitate formed and then disappeared as more ammonium hydroxide was added. Once the solution was fully clear, the volume of the solution was adjusted to 25 mL in a volumetric flask. The final solution was stored at 4°C in a plastic bottle wrapped in aluminum foil to protect it from light.
NaHSe
Next, 152 mg sodium borohydride was added to a glass test tube and chilled to 0°C in an ethylene glycol/water bath. In quick succession, 2 mL chilled water was pipetted into the test tube, followed by 158 mg selenium powder. The test tube was capped with a rubber stopper with two needles sticking through; one of the needles attached to a nitrogen gas tank, and the other was left open to vent. The test tube was quickly placed back into the cold bath. The reaction showed intense bubbling from the evolution of hydrogen gas, which lasted for approximately 30 minutes. By this time, the black selenium was reduced into the solution and a white Na2B4O7 precipitate formed.
After completion, the vial was moved to a nitrogen-filled glove bag. Half a milliliter of the supernatant was pipetted into a 50 mL three-neck round-bottom flask containing 24.5 mL nitrogen-saturated water. This yielded a 25 mL solution of 20 mM NaHSe. The flask was kept capped and nitrogen was constantly bubbled though the solution. Within 12–18 hours, the presence of a red tint indicated the selenium had oxidized and the solution was no longer useful.
CdSe nucleation
Nineteen milliliters of the Cd/MPA solution and a Teflon stir bar were added to a 25 mL round-bottom flask and brought to 100°C under reflux in a slowly stirring (100 rpm) oil bath. After removing the stir bar from the oil bath to avoid splashing of hot oil, the stirring speed was increased to 1,200 rpm. Reflux was temporarily removed to quickly pipet 0.25 mL of the NaHSe precursor solution, immediately resulting in a yellow color resulting from formation of CdSe nuclei. The solution was stirred at temperature (100°C) for 1 hour and then cooled to room temperature. This solution of seed nuclei was then subjected to infrared-filtered irradiation for 2 hours, using a 150 W Xe lamp (model UXL151HXE; PTI, Edison, NJ, USA) at room temperature under rapid stirring (1,200 rpm).
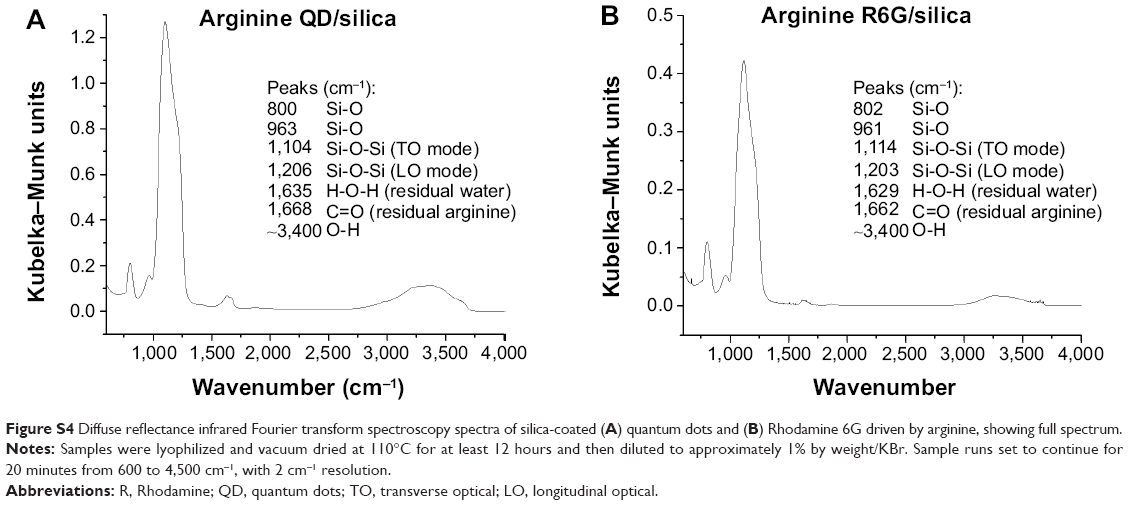 | Figure S4 Diffuse reflectance infrared Fourier transform spectroscopy spectra of silica-coated (A) quantum dots and (B) Rhodamine 6G driven by arginine, showing full spectrum. |
After nucleation, 0.75 mL of the Zn(NH3)42+ precursor solution was added. The final 20 mL solution was 1 mM Cd, 1 mM Zn, 0.25 mM Se, and 5 mM MPA.
Microwave-assisted growth
The solution was placed in a Discover SP (CEM Corp., Matthews, NC, USA) microwave system and heated for 70 minutes at 150°C, with maximum power set to 200 watts. After completion, the solution was quickly cooled to 40°C in the microwave, with a stream of room temperature air, and then allowed to cool to room temperature.
UV/visible light aging and cleaning
Samples were subjected to infrared-filtered irradiation for 6 hours at room temperature under rapid stirring (1,200 rpm). Particles were washed once by centrifugation at 290,000×g (Thermo Scientific Sorvall MX-150 Ultracentrifuge, S50-A rotor; Thermo Fisher Scientific, Waltham, MA, USA), removal of supernatant, and replacement with water. Extensive washing leads to loss of MPA capping ligand and destabilizes the particles. The final solution was covered with aluminum foil and stored at 4°C until needed. Particles were stable for several months under these conditions.
Cell culture
C2BBe1 and MH-S cells were obtained from the American Type Culture Collection (Manassas, VA, USA). C2BBe1 cells were cultured in Dulbecco’s Modified Eagle Medium (DMEM; Life Technologies, Grand Island, NY, USA) supplemented with 10% fetal bovine serum (Serum Source International, Inc., Charlotte, NC, USA), 1 mM sodium pyruvate, 2 mM L-glutamine, 0.3% penicillin/streptomycin, 0.3 μg/mL Amphotericin B (fungizone), and 10 μg/mL transferrin (all from Life Technologies). MH-S cells were cultured in RPMI Medium 1,640 (Life Technologies) supplemented with 10% fetal bovine serum (Serum Source International, Inc.), 0.3% penicillin/streptomycin, and 0.3 μg/mL Amphotericin B (fungizone; both from Life Technologies). Cells were incubated in 5% CO2/95% ambient air at 37°C. C2BBe1 cells were passaged every 5–7 days and plated on flasks or plates precoated with collagen I (0.05 mg/mL, rat tail, Life Technologies). Cells were plated at a density of 100,000 cells/chamber in eight-chamber slides (Thermo Scientific) for analysis by confocal microscopy. MH-S cells were passaged every 3–5 days, and cells were plated in eight-chamber slides (Thermo Scientific) at a density of 10,000–20,000 cells/chamber for confocal microscopy. Cells were incubated for at least 24 hours after plating before treatment with Rhodamine 6G/silica and QD/silica. Directly before treatment on cells, Rhodamine 6G/silica and QD/silica solutions were sonicated using a Sonics Vibra-Cell sonicator (Sonic Materials, Inc.) pulsing for 1 second on, 1 second off for approximately 15 seconds to minimize particle agglomeration. Cells were treated with the appropriate dose of particles (generally 100 μg/cm2) and immediately centrifuged at 75×g for 15 minutes to promote contact of particles with cells. Cells were incubated with silica particles for 24 hours before fixing and staining for confocal microscopy. After 24-hour treatment of cells with Rhodamine 6G/silica and QD/silica, the chambers were removed from eight-chamber slides for staining.
Confocal microscopy
All staining was performed at room temperature. Slides were washed twice with phosphate-buffered saline (PBS) and fixed in 4% paraformaldehyde for 45 minutes. Cells were washed again in PBS before permeabilization in a 0.2% Triton X-100 (Sigma-Aldrich) solution in PBS for 15 minutes. Cells were washed in PBS and incubated in a 1% bovine serum albumin (Sigma-Aldrich) blocking solution for 1 hour. Cells were incubated with a 1:150 dilution of Alexa Fluor 647 mouse anti-E-cadherin (BD Biosciences, San Jose, CA, USA) or Alexa Fluor 647 mouse anti-GFAP (brain tissue; Cell Signaling Technology, Danvers, MA, USA) in 1% bovine serum albumin in PBS for 90 minutes. Cells were washed with PBS and stained with a 0.25 μg/mL solution of 4′,6′-diamidino-2-phenylindole (Life Technologies) in 1% bovine serum albumin in PBS for 10 minutes. Cells were washed with PBS before coverslips were mounted, using ProLong Gold Antifade Reagent (Life Technologies). Mounting media was allowed to cure overnight at room temperature before analysis, using a four-laser confocal LSM 700 microscope (Carl Zeiss Microscopy Ltd, Germany).
Results
In vitro studies
The internalization of QD/silica and Rhodamine 6G/silica by the mouse macrophage cell line MH-S was readily observed by confocal fluorescence microscopy. After 24 hours of treatment, both dye/silica and QD/silica were observed in almost all macrophage cells surrounding the nucleus, but not within the nucleus (Figure S5). C2BBe1 cells are an intestinal epithelial cell line originally cloned from the human colon cancer cell line Caco-2. These cells are widely used as an in vitro model for normal intestinal epithelium.After both QD/silica and Rhodamine 6G/silica treatments, silica particles were internalized by cells and are visible in the cytoplasm of cells surrounding the nucleus (Figure S6).
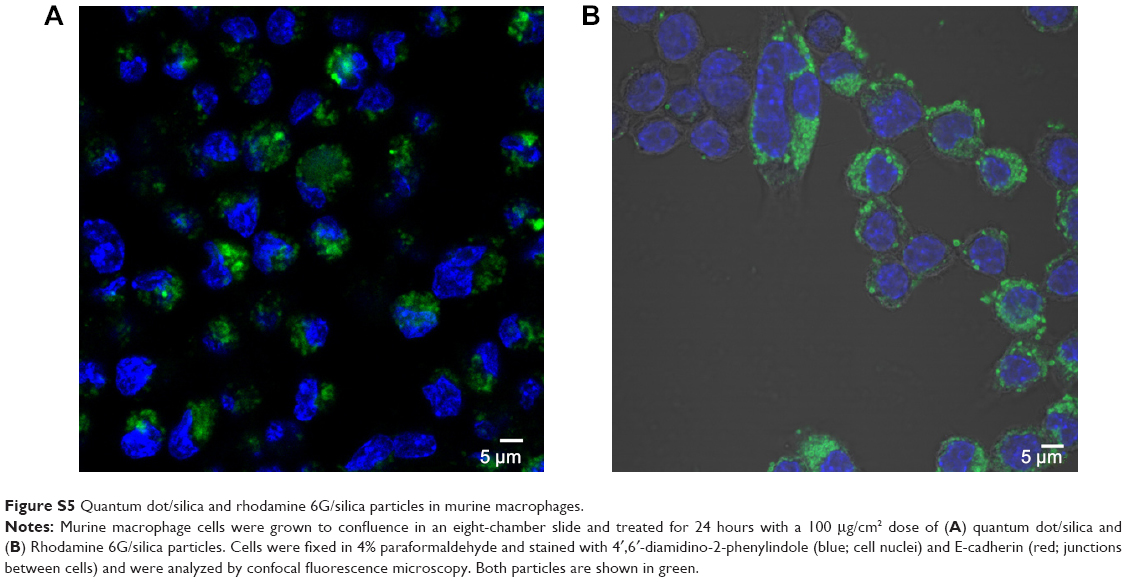 | Figure S5 Quantum dot/silica and Rhodamine 6G/silica particles in murine macrophages. |
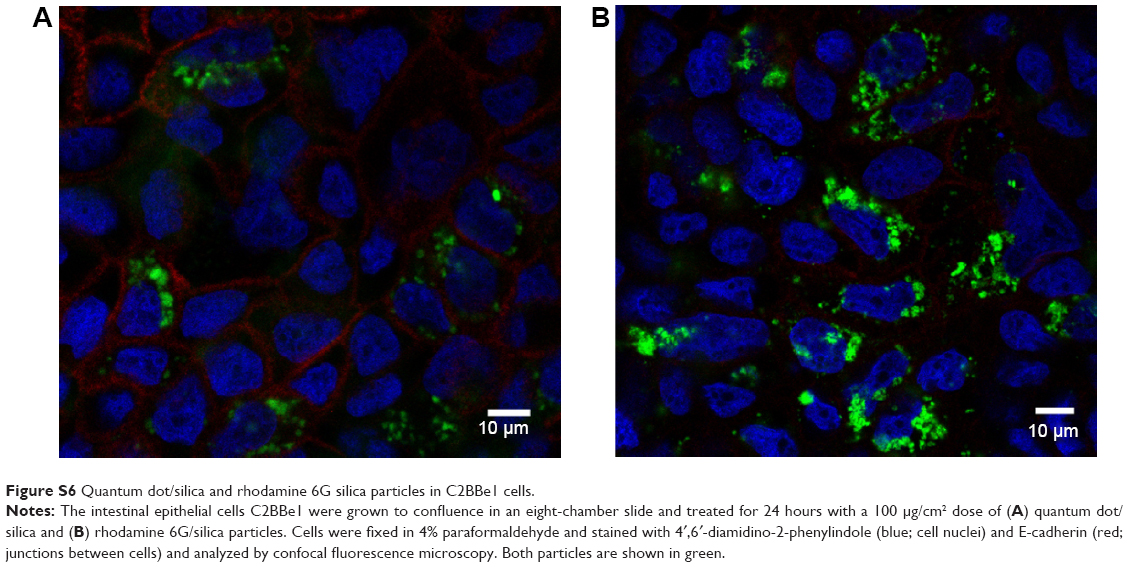 | Figure S6 Quantum dot/silica and Rhodamine 6G silica particles in C2BBe1 cells. |
In vivo studies
Nanoparticles (Rhodamine 6G/silica and Rhodamine 800/silica, 1 mg each) were orally administered to mice. The stomach appears to be full of Rhodamine 6G/silica (Rhodamine 800 could not be imaged with the microscope). These particles appeared to be contained in the stomach contents but were generally not internalized by the cells lining the stomach. Rhodamine 6G/silica was also observed in intestinal sections of a mouse treated daily for 4 days (1 mg) and euthanized 4 hours after the final treatment (Figure S7). The particles were readily visible in cecum (Figure S8) and colon (Figure S9). The dye/silica particles visible in these sections are often near the edge of the lumen of the gastrointestinal tract, indicating that they may be trapped in the mucus layer that protects the epithelial cell lining. It is not surprising to find orally administered particles throughout the gastrointestinal tract as they pass through the digestive system. To determine whether particles traversed the intestinal epithelium and entered the circulation to gain access to other tissues/organs, confocal fluorescence images of sectioned kidney, lung, brain, and spleen were taken, and Rhodamine 6G/silica signal was found in all these tissues.
 | Figure S7 Rhodamine 6G/silica particles in small intestine tissue. |
 | Figure S8 Rhodamine 6G/silica particles in cecum tissue. |
 | Figure S9 Rhodamine 6G/silica particles in colon tissue. |
 © 2015 The Author(s). This work is published and licensed by Dove Medical Press Limited. The full terms of this license are available at https://www.dovepress.com/terms.php and incorporate the Creative Commons Attribution - Non Commercial (unported, v3.0) License.
By accessing the work you hereby accept the Terms. Non-commercial uses of the work are permitted without any further permission from Dove Medical Press Limited, provided the work is properly attributed. For permission for commercial use of this work, please see paragraphs 4.2 and 5 of our Terms.
© 2015 The Author(s). This work is published and licensed by Dove Medical Press Limited. The full terms of this license are available at https://www.dovepress.com/terms.php and incorporate the Creative Commons Attribution - Non Commercial (unported, v3.0) License.
By accessing the work you hereby accept the Terms. Non-commercial uses of the work are permitted without any further permission from Dove Medical Press Limited, provided the work is properly attributed. For permission for commercial use of this work, please see paragraphs 4.2 and 5 of our Terms.