")
Back to Archived Journals » Research and Reports in Endocrine Disorders » Volume 5
Type 2 diabetes mellitus among government employees in Harar, Eastern Ethiopia: a cross-sectional study
Authors Ayana DA , Bachu Y, Teji Roba K , Kebede D
Received 14 February 2015
Accepted for publication 26 April 2015
Published 6 July 2015 Volume 2015:5 Pages 71—77
DOI https://doi.org/10.2147/RRED.S82883
Checked for plagiarism Yes
Review by Single anonymous peer review
Peer reviewer comments 3
Editor who approved publication: Professor Mingzhao Xing
Desalegn Admassu Ayana,1 Yadeta Dessie Bacha,2 Kedir Teji Roba,3 Dawit Ayele Kebede4
1Department of Medical Laboratory Science, 2Department of Public Health, 3School of Nursing and Midwifery, 4Department of Internal Medicine, College of Health and Medical Science, Haramaya University, Harar, Ethiopia
Background: Lifestyle with less physical activity and higher consumption of sugar and fat has transformed obesity to an epidemic, which poses a risk for the development of type 2 diabetes. This study was aimed to assess type 2 diabetes mellitus and its associated factors among government employees in Harar Eastern Ethiopia.
Materials and methods: A cross-sectional study was conducted on 714 employees working in ten government offices from May 2013 to July 2013. The WHO STEPwise approach to chronic disease risk factor surveillance questionnaire was used. An overnight fasting capillary blood was analyzed for blood glucose concentration using a commercially available electronic glucose monitor (SensoCard Plus). Participants with fasting blood sugar level ≥126 mg/dL were checked with a more specific glucose oxidase method using a compact automated clinical chemistry analyzer. Logistic regression was used to examine the factors associated with type 2 diabetes mellitus, and a P-value <0.05 was used to declare statistical significance.
Results: A total of 50 (7%) participants were found to have a fasting blood sugar level of ≥126 mg/dL after an overnight fasting. Of these, 1.5% were known diabetic cases. There was a statistically significant association between hip circumference (crude odds ratio [COR] =2.32; 95% confidence interval [CI] =1.27, 4.22), waist circumference (COR [95% CI] =1.94 [1.05, 3.58]) and type 2 diabetes. Participants who consumed fruits and vegetables for ≥3 days/week were less likely to have type 2 diabetes mellitus (adjusted odds ratio [AOR] =0.49; 95% CI =0.27, 0.91). A ten-point increase of systolic blood pressure increases the likelihood of developing type 2 diabetes mellitus by 6%, AOR (95% CI) =1.057 (1.027, 1.087).
Conclusion: Behavioral change communication on the need for healthy lifestyle, with a special emphasis on fruits and vegetables consumption and regular checkup for blood sugar level is recommended for prevention and early detection of type 2 diabetes mellitus.
Keywords: type 2 diabetes, government employees, fruits and vegetables, systolic blood pressure, waist circumference
Background
Type 2 diabetes mellitus develops due to a complex interaction between genetic predisposition and lifestyle and is characterized by insulin resistance and/or decreased insulin secretion. The actual manifestation of the disease is preceded by a phase of impaired glucose regulation, in which the cardiovascular risk is already increased. Significant lifestyle factors that promote or accelerate the manifestation of type 2 diabetes mellitus are bad nutritional habits, lack of physical activity, and increased obesity.1
Concomitant with the development of human societies that caused significant reductions in mortality related to infectious diseases, the adoption of an inadequate lifestyle with less physical activity and higher consumption of sugar and fat transformed obesity into an epidemic, which poses a risk for the development of type 2 diabetes.2–4
Population growth, aging, and urbanization along with associated lifestyle changes are likely to lead to a 54% increase in the worldwide numbers of patients with diabetes by 2030. A worldwide prevalence, among adults aged 20–79 years, increasing from 285 million in 2010 (6.4%) to 439 million in 2030 (7.7%) has been estimated.1,5 According to the International Diabetes Federation, the estimated prevalence rate of type 2 diabetes in Africa was approximately 2.8%. Countries such as Malawi and Ethiopia had rates approximately 2%, whereas Ghana, Sudan, and South Africa have prevalence rates greater than 3%.6 The prevalence of diabetes mellitus is increasing in developing countries due to population growth, aging, unhealthy diets, obesity, and sedentary lifestyles.7 In sub-Saharan Africa, the estimated number of people with diabetes was 10.8 million in 2006 and this would rise to 18.7 million by 2025, an increase of 80%, as such exceeding the predicted worldwide increase of 54%.6,8,9
Studies in different cities and one peri-urban area in South Africa indicated various prevalence rates ranging from 4% to 8%.8 A study conducted in South Africa among individuals of age >30 reported a prevalence of 8.8%.10 Another study conducted in Zimbabwe also reported a prevalence of 10% among individuals >25 years of age.11
WHO estimates the number of diabetics in Ethiopia to be approximately 800,000 in 2000 and projected that it would increase to approximately 1.8 million by the year 2030.12 Different studies conducted in Ethiopia reported different prevalence rates. A cross-sectional study conducted in the town of Jimma among adults 40 years and above found a prevalence of 5.3%.13 A recent study conducted by Megerssa et al in selected institutions in Bishoftu town reported an overall prevalence of diabetes of 5% (95% confidence interval [CI]: 3–7).14
Dietary factors are important and are potentially modifiable risk factors for diabetes. There has been a focus on the role of carbohydrates and fiber, but the role of fruit and vegetable intake in the incidence of type 2 diabetes is not fully understood. A meta-analysis concluded that there is an overwhelming support for the benefit of lifestyle interventions to prevent type 2 diabetes. Intervention studies have included the promotion of fruits and vegetables in the diet.15 Epidemiological studies suggest that higher intakes of fruits and vegetables and low-fat dairy may be protective.16,17
Different studies found that obesity, expressed by body mass index or by waist circumference or waist-to-hip ratio (WHR), has been consistently an independent risk factor for diabetes in the African region.9,18 A cross-sectional study based on record review of 305 diabetic follow-up patients in Jimma, Ethiopia, reported that 189 (62.0%) and 76 (96.1%) patients with type 2 diabetes mellitus had hypertension.19
Evidence suggests that the increasing burden of chronic diseases has grave consequences because very few people will seek treatment, leading to high morbidity and mortality rates from potentially preventable diseases.20 Raising awareness of risk factors among the population, alongside the development of targeted programs to identify those at a high risk of developing type 2 diabetes would go a long way toward reducing the devastating and costly complications of coronary heart disease, renal disease, blindness, stroke, and foot disease.21,22
Screening identifies people with impaired fasting glucose or impaired glucose tolerance and facilitates providing them with lifestyle advice, support, and information about healthy eating. Identifying potential modifiable risk factors in the development of type 2 diabetes is increasingly important because of the growing global burden of the disease.12 Therefore, this study was aimed to assess type 2 diabetes mellitus and its associated factors among government employees in Harar, Eastern Ethiopia.
Materials and methods
Study setting and design
A cross-sectional study was conducted among government employees working in ten different offices in Harar, Eastern Ethiopia, from May 2013 to July 2013. Government offices were selected randomly, and 787 employees were recruited and distributed proportionally. Attendance sheets of the employees were used to select study participants using systematic random sampling. The employee on the next consecutive number was included in case the selected employee was not found on the day of interview. A questionnaire was distributed a day before the fasting blood sugar measurement in order to complete a detailed survey. An in-person interview was also conducted as necessary for the assessment of dietary intake, physical activity, and measurement of anthropometrics and other factors.
Measurements
Data were collected using the WHO STEPwise approach to chronic disease risk factor surveillance questionnaire (STEPS). The questionnaire was translated to the local language and then translated back to the original language to avoid inconsistency. The fasting blood sugar level and anthropometric measurements were conducted by trained medical laboratory technologists and nurses, respectively. Data on socio-demographic variables and family history were collected. Systolic blood pressure (sBP) and diastolic blood pressure were measured twice and the mean of the two measurements was calculated. Weight, height, and waist and hip circumferences were measured, and the body mass index and the WHR were determined. Body weight was measured with an electronic scale. Waist circumference was measured at a midway between the costal margin and the iliac crest with a tapeline. Hip circumference was measured at its widest part (greater trochanter). Family history of diabetes was considered to be present if any first-degree relative (parents, brother, sister, and child) had diabetes. Participants who already had breakfast were informed to come after an overnight fast next day. Blood sample was collected from an index finger after 10–12 hours overnight fasting, allowing patients to drink only water, and immediately analyzed for blood glucose concentration using a commercially available portable electronic blood glucose monitor (SensoCard Plus; Avecon Healthcare Pvt. Ltd, Kasauli Road, Parwanoo, India). Participants with fasting blood sugar level ≥126 mg/dL were appointed to the specialized university hospital laboratory for a more specific enzymatic test (glucose oxidase method using HumaStar 80 compact automated clinical chemistry analyzer (Wiesbaden, Germany).
The quality of the measuring instruments was validated by weighing or measuring a known weight or length of objects. The measurement was taken constantly by a single reader in order to avoid inter-reader variability. The quality of the laboratory test results was maintained by running the point-of-care tests as per the manufacturers’ instructions and daily quality control was monitored before running each sample for the enzymatic test. The laboratory test measures were accepted or rejected based on the quality control result.
Statistical analysis
The collected data were entered and cleaned with EpiData Software version 3.1 and then transferred to SPSS version 16 for analysis. The logistic regression model was used to study the association of risk factors with diabetes. Variables with P-value <0.1 in bivariate analysis results obtained using sex as important variable were taken for the multivariate analysis; finally, P-value <0.05 was considered statistically significant.
Ethical consideration
The study protocol was approved and ethical clearance was obtained from the College of Health and Medical Sciences Institutional Health Research Ethics Review Committee of Haramaya University. Written informed consent was obtained from the study participants.
Results
Characteristics of study participants
A total of 787 employees were enrolled, and data were collected from 714, resulting in a response rate of 91%. Of the 714 study participants, 472 (66.1%) were males and 242 (33.9%) were females; thus, the sex ratio was 1.9:1. Ethnically, 255 (35.7%) were Oromo, 248 (34.7%) Amhara, 85 (11.9%) Gurage, 37 (5.2%) Harari, 25 (3.5%) Somali, and the remaining 64 (9%) were from Tigray, Southern Nations, and other ethnic groups (Table 1).
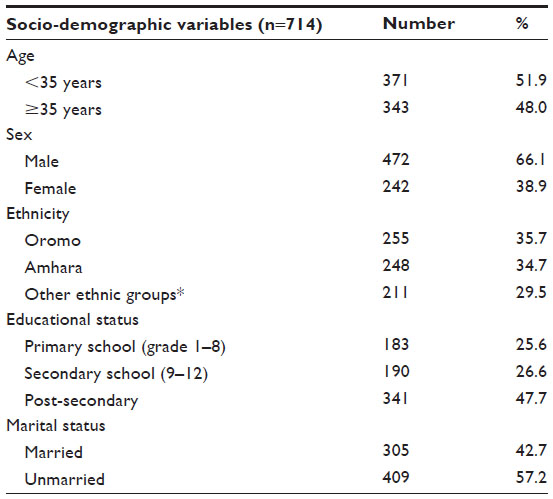 | Table 1 Socio-demographic characteristics of government employees of Harar, 2013 |
Prevalence of type 2 diabetes mellitus
From the total of 714 government employees screened, 57 (8%) had a fasting blood glucose level ≥126 mg/dL. After further checkup using a more specific plasma glucose measurement (glucose oxidase) method, the overall prevalence of type 2 diabetes mellitus (≥126 mg/dL) after an overnight fasting was 50 (7%). From these, 1.5% were known diabetic individuals and 5.5% were individuals with undiagnosed diabetes mellitus.
Factors associated with type 2 diabetes mellitus
In bivariate analysis, the age, hip and waist circumference, frequency of fruit and vegetable consumption, and sBP showed statistically significant association with type 2 diabetes mellitus. This study found a statistically significant association between age ≥35 and diabetes mellitus (COR [95% CI] =2.39 [1.34, 4.26]). The prevalence of diabetes mellitus was less among those who consumed fruits and vegetables on ≥3 days/week (COR [95% CI] =0.51 [0.29, 0.91]). There was a statistically significant association between hip circumference (COR [95% CI] =2.32 [1.27, 4.22]), waist circumference (COR [95% CI] =1.94 [1.05, 3.58]), and a ten-point increase of sBP (COR [95% CI] =1.07 [1.04, 1.09]) and type 2 diabetes mellitus (Table 2).
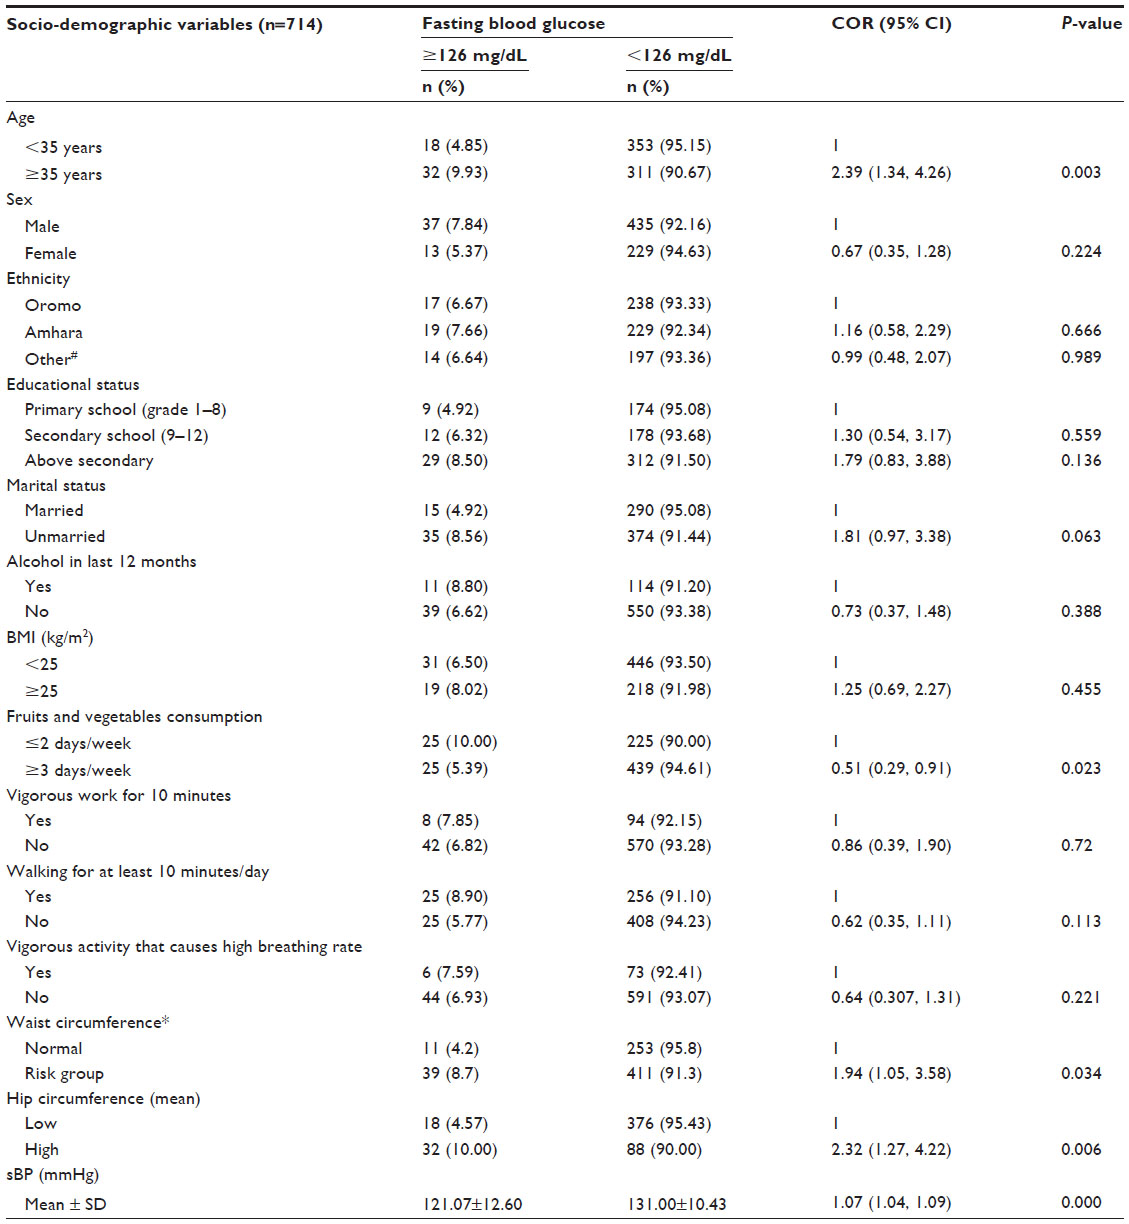 | Table 2 Type 2 diabetes cases by selected variables among government employees of Harar, Eastern Ethiopia, 2013 |
In the final model built, those participants who consumed fruits and vegetables on ≥3 days/week were approximately 50% less likely to be diabetic than those who consumed on <3 days/week, AOR (95% CI) =0.496 (0.271, 0.910). A ten-point increase of sBP increases the likelihood of developing type 2 diabetes mellitus by 6%, AOR (95% CI) =1.057 (1.027, 1.087) (Table 3).
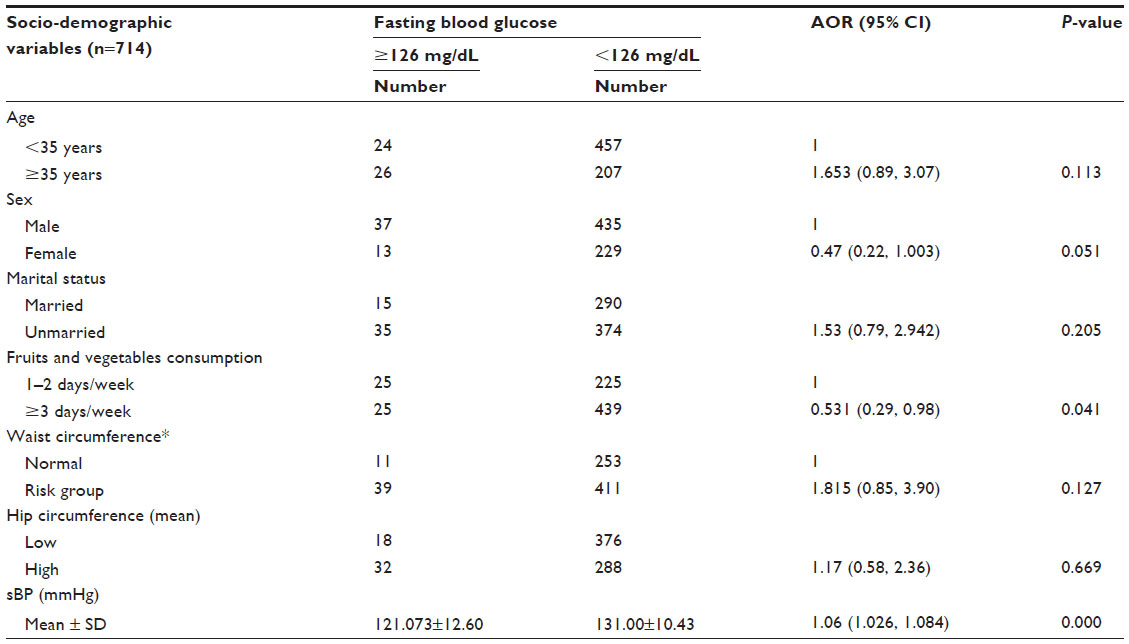 | Table 3 Factors associated with type 2 diabetes among government employees of Harar, Eastern Ethiopia, 2013 |
Discussion
This study identified age, hip and waist circumferences, fruits and vegetables consumption, and sBP as significant factors for diabetes mellitus. The prevalence of type 2 diabetes mellitus among the study participants was 7%. Respondents who consumed fruits and vegetables on approximately ≥3 days/week were less likely to experience diabetes mellitus. A ten-point increase in sBP was associated with an increased likelihood of type 2 diabetes mellitus.
The worldwide prevalence of diabetes among adults aged 20–79 years is also estimated to continuously increase from 6.4% in 2010 to 7.7% in 2030.5 Though there has not been any population-based estimate of the prevalence of type 2 diabetes in Ethiopia, this study found an overall prevalence of 7%. This result was comparable to the cross-sectional study conducted in Jimma and Bishoftu towns in Ethiopia and to other community-based studies in developing countries that reported a prevalence of >5% undiagnosed diabetes mellitus. Different prevalence rates ranging from 4% to 8% were also reported from South African studies undertaken in different cities.8,13,14 The 7% prevalence reported in this study would likely have been higher if oral glucose tolerance test was used in addition to the fasting glucose test.23 This result showed a rapid increase in the prevalence of diabetes mellitus at an alarming rate, which may exceed the 2030 estimation soon.
Epidemiologic studies have examined associations between dietary patterns of patients and the risk of type 2 diabetes. It is suggested that higher intakes of fruits and vegetables, whole grains, fish, and low-fat dairy may be protective for diabetes, and higher intakes of processed grains, added sugars, processed and red meat, and fried foods may increase diabetes risk.16,17 In our study, fruits and vegetables consumption was found to be significantly associated with type 2 diabetes. The prevalence of type 2 diabetes mellitus was less among those who consumed fruits and vegetables ≥3 days/week time (COR [95% CI] =0.51 [0.29, 0.91]). Researchers also reported that the educational status, family origin, and socioeconomic status affect the food purchasing power, food choice, food preparation, and food availability, which in turn affect consumption.24
Studies found a significant association between increased blood pressure and diabetes.17,23 In a similar manner, a ten-point increase of sBP increases the likelihood of diabetes mellitus by 6%, AOR (95% CI) =1.057 (1.027, 1.087). This result was similar with different studies that found obesity as an independent risk factor for diabetes in the African region.9,18 A cross-sectional study in Jimma, Ethiopia, also reported hypertension in a high number of type 2 diabetes mellitus patients.19 This may indicate the importance of screening among hypertensive individuals in Ethiopia.
This study conducted fasting glucose measurement. No additional tests were conducted to differentiate type 1 and type 2 diabetes. Besides, the prevalence of type 2 diabetes would likely have been higher if oral glucose tolerance test had been conducted in addition to the fasting glucose test.
Conclusion
In conclusion, there is a rapid increase in the magnitude of type 2 diabetes in Ethiopia compared to other sub-Saharan African countries. This requires the need for getting regularly screened for blood sugar levels and strengthening behavioral change communication on healthy lifestyles to prevent the occurrence of type 2 diabetes. A large-scale community-based study involving the rural community is recommended to determine the burden of type 2 diabetes mellitus.
Acknowledgments
We thankfully acknowledge Haramaya University for funding the study. We take this opportunity with great pleasure to thank the study participants working in the government offices in Harar and the head of the respective government institutions. Our gratitude also goes to Hiwot Fana Specialized University Hospital laboratory staffs for their whole-hearted cooperation and provision of all the necessary assistance throughout the study.
Author contributions
All authors contributed toward data analysis, drafting and critically revising the paper and agree to be accountable for all aspects of the work.
Disclosure
The authors report no conflicts of interest in this work.
References
Schulze MB, Hu FB. Primary prevention of diabetes: what can be done and how much can be prevented? Annu Rev Public Health. 2005;26:445–467. | |
World Health Organization. Definition, Diagnosis and Classification of Diabetes Mellitus and Its Complications. Report of a WHO Consultation. Geneva: World Health Organization; 1999. | |
Yusuf S, Reddy S, Ôunpuu S, Anand S. Global burden of cardiovascular diseases: part I: general considerations, the epidemiologic transition, risk factors, and impact of urbanization. Circulation. 2001;104:2746–2753. | |
Hossain P, Kawar B, Nahas ME. Obesity and diabetes in the developing world – a growing challenge. N Engl J Med. 2007;356:213–215. | |
Shaw JE, Sicree RA, Zimmet PZ. Global estimates of the prevalence of diabetes for 2010 and 2030. Diabetes Res Clin Pract. 2010;87:4–14. | |
Gill G, Mbanya JC, Ramaiya K, Tesfaye S. A sub-Saharan African perspective of diabetes. Diabetologia. 2009;52(1):8–16. | |
King H, Aubert RE, Herman WH. Global burden of diabetes, 1995–2025: prevalence, numerical estimates, and projections. Diabetes Care. 1998;21:1414–1431. | |
Jamison DT, Feachem RG, Makgoba MW, et al. Disease and Mortality in Sub-Saharan Africa. 2 ed. Washington: The International Bank for Reconstruction and Development/The World Bank; 2006:43–58. | |
Levitt NS. Diabetes in Africa: epidemiology, management and health care challenges. Heart. 2008;94:1376–1382. | |
Alberts M, Urdal P, Steyn K, et al. Prevalence of cardiovascular diseases and associated risk factors in a rural black population of South Africa. Eur J Cardiovasc Prev Rehabil. 2005;12:347–354. | |
WHO Steps 2005. Available from: http://www.who.int/chp/steps/STEPS_Zimbabwe_Data.pdf. Accessed April 30, 2012. | |
WHO. Diabetes Estimates and Projections. Geneva: World Health Organization; 2013. | |
Yemane T, Belachew T, Asaminew B. Type 2 diabetes mellitus in Jimma town, Southwest Ethiopia. Ethiop J Health Sci. 2007;17:2. | |
Megerssa YC, Gebre MW, Birru SK, Goshu AR, Tesfaye DY. Prevalence of undiagnosed diabetes mellitus and its risk factors in selected institutions at Bishoftu Town, East Shoa, Ethiopia. J Diabetes Metab. 2013;S12:008. | |
Carter P, Gray LJ, Troughton J, Khunti K, Davies MJ. Fruit and vegetable intake and incidence of type 2 diabetes mellitus: systematic review and meta-analysis. BMJ. 2010;341:c4229. | |
Nettleton JA, Steffen LM, Ni H, Liu K, Jacobs DR Jr. Dietary patterns and risk of incident type 2 diabetes in the Multi-Ethnic Study of Atherosclerosis (MESA). Diabetes Care. 2008;31:1777–1782. | |
Villegas R, Yang G, Gao YT, et al. Dietary patterns are associated with lower incidence of type 2 diabetes in middle-aged women: the Shanghai Women’s Health Study. Int J Epidemiol. 2010;39:889–899. | |
Aspray TJ, Mugusi F, Rashid S, et al; Essential Non-Communicable Disease Health Intervention Project. Rural and urban differences in diabetes prevalence in Tanzania: the role of obesity, physical inactivity and urban living. Trans R Soc Trop Med Hyg. 2000;94:637–644. | |
Dawit WD, Hamza L, Woldemichael K. Patterns of diabetic complications at Jimma University specialized hospital, southwest Ethiopia. Ethiop J Health Sci. 2010;20:33–39. | |
Duda RB, Kim MP, Darko R, et al. Results of the Women’s Health Study of Accra: assessment of blood pressure in urban women. Int J Cardiol. 2007;117(1):115–122. | |
Department of Health. National Service Framework for Diabetes: Standards (2001). Available from https://www.gov.uk/government/uploads/system/uploads/attachment_data/file/198836/National_Service_Framework_for_Diabetes.pdf. Accessed April 30, 2012. | |
Department of Health. National Service Framework for Diabetes: Delivery Strategy (2002). Available from: http://www.yearofcare.co.uk/sites/default/files/images/national%20service%20-%20delivery%20strategy.pdf. Accessed April 30, 2012. | |
Bur A, Herkner H, Woisetschläger C, Vlcek M, Derhaschnig U, Hirschl MM. Is fasting blood glucose a reliable parameter for screening for diabetes in hypertension? Am J Hypertens. 2003;16(4):297–301. | |
Wang Y, Bentley ME, Zhai F, Popkin BM. Tracking dietary intake patterns of Chinese from childhood to adolescence over a six-year follow-up period. J Nutr. 2002;132(93):430–438. | |
Walter RJ, Sandra CNG, Elenir RJCP, et al. Diabetes mellitus and impaired glucose tolerance in urban adult population. Rev Assoc Med Bras. 2014;60(2):118–124. |
 © 2015 The Author(s). This work is published and licensed by Dove Medical Press Limited. The full terms of this license are available at https://www.dovepress.com/terms.php and incorporate the Creative Commons Attribution - Non Commercial (unported, v3.0) License.
By accessing the work you hereby accept the Terms. Non-commercial uses of the work are permitted without any further permission from Dove Medical Press Limited, provided the work is properly attributed. For permission for commercial use of this work, please see paragraphs 4.2 and 5 of our Terms.
© 2015 The Author(s). This work is published and licensed by Dove Medical Press Limited. The full terms of this license are available at https://www.dovepress.com/terms.php and incorporate the Creative Commons Attribution - Non Commercial (unported, v3.0) License.
By accessing the work you hereby accept the Terms. Non-commercial uses of the work are permitted without any further permission from Dove Medical Press Limited, provided the work is properly attributed. For permission for commercial use of this work, please see paragraphs 4.2 and 5 of our Terms.