")
Back to Journals » International Journal of Nanomedicine » Volume 9 » Issue 1
The sustained-release behavior and in vitro and in vivo transfection of pEGFP-loaded core-shell-structured chitosan-based composite particles
Authors Wang Y, Lin F, Zhao Y, Wang M, Ge X, Gong Z, Bao D, Gu Y
Received 22 November 2013
Accepted for publication 3 April 2014
Published 23 October 2014 Volume 2014:9(1) Pages 4965—4978
DOI https://doi.org/10.2147/IJN.S58104
Checked for plagiarism Yes
Review by Single anonymous peer review
Peer reviewer comments 3
Yun Wang,1 Fu-xing Lin,2 Yu Zhao,1 Mo-zhen Wang,2 Xue-wu Ge,2 Zheng-xing Gong,1 Dan-dan Bao,1 Yu-fang Gu1
1Department of Plastic Surgery, First Affiliated Hospital of Anhui Medical University, 2CAS Key Laboratory of Soft Matter Chemistry, Department of Polymer Science and Engineering, University of Science and Technology of China, Hefei, Anhui, People’s Republic of China
Abstract: Novel submicron core-shell-structured chitosan-based composite particles encapsulated with enhanced green fluorescent protein plasmids (pEGFP) were prepared by complex coacervation method. The core was pEGFP-loaded thiolated N-alkylated chitosan (TACS) and the shell was pH- and temperature-responsive hydroxybutyl chitosan (HBC). pEGFP-loaded TACS-HBC composite particles were spherical, and had a mean diameter of approximately 120 nm, as measured by transmission electron microscopy and particle size analyzer. pEGFP showed sustained release in vitro for >15 days. Furthermore, in vitro transfection in human embryonic kidney 293T and human cervix epithelial cells, and in vivo transfection in mice skeletal muscle of loaded pEGFP, were investigated. Results showed that the expression of loaded pEGFP, both in vitro and in vivo, was slow but could be sustained over a long period. pEGFP expression in mice skeletal muscle was sustained for >60 days. This work indicates that these submicron core-shell-structured chitosan-based composite particles could potentially be used as a gene vector for in vivo controlled gene transfection.
Keywords: gene therapy, gene transfection, hydroxybutyl chitosan, thiolated N-alkylated chitosan, pEGFP, complex coacervation
Introduction
Gene therapy is a promising technology for medical treatment because it aims at treating or eliminating the causes of disease, whereas most current drugs treat symptoms.1–6 The success of gene therapy largely depends on the development of the gene delivery vector. An ideal gene delivery vector should satisfy certain conditions: 1) the capacity of combining with deoxyribonucleic acid (DNA) and protecting DNA from nuclease digestion; 2) good biocompatibility and biosafety; 3) high transfection efficiency; and 4) good biodegradability.7 Currently, viral vectors are widely used due to their high transfection efficiency.8 However, many problems exist in common biological viral vectors, such as immunogenicity, gene mutation, potential pathogenesis, and other problems9,10 For example, viral vectors were reported to be somewhat successful in the treatment of children suffering from the fatal form of X-linked severe combined immunodeficiency disease ([SCID]-X1 syndrome) in 2000.1 The immune systems of these children were rendered functional by stem cell gene therapy using a retrovirus vector. Unfortunately, five of these patients subsequently developed a leukemia-type disease owing to insertional mutagenesis.11 Such major side effects seriously hamper the clinical application of viral vectors. Therefore, researchers have for many years been devoted to looking for new vectors to replace viral vectors and to thereby avoid side effects, and to consequently advance the development of gene therapy.12,13
Chitosan (CS) is a cationic polysaccharide widely found in nature, and is well-known for its low toxicity, good biocompatibility, and good biodegradability.14–17 Therefore, it has been widely used in controlled drug delivery.18–21 Recent research indicates that CS can also be used as a gene carrier because, similar to other cationic carriers, it can form a complex with genes through its strong electrostatic interactions, which package and protect the carried gene from digestion by deoxyribonuclease I (DNase I).22,23 However, the question remains whether this strong electrostatic interaction also hinders the gene from dissociation, and further limits transfection efficiency of the complex.24 It had been reported that electrostatic interactions could be weakened by introducing long hydrophobic alkyl chains onto the CS chain, which favors endocytosis and gene dissociation, and thus effectively improves transfection efficiency.25–27 In addition, thiolated polymers are alternative potential gene vectors, because thiol groups can transform into stable disulfide bonds in the extracellular environment and return to thiol groups in the intracellular environment.28 For example, Schmitz et al prepared new-type sulfhydryl CS nanoparticles to load genes.29,30 The results showed that the transfection efficiency of the sulfhydryl CS nanoparticles was higher than that of raw CS. Yu et al also introduced thiol for CS alkylation to improve its water solubility and transfection efficiency.31
Hydroxybutyl CS (HBC), synthesized by conjugating hydroxybutyl groups to CS hydroxyl and amino groups, has unique temperature sensitivity in addition to good biocompatibility.32 At physiological temperature (37°C), HBC can rapidly transform from a liquid into a gel. This means that HBC can form gel in situ when it is injected into the body, which in turn can control the release of the loaded active species in HBC, and can improve active species’ bioavailability. In certain conditions, genes are expected to be released slowly and thereby achieve long-term expression, eg, the expression of tumor-suppressor genes in the cancer model, or the expression of bone morphogenetic protein (BMP) genes in the bone defect model.33 Therefore, in the present study, we designed and prepared a novel core-shell-structured, CS-based gene vector, which has a gene-loaded thiolated N-alkylated CS (TACS) core and a pH- and temperature-responsive HBC shell to control the release of genes in the body. We used enhanced green fluorescent protein plasmids (pEGFP) as the model gene, because pEGFP expression can be conveniently observed by laser as a green fluorescence. The sustained-release behavior of pEGFP was investigated in vitro, and a series of transfection experiments in vitro and in vivo, were also conducted to evaluate the performance of pEGFP-loaded core-shell-structured TACS-HBC composite particles, prepared in-house, as a safe and effective gene vector.
Materials and methods
Reagents and materials
CS (MW =2.0×10⁵; 91% deacetylation) was purchased from Aladdin Chemistry Co., Ltd., Shanghai, People’s Republic of China. Thioglycolic acid was provided by Alfa Aesar, Heysham, UK and used as received; 99% 1-(3-dimethylaminopropyl)-3-ethylcarbodiimide hydrochloride (EDC.HCl) was supplied by Shanghai Yuanye Biotechnology Co., Ltd., Shanghai, People’s Republic of China. DNA Marker 2000 (DNA standard sample containing 100~2000 bp) was supplied by Shanghai Mengry Bio-Technology Co., Ltd. (Shanghai, People’s Republic of China). Agarose and ethidium bromide were obtained from Sigma-Aldrich Co., St Louis, MO, USA. Other reagents and solvents were of analytical grade. Human embryonic kidney (HEK) 293T cells and human cervix epithelial (Hela) cells were provided by the Laboratory of Immunology, Anhui Medical University, Hefei, People’s Republic of China.
Preparation of pEGFP
pEGFP-3.0, referred to simply as pEGFP elsewhere in this manuscript, provided by the Laboratory of Immunology, Anhui Medical University, People’s Republic of China, was transformed in Escherichia coli and amplified in lysogeny broth media (Oxoid Ltd, Basingstoke, United Kingdom) at 37°C overnight. The plasmid was purified using an EndoFree plasmid purification system (Plasmid Maxi Kit (10); Qiagen NV, Hilden, Germany). The concentration of pEGFP was 350 ng/μL, as measured by a NanoDrop 2000 Micro ultraviolet (UV) spectrophotometer (Thermo Electron Corporation, Marietta, OH, USA) set to a ratio between the readings at 260 nm and 280 nm (OD260/OD280) of 2.0. Prepared pEGFP was stored at −20°C before being used.
Preparation of pEGFP-loaded core-shell-structured CS composite particles
Before any experiments were conducted, all materials and instruments used were sterilized by autoclaving.
Preparation of pEGFP-loaded TACS core particles
TACS was synthesized by conjugating thiol and dodecyl groups to the hydroxyl and amino groups of CS, respectively. The detailed preparation process is presented in the Supplementary materials section. pEGFP was loaded into a TACS solution (with a 26.5% degree of alkylation and a 7.1% degree of thiolation) by complex coacervation. Briefly, an aqueous solution of 0.2 mg/mL TACS was prepared by dissolving TACS particles in a 5 mM acetic acid solution. The pH of the solution was adjusted to 5.5 with sodium hydroxide. A specific amount of pEGFP was dissolved in an aqueous solution of 50 mM sodium sulfate. The concentration of pEGFP was controlled at 76 μg/mL. Then, pre-prepared TACS and pEGFP solutions (total volume, 100 μL) were vortex mixed for 30 seconds. The N-P ratio (the molar ratio of CS amine groups to pEGFP phosphate groups) in the mixture was 10. Particles produced were collected by centrifugation at 15,000 rpm for 5 minutes. The concentration of pEGFP in the supernatant was detected by using the NanoDrop 2000 Micro UV spectrophotometer (Thermo Electron Corporation). The percentage of pEGFP loading was calculated by the following equation:
|
|
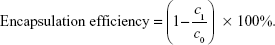
In this equation, c0 is the original concentration of pEGFP in the solution before being loaded in TACS particles; and c1 is the concentration of pEGFP after being loaded in TACS particles.
Preparation of pEGFP-loaded core-shell-structured CS-based composite particles
First, HBC was dissolved in a solution of sodium acetate at a slightly acidic pH of 5.5~6. The detailed HBC preparation process is described in the Supplementary materials section; the degree of substitution was 1.22. The HBC solution was subsequently added into the aqueous solution containing pre-prepared pEGFP-loaded TACS core particles. The mixture was shaken for 30 minutes at 25°C on a thermostatic shaker. When the pH of the mixture was adjusted to neutral, eg, pH 7.4, HBC aggregated and precipitated from the solution onto the surface of the pEGFP-loaded TACS core particles; this reaction was driven by the mutual attraction between TACS and HBC, based on their possession of identical CS structural units, and as described in the Supplementary materials section. Finally, reaction products were passed through a 0.22 μm filter to separate the products.
Characterization of pEGFP-loaded CS-based composite particles
Size and size distribution of pEGFP-loaded CS-based particles
Particle size and size distribution in solution were analyzed by light scattering method, using a Nano Particle Analyzer (NanoSight LM10; Malvern Instruments, Malvern, UK).
Nuclease protection assay
The stability of pEGFP loaded in 1) TACS core particles; and 2) TACS-HBC composite particles, both in the presence of DNase I, was evaluated. Naked pEGFP, pEGFP-loaded TACS core particles, and TACS-HBC composite particles were incubated with DNase I (130 U/mL; 650 U/μg DNA) separately at 37°C for 30 minutes. All samples contained the same mass of pEGFP, ie, 2 μg. A solution without DNase I was used as the control. Gel electrophoresis was subsequently conducted by using 1% agarose gel bound with 0.5 μg/mL ethidium bromide at room temperature and 180 V in 1× tris-acetate-EDTA (ethylenediaminetetraacetic acid) buffer (Sangon Biotech [Shanghai] Co., Ltd., Shanghai, People's Republic of China). To check the integrity of treated pEGFP, the digestion of pEGFP in TACS core particles by DNase I solution was stopped by adding 2 μL of 0.5 M EDTA, and the resultant solution was incubated for another 10 minutes. Gel electrophoresis was performed after 10 μg of releasing agent heparin was added.
Cell toxicity assay
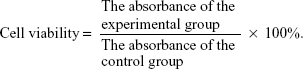
Toxicity of prepared pEGFP-loaded CS-based particles to cells in vitro was evaluated by MTT (3-[4,5-dimethylthiazol-2-yl]-2,5 diphenyltetrazolium bromide) assay. HEK 293T cells and Hela cells were seeded in 96-well plates at a density of 5,000 cells/well, and allowed to grow overnight. The cells were incubated then for 48 hours in separate 200 μL samples of complete Dulbecco’s Modified Eagle’s Medium (DMEM) containing either naked pEGFP, pre-prepared pEGFP-loaded TACS core particles, TACS-HBC composite particles, or pEGFP-loaded Lipofectamine® 2000 transfection reagent (Lip2000) (Thermo Fisher Scientific, Waltham, MA, USA); 200 μL of fresh, complete medium was used as a control. Cells were incubated for another 4 hours after 20 μL of 5 mg/mL MTT solution was added to each well. The medium in each well was then replaced with 150 μL of dimethyl sulfoxide. The plates were shaken for 10 minutes to ensure formazan crystals dissolved completely. Absorbance spectra were read at a wavelength of 490 nm in a microplate reader (BioTek Instruments, Inc., Winooski, VT, USA). Cell viability is characterized by the following equation:
|
|
In vitro sustained-release behavior of pEGFP-loaded TACS-HBC composite particles
In vitro release of pEGFP from TACS-HBC composite particles was determined by the dialysis method; 175 μg pEGFP-loaded TACS-HBC composite particles dispersed in tris-EDTA (TE) solution (Qiagen NV, Hilden, Germany) were placed in Spectra/Por® cellulose ester dialysis tubing (300,000 MWCO) (Spectrum® Laboratories, Inc., Rancho Dominguez, CA, USA). The tubing was placed in a flask filled with 50 mL TE buffer solution. The flask was shaken at 37°C; 100 μL of the TE solution (with a pEGFP concentration of 3.7 ng/μL) was sampled at 24 and 48 hours, and 3, 5, 7, and 15 days, and an equivalent volume of fresh TE solution was added to the flask after each sampling. The amount of pEGFP released was determined by UV-visible absorption method, as measured with the NanoDrop 2000 Micro UV spectrophotometer. The release rate was characterized as
| (3) |
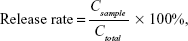
where Csample is the concentration of pEGFP in the sample; and Ctotal is the theoretical concentration of pEGFP, provided that all pEGFP-loaded in particles have been released into the TE buffer solution.
In vitro transfection of pEGFP-loaded CS-based particles
Cell culture
A HEK 293T cell line was cultured in high glucose DMEM (HyClone™; Thermo Fisher Scientific) supplemented with heat-inactivated 10% fetal bovine serum (FBS; Thermo Fisher Scientific, Waltham, MA, USA) and 1% penicillin-streptomycin (Harbin Pharmaceutical Group Holding Co., Ltd., Helongjiang, People’s Republic of China).
Transfection
In vitro transfection of pEGFP-loaded TACS core particles and pEGFP-loaded TACS-HBC composite particles in HEK 293T cells seeded in 24-well plates at a density of 3×10⁴ cells/well was investigated. The seeded cells were maintained overnight at 37°C in a humidified 5% CO2 incubator (Dan Ding Shanghai International Trade Co., Ltd., Shanghai, People's Republic of China). The following day, the medium was removed from the wells, and each well was washed with 0.5 mL serum-free DMEM; 100 μL of serum-free DMEM containing naked pEGFP or pEGFP-loaded particles (pEGFP mass =4 μg) was then added to each well. pEGFP-Lip2000 complexes were adopted as the positive control. Another 100 μL of fresh serum-free DMEM was set as the untreated control sample. Four hours after the addition of the serum-free DMEM, the media in all wells were replaced with fresh DMEM mixed with 10% FBS. pEGFP expression was qualitatively evaluated by fluorescence microscope (Olympus, Tokyo, Japan), and quantitatively measured by flow cytometer (BD FACSVerse; BD, Franklin Lakes, NJ, USA) after 72 hours’ incubation.
In vivo transfection of pEGFP-loaded CS-based particles
Forty-two male KM mice (weighing 20–30 g each) at 4~5 weeks of age were randomly divided into three groups for in vivo transfection of pEGFP-loaded TACS and TACS-HBC composite particles. Group A was transfected with pEGFP-loaded TACS core particles. Group B was transfected with pEGFP-loaded TACS-HBC composite particles, and Group C, the control group, was transfected with saline. The mice were first anaesthetized by intraperitoneal injection with 3% chloral hydrate according to a standard of 0.01 mL/g/mouse to make the skeletal muscles loosen and to prevent pEGFP from being extruded by muscle contractions. Both hind legs of each mouse were sterilized with alcohol after the hair was shaved, and 50 μL of 25 g/L hypertonic sucrose (China Otsuka Pharmaceutical Co., Ltd., Tianjing, People’s Republic of China) was injected into the quadriceps muscle. Fifteen minutes post-injection, the solutions containing pEGFP-loaded particles (20 μg pEGFP) were injected into the quadriceps slowly. The needle remained in the muscle 5~10 seconds, and was then removed slowly to prevent injected solutions from exuding. pEGFP expression was detected by laser scanning confocal microscopy (Leica Microsystems, Wetzlar, Germany) after quadriceps muscle sections were cut and frozen.
Results and discussion
Morphological characterization of pEGFP-loaded TACS-HBC composite particles
The synthesis route of pEGFP-loaded TACS-HBC composite particles is illustrated in Figure 1. First, positively charged CS or TACS forms a complex with negatively charged pEGFP through strong electrostatic interactions. Figure 2A shows size distribution and morphology of complexes consisting of TACS and pEGFP, which were formed through complex coacervation. The particles are spherical and have a uniform size distribution with a mean diameter of 90 nm, as detailed in the Supplementary materials section.
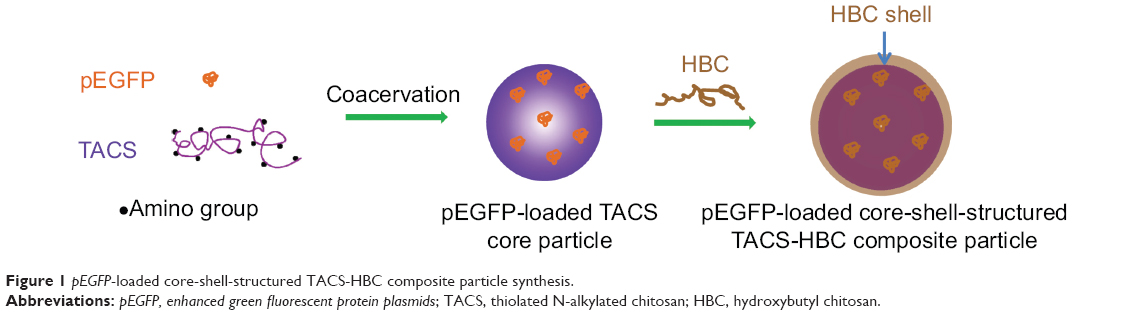 | Figure 1 pEGFP-loaded core-shell-structured TACS-HBC composite particle synthesis. |
 | Figure 2 Particle sizes and size distributions. |
After HBC solution was added to the pEGFP-loaded TACS complex, 74.2% of particles presented with a mean diameter of 120 nm, as indicated in Figure 2B. The calculation of particle ratios is shown in the Supplementary materials section. The large particle diameter was a result of the fact that most HBC precipitates on the surface of pEGFP-loaded TACS particles to form a shell around the particles, which causes an increase in particle size. In other words, core-shell-structured pEGFP-loaded TACS-HBC composite particles are mainly produced after the addition of HBC. It should be noted that a few smaller particles (8.0%) with a mean diameter of 64 nm also appeared. These smaller particles were probably aggregates of pure HBC, because HBC readily self-aggregates in solution to form particles with a mean diameter of 64 nm (Figure 2C). Only 17.8% of pEGFP-loaded TACS particles remained unencapsulated with HBC. Gel retardation assays of the prepared particles before and after they were digested by DNase I, shown in Figure 3, indicate that nearly all pEGFP combined with TACS because no pEGFP can be detected in line c, which represents pEGFP-loaded TACS core particles. In Figure 3, line b indicates that most pEGFP was protected in TACS-HBC composite particles.
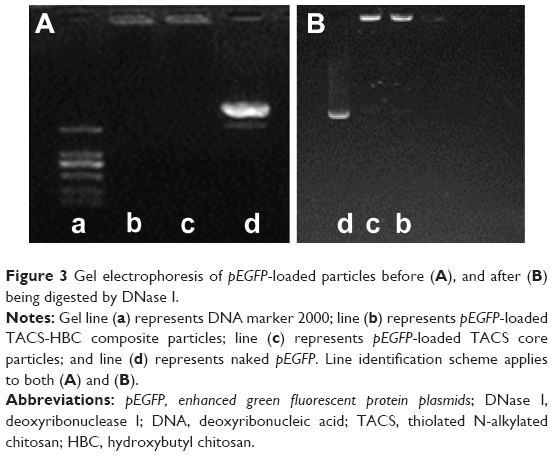 | Figure 3 Gel electrophoresis of pEGFP-loaded particles before (A), and after (B) being digested by DNase I. |
Cell toxicity assay
The toxicity of the pre-prepared CS-based particles was quantitatively estimated through investigating cell viability by MTT assay. Such assay depends on the detection of purple-colored formazan crystals,34 which were formed by the reduction of MTT by succinate dehydrogenase in living cells. These purple crystals may be dissolved in a variety of organic solvents, and the optical density of the resulting solution we obtained was measured on a multi-well spectrophotometer. The results are shown in Figure 4, from which it can be seen that the influence of both pEGFP-loaded TACS core particles and pEGFP-loaded TACS-HBC composite particles on the viability of HEK 293T and Hela cells is insignificant. After 48 hours exposure, cell viability of both HEK 293T and Hela cells in the wells containing pEGFP-loaded TACS core particles and TACS-HBC composite particles was over 95%. In contrast, cell viability in pEGFP-loaded Lipo2000 was only 60.98%±2.95% for HEK 293T cells, and 38.34%±4.61% for Hela cells. These figures imply that both TACS and HBC will provide good biosafety as gene vectors.
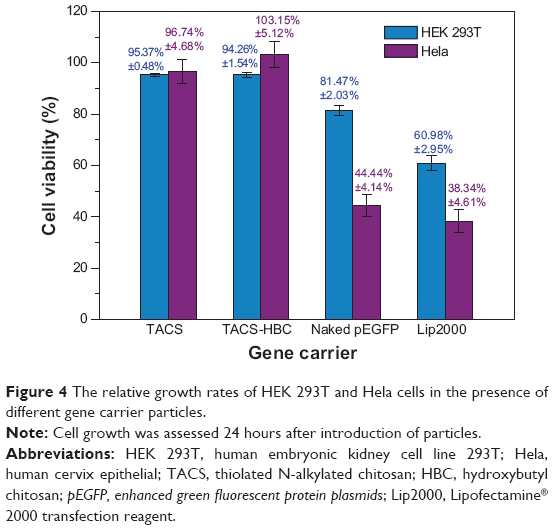 | Figure 4 The relative growth rates of HEK 293T and Hela cells in the presence of different gene carrier particles. |
In vitro sustained release and transfection of pEGFP loaded in CS-based particles
pEGFP release from pre-prepared CS-based particles in a dialysis tube put on the shaking bed at 37°C is illustrated in Figure 5. pEGFP release from both TACS core particles and TACS-HBC composite particles is evidently controlled. At the first 24 hours after loading, pEGFP release rate from TACS core particles was 51.4%. Release rate increased gradually, reached an 88.6% maximum after 5 days, and then leveled off. In contrast, the release rate from core-shell-structured TACS-HBC composite particles was much lower than that in TACS core particles. It was only 25.7% at the first 24 hours after loading, and 42.9% at 15 days. These results support the assumption that HBC shells can be used to protect loaded pEGFP from dissociation to a certain degree.
 | Figure 5 In vitro release behavior of pEGFP loaded in TACS core and TACS-HBC composite particles in TE solution (A), and gel electrophoresis of pEGFP-loaded particles after 30 days’ release at 37°C (B). |
After being stored at 37°C for 30 days, stability and integrity of pEGFP were investigated by gel electrophoresis (Figure 5). pEGFP released by heparin from TACS core particles treated at 37°C for 30 days appears at the same location on the gel band as naked pEGFP (Figure 5). This result implies that pEGFP is stable after forming a complex with TACS.
Since release of the pEGFP gene from CS-based particles was sustained, in vitro transfection of pEGFP loaded in those particles was investigated subsequently by fluorescence microscopy. If transfection is successful, bright green fluorescence induced by EGFP should be observed. Transfection results in HEK 293T cells, using the three particle types, are illustrated in Figure 6; pEGFP expressions in 1) Lipo2000 complex, and 2) TACS core particles were more rapid than in 3) core-shell-structured TACS-HBC composite particles. However, the intensity of the green fluorescence increased gradually with time, which means that pEGFP expression in TACS-HBC composite particles is time-dependent. After 72 hours, green fluorescence could be seen in all three groups. Figure 6 also shows the percentage of cells in each group containing fluorescent protein, ie, the transfection efficiency of pEGFP-loaded particles. The transfection efficiency of pEGFP-loaded Lip2000 complex, naked pEGFP-loaded TACS core particles, and TACS-HBC composite particles was 60.32%, 38.99%, and 8.00%, respectively. These results are in accord with results obtained from fluorescence microscopy. The sustained expression of pEGFP in TACS-HBC composite particles can be ascribed to the existence of HBC shells, which limit the rapid release of loaded pEGFP after particles enter cells (Figure 7). At first, the release rate of pEGFP was very slow from particles encapsulated in an HBC shell. In living cells, pEGFP release will increase slowly as the HBC shell becomes progressively thinner due to degradation by enzymes. After the HBC shell degrades totally, pEGFP release also become progressively faster, because degradation of TACS cores starts so that the maximum pEGFP release rate will be achieved at this time. Based on the above results and analysis, it can be concluded that prepared core-shell-structured TACS-HBC composite particles can be used as gene carriers in cases requiring controlled transfection of a loaded gene.
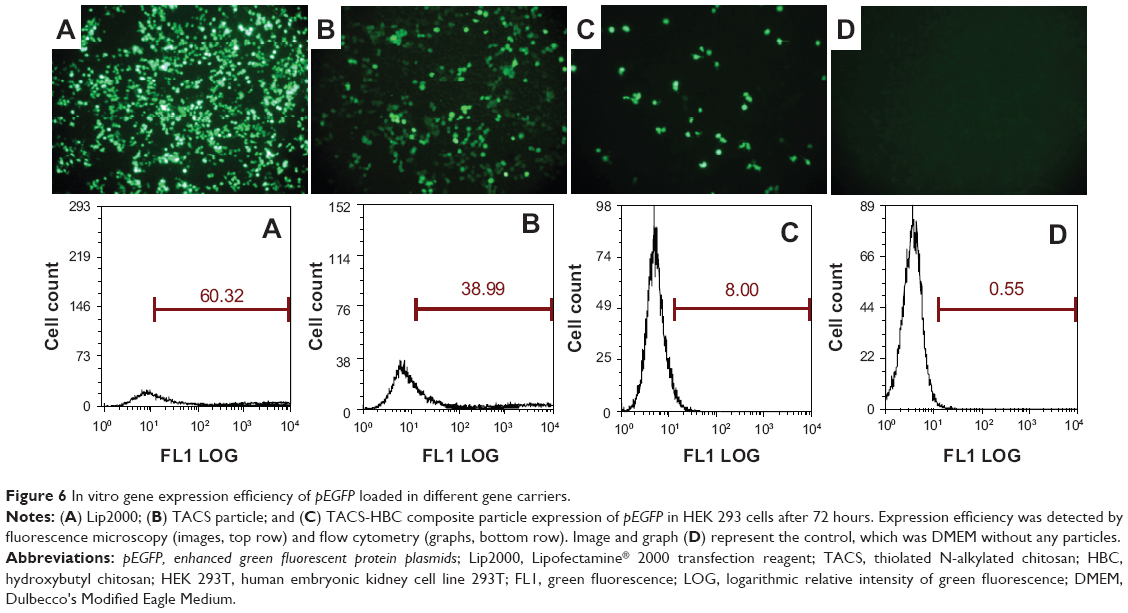 | Figure 6 In vitro gene expression efficiency of pEGFP loaded in different gene carriers. |
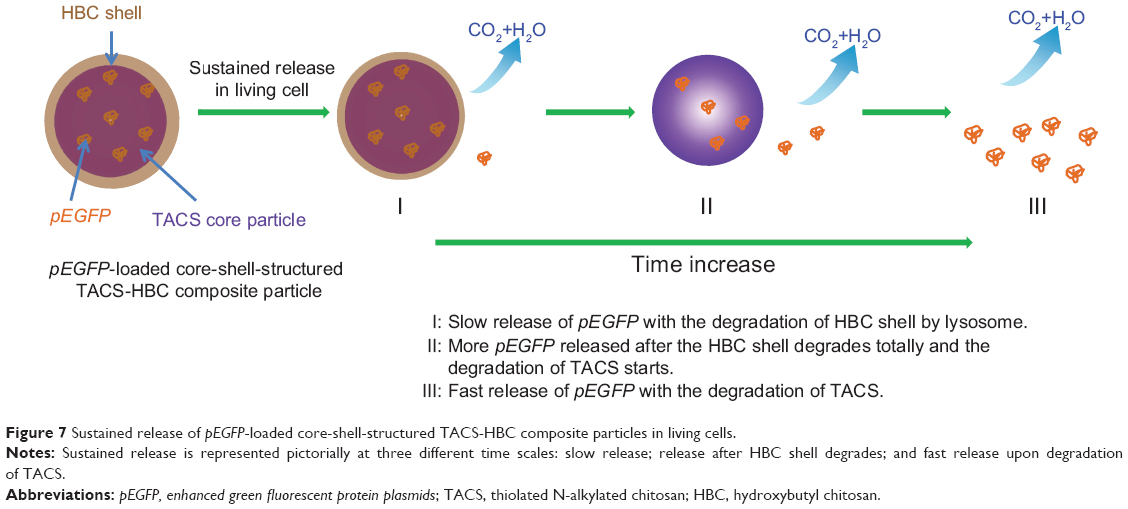 | Figure 7 Sustained release of pEGFP-loaded core-shell-structured TACS-HBC composite particles in living cells. |
In vivo sustained transfection of pEGFP loaded in CS-based particles
pEGFP-loaded TACS core particles and TACS-HBC composite particles, as well as a saline control, were injected into mice skeletal (quadriceps) muscle. Skeletal muscle was sampled at specific time points (10, 30, and 60 days), cut into frozen sections, and observed with a fluorescence microscope. Transfection results from these muscle sections are shown in Figure 8. In the pEGFP-loaded TACS core particle group (Group A), there was a small amount of green fluorescence at 10 days; fluorescence intensity reached its highest point at 30 days, and gradually weakened between 45–60 days. However, in the pEGFP-loaded TACS-HBC composite particle group (Group B), there was little green fluorescence at 10 days, but fluorescence intensity gradually increased between 30–60 days. At 45 days, fluorescence intensity in Group B exceeded that in Group A. In the saline control group (Group C), there was no green fluorescence at any time.
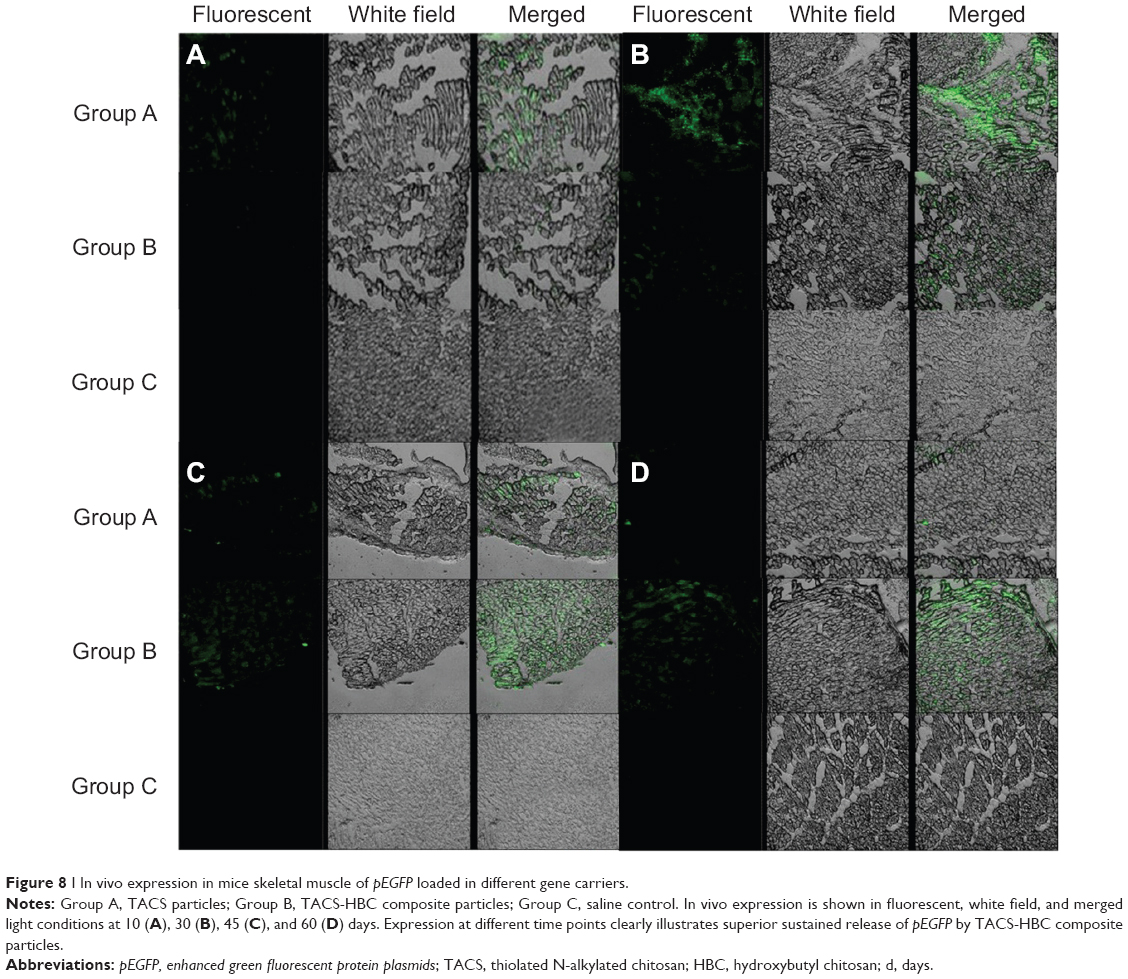 | Figure 8 I In vivo expression in mice skeletal muscle of pEGFP loaded in different gene carriers. |
Conclusion
In this work, we prepared a novel nanosized core-shell-structured CS-based composite particle as a gene carrier. pEGFP could then be efficiently combined with a TACS core, which was enwrapped by an HBC shell. pEGFP-loaded TACS-HBC composite particles are relatively stable and nontoxic. In vitro, they exhibited sustained release and transfection of loaded pEGFP. In vivo expression of loaded pEGFP was also sustained for up to 60 days. The design and production of pEGFP-loaded TACS-HBC composite particles as a gene carrier in this study has theoretical and practical significance for gene therapy with sustained transfection effect. Further applications for core-shell-structured TACS-HBC composite particles loading BMP genes are currently being researched.
Acknowledgments
This study was supported by the National Natural Science Foundation of China (Number 81171829), and the Provincial Natural Science Foundation of Anhui (Number KJ2011ZD04). We also express our sincere thanks to Professor Yue’e Fang from the Department of Polymer Science and Engineering of the University of Science and Technology of China (USTC) for her generous and valuable instructions on the preparation of CS-based composite particles.
Disclosure
The authors report no conflicts of interest in this work.
References
Cavazzana-Calvo M, Hacein-Bey S, de Saint Basile G, et al. Gene therapy of human severe combined immunodeficiency (SCID)-X1 disease. Science. 2000;288(5466):669–672. | ||
Flotte TR, Carter BJ. Adeno-associated virus vectors for gene therapy. Gene Ther. 1995;2(6):357–362. | ||
Gao X, Huang L. Cationic liposome-mediated gene transfer. Gene Ther. 1995;2(10):710–722. | ||
Herweijer H, Wolff JA. Progress and prospects: naked DNA gene transfer and therapy. Gene Ther. 2003;10(6):453–458. | ||
Zhang XX, Prata CA, McIntosh TJ, Barthélémy P, Grinstaff MW. The effect of charge-reversal amphiphile spacer composition on DNA and SiRNA delivery. Bioconjug Chem. 2010;21(5):988–993. | ||
Stein S, Ott MG, Schultze-Strasser S, et al. Genomic instability and myelodysplasia with monosomy 7 consequent to EVI1 activation after gene therapy for chronic granulomatous disease. Nat Med. 2010;16(2):198–204. | ||
Hosseinkhani H, He WJ, Chiang CH, et al. Biodegradable nanoparticles for gene therapy technology. J Nanopart Res. 2013;15(1794):1–15. | ||
Itaka K, Kataoka K. Recent development of nonviral gene delivery systems with virus-like structures and mechanisms. Eur J Pharm Biopharm. 2009;71(3):475–483. | ||
Atkinson H, Chalmers R. Delivering the goods: viral and non-viral gene therapy systems and the inherent limits on cargo DNA and internal sequences. Genetica. 2010;138(5):485–498. | ||
Jooss K, Chirmule N. Immunity to adenovirus and adeno-associated viral vectors: implications for gene therapy. Gene Ther. 2003;10(11):955–963. | ||
Fischer A, Hacein-Bey-Abina S, Lagresle C, Carrigue A, Cavazana-Calvo M. Gene therapy of severe combined immunodeficiency disease: proof of principle of efficiency and safety issues. Gene therapy, primary immunodeficiencies, retrovirus, lentivirus, genome. Bull Acad Natl Med. 2005;189(5):779–785. | ||
Buschmann MD, Merzouki A, Lavertu M, Thibault M, Jean M, Darras V. Chitosans for delivery of nucleic acids. Adv Drug Deliv Rev. 2013; 65(9):1234–1270. | ||
Xu ZP, Walker TL, Liu KL, Cooper HM, Lu GQ, Bartlett PF. Layered double hydroxide nanoparticles as cellular delivery vectors of supercoiled plasmid DNA. Int J Nanomedicine. 2007;2(2):163–174. | ||
Gooday GW. Physiology of microbial degradation of chitin and chitosan. In Ratledge C, editor. Biochemistry of Microbial Degradation.Heidelberg: Springer; 1994:279–312. | ||
Jayakumar R, Chennazhi KP, Muzzarelli RAA, Tamura H, Nair SV, Selvamurugan N. Chitosan conjugated DNA nanoparticles in gene therapy. Carbohydr Polym. 2010;79(1):1–8. | ||
Roy K, Mao HQ, Huang SK, Leong KW. Oral gene delivery with chitosan–DNA nanoparticles generates immunologic protection in a murine model of peanut allergy. Nat Med. 1999;5(4):387–391. | ||
Yang PT, Hoang L, Jia WW, Skarsgard ED. In utero gene delivery using chitosan-DNA nanoparticles in mice. J Surg Res. 2011;171(2): 691–699. | ||
Bhattarai N, Gunn J, Zhang M. Chitosan-based hydrogels for controlled, localized drug delivery. Adv Drug Deliv Rev. 2010;62(1):83–99. | ||
Peer D, Karp JM, Hong S, Farokhzad OC, Margalit R, Langer R. Nanocarriers as an emerging platform for cancer therapy. Nat Nanotechnol. 2007;2(12):751–760. | ||
Shu XZ, Zhu KJ. Controlled drug release properties of ionically cross-linked chitosan beads: the influence of anion structure. Int J Pharm. 2002;233(1–2):217–225. | ||
Wang JJ, Zeng ZW, Xiao RZ, et al. Recent advances of chitosan nanoparticles as drug carriers. Int J Nanomedicine. 2011;6:765–774. | ||
Dobrovolskaia MA, McNeil SE. Immunological properties of engineered nanomaterials. Nat Nanotechnol. 2007;2(8):469–478. | ||
You JO, Liu YC, Peng CA. Efficient gene transfection using chitosan–alginate core-shell nanoparticles. Int J Nanomedicine. 2006;1(2):173–180. | ||
Kawamura K, Oishi J, Kang JH, et al. Intracellular signal-responsive gene carrier for cell-specific gene expression. Biomacromolecules. 2005;6(2):908–913. | ||
Bravo-Osuna I, Vauthier C, Farabollini A, Palmieri GF, Ponchel G. Mucoadhesion mechanism of chitosan and thiolated chitosan-poly (isobutyl cyanoacrylate) core-shell nanoparticles. Biomaterials. 2007;28(13):2233–2243. | ||
Liu WG, Zhang X, Sun SJ, et al. N-alkylated chitosan as a potential nonviral vector for gene transfection. Bioconjug Chem. 2003;14(4): 782–789. | ||
Ramos VM, Rodríguez NM, Rodríguez MS, Heras A, Agulló E. Modified chitosan carrying phosphonic and alkyl groups. Carbohydr Polym. 2003;51(4):425–429. | ||
Martinovich GG, Cherenkevich SN, Sauer H. Intracellular redox state: towards quantitative description. Eur Biophys J. 2005;34(7):937–942. | ||
Loretz B, Thaler M, Bernkop-Schnürch A. Role of sulfhydryl groups in transfection? A case study with chitosan-NAC nanoparticles. Bioconjug Chem. 2007;18(4):1028–1035. | ||
Schmitz T, Bravo-Osuna I, Vauthier C, Ponchel G, Loretz B, Bernkop-Schnürch A. Development and in vitro evaluation of a thiomer-based nanoparticulate gene delivery system. Biomaterials. 2007;28(3): 524–531. | ||
Yu WY, Zhao Y, Xing YL, et al. A preliminary study on the evaluation of a novel gene delivery vector-TACS in vitro and in vivo via co-expressing hVEGF and hBMP genes to repair critical-size rabbit bone defects. Afr J Pharm Pharmaco. 2012;6(5):343–351. | ||
Dang JM, Sun DD, Shin-Ya Y, Sieber AN, Kostuik JP, Leong KW. Temperature-responsive hydroxybutyl chitosan for the culture of mesenchymal stem cells and intervertebral disk cells. Biomaterials. 2006;27(3):406–418. | ||
Atkinson PJ, Wise AK, Flynn BO, Nayagam BA, Richardson RT. Viability of long-term gene therapy in the cochlea. Scientific Reports. 2014;4:4733. | ||
Marshall NJ, Goodwin CJ, Holt SJ. A critical assessment of the use of microculture tetrazolium assays to measure cell growth and function. Growth Regul. 1995;5(2):69–84. |
Supplementary materials
Preparation of thiolated N-alkylated chitosan
Thiolated N-alkylated chitosan (TACS) was prepared in two steps as described in Figure S1. First, chitosan (CS) was N-alkylation modified with 1-bromododecane (Aladdin Chemical Co., Ltd., Shanghai, People’s Republic of China); TACS was then further modified with thioglycolic acid.
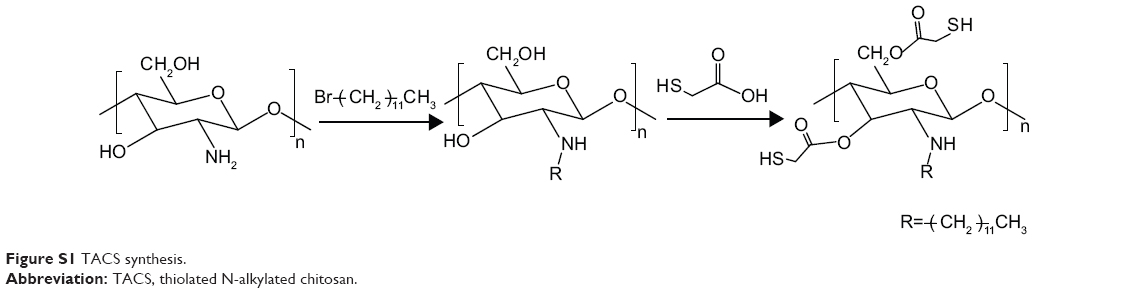 | Figure S1 TACS synthesis. |
N-alkylated modification of CS
CS (1 g) was dispersed in 15 mL isopropanol (Sinopharm Chemical Reagent Co., Ltd., Shanghai, People’s Republic of China), followed by the addition of 2.5 g NaOH. The subsequent reaction proceeded at 70°C for 30 minutes, with continuous stirring; 3 ml 1-bromododecane was then added and left to react with CS for 10 hours. The mixture was subsequently poured through filter paper. The product remaining on the filter paper was collected and washed by ethanol until the filtrate was neutral, followed by washing thoroughly with acetone, ether, and water, in that order. TACS obtained from this process was dried at 60°C for 5 hours.
Thiolated modification of TACS
First, 0.25 g of pre-prepared TACS was dissolved in 2 ml of 1 M hydrochloric acid (HCl). The resulting solution was diluted with distilled water to obtain a 1% solution of CS hydrochloride. Next, 0.24 g 1-(3-dimethylaminopropyl)-3-ethylcarbodiimide hydrochloride (EDC.HCl) was added to activate the carboxylic acid moieties of the subsequently added 0.5 g thioglycolic acid. The solution was stored in the dark for 3 days after the pH was adjusted to 4.5 using 1 M NaOH. The reaction mixture was dialyzed in the dark sequentially in three solutions, ie 5 mM HCl solution for 12 hours, 5 mM HCl solution containing 1% NaCl for 12 hours twice, and the 1 mM HCl solution for 24 hours. Finally, the product was lyophilized, and TACS was obtained.
Preparation of hydroxybutyl CS
Hydroxybutyl CS (HBC) was prepared as shown in Figure S2; 4 g of CS was first alkalinized with 40 ml of 50% w/v NaOH under the protection of N2 for 24 hours. Subsequently, the solution was filtrated through filter paper to remove excess NaOH. Pre-prepared CS was then dispersed in 80 ml of a 9:1 mix of isopropanol and water, under vigorous stirring for 8 hours. The resultant solution was left for 4 days after 80 ml of 1,2-epoxybutane was added. Excess 1,2-epoxybutane was removed by means of bubbling N2. Afterward, the solution was vacuum filtrated to remove the unreacted species. Filter residue was washed with acetone until the pH of the filtrate achieved neutral (pH =7). Finally, the product was dried in a vacuum oven at 50°C.
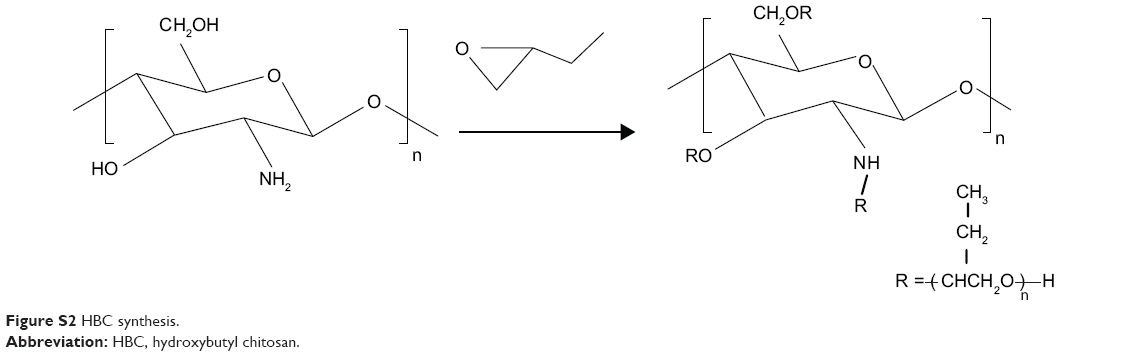 | Figure S2 HBC synthesis. |
To investigate pH and temperature responsiveness of HBC, HBC in aqueous solution was observed at different pH values and temperatures. Briefly, HBC was first dissolved in an acetic acid solution (pH =5.5) at a concentration of 2 mg/ml at room temperature. The solution was then divided into two portions, hereafter named groups one and two. The pH of three separate batches within group one was adjusted to 6.0, 6.5, and 7.0 by adding an appropriate amount of 1% NaOH. For group two, one of the solutions was heated to 37°C and reserved for 2 hours. The other was kept at room temperature (25°C). Digital photos were taken to record changes in solution appearance, as shown in Figure S3. It is clear from these photos that HBC transformed into a gel when the pH was adjusted to 7, or the temperature was increased to 37°C.
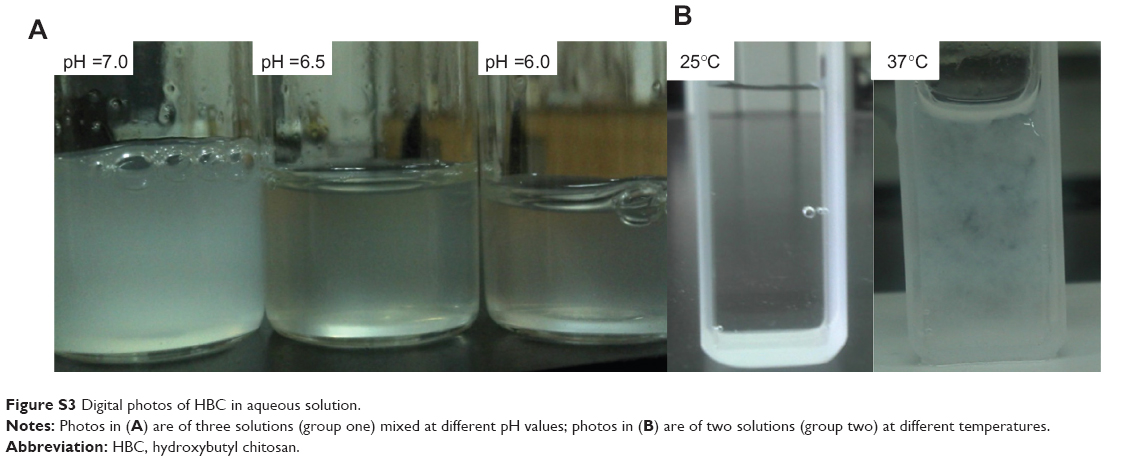 | Figure S3 Digital photos of HBC in aqueous solution. |
Size distribution analysis of TACS-HBC composite particles
Figure S4 shows particle size distribution after HBC was added into the solution containing pEGFP (enhanced green fluorescent protein plasmids)-loaded TACS core particles, as measured by the Nano Particle Analyzer (NanoSight LM10; NanoSight Ltd., UK Malvern Instruments, Malvern, UK), after HBC was added to pEGFP (enhanced green fluorescent protein plasmids)-loaded TACS core particles. To investigate the size distribution of HBC-wrapped pEGFP-loaded TACS core particles the NanoSight LM10 was also used for nanoparticle tracking analysis. Three peaks can be seen in Figure S4. The mean particle diameters corresponding to peaks one, two, and three are 64 nm, 95 nm, and 120 nm, respectively.
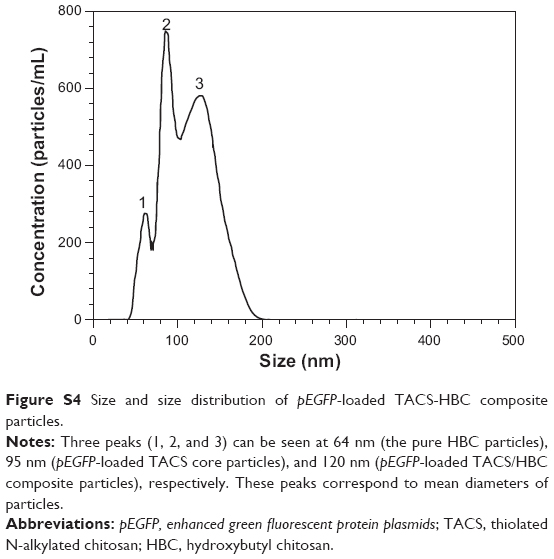 | Figure S4 Size and size distribution of pEGFP-loaded TACS-HBC composite particles. |
To determine the particle ratios, particle size distribution in Figure S4 was successfully analyzed by peak-fit processing using Origin software (OriginLab, Northampton, MA, USA). Each peak was regarded as a Gaussian distribution. The areas under each peak could be calculated easily; results are shown in Figure S5, in which particle ratios from Figure S4 equate to the ratio of the areas under the peaks.
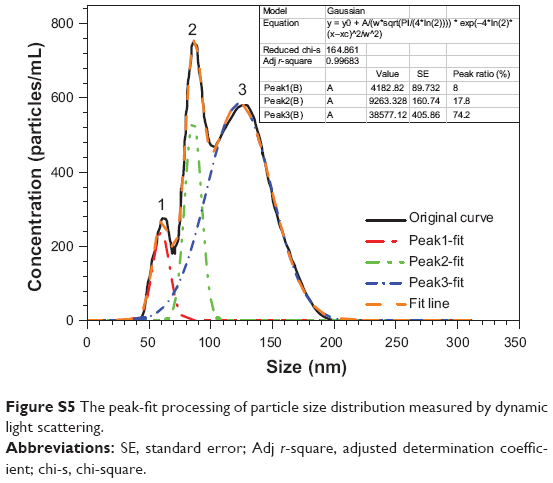 | Figure S5 The peak-fit processing of particle size distribution measured by dynamic light scattering. |
Transmission electron microscopy observation of pEGFP-loaded CS-based composite particles
Morphologies of pEGFP-loaded TACS core particles and TACS-HBC composite particles were observed using transmission electron microscopy (100 kV; Hitachi-7650, Hitachi Ltd., Tokyo, Japan). Samples were prepared by dispensing one drop of each particle type suspended in aqueous solution on copper grids, followed by air-drying. Results are shown in Figure S6. pEGFP-loaded TACS core particles (Figure S6A) have an average diameter of 80 nm, while pEGFP-loaded TACS-HBC composite particles (Figure S6B) average ~130 nm.
 | Figure S6 TEM images of pEGFP-loaded particles. |
In vitro transfection of cells by pEGFP loaded in CS-based particles
In vitro transfection behavior of pEGFP loaded in CS-based particles in human cervix epithelial (Hela) cells was investigated for comparison with transfection of human embryonic kidney (HEK) 293T cells.
Cell culture
A Hela cell line was cultured in a high-glucose solution of Dulbecco’s Modified Eagle’s Medium (DMEM; HyClone™, Thermo Fisher Scientific, Waltham, MA, USA) supplemented with heat-inactivated 10% fetal bovine serum (FBS; Thermo Fisher Scientific, Waltham, MA, USA) and 1% penicillin-streptomycin (Harbin Pharmaceutical Group Holding Co., Ltd., Helongjiang, People’s Republic of China).
Results
Transfection efficiency of pEGFP-loaded Lip2000 complex, pEGFP-loaded TACS core particles, and TACS-HBC composite particles in Hela cells was 15.82%, 14.64%, and 5.53%, respectively, as shown in Figure S7. Evidently, transfection efficiency of pEGFP in Hela cells is much worse than in HEK 293T cells on average, even when pEGFP is loaded in Lip2000. However, the transfection behavior of all three gene carriers in both Hela and HEK 293T cells is very similar.
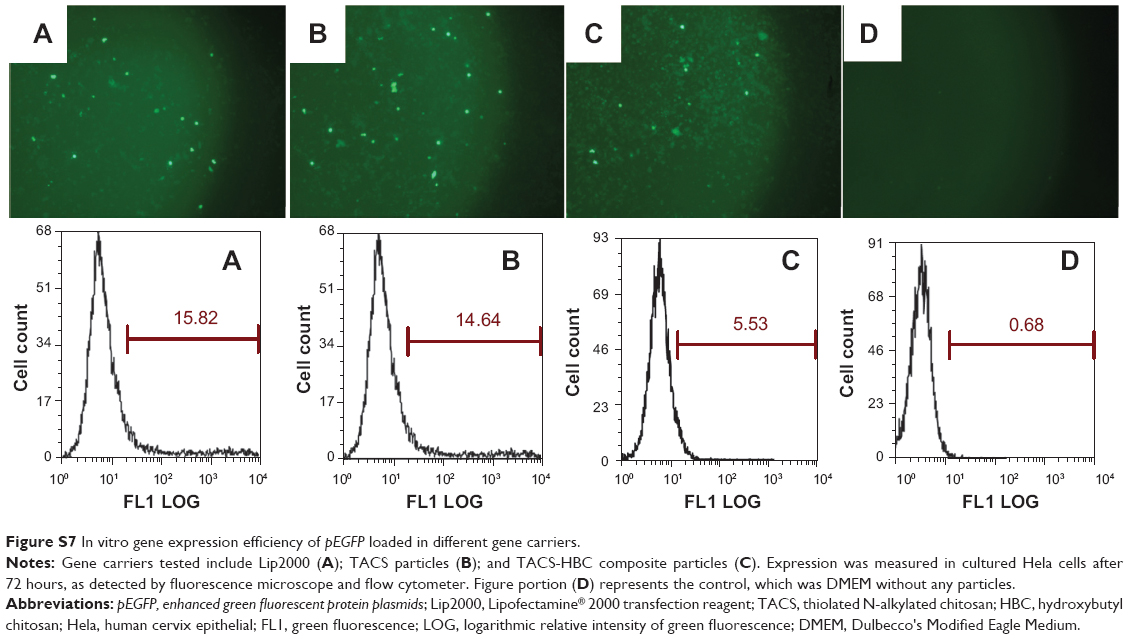 | Figure S7 In vitro gene expression efficiency of pEGFP loaded in different gene carriers. |
Reverse transcription polymerase chain reaction analysis
Transfection efficiency of pEGFP-loaded TACS core, and pEGFP-loaded HBC-TACS composite particles prepared under various N-P ratios (2.5:1, 5:1, 10:1, and 20:1), and Lip2000, was also tested in HEK 293T cells seeded in 24-well plates at a density of 3×10⁴ cells/well. pEGFP expression was confirmed by semiquantitative reverse transcription polymerase chain reaction (RTPCR) analysis after 3 days transfection. Total cell ribonucleic acid (RNA) was harvested after 7 days with a Takara RNA PCR kit (Takara Bio Inc., Otsu, Japan). TAQ polymerase and primer (5′-GTGGGCTTCCTGGTGA-3′ and 5′-CTTTGGAGCCAGCTGGA-3′, respectively) were used in an RTPCR amplification reaction in which RTPCR products were visualized on a 1% w/v agarose gel (Sigma-Aldrich Co., St Louis, MO, USA) by staining with ethidium bromide (Sigma-Aldrich Co.). Relative levels of messenger RNA expression were estimated by the brightness of each gel line (Figure S8).
 | Figure S8 Transfection efficiency analysis by gel electrophoresis. |
It can be seen in Figure S8 that the brightest gel bands correspond Lip2000 (gel band C, far right), and TACS core particles prepared at an N-P ratio of 10:1 (gel band B10, second from right), which indicates that pEGFP-loaded TACS core particles with a NP ratio of 10:1 have a superior transfection efficiency that is comparable with Lip2000. The presence of the HBC shell delays the release rate of pEGFP-loaded TACS core particles, which results in lower brightness.
 © 2014 The Author(s). This work is published and licensed by Dove Medical Press Limited. The full terms of this license are available at https://www.dovepress.com/terms.php and incorporate the Creative Commons Attribution - Non Commercial (unported, v3.0) License.
By accessing the work you hereby accept the Terms. Non-commercial uses of the work are permitted without any further permission from Dove Medical Press Limited, provided the work is properly attributed. For permission for commercial use of this work, please see paragraphs 4.2 and 5 of our Terms.
© 2014 The Author(s). This work is published and licensed by Dove Medical Press Limited. The full terms of this license are available at https://www.dovepress.com/terms.php and incorporate the Creative Commons Attribution - Non Commercial (unported, v3.0) License.
By accessing the work you hereby accept the Terms. Non-commercial uses of the work are permitted without any further permission from Dove Medical Press Limited, provided the work is properly attributed. For permission for commercial use of this work, please see paragraphs 4.2 and 5 of our Terms.