")
Back to Journals » OncoTargets and Therapy » Volume 8
The influence of TLR4 agonist lipopolysaccharides on hepatocellular carcinoma cells and the feasibility of its application in treating liver cancer
Authors Gu J, Sun R, Shen S, Yu Z
Received 13 April 2015
Accepted for publication 12 June 2015
Published 21 August 2015 Volume 2015:8 Pages 2215—2225
DOI https://doi.org/10.2147/OTT.S86536
Checked for plagiarism Yes
Review by Single anonymous peer review
Peer reviewer comments 5
Editor who approved publication: Professor Daniele Santini
This paper has been retracted
Junsheng Gu, Ranran Sun, Shen Shen, Zujiang Yu
Department of Infectious Diseases, The First Affiliated Hospital, Zhengzhou University, Zhengzhou, Henan, People’s Republic of China
Objective: This study was designed to explore the influence of Toll-like receptor 4 (TLR4) agonist lipopolysaccharides (LPS) on liver cancer cell and the feasibility to perform liver cancer adjuvant therapy.
Methods: Human liver cancer cell lines HepG2, H7402, and PLC/PRF/5 were taken as models, and the expression of TLRs mRNA was detected by real time-polymerase chain reaction method semiquantitatively. WST-1 method was used to detect the influence of LPS on the proliferation ability of liver cancer cells; propidium iodide (PI) single staining and Annexin V/PI double staining were used to test the influence of LPS on the cell cycle and apoptosis, respectively, on human liver cancer cell line H7402. Fluorescent quantitative polymerase chain reaction and Western blot method were used to determine the change of expression of Cyclin D1.
Results: The results demonstrated that most TLRs were expressed in liver cancer cells; stimulating TLR4 by LPS could upregulate TLR4 mRNA and the protein level, activate NF-κB signaling pathway downstream of TLR4, and mediate the generation of inflammatory factors IL-6, IL-8, and TNF-α; LPS was found to be able to strengthen the proliferation ability of liver cancer cells, especially H7402 cells; the expression of Cyclin D1 rose and H7402 cells were promoted to transit from G1 stage to S stage under the stimulation of LPS, but cell apoptosis was not affected. It was also found that LPS was able to activate signal transducer and activator of transcription -3 (STAT3) signaling pathway in H7402 cells and meanwhile significantly increase the initiation activity of STAT3; proliferation promoting effect of LPS to liver cancer cells remarkably lowered once STAT3 was blocked or inhibited.
Conclusion: Thus, TLR4 agonist LPS is proved to be able to induce liver cancer cells to express inflammation factors and mediate liver cancer cell proliferation and generation of multidrug resistance by activating the cyclooxygenase-2/prostaglandin signal axis as well as the STAT3 pathway.
Keywords: water soluble tetrazolium-1, propidium iodide single staining, Annexin V/PI double staining, cell proliferation, signaling pathway, LPS
Introduction
Liver cancer has the second highest mortality rate in the People’s Republic of China and is the third leading cause of death in the world, and its incidence and mortality rate both rank first in the world.1 For now, the treatments of liver cancer are dominated by operation, radiotherapy, chemotherapy, and neutralization therapy. However, as liver cancer is difficult to detect and an effective early diagnosis method is lacking, most cancers are not found until the advanced stage or until distant metastasis occurs. What is worse, even operative excision can hardly restrain the relapse. As no effective drug or method is available, the curative effect of liver cancer is unsatisfying.2
Huajun et al3 proposed that Toll-like receptors (TLRs) were a kind of pattern recognition receptor, which is highly conserved during the evolutionary process. Plenty of researches have verified that TLRs are expressed in many kinds of cells, mainly immune cells such as dendritic cells, T-cells, and neutrophils.3 However, Hong et al4 suggested that TLRs are also expressed in cancer cells, especially TLR4, and the TLR4 activation of cancer cells can promote cell proliferation and cell apoptosis resistance. For now, TLR4 leads to many kinds of organic damage besides liver cancer, such as liver diseases, lung diseases, inflammatory bowel disease; infectious diseases such as septicemia; and the formation and diffusion of cancer. Thus, Lihua et al5 suggested that, with the discovery of LR4-MD2-LPS (MD2: accessory protein of TLR4) compound crystal structure, the searching for the drugs that could resist the combination of lipid A and TLR4 had become one of the research hotpots of the TLR4 antagonist development. At present, the most developed one is artificial lipid A analog eritoran (e5564). Eritoran can disturb the interaction between TLR4 and MD-2, restrain the activation of TLR4, and remit the symptoms of a mouse model of myocardial infarction. The research of eritoran has entered the preclinical experiment stage of ischemia/reperfusion treatment and the third stage clinical experiment of septicemia treatment.5
This study was designed to investigate the expression level of TLR4 in liver cancer cells, the biological function variation that the activation of TLR4 brings to cancer cells, its influence on chemotherapeutics, and its adjuvant function on liver cancer.
Materials and methods
Main experimental materials
Cell lines
Human liver cancer cell lines: HepG2, H7402, and PLC/PRF/5 (preserved by our laboratory). The study has been approved by the ethics committee of Zhengzhou University and all participants have signed informed consent.
Reagents
Dulbecco’s Modified Eagle’s Medium (DMEM), Roswell Park Memorial Institute 1640 (RPMI-1640 medium; GIBCO Co., Ltd, Shanghai, People’s Republic of China); fetal calf serum (Fumeng Biotechnical Co., Ltd, Shanghai, People’s Republic of China); pancreatin (Sagon Inc., Shanghai, People’s Republic of China); TLR4 agonist lipopolysaccharide (LPS; 0111:B4), TLR3 agonist Poly (I:C) (Sigma Inc., St Louis, MO, USA); TLR9 agonist cytosine phosphate guanosine oligodinucleotide (CpG ODN) M362 (InvivoGen Co., Ltd, Shanghai, People’s Republic of China); total protein extraction kit (Bestbio Co., Ltd, Shanghai, People’s Republic of China); human p-NF-κB antibody, human NF-κB antibody, human STAT3 antibody, human p-STAT3 antibody (Cell Signaling Technology, Inc., Beverly, MA, USA); propidium iodide (PI; Solarbio, Beijing, People’s Republic of China); RNA enzyme (Sagon Inc.); Annexin V/PI apoptosis detection (Bestbio Co., Ltd).
Main experimental instruments
Main experimental instruments included a cell culture incubator maintaining constant temperature (SANYO Inc., Okayama, Japan), a Centrifuge 58108 (Eppendorf Inc., Hamburg, Germany), an LX-200 mini centrifuge (Haimen Kylin-Bell Lab Instruments Co., Ltd., Jiangsu, People’s Republic of China), a TC automatic cell counter (Bio-Rad Inc., Hercules, CA, USA), an electrophoresis apparatus (Beijing Liuyi Biotechnology Co., Ltd, Beijing, People’s Republic of China) and electrophoresis tank (Bio-Rad Inc.), a gel-imaging analyzer (Alpha Inc., USA), a semiquantitative gradient polymerase chain reaction (PCR) system, MyiQ RT-PCR system (Bio-Rad Inc.), a NanoDrop 2000 trace oxygen meter (BioTek Inc., Winooski, VT, USA), a synergy 2 multifunctional microplate reader (BioTek Inc.), and an inverted fluorescence microscope (Olympus Inc., Tokyo, Japan).
Main experimental methods
Cell cultivation
A culture flask loaded with healthy cells was shaken up to suspend cell debris. After the cells were washed with 1× phosphate buffer solution (PBS) once, a proper quantity of trypsin-containing ethylenediaminetetraacetic acid (EDTA) was added to digest the cells for 1 minute, and then 3–5 mL DMEM complete medium was added. The cell suspension liquid was transferred into a 50 mL sterile centrifuge tube and centrifuged at 900 rpm for 5 minutes. The supernatant was discarded and 3–5 mL fresh medium was added to suspend the cells; then the suspension liquid was transferred into a new culture flask and proper quantity of medium was added until the volume reached 10 mL. The culture flask was put into a 37°C incubator containing 5% CO2 for culture.
RT-PCR method
Real time-PCR was carried out in 200 μL eppendorf (EP) tubes without bacteria and enzyme. Approximately 2 μg cell total RNA, 1 μL Oligo duplicated T, 1 μL diethyl-nitrophenyl thiophosphate, and diethylpyrocarbonate liquid were placed into PCR system for reaction at 65°C for 5 minutes. Once the reaction ended, the liquid was taken out and put on ice. Then 4 μL 5× first strand buffer and 2 μL DL-Dithiothreitol were successively added for reaction at 37°C for 2 minutes; after that, 1 μL reverse transcriptase was added to every tube for reaction at 37°C for 50 minutes and then at 70°C for 15 minutes.
Detecting protein by Western blot
Cell total protein extraction was performed, followed by sodium dodecyl sulfate–polyacrylamide gel electrophoresis, transmembrane antibody incubation, and color development.
Cell proliferation test (WST-1 method)
Cells in the logarithmic phase of growth were digested by pancreatin, centrifuged, and counted. Then, the cells were incubated in 96 well plates (5×10³–1×10⁴/well). The cells were classified into blank control group and negative control group. All groups were processed under different experimental conditions. Approximately 15 μL WST-1 reagent was added to every well and then incubated in dark at 37°C for 2 hours. A microplate reader was used for detection using double wavelength of 450 and 630 nm.
Cell cycle detection
Cells in the logarithmic phase of growth were digested by trypsin and centrifuged. After counting, the cells were inoculated in 12-well plates (1.5×10⁵/well). Cells were processed accordingly after they adhered. some time, the cells were collected in 2.0 mL EP tubes, washed with 1× PBS, and then 500 μL precooled 75% ethyl alcohol was added for fixation overnight. When the fixation was completed, the cells were centrifuged at 700 rcf for 5 minutes. After the supernatant was removed, the cells were washed with 1× PBS once and then resuspended by adding 200 μL PBS. Once the RNA enzyme was added, the cells were placed at 37°C for 45 minutes. After digestion, PI was added for staining. Then, the cells were placed in the dark at room temperature for 45 minutes. The cells were detected using the TC10™ Automated Cell Counter after being filtered by a 200 mesh grid.
Detection of cell apoptosis
Cells in logarithmic phase of growth were digested by trypsin and centrifuged. After counting, the cells were inoculated in 12-well plates (1.5×10⁵/well). Cells were processed accordingly after they adhered. First, the supernatant was collected into relative flow cytometry tubes and EDTA-free trypsin was added. They were then transferred to flow cytometry tubes. Supernatant was removed after the cells were centrifuged at 1,204 rpm for 6 minutes. Then, the cells were suspended by adding 200 μL Annexin VI binding buffer. A quantity of 2 μL Annexin V-FITC (fluorescein isothiocyanate) was added into every tube. After 15 minutes of incubation at 4°C, 5 μL PI was added into each tube. Another 5 minutes later, the cells were detected using the TC10™ Automated Cell Counter.
Results
LPS upregulates the expression of TLR4 in HCC cells
To ensure whether TLR4 is functionally expressed in hepatocellular carcinoma (HCC) cells and whether its activation regulated biological function of HCC, H7402, and HepG2 cells were stimulated with the TLR4 agonist LPS (10 μg/mL) for 24 hours, and mRNA level of TLR4 was detected (Figure 1A). At the same time, the change in TLR4 protein level was tested after cells were stimulated with LPS at different times, by performing Western blot (Figure 1B), which indicated that mRNA and protein expression level of TLR4 in HCC cells significantly increased.
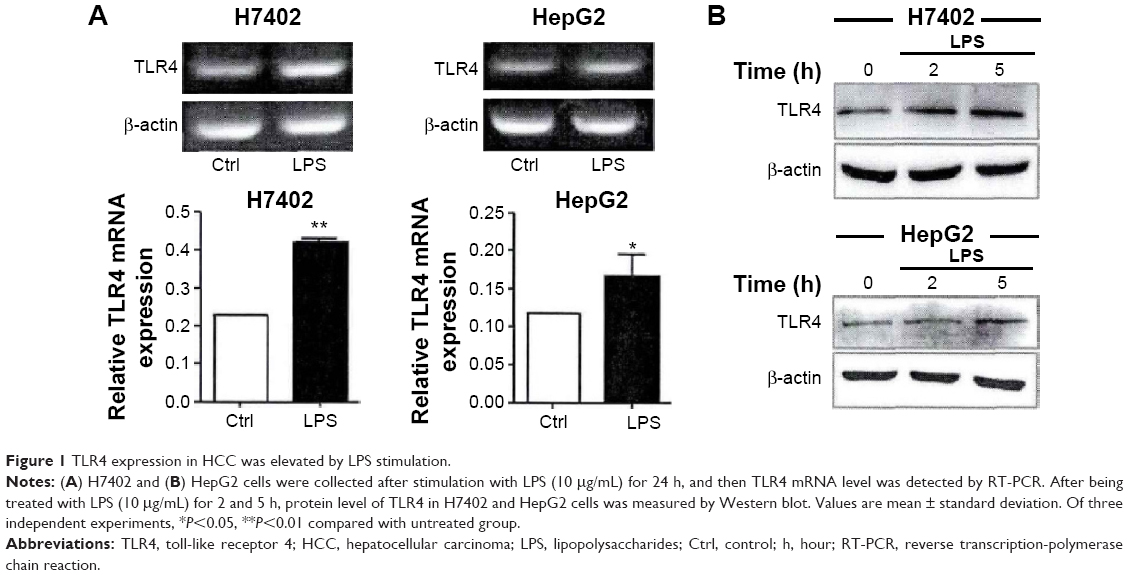 | Figure 1 TLR4 expression in HCC was elevated by LPS stimulation. |
LPS activates NF-κB signal pathway in HCC cells
Under the stimulation of inherent components related to pathogens, TLR4 started signal transduction to mediate the activation of Myd88-dependent NF-κB and mitogen-activated protein kinase (MAPK) pathway as well as Myd88-independent IRF pathway, in which NF-κB pathway is particularly important. The activation of NF-κB was detected after H7402 and HepG2 cells were stimulated with LPS (10 μg/mL) at different time points. Figure 2 shows that LPS was able to activate NF-κB signal pathway in HCC.
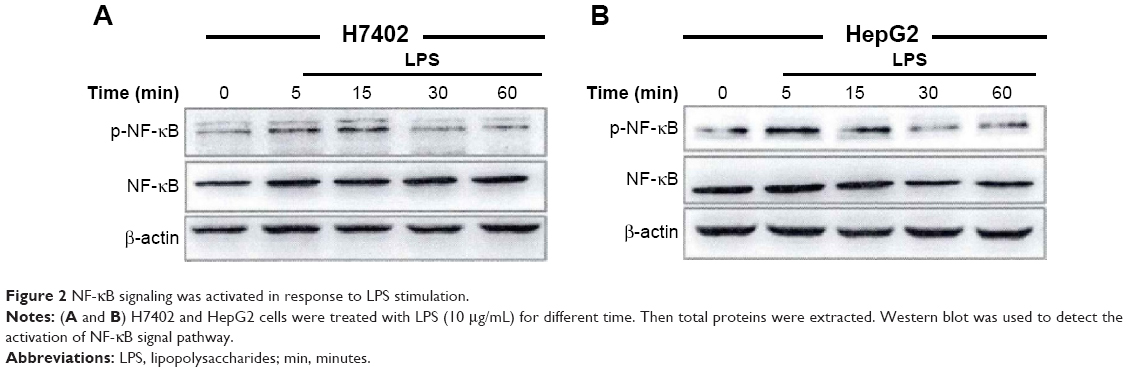 | Figure 2 NF-κB signaling was activated in response to LPS stimulation. |
LPS lowers expression of inflammatory factor in cells
TLR4 pathway, an important inflammatory signal pathway, regulates the expression of a variety of inflammatory factors. mRNA expression level of IL-6, IL-8, and TNF-α was detected with fluorescent quantitative PCR method after H7402 and HepG2 were stimulated with LPS at different times (Figure 3). After H7402 and HepG2 cells were activated by LPS, we found that the expression level of three kinds of inflammatory cell factors was obviously upregulated; mRNA level of inflammatory factors IL-8 and TNF-α rose, and IL-6 expression level had no significant changes.
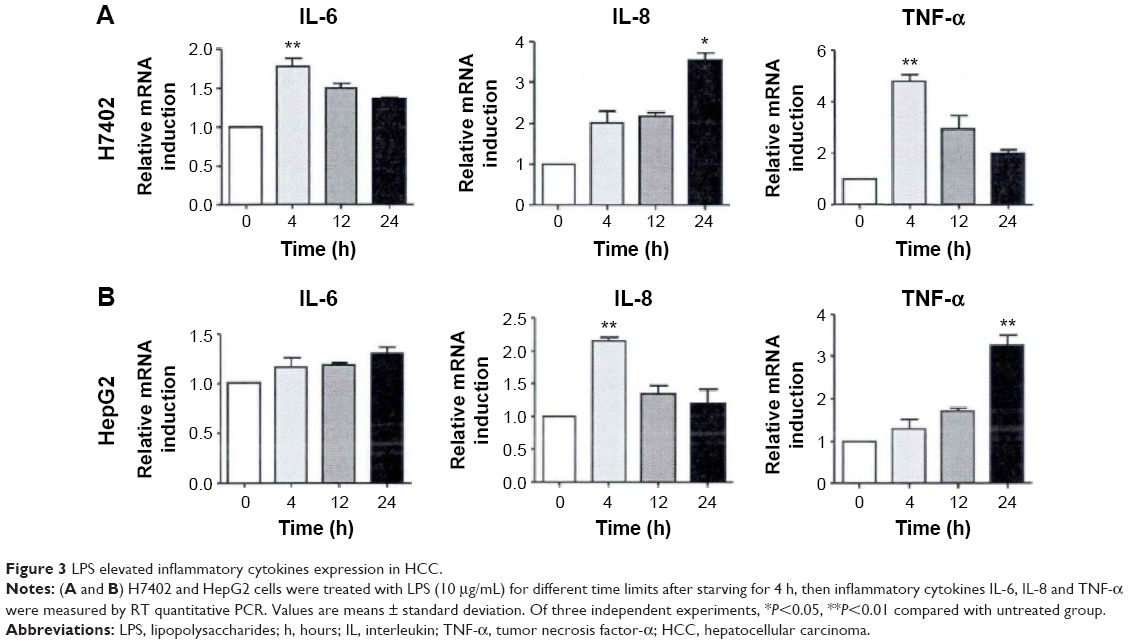 | Figure 3 LPS elevated inflammatory cytokines expression in HCC. |
LPS obviously promotes HCC cell proliferation
On the basis of the finding that TLR4 could promote the proliferation and immune escape of human head and neck squamous cell carcinoma, we studied the biological function of TLR4 on the surface of HCC cells and explored its influence on the process of HCC cell proliferation. By stimulating three kinds of human HCC cells using LPS with different concentrations for 48 hours, and testing cell proliferation applying WST-1 method, it was found that LPS was capable of significantly promoting human HCC cell proliferation in a concentration-dependent manner. Of them, LPS had most significant proliferative effect on H7402 (Figure 4). In addition, in Figure 4B, proliferation ability of H7402 stimulated with 10 μg/mL LPS at different times was obviously enhanced, and its proliferation efficiency was up to 50% after LPS worked for 48 hours.
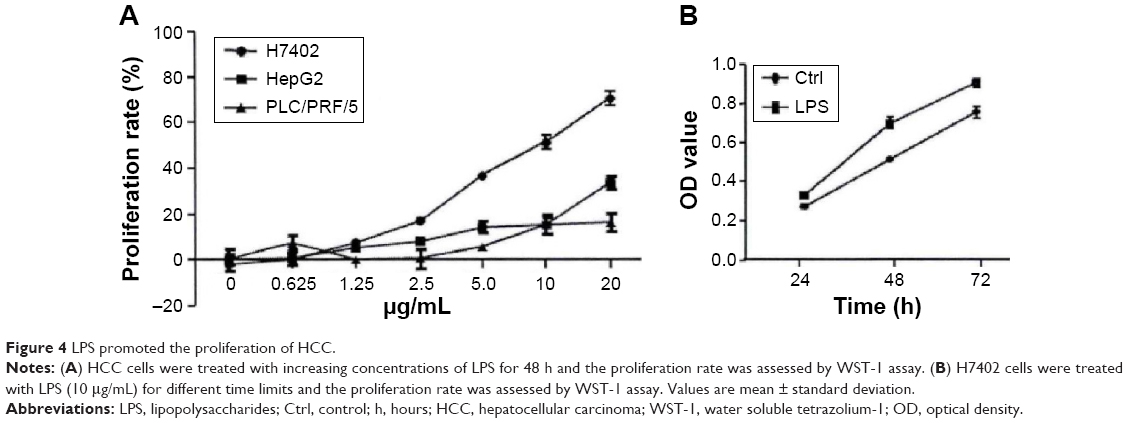 | Figure 4 LPS promoted the proliferation of HCC. |
LPS affects the cell cycle of HCC cells
Generally, cell cycle level and apoptosis level jointly determine the proliferation ability of cells, and so the influence of LPS on HCC cell cycle and apoptosis was detected. Cell apoptosis was detected with Annexin V/PI double staining method after H7402 cells were stimulated with LPS for 24 hours, and the results showed that LPS had no effect on level of H7402 cell apoptosis (Figure 5A), while it was found that the proportion cells in the S phase (DNA synthetic phase) in cell cycle increased after H7402 cells were stimulated with LPS for 24 hours (Figure 5B).
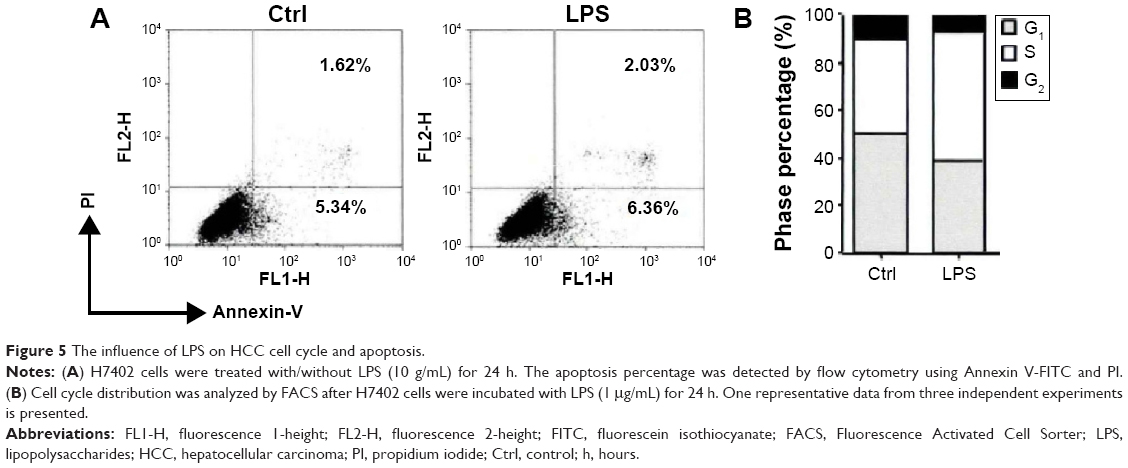 | Figure 5 The influence of LPS on HCC cell cycle and apoptosis. |
LPS upregulates cycle and controlled expression of Cyclin D1
The effective operation of cell cycle is regulated by Cyclin. Cyclin D1, as an important cycle regulatory protein, plays a vital role in driving the cell cycle from G1 phase to S phase. Our experiment, changes of Cyclin D1 mRNA and protein levels were tested, respectively, after H7402 cells were stimulated with LPS (10 μg/mL) for 12 hours (Figure 6), and the results showed that Cyclin D1 mRNA and protein levels in HCC obviously increased under stimulation of LPS.
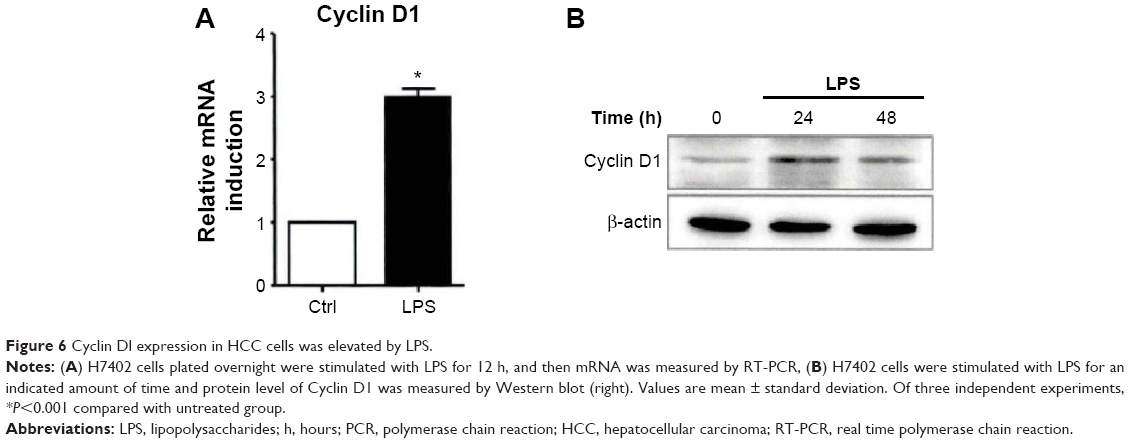 | Figure 6 Cyclin Dl expression in HCC cells was elevated by LPS. |
LPS activates STAT3 signal pathway in HCC cells
As two important inflammatory signal pathways, NF-κB and STAT3 signal pathways played a positive regulatory role in the occurrence and development process of tumor. We observed whether LPS could activate STAT3 signal in HCC and found that STAT3 signal pathway could be activated after LPS stimulated H7402, (Figure 7A).6 In the meantime, this phenomenon was confirmed by applying luciferase reporter gene technology (Figure 7B), showing that the stimulation of LPS was effective in enhancing STAT3 promoter activity.
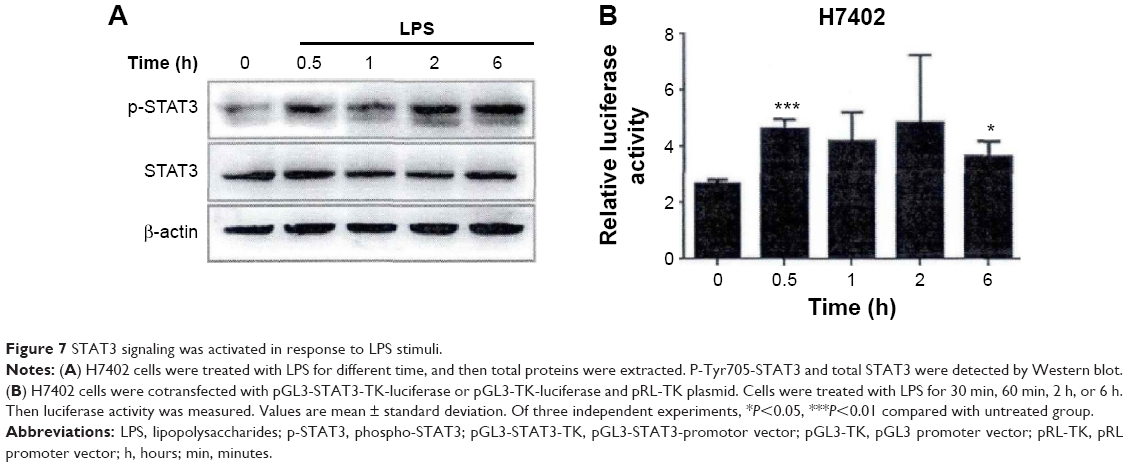 | Figure 7 STAT3 signaling was activated in response to LPS stimuli. |
LPS promotes HCC cell proliferation by activating STAT3
To confirm whether STAT3 pathway activation had an important effect on LPS-induced HCC cell proliferation, STAT3 pathway was cut off and inhibited to observe the response of HCC cell on LPS stimulation. First, STAT3-targeted Decoy ODN was transfected to stimulate LPS, which indicated that the proliferation ability of HCC cell improved to some extent (10%) under LPS stimulation, but was significantly lower than control group (Figure 8A). Moreover, LPS was almost unable to exert its proliferation promoting effect on HCC cell after STAT3 inhibitor was used for inhibiting its function (Figure 8B).
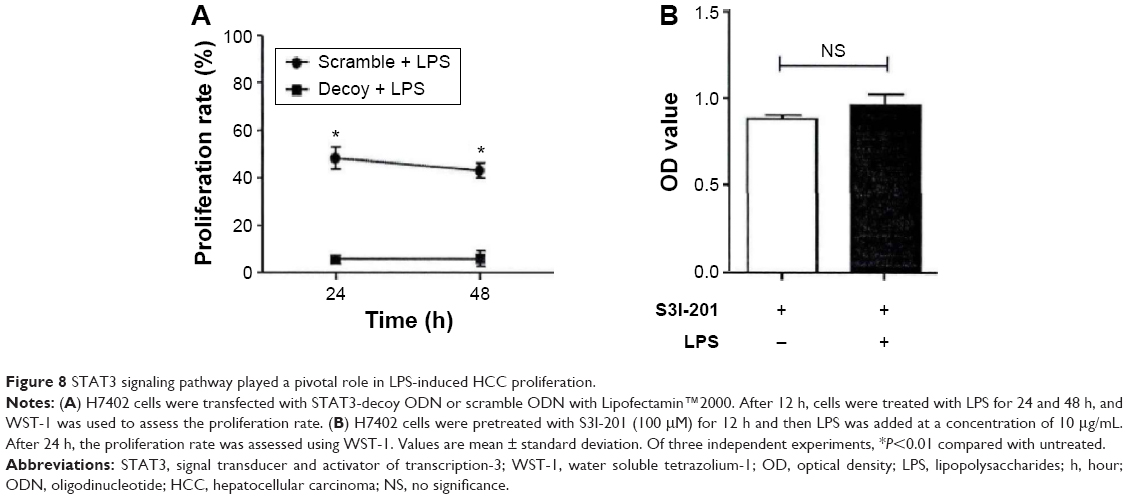 | Figure 8 STAT3 signaling pathway played a pivotal role in LPS-induced HCC proliferation. |
LPS activates COX-2/PGE2 signal axis
Cyclooxygenase (COX) forms prostaglandin G2 and prostaglandin H2 after being catalyzed; then prostaglandin H2 generates prostaglandin E2 (PGE2) after being catalyzed by prostaglandin E synthase. Upon detection, we found that two important rate-limiting enzymes COX-2 and mPGEs-1 tended to have significant higher mRNA level when H7402 cells were stimulated by LPS (Figure 9A and B). Similarly, Western blot experiment results revealed that LPS could obviously upregulate the expression of COX-2 (Figure 9C, left one). To verify whether LPS-induced COX-2 upregulation was mediated by TLR4 pathway activation, we stimulated LPS after inhibiting TLR4 with TLR4 inhibitor resatorvid (TAK-242). It could be seen from the right-hand side of Figure 9C that COX-2 expression significantly decreased after TLR4 pathway was restrained, and additionally, LPS could no longer upregulate the expression of COX-2.
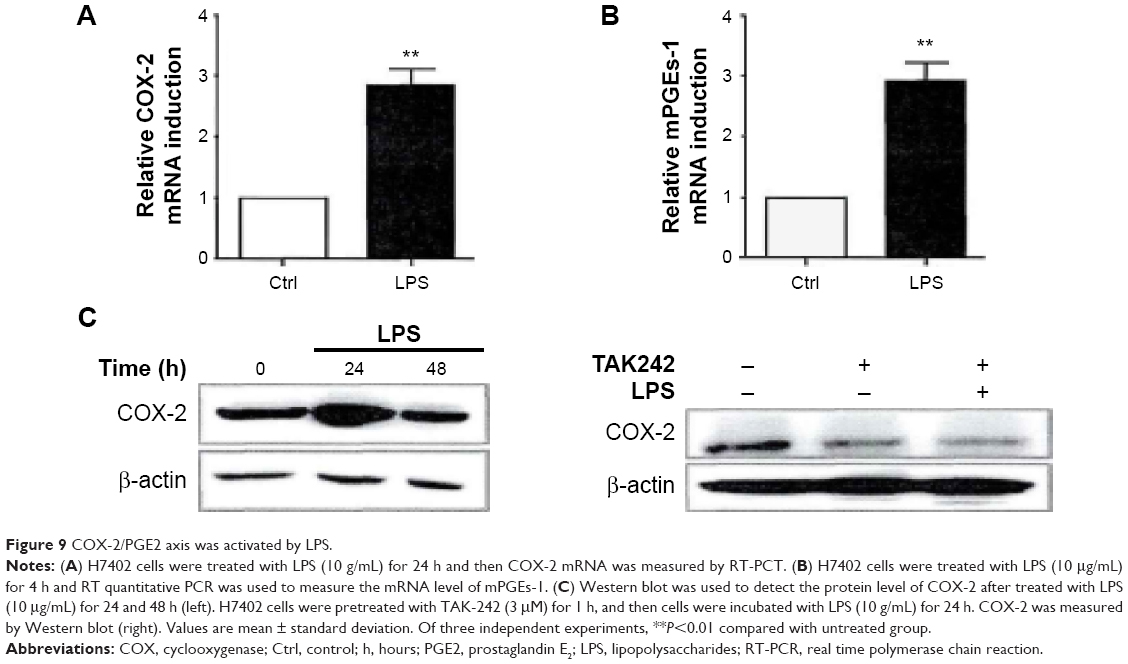 | Figure 9 COX-2/PGE2 axis was activated by LPS. |
LPS promotes liver cancer cells to generate multidrug resistance by activating STAT3
As we found LPS could activate COX-2/PGE2/STAT3 signal pathway in H7402 cells, it was doubted whether the activation of this signal pathway mediated generation of multidrug resistance induced by LPS. The results showed that the expression of drug resistance protein P-gp significantly decreased after COX-2 and STAT3 were activated (Figure 10A); meanwhile, after COX-2 was activated, LPS could no longer upregulate the expression of P-gp (Figure 10B). Furthermore, we verified the role of STAT3 in the process by luciferase reporter gene technique. Figure 10C demonstrates that LPS was able to significantly strengthen initiation activity of multidrug resistance gene 1 (mdr-1), but it could not work after STAT3 binding site in mdr-1 promoter mutated. The results revealed that LPS-mediated multidrug resistance is generated through activation of COX-2/PGE2/STAT3 signal pathway.
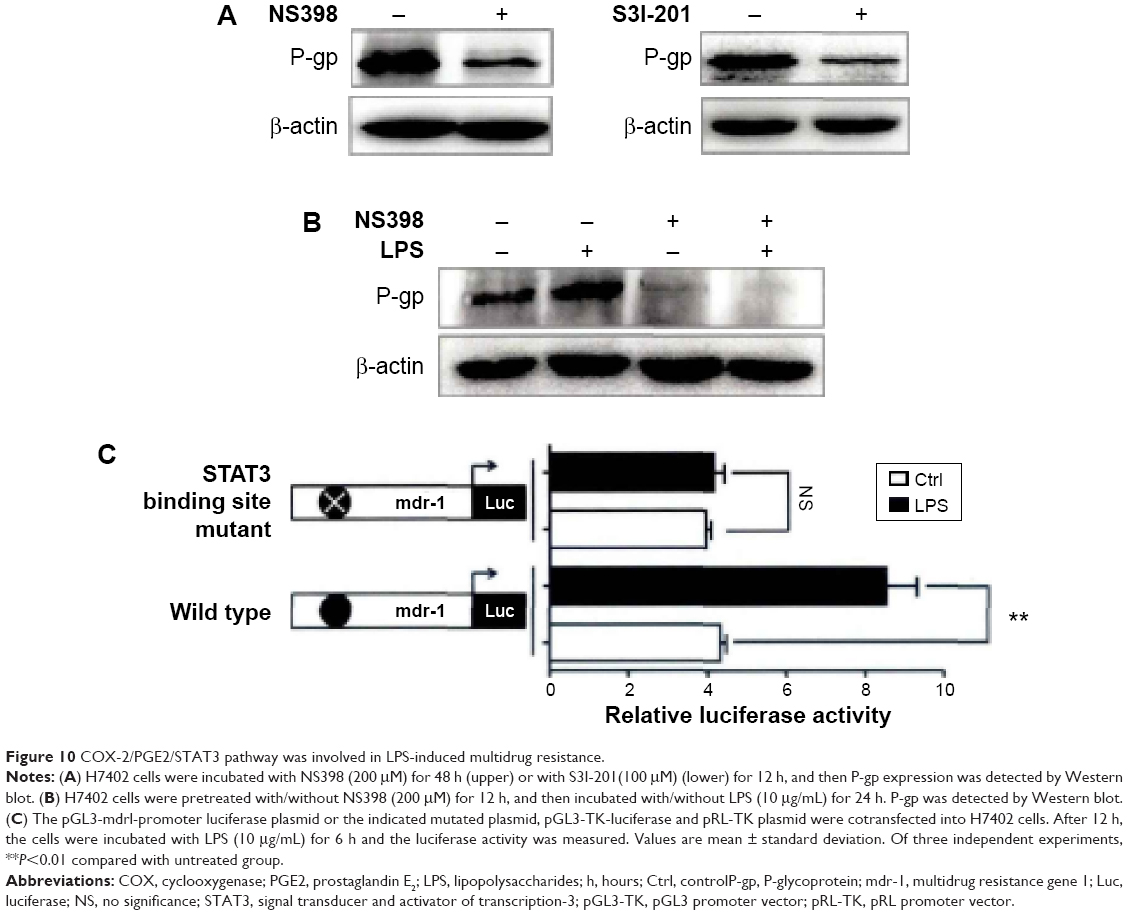 | Figure 10 COX-2/PGE2/STAT3 pathway was involved in LPS-induced multidrug resistance. |
Discussion
TLRs, as the first discovered pattern recognition receptors, have long been paid attention to by scholars due to its important regulation function in innate immunity and adaptive immune responses. Relevant immune stimulants based on TLR ligands have been widely used in infectious diseases such as viral hepatitis and influenza and in the prevention and clinical treatment of malignant tumor.7,8 For instance, FENDrix, prophylactic vaccine of hepatitis B, taking up agonist monophosphoryl lipid A (MPLA) of TLR4 as its adjuvant, received approval for use from the European Union in 2005; its effect was significantly better than the traditional hepatitis B vaccine.9 CpG ODN, ligand of TLR9, has showed a sound effectiveness in tumor immunotherapy, and a variety of tumor biological therapies centered on it have been in the stage of clinical research.10 It has been widely accepted that TLR agonists could enhance the body immunity, and relevant researches on immunoregulatory activities of TLR agonists are underway. However, as the research progressed, scientists found that TLRs expression was not just confined to immune cells, but widely existed in various tumor cells. Moreover, a large number of studies confirm that the activation of tumor cell TLRs has regulated various biological activities of tumor itself. For example, it has been found that activated TLRs on the surface of head and neck squamous cell carcinomas promoted tumor cell proliferation and protected tumor cells from the attack by the immune system.11 Therefore, the excitation of TLRs on cell surface is like a double-edged sword. On the one hand, it enhances the antitumor immune response of body; on the other hand, it is directly involved in the development and progression of tumor. Hence, it is particularly necessary to have an insight into the biological function of tumor cell TLRs.
In view of the special physiological function and structure of liver in body, hepatocytes will continuously receive stimulation from the extrinsic antigens of intestine. What role does TLRs play in the development and progression of liver cancer? We detected TLR1-TLR10, the commonly expressed TLRs on surfaces of HCC cells via RT-PCR, and found that except TLR7 and TLR8, all other TLRs were widely expressed on the surfaces of HCC cells. After stimulating HCC cells by agonists of TLR3, TLR4, and TLR9, respectively, it was found that poly (I:C) and CpG ODN, agonists of TLR3 and TLR9, respectively, had obviously induced the apoptosis of HCC cells while LPS, an agonist of TLR4, has significantly promoted the proliferation of HCC cells. An in vivo study using mouse model found that LPS, the constituent of intestine maleficent bacteria, promoted the development of liver cancer by activating TLR4 signaling pathway in hepatocytes, but its concrete mechanism was still unknown. On the basis of this preliminary work, we have conducted a large number of in vitro assays and made in-depth researches on the concrete functions as well as the internal mechanism of TLR4 on HCC cell surface.
First, we discovered that TLR4 was functionally expressed on the surface of liver cancer cell and its expression was intensified with LPS stimulation. NF-κB, an important inflammatory signal of TLR4 lower reaches, was also activated by LPS and upregulated along with inflammatory cytokines IL-6, IL-8, and TNF-α. After using different concentration of LPS to stimulate three types of human hepatoma cell line, we found that they improved their multiplication capacity, especially with H7402. More often than not, the variation of cells’ multiplication capacity reflects two changes concerned with psychological property, ie, cell cycle and cell apoptosis. Therefore, we observed the effect of LPS on cell cycle and cell apoptosis of liver and cancer cells. Results showed that the stimulation of LPS had no influence on cell apoptosis, but considering cell cycle DNA synthetic phase proportion increased significantly during the S phase, which meant the enhancement of mitosis level. The efficient operation of cell cycle requires the assistance of cell cycle regulating proteins to perform smoothly. We found that after stimulation, it was Cyclin D1, as an important regulating protein, that regulated the transition of cell cycle from G1 phase to S phase.
STAT3, an important transcription factor, regulates various expressions related to tumor proliferation, differentiation, apoptosis, and neoangiogenesis, such as Cyclin D1, Bcl-2, IL-10, IL-6, vascular endothelial growth factor (VEGF), etc.12 There exists plenty of literature showing that STAT3 is highly expressed in several tumor tissues and cells, which includes liver cancer.13 The early studies observed that the proliferation capacity of liver cancer cells weakened significantly when specific Decoy ODN transfected by STAT3 blocks its pathway.14 Thus, we used LPS to stimulate liver cancer cell and observed its activation, and it turned out that LPS could activate STAT3 signal pathway and keep it activated for a long time. However, the influence of LPS on promoting proliferation capacity of liver cancer weakened significantly upon blocking and after blocking STAT3. So we believe that STAT3 plays a crucial role in proliferation process of liver cancer cell stimulated by LPS.
Then which mechanism does LPS use to activate STAT3 signal pathway? It has been reported that IL-6 and IL-10 induced by activation of NF-κB pathway indirectly activates STAT3 through either autocrine or paracrine mechanisms.15,16 However, we found in the experiment that, after H7402 was stimulated by LPS, IL-6 expression level was improved and IL-10 had no obvious change; moreover, expression of IL-6 and IL-10 was not influenced by LPS. Thus, it was speculated that IL-6 and IL-10 were not the major factors activating STAT3, and some other factors might be involved in LPS-induced STAT3 activation. COX-2 as the key rate-limiting enzyme in the initial procedure of prostaglandin synthesis plays an important role in the synthesis of prostaglandin. Abnormally expressed COX-2 is considered to be closely correlated to the occurrence and development of tumors, and abnormal activation of COX-2/PGE2 signal axis was also thought to be a crucial characteristic of tumor.17 PGE2 is considered to be able to mediate downstream cascade signaling and then activate STAT3 by binding with other receptors.18 On the basis of this, we stimulated liver cancer cells using LPS, and meanwhile observed the expression of COX-2 and activation of STAT3. Finally, it was found that upregulation of COX-2 and activation of STAT3 showed up time consistency, indicating a possible correlation between them. When the activation of COX-2 was inhibited, basic activation level of STAT3 in liver cancer cells significantly decreased, and at the same time, stimulation from LPS could not induce the activation of STAT3; in turn, the expression of COX-2 was regulated by STAT3 as well. In addition, we used PGE2 antagonist to block other receptors and then found that the basic activation level of STAT3 had an obvious decrease and that stimulation from LPS could not induce its activation. All these findings suggested that TLR4 activation was able to activate COX-2/PGE2 signal axis and then STAT3 signal pathway. There was a positive feedback between COX-2/PGE2 signal axis and STAT3 pathway, which could help COX-2/PGE2/STAT3 sustain long-term activation state.
Chemotherapy is considered as one of the major means for treating liver cancer clinically. However, curative effect of chemotherapeutics was greatly restrained due to the multidrug resistance of tumor cells caused by long-term use of drugs, which is also the leading cause for failure of tumor chemotherapy.19 Researches carried out recently suggest that abnormal activation of COX-2 is closely correlated to multidrug resistance;20 besides, STAT3 is involved in the regulation of P-gp expression.21 In the experiment, we found that LPS could obviously induce the generation of multidrug resistance of liver cancer cells, in which, activation of COX-2/PGE2/STAT3 induced by LPS played a key regulatory role. Further study suggested that 5-fluorouracil and doxorubicin, the commonly used chemotherapeutics, turned to have a significantly weakened killing function after tumor cells were pretreated by LPS. We believed that it was proliferation and drug resistance of tumor cells promoted by the activation of TLR4 on the surface of tumor cells that influenced antitumor effect of chemotherapeutics ultimately.
Conclusion
To sum up, TLR4 agonist LPS promotes proliferation of liver cancer cells by affecting cell cycle; LPS is able to activate COX2/PGE2 signal axis within cells and then activate downstream STAT3 signal pathway. In addition, LPS induces multidrug resistance of liver cancer cells by activating STAT3 pathway. The data and evidences obtained from the experiments suggest TLR4 antagonist is possible to act as an effective HCC targeted treatment medicine. It is believed that scientists are bound to find out more scientific and effective strategies for treating liver cancer to benefit patients, with the improvement of liver cancer theory and deeper studying of pathogenesis of liver cancer.
Disclosure
The authors report no conflicts of interest in this work.
References
Jia F, Zheng W. Advancements in the surgical treatment of hepatocellular carcinoma. Pract J Clin Med. 2011;8(1):16–19. | ||
Chengfang Y, Qing X. Advances in research of biotherapies for primary hepatocellular carcinoma. Med Recapitulate. 2012;18(4):524–527. | ||
Huajun Z, Ang L, Qiuju H, Jian Z. Influence of TLR4 signaling on polyI: C-induced apoptosis of hepatocellular carcinoma cells. Chin J Immunol. 2014;30(1):30–33. | ||
Hong W, Haipeng Z, Liangjie L, Zhimin F. The influence of TLR4 on the radiosensitivity of human breast cancer cell MCF-7. Chin J Gerontol. 2014;34(11):3076–3078. | ||
Lihua Z, Jun L, Namei Z, Dongtie W, Qiaoli L. Research progress of diseases and drugs related with TLR2 and TLR4. Chin J Cell Mol Immunol. 2014;30(7):767–770. | ||
Yutong H, Chunhai C, Xuesen Y, Zhengping Y. Lipopolysaccharide-induced activation of microglia through JAK2-STAT3 pathway. Acta Academiae Medicinae Militaris Tertiae. 2009;31(12):1119–1122. | ||
Folkert S, Takeshi K, Christian B, Dennis MK. TLR-based immune adjuvants. Vaccine. 2011;29(11):3341–3355. | ||
Coffman RL, Sher A, Seder RA. Vaccine adjuvants: putting innate immunity to work. Immunity. 2010;33(4):492–503. | ||
Hoebe CJ, Vermeiren AP, Dukers-Muijrers NH. Revaccination with Fendrix or HBVaxPro results in better response rates does revaccination with three doses of Engerix-B. in previous non-responders. Vaccine. 2012;30(48):6734–6737. | ||
Krieg AM. Toll-like receptor 9 (TLR9) agonists in the treatment of cancer. Oncogene. 2008;27(2):161–167. | ||
Szczepanski MJ, Czystowska M, Szajnik M, et al. Triggering of Toll-like receptor 4 expressed on human head and neck squamous cell carcinoma promotes tumor development and protects the tumor from immune attack. Cancer Res. 2009;69(7):3105–3113. | ||
Anding G, Baoshun L, Xiaopeng L. STAT3 and tumor. Chin J Biochem Mol Biol. 2013;29(5):397–403. | ||
Sheau-Fang Y, Shen-Nien W, Chih-Fung W, et al. Altered p-STAT3 (tyr705) expression is associated with histological grading and intratumour microvessel density in hepatocellular carcinoma. J Clin Pathol. 2007;60(6):642–648. | ||
Xiaoxia S, Jian Z, Lihua W, Zhigang T. Growth inhibition of human hepatocellular carcinoma cells by blocking STAT3 activation with decoy-ODN. Cancer Lett. 2008;262(2):201–213. | ||
Elke MB, Maciej S, Angela W, Thomas W, HW Loems ZH. Role of Stat3 in lipopolysaccharide-induced IL-10 gene expression. J Immunol. 2000;165(3):1612–1617. | ||
Claire JG, Stefan RJ, Rami L, et al. IL-6 trans-signaling modulates TLR4-dependent inflammatory responses via STAT3. J Immunol. 2011;186(2):1199–1208. | ||
Alexander G, Helena JMS, Amy Elizabeth M, et al. The COX-2/PGE2 pathway: key roles in the hallmarks of cancer andadaptation to the tumour microenvironment. Carcinogenesis. 2009;30(3):377–386. | ||
Han C, Demetris AJ, Stolz DB, Xu L, Lim K, Wu T. Modulation of Stat3 activation by the eytosolic phospholipase Asa and cyclooxygenase-2-controlledprostaglandin E2 signaling pathway. Biol Chem. 2006;28(34): 24831–24846. | ||
Ornella F, Emanuela M, Lacopo S, et al. The MDR phenotype is associated with the expression of COX-2 and iNOS in a human hepatocellular carcinoma cell line. Hepatology. 2002;35(4):843–852. | ||
Hua S, Shoufeng Z, Yan W, et al. COX-2 contributes to P-glycoprotein-mediated multidrug resistance via phosphorylation of c-Jun atSer63/73 in colorectal cancer. Carcinogenesis. 2011;32(5):667–675. | ||
Xulong Z, Weihua X, Lihua W, Zhigang T, Jian Z. Deactivation of signal transducer and activator of transcription 3 reverses chemotherapeutics resistance of leukemia cells via down-regulating P-gp. PLoS One. 2011;6(6):e20965. |
 © 2015 The Author(s). This work is published and licensed by Dove Medical Press Limited. The full terms of this license are available at https://www.dovepress.com/terms.php and incorporate the Creative Commons Attribution - Non Commercial (unported, v3.0) License.
By accessing the work you hereby accept the Terms. Non-commercial uses of the work are permitted without any further permission from Dove Medical Press Limited, provided the work is properly attributed. For permission for commercial use of this work, please see paragraphs 4.2 and 5 of our Terms.
© 2015 The Author(s). This work is published and licensed by Dove Medical Press Limited. The full terms of this license are available at https://www.dovepress.com/terms.php and incorporate the Creative Commons Attribution - Non Commercial (unported, v3.0) License.
By accessing the work you hereby accept the Terms. Non-commercial uses of the work are permitted without any further permission from Dove Medical Press Limited, provided the work is properly attributed. For permission for commercial use of this work, please see paragraphs 4.2 and 5 of our Terms.