")
Back to Journals » International Journal of Nanomedicine » Volume 10 » Issue 1
The fate of calcium carbonate nanoparticles administered by oral route: absorption and their interaction with biological matrices
Authors Lee J, Kim M, Kim H, Lee JK, Jeong J, Kim Y, Oh J, Choi S
Received 16 December 2014
Accepted for publication 6 February 2015
Published 23 March 2015 Volume 2015:10(1) Pages 2273—2293
DOI https://doi.org/10.2147/IJN.S79403
Checked for plagiarism Yes
Review by Single anonymous peer review
Peer reviewer comments 4
Editor who approved publication: Dr Thomas Webster
Jeong-A Lee,1,* Mi-Kyung Kim,1,* Hyoung-Mi Kim,2,* Jong Kwon Lee,3 Jayoung Jeong,4 Young-Rok Kim,5 Jae-Min Oh,2 Soo-Jin Choi1
1Department of Food Science and Technology, Seoul Women’s University, Seoul, Republic of Korea; 2Department of Chemistry and Medical Chemistry, College of Science and Technology, Yonsei University, Wonju, Republic of Korea; 3Hazard Substances Analysis Division, Gwangju Regional Food and Drug Administration, Ministry of Food and Drug Safety, Gwangju, Republic of Korea; 4Toxicological Research Division, National Institute of Food and Drug Safety Evaluation, Ministry of Food and Drug Safety, Chungcheongbuk-do, Republic of Korea; 5Department of Food Science and Biotechnology, Kyung Hee University, Yongin, Republic of Korea
*These authors contributed equally to this work
Background: Orally administered particles rapidly interact with biological fluids containing proteins, enzymes, electrolytes, and other biomolecules to eventually form particles covered by a corona, and this corona potentially affects particle uptake, fate, absorption, distribution, and elimination in vivo. This study explored relationships between the biological interactions of calcium carbonate particles and their biokinetics.
Methods: We examined the effects of food grade calcium carbonates of different particle size (nano [N-Cal] and bulk [B-Cal]: specific surface areas of 15.8 and 0.83 m2/g, respectively) on biological interactions in in vitro simulated physiological fluids, ex vivo biofluids, and in vivo in gastrointestinal fluid. Moreover, absorption and tissue distribution of calcium carbonates were evaluated following a single dose oral administration to rats.
Results: N-Cal interacted more with biomatrices than bulk materials in vitro and ex vivo, as evidenced by high fluorescence quenching ratios, but it did not interact more actively with biomatrices in vivo. Analysis of coronas revealed that immunoglobulin, apolipoprotein, thrombin, and fibrinogen, were the major corona proteins, regardless of particle size. A biokinetic study revealed that orally delivered N-Cal was more rapidly absorbed into the blood stream than B-Cal, but no significant differences were observed between the two in terms of absorption efficiencies or tissue distributions. Both calcium carbonates were primarily present as particulate forms in gastrointestinal fluids but enter the circulatory system in dissolved Ca2+, although both types showed partial phase transformation to dicalcium phosphate dihydrate. Relatively low dissolution (about 4%), no remarkable protein–particle interaction, and the major particulate fate of calcium carbonate in vivo gastrointestinal fluids can explain its low oral absorption (about 4%) regardless of particle size.
Conclusion: We conclude that calcium carbonate nanoparticles can act more actively with biological matrices in vitro and ex vivo, but that in vivo, their biological interactions and biokinetics are not affected by particle size.
Keywords: biological interaction, oral absorption, biokinetics, size effect, protein corona
Introduction
Calcium carbonate (CaCO3) is widely used as a dietary supplement in the food industry because calcium, the most abundant mineral element in the body, is essentially required for muscle contraction, nerve function, blood clotting, intracellular cell signaling, hormonal secretion, and healthy bones and teeth.1–4 However, less than 1% of total body calcium is necessary for critical metabolic functions; the other 99% is stored in bones and teeth. CaCO3 is also used as an antacid to relieve heartburn, as it neutralizes stomach acid.5 When CaCO3 is taken as an oral supplement, it requires stomach acid to dissolve it before it can be taken up by the blood stream as Ca2+.6 However, the oral absorption of CaCO3 is extremely low (approximately 4%), depending on pH condition.4,7 Nanotechnology may provide a novel means of overcoming this limitation. To increase oral calcium bioavailability, attempts have been made to produce nanosized CaCO3. Chen et al reported higher calcium absorption and retention for nanosized pearl powder (84 nm) than microsized pearl powder (29.4 μm) administered to healthy adults.8 Park et al demonstrated that nano CaCO3-supplemented milk significantly increased femoral bone mineral density in ovariectomized rats.9 Huang et al also showed that nano CaCO3 (151±19 nm) enhanced the bioavailability of calcium in ovariectomized mice as compared with micro CaCO3 (3,773±759 nm), based on serum calcium concentration and bone mineral density measurements.10 On the other hand, Shahnazari et al concluded that the size of CaCO3 particles does not critically affect overall calcium metabolism or bone density; however, they investigated microsized CaCO3 (13.0 versus 18.5 μm).11 Thus, it has not been determined whether nanosized CaCO3 supplementation has benefits in terms of enhancing the oral bioavailability of calcium.
When nanoparticles enter biological systems and encounter biofluids, they interact rapidly with biomolecules, such as proteins and enzymes, and become coated by a so-called “corona,” which completely changes their physicochemical characteristics.12,13 In particular, a plasma protein-derived surface corona can provide an immunological response signal and activate macrophages, and eventually induce particle clearance by the mononuclear phagocyte system.14 Other plasma proteins, like albumin, have been reported to play a role in preventing the opsonization process and to increase particle circulation times.15 Furthermore, some apolipoproteins can mediate the transcytosis of nanoparticles across the blood–brain barrier.16 Hence, interactions between nanoparticles and plasma proteins or blood components potentially influence nanoparticle uptake, absorption, biodistribution, and clearance. In addition, it has been reported that particle–protein coronas might be affected by particle sizes and surface properties.17,18
Orally administered nanoparticles are subjected to harsh physiological conditions in the gastrointestinal (GI) tract,19 such as low pH and enzyme or immune attack, which generally adversely affect bioavailability. Since nanoparticles are characterized by high reactivity and biological response due to their large specific surface area to volume ratios, interactions of nanoparticles in the GI tract are likely to differ from those of microsized particles.20,21 Dissolution, shape, and crystallinity can affect differently the biological behaviors of nanoparticles in vivo. Moreover, the possibility that nanoparticles penetrate the intestinal epithelium via an energy-dependent endocytosis pathway cannot be excluded. It is now generally accepted that many nanoparticles are taken up by cells by an endocytic pathway.22–24 Accordingly, determination of the biological fate of nanoparticles following oral administration is key to understanding and interpretation of oral absorption and biokinetic behaviors. In addition, exposure of CaCO3 to the gastric system may cause phase transformation to other crystalline forms in the intestine and prevent calcium absorption, and this too is likely to be affected by particle size. It is known that calcium interacts strongly with phosphate, which is one of the most abundant ions in the body, and that the near insoluble calcium phosphate formed prevents bound calcium from being absorbed.25,26 However, little information is available about interactions between nanoparticles and biological matrices as well as their fates in biologic systems.
In this study, we evaluated interactions between food grade bulk- and nanosized CaCO3 (B-Cal and N-Cal, respectively) and biological matrices. Dissolution, shape, phase transformation and particle–protein interactions were examined in three different systems: 1) in vitro simulated body fluids, 2) ex vivo GI fluid and plasma obtained from rats, and 3) in vivo in GI fluid and plasma following oral administration to rats. Proteomics analysis was also performed to investigate size-dependent particle–protein interactions and to identify bound proteins. Furthermore, the oral absorptions and biodistributions of B-Cal and N-Cal were assessed after administering single and repeated doses to rats.
Material and methods
Materials
The two food grade CaCO3 materials (B-Cal and N-Cal) were produced by grinding seashells and were purchased from Apexel Co., Ltd. (Pohang, Republic of Korea).
Characterization
The powder X-ray diffraction (XRD) patterns of the two CaCO3 were obtained using an X-ray diffractometer D2phaser (Bruker AXS, Billerica, MA, USA) using Ni-filtered CuKα radiation. Particle sizes and morphologies were determined by scanning electron microscopy (SEM) (QUANTA FEG250; FEI, Hillsboro, OR, USA). Specific surface areas were determined using N2 adsorption–desorption isotherms using a micromeritics (Accelerated Surface Area and Porosimetry System [ASAP 2020]; Micromeritics Instrument Corporation, Norcross, GA, USA). The zeta potentials were measured after being dispersed and diluted in deionized water by light scattered electrophoresis using an ELSZ-1000 (Otsuka Electronics Co. Ltd., Osaka, Japan). Hydrodynamic sizes and size distributions were evaluated by dynamic light scattering using an ELSZ-1000 (Otsuka Electronics Co. Ltd.). Fourier transform infrared (FT-IR) spectra were obtained using a Perkin Elmer spectrum one FT-IR spectrometer using potassium bromide pellet method. Typically, potassium bromide and sample were mixed at weight ratio of ~100:1 and ground in an agate mortar. Pellets were then made from the powders obtained.
Animals
Five-week-old male and female Sprague Dawley rats weighing 120–140 g were purchased from Nara Biotech Co., Ltd. (Seoul, South Korea). Animals were housed in plastic animal cages in a ventilated room maintained at 20°C±2°C and 60%±10% relative humidity, under a 12 hour light/dark cycle. Water and commercial laboratory complete food for rats were made available ad libitum. Animals were acclimated to this environment for 7 days before treatment. All animal experiments were performed after obtaining approval from the Animal and Ethics Review Committee of Seoul Women’s University.
Preparation of simulated body fluids and of tissue-extracted biofluids
We prepared three types of in vitro body fluids simulating gastric, intestinal, and plasma conditions. For the gastric condition, 0.034 M sodium chloride and 3.2 g pepsin (P7000; Sigma-Aldrich, St Louis, MO, USA) were dissolved in deionized water, and the pH of the solution was adjusted to 1.5 with 1 M hydrochloric acid, and then made up to 1 L. For the intestinal condition, bile salt (87.5 mg) (B8756; Sigma-Aldrich) and pancreatin (25 mg) (P7545; Sigma-Aldrich) were added to simulated gastric solution, and then the pH was adjusted to 6.8 by titrating with 1.12 M sodium bicarbonate. The plasma simulating solution was prepared by simply dissolving 50 g of albumin (A7906; Sigma-Aldrich) in 1 L of phosphate-buffered saline (LB004-02; Welgene, Daegu, Republic of Korea).
To obtain GI fluids, stomachs and small intestines were collected from 6-week-old male Sprague Dawley rats after CO2 euthanasia. Tissues were rinsed with saline and gastric and intestinal fluid samples were extracted. GI fluids were defined as the supernatants obtained by centrifugation at 13,000× g for 15 minutes at 4°C. Blood samples were collected via tail vein using a catheter and then centrifuged at 12,000× g for 3 minutes at 4°C to obtain plasma.
In vitro and ex vivo interactions between calcium carbonates and biological substances
CaCO3 samples were dispersed either in simulated body fluids or extracted biofluids (GI fluid or plasma) at concentrations of 5 or 50 mg/mL, respectively. Aliquots were collected 15 minutes, 30 minutes, and 1 hour later. For intestinal fluid and plasma, aliquots were collected at 30 minutes, 1 hour, and 4 hours. These time points were selected based on residence times of ingested materials in the GI tract.
Collected suspensions were centrifuged, and the precipitates and supernatants were assayed. Precipitates were vacuum dried and subjected to XRD and SEM to determine particle crystallinities, sizes, and morphologies, as described in Characterization section. Also, collected suspensions were subjected to a protein fluorescence quenching assay, which was performed using a luminescence spectrometer (LS55; PerkinElmer Inc., Waltham, MA, USA). Fluorescence emission intensities were measured at 340 and 430 nm using excitation wavelengths of 280 and 320 nm, respectively. Quenching ratios were calculated as (I0−I)/I0, where I0 and I stand for basal fluorescence emission intensity in controls (CaCO3 untreated) and experimental groups (CaCO3 treated), respectively.
Chemical environments around Ca2+ ions before and after incubation for 48 hours in simulated body fluids were evaluated by X-ray absorption spectroscopy performed at the 8C Nanoprobe XAFS beam line at the Pohang Accelerator Laboratory (Pohang, South Korea). X-ray absorption spectroscopy spectra were collected at the Ca K-edge of 4,038 eV; Ca K-edge was obtained in a 90% He/10% N2 atmosphere. X-ray absorption near edge spectra at calcium K-edge were analyzed to assess the coordination number of Ca2+ ion in each sample.
In vivo interactions between calcium carbonates and biological media
CaCO3 particles were orally administered at 250 mg/kg to male rats. After designated times of postadministration (0.25 and 0.5 hour for gastric fluid, 1 and 4 hours for intestinal fluid, 1 and 2 hours for plasma), biofluids were obtained and centrifuged as described above. Precipitates were dried in vacuum and subjected to XRD and SEM to analyze crystallinity, size, and morphology, as described above. Because in vivo samples contained many organic substances, energy dispersive spectroscopy (EDS) APOLLO X AMETEK Inc., Mahwah, NJ, USA was carried out during SEM measurements to distinguish CaCO3 from biological components. Rectangular zones showing more than 5% (w/v) of calcium content in EDS spectra were determined to contain CaCO3. Supernatants were subjected to a protein fluorescence quenching assay, which was performed using a luminescence spectrometer, as described above.
Dissolution properties
The in vitro and ex vivo dissolution of the two CaCO3 was measured by dispersing them at 5 and 50 mg/mL in simulated body and extracted tissue fluids, respectively. After incubation for designated times at 37°C, supernatants were collected by ultracentrifugation (15,000× g at 15 minutes). In vivo dissolution was also analyzed following the oral administration of 250 mg/kg to male rats. After centrifugation of the biofluids obtained, supernatants were passed through a syringe filter (25AS045AS, pore size 0.45 μm; Advantech, Taipei, Taiwan), and calcium concentrations were determined by inductively coupled plasma-atomic emission spectroscopy (ICP-AES) (JY2000 Ultrace; HORIBA Jobin Yvon, Stow, MA, USA).
One-dimensional (1D) and two-dimensional (2D) gel electrophoresis
A particle suspension of 100 μL (500 mg of particles prepared in 1 mL of distilled water [DW]) was incubated with 1 mL of plasma at 37°C with gentle shaking for 1 hour. Unbound proteins were separated from particles by centrifugation at 23,000× g for 1 hour at 4°C, and the precipitates were washed three times with deionized DW. For 1D gel electrophoresis, samples were suspended in rehydration buffer (7 M urea, 2 M thio-urea, 4% 3-[(3-cholamidopropyl) dimethylammonio]-1-propanesulfonate [CHAPS], 2.5% dithiothreitol) containing protease inhibitor cocktail (Hoffman-La Roche Ltd., Basel, Switzerland). After vortexing overnight, samples were centrifuged at 15,000× g for 15 minutes and resuspended in sodium dodecyl sulfate (SDS) sample buffer. Samples were then heated at 95°C for 10 minutes and cooled to room temperature before loading (15 μg of protein) into 12% SDS-polyacrylamide (SDS-PAGE) gels. Protein concentrations were measured using a Bradford method (Bio-Rad Laboratories Inc., Hercules, CA, USA).
For 2D gel electrophoresis, pH 4–7 immobilized pH gradient strips (GE Healthcare Life Sciences, Cleveland, OH, USA) were rehydrated in swelling buffer containing 7 M urea, 2 M thiourea, 0.4% (w/v) dithiothreitol, and 4% (w/v) CHAPS. The protein lysates (120 μg) were loaded into rehydrated immobilized pH gradient strips using a Multiphor II apparatus (GE Healthcare Life Sciences) over 57 kVh. 2D separations were performed on 8%–16% (v/v) linear gradient SDS-PAGE gels. After separation, gels were fixed for 1 hour in a solution of 40% (v/v) methanol containing 5% (v/v) phosphoric acid, stained with Coomassie blue G-250 solution (ProteomeTech, Seoul, South Korea) for 5 hours, destained in 1% (v/v) acetic acid for 4 hours, and imaged using an Image Scanner III imaging calibrated densitometer (GE Healthcare Life Sciences).
Protein identification by mass spectrometry
Protein spot detection and 2D pattern matching were carried out using Image Master TM 2D Platinum software (GE Healthcare Life Sciences). To compare control and treated sample protein spot densities, more than 20 gel spots were landmarked and normalized. The spots of candidate proteins were compared with the aid of histograms. To ensure the reproducibility of 2D experiments, samples were analyzed in triplicate.
The procedure used for in-gel digestion of protein spots from Coomassie blue stained gels was applied.7 Prior to mass spectrometry analysis, peptide solutions were desalted using a reversed-phase column.27 A constricted gel loader tip (Eppendorf, Hamburg, Germany) was packed with Poros 20 R2 resin (Thermo Fisher Scientific, Waltham, MA, USA). After an equilibration step with 10 μL of 5% (v/v) formic acid, the peptide solution was then loaded onto the column and washed with 10 μL of 5% (v/v) formic acid. Bound peptides were eluted with 1 μL of α-cyano-4-hydroxycinnamic acid (5 mg/mL in 50% [v/v] ACN +5% [v/v] formic acid) and then spotted onto a MALDI plate (96×2, Thermo Fisher Scientific). Peptide extracts were analyzed by liquid chromatography-mass spectrometry/mass spectrometry (LC-MS/MS) on an Agilent 1100 Nano HPLC (Santa Clara, CA, USA) coupled to a MALDI-TOF mass spectrometer (ABI 4800 MALDI-TOF/TOF™ Analyzer; Thermo Fisher Scientific). Spectra were acquired and processed using MASCOT software (Matrix Science, London, UK).
Pharmacokinetics and tissue distributions
Six male and six female rats per group were administered a single dose of 250 mg/kg or 250 mg/kg daily for 14 consecutive days of the two CaCO3 by oral gavage; controls (n=6) received an equivalent volume of 0.9% saline. Body weight changes, behaviors, and symptoms were carefully recorded daily after treatment. To determine plasma calcium concentrations, blood samples were collected via a tail vein at 0, 0.25, 0.5, 1, 2, 4, and 6 hours after the single and on the 14th day. Blood samples were centrifuged at 3,000× g for 15 minutes at 4°C to obtain plasma. The following pharmacokinetic parameters were estimated using Kinetica version 4.4 (Thermo Fisher Scientific): maximum concentration (Cmax), time to maximum concentration (Tmax), area under the plasma concentration-time curve (AUC), half-life (T1/2), and mean residence time (MRT). For the tissue distribution study, samples of brain, heart, kidney, liver, lung, spleen, and testis or ovary were collected after 14-day repeated administration.
ICP-AES analysis
Biological samples (0.2 g of plasma and total tissues) were predigested in 3–10 mL of ultrapure nitric acid overnight and heated at ~160°C. Hydrogen peroxide (0.5–1.0 mL) was then added, and mixtures were heated until samples had been completely digested; that is, until the solutions were colorless and clear. The solutions were finally diluted to 5 or 10 mL for plasma and other samples, respectively, with ultrapure water and filtered at 0.45 μm. All the tissues were spiked with known concentrations of standard calcium solution which were also used for the external calibration. Analyses of total calcium contents were conducted by ICP-AES (JY2000 Ultrace; HORIBA Jobin Yvon) using radiofrequency power of 1,000 W and nebulizer argon flow rate of 0.02 mL/min.
Statistical analysis
Results are presented as means ± standard deviations. Experimental values were compared with corresponding untreated control values. One-way analysis of variance (ANOVA) was conducted using SAS software (Tukey’s test, version. 11.0; SAS Institute Inc., Cary, NC, USA) to determine the significances of differences between experimental and control groups. Statistical significance was accepted for P-values of <0.05.
Results
Physicochemical parameters of the produced calcium carbonates
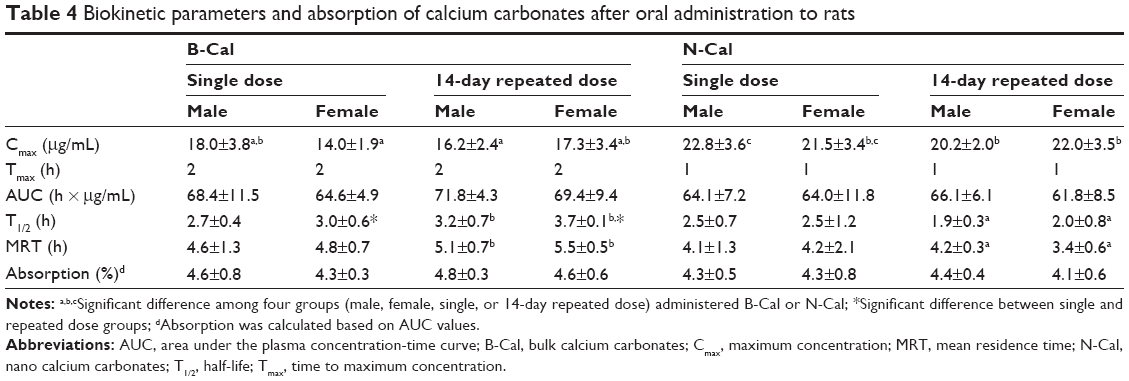
The physicochemical parameters of the CaCO3 samples such as crystal structures, chemical properties, particle sizes, specific surface areas, and properties in aqueous suspension were evaluated, and results are summarized in Table 1. According to XRD patterns (Figure S1A), B-Cal and N-Cal had a calcite structure (Joint Committee on Powder Diffraction Standards [JCPDS] No 47-1743) and exhibited high crystallinities. The overall XRD pattern showed sharper and more intense peaks for B-Cal than for N-Cal, which was attributed to larger particle size of B-Cal. Crystallite sizes obtained from XRD peaks using Scherrer’s equation (equation 1), were ~30 and ~40 nm for N-Cal and B-Cal, respectively,
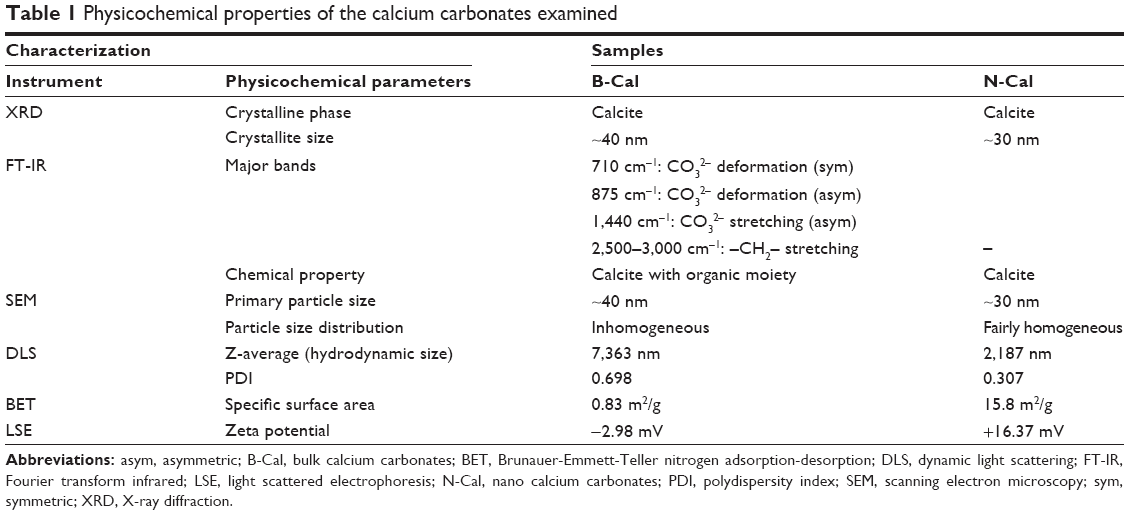 | Table 1 Physicochemical properties of the calcium carbonates examined |
| (1) |

where t is crystallite size in angstroms, λ is X-ray wavelength (1.5415 Å), B is full-width at half maximum of peak in radian unit, and θ is peak position in radian unit.
FT-IR spectra of B-Cal and N-Cal showed characteristic peaks at 710, 875, and 1,440 cm−1, which were attributed to symmetric CO32− deformation, asymmetric CO32− deformation, and asymmetric CO32− stretch of the calcite structure, respectively (Figure S1B).28 Interestingly, we observed several peaks in the 2,500 cm−1 region in the infrared spectrum of B-Cal, which have been due to the aliphatic CH2 stretch of alkyl chains. Trace organic impurities not fully removed during the manufacturing process may have been present in the bulk sample.
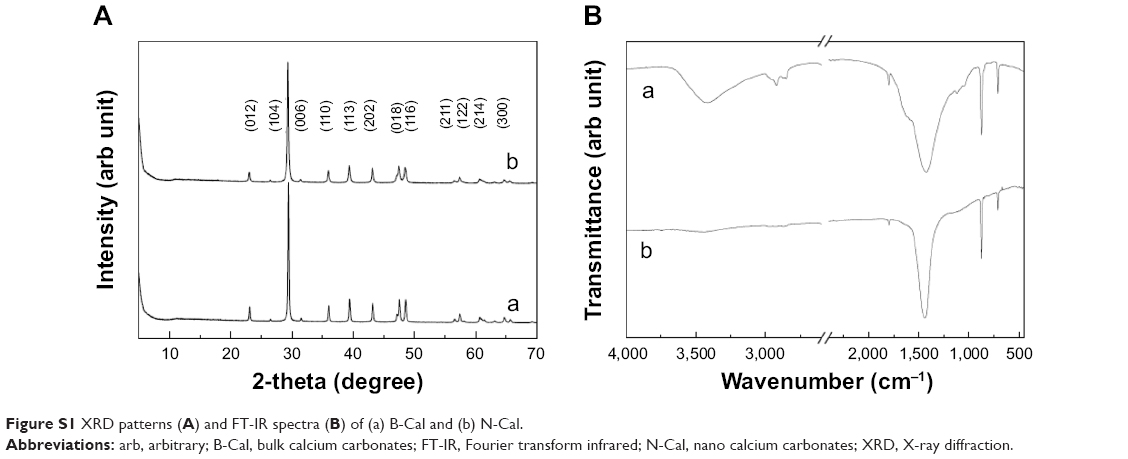
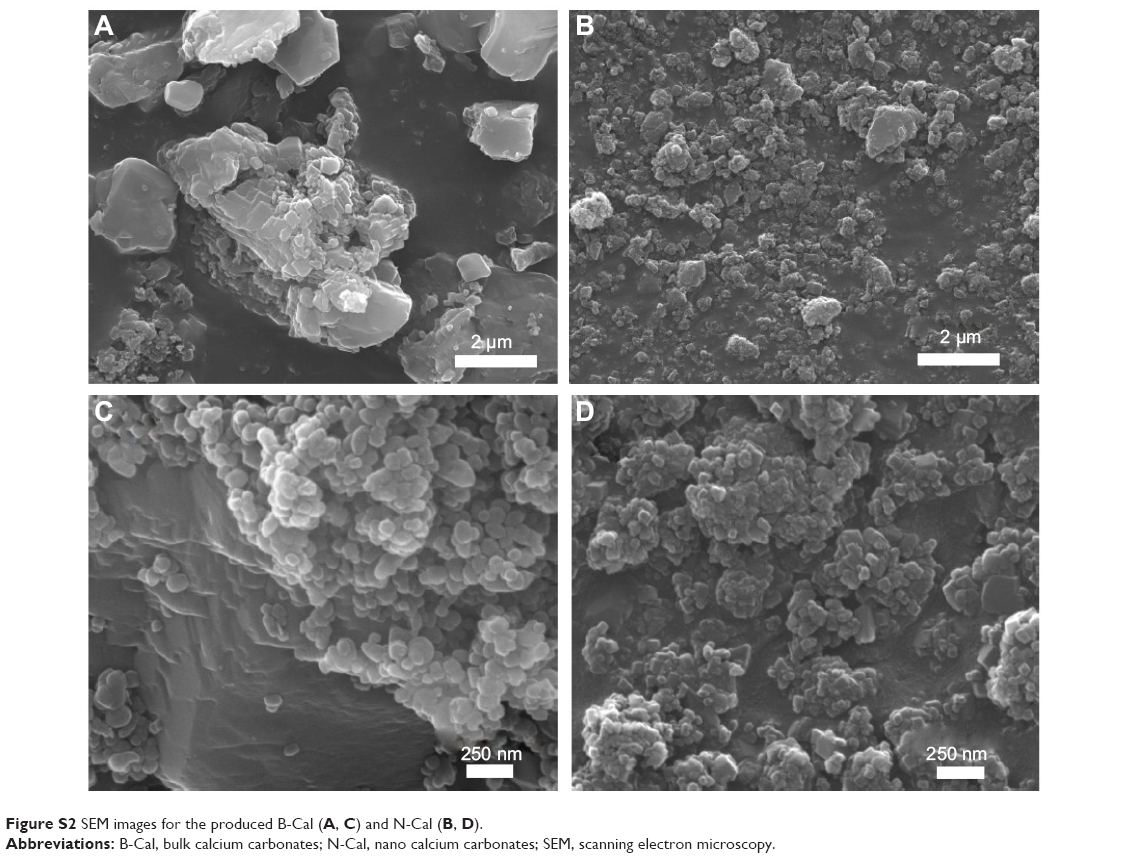
SEM analysis revealed that B-Cal and N-Cal had different particle sizes and morphologies (Figure S2). SEM images of B-Cal showed both large lumps of a few micrometers and small particles of ~40 nm in size (Figure S2A and C). On the other hand, most N-Cal particles were small with a diameter of ~30 nm. Primary particle sizes observed by SEM were well corresponded to crystallite sizes obtained from Scherrer’s equation. Although several lumps of 1–2 μm were also observed in N-Cal, they were much less common than those in B-Cal.
Hydrodynamic sizes of B-Cal and N-Cal demonstrated clear differences between the two in aqueous suspension (Figure S3). Z-average CaCO3 values, which provide a measure of average particle diameter,29 were 7,363 and 2,187 nm for B-Cal and N-Cal, respectively (Table 1). Polydispersity index, the ratio between mean particle size and standard deviation, reflected the more homogeneous size distribution of N-Cal (polydispersity index =0.307 versus 0.698). Specific surface areas, specific surface area of B-Cal and N-Cal were calculated by Brunauer-Emmett-Teller nitrogen adsorption-desorption analysis to be 0.83 and 15.8 m2/g, respectively (Table 1), showing larger specific surface area for N-Cal. Surface charges of B-Cal and N-Cal dispersed in DW, as determined using zeta potentials, were −2.98 mV and +16.37 mV, respectively (Figure S4). When zeta potential was measured in aqueous suspensions at different pH, N-Cal had higher zeta potential than B-Cal by 10–20 mV in pH range from 6 to 13 (data not shown). The positive zeta potential value of N-Cal at alkaline pH was in good agreement with that found in a previous study by Amankonah and Somasundaran.30
In vitro interactions between the calcium carbonates and biological substances
Biological interactions were evaluated in simulated plasma and gastric and intestinal fluids. Time-dependent changes in the crystalline phases of B-Cal and N-Cal treated with these fluids were monitored by XRD patterns. As shown in Figure 1, the crystallinities and crystalline phases of B-Cal and N-Cal were determined to be well preserved in simulated body fluids, regardless of particle size or fluid conditions. However, it is noteworthy that new peaks (* in Figure 1) in the 2θ range of 10°–15° were observed in all samples treated with simulated fluids, and that peaks evolved in a time-independent manner. The peak was assigned to (202) diffraction, the biggest diffraction peak of dicalcium phosphate dihydrate (CaHPO4·2H2O; JCPDS No 72-0713). Furthermore, the evolution of this CaHPO4 phase was remarkable in N-Cal when incubation time in simulated fluids was extended to 24 and 48 hours (Figure S5), indicating that N-Cal was partially transformed to CaHPO4 during incubation under physiological conditions. The evolution of this CaHPO4 phase in simulated body fluids was also confirmed by X-ray absorption near edge spectra at calcium K-edge (Figure S6). Untreated B-Cal and N-Cal showed an edge position at 4,037.9 eV, which corresponds to calcite containing six coordinated Ca2+.31 After 48 hours incubation in simulated body fluids, the edge positions of N-Cal shifted to 4,038.8; 4,038.2; and 4,038.6 eV in plasma and in gastric and intestinal fluids, respectively. Similarly, those of B-Cal shifted to 4,038.8; 4,038.6; and 4,038.8, respectively. The K-edge position of calcium is known to be correlated with coordination number; CaHPO4 (coordination number 7.5) and hydroxyapatite (coordination number 8.4) have K-edges at 4,039.0 and 4,038.2 eV, respectively. Thus, a shift in K-edge position to higher energy confirmed the evolution of a calcium phase with a coordination number >6, such as calcium phosphate.
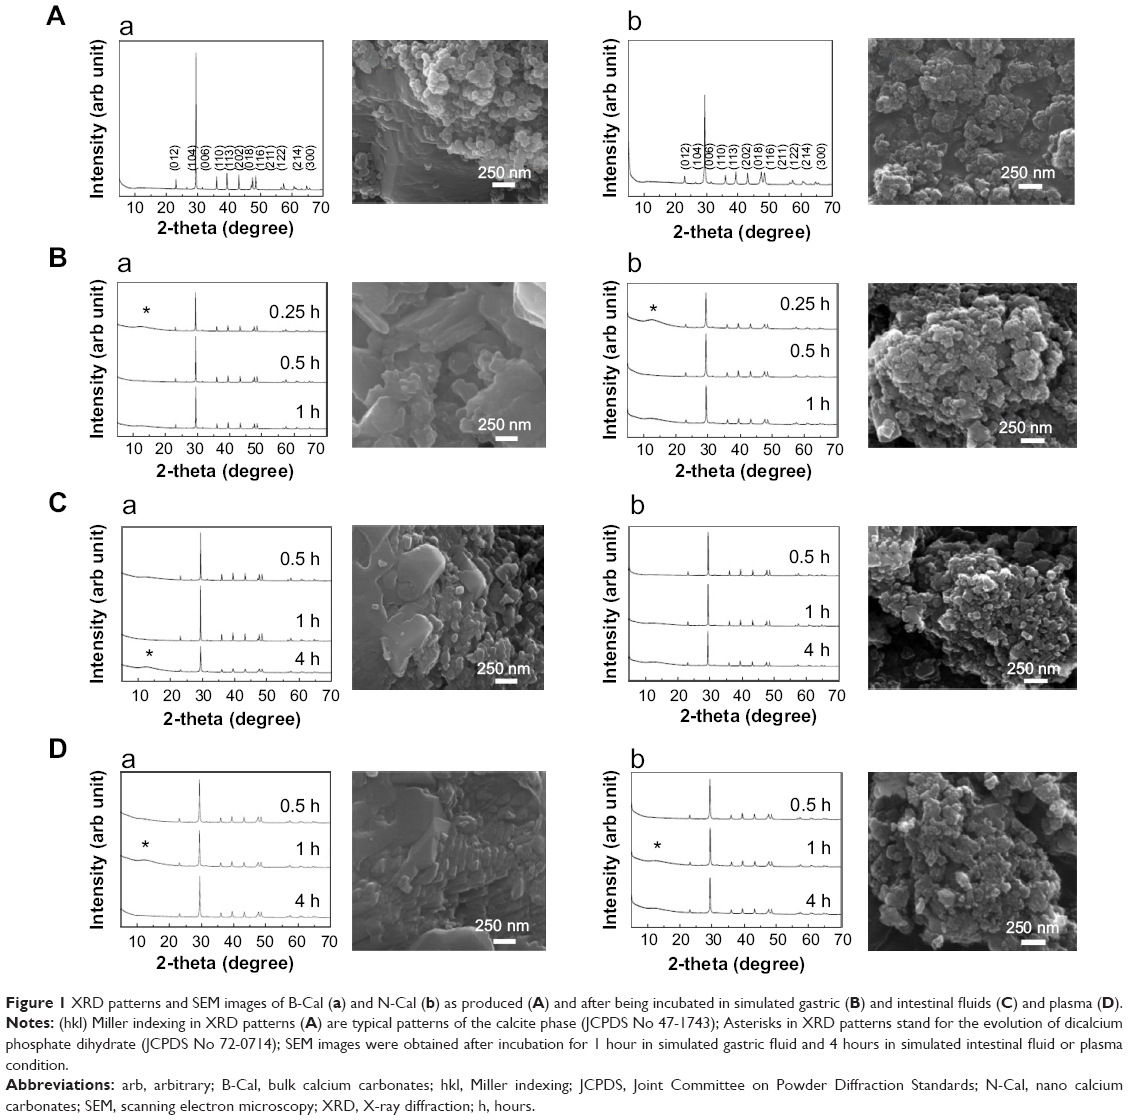 | Figure 1 XRD patterns and SEM images of B-Cal (a) and N-Cal (b) as produced (A) and after being incubated in simulated gastric (B) and intestinal fluids (C) and plasma (D). |
SEM images of CaCO3 after incubation in simulated body fluids are provided in Figure 1. No significant change in primary particle sizes was observed (Figure 1A), but CaCO3 particle surfaces became more rounded compared with untreated ones, possibly due to the surface interaction between CaCO3 and biological substances.
The in vitro dissolution characteristics of B-Cal and N-Cal are summarized in Table 2. Both showed <1% dissolution in simulated gastric fluid, and much low levels of dissolution were observed in simulated intestinal fluid and plasma. The dissolution order of both B-Cal and N-Cal in these fluids was gastric > plasma > intestine. It is interesting to note that no significant difference was observed between the in vitro dissolution characteristics of B-Cal and N-Cal.
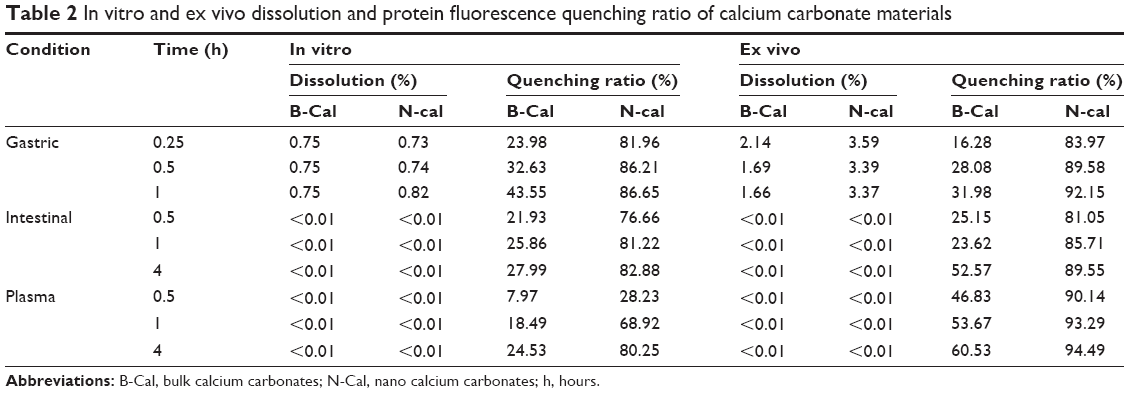 | Table 2 In vitro and ex vivo dissolution and protein fluorescence quenching ratio of calcium carbonate materials |
The protein quenching ratios of B-Cal and N-Cal in the simulated body fluids are provided in Table 2. These results showed a clear particle size difference; that is, N-Cal interacted more so with protein species, and B-Cal showed a maximum quenching ratio of ~43% in gastric fluid, whereas N-Cal exhibited strong quenching up to ~80% in all simulated body fluids. Furthermore, quenching ratios were higher for simulated gastric and intestinal fluids than for plasma condition.
Ex vivo interactions between the calcium carbonates and tissue fluids
As was observed in vitro, the evolution of dicalcium phosphate dihydrate was observed when B-Cal or N-Cal was exposed to ex vivo GI fluids or plasma (Figure S7). Interestingly, ex vivo results showed more dicalcium phosphate dihydrate evolution in N-Cal than in B-Cal.
The particle sizes and morphologies of B-Cal and N-Cal were not changed by incubation with ex vivo GI fluids or plasma as determined by SEM (Figure S8), which was consistent with our in vitro results, although B-Cal particle surfaces were smoothed by exposure. On the other hand, N-Cal incubated with tissue fluids seemed to form agglomerates, but particle sizes and morphologies were well preserved. The ex vivo dissolution studies demonstrated that ~2.1% and 3.6% of B-Cal and N-Cal dissolved in gastric fluid, respectively (Table 2). On the other hand, their dissolutions were fairly low (<0.01%) in intestinal fluid and plasma.
The ex vivo protein fluorescence quenching assay showed that N-Cal had a higher fluorescence quenching ratio than B-Cal as in in vitro results (Table 2). B-Cal showed maximum quenching ratios of ~30%, ~50%, and ~60% in gastric fluid, intestinal fluid, and plasma, respectively, in a time-dependent manner. Whereas, N-Cal exhibited quenching ratios of up to ~90% in GI fluids and plasma, even after incubation for a short time of 0.25 hour. This result shows N-Cal interacted more strongly with proteins from the thermodynamic and kinetic standpoints. It is worth noting that ex vivo quenching ratios were generally greater than in vitro ratios.
In vivo biological interactions and the fates of calcium carbonates
We evaluated in vivo phase transformations and morphological changes in B-Cal and N-Cal by XRD and SEM after administering a single dose orally to rats. Both calcite and dicalcium phosphate dihydrate were found by XRD in B-Cal and N-Cal exposed to gastric and intestinal fluids (Figure S9). As GI fluid might contain chemical species resulting from animal feed, we also checked the XRD patterns of gastric and intestinal fluids before administering B-Cal or N-Cal as controls. These XRD patterns also showed the presence of calcite phase in control GI fluid, and its diffraction increased at 0.25 hour postadministration and then gradually decreased. However, the intestinal fluid of rats administered N-Cal showed no evidence of the calcite phase after 4 hours. It was interesting that phase transformation occurred in B-Cal and N-Cal exposed to GI fluid.
The morphologies, shapes, and sizes of B-Cal and N-Cal in GI fluids after oral administration were analyzed by SEM (Figure S10). Because samples contained various bioorganic moieties as well as CaCO3 (Figure S1B), EDS spectra were analyzed to confirm the existence of CaCO3 (data not shown). B-Cal in gastric and intestinal fluids was present as large particles (a few micrometers in size) with fairly smooth surfaces as compared with the untreated control. N-Cal showed primary particle sizes of tens of nanometers, like the untreated material. As compared with N-Cal incubated in simulated body fluids and ex vivo tissue extracts, particles found in the GI fluids following oral administration showed much smoother surfaces. Despite changes in surface smoothness and morphology, the particulate morphologies and original particle sizes of B-Cal and N-Cal were preserved in vivo in GI fluid.
The dissolution characteristics of B-Cal and N-Cal were measured in gastric and intestinal fluids following oral administration. At 15 minutes after oral administration, B-Cal and N-Cal had dissolved by 4.59% and 7.33%, respectively, in gastric fluid. This high dissolution of N-Cal was also found in gastric fluid at 30 minutes after administration (0.85% and 3.15% for B-Cal and N-Cal, respectively). Slightly higher calcium levels were found in intestinal fluid at 1 hour after administration (1.27%±0.23% and 1.81%±0.37% for B-Cal and N-Cal, respectively). On the other hand, fluorescence quenching analysis of gastric and intestinal fluids or plasma after oral administration showed no decrease in fluorescence intensity as compared with untreated organ fluids (data not shown).
Calcium carbonate-plasma protein coronas
Plasma protein bindings to CaCO3 as determined by 1D gel electrophoresis are shown in Figure 2A. The results showed that bindings of plasma proteins to B-Cal and N-Cal differed. Further protein binding analysis by 2D gel electrophoresis showed a similar tendency (Figure 2B). However, a clear difference in binding profiles of the two materials was observed, as was expected; proteins were more actively adsorbed on N-Cal than B-Cal. Proteins that bound to B-Cal and N-Cal on 2D gels were identified by mass spectrometry, according to molecular weight and isoelectric point. The most abundant plasma proteins detected in coronas are presented in Table 3. Immunoglobulin light chain was determined to be the most abundantly bound protein on both B-Cal and N-Cal, and 13 proteins were found to be components of coronas on B-Cal and N-Cal. Meanwhile, protein binding profiles did not match relative protein levels in plasma. Serum albumin, which was most abundant in plasma, was found on only B-Cal and was 11th in terms of abundance. Immunoglobulin, apolipoprotein, thrombin, and fibrinogen were found to be the major protein components of coronas.
 | Figure 2 Plasma protein binding profiles of calcium carbonates separated by one-dimensional (A), and two-dimensional (B), gel electrophoresis. |
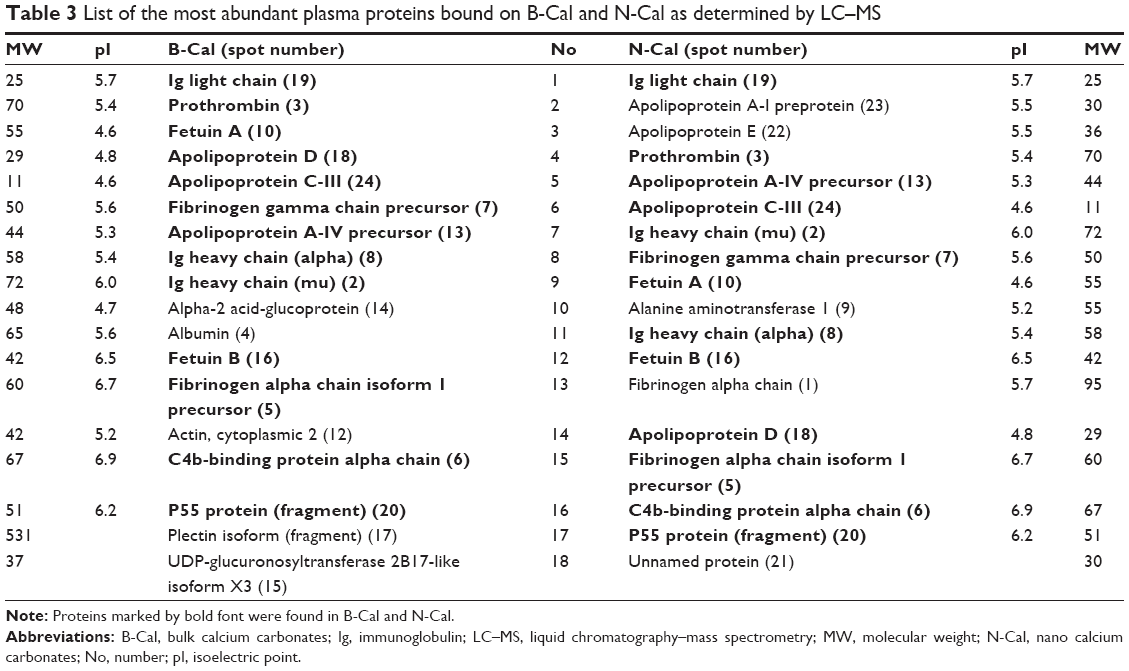 | Table 3 List of the most abundant plasma proteins bound on B-Cal and N-Cal as determined by LC–MS |
Biokinetics and oral absorption of B-Cal and N-Cal
The plasma concentration-time profiles of B-Cal and N-Cal in rats after a single oral dose are presented in Figure 3A–D. Increased plasma calcium concentrations were determined by subtracting control plasma calcium levels from total plasma calcium levels, as determined by ICP-AES. Peak concentrations were observed at 1 and 2 hours postadministration for N-Cal and B-Cal, respectively, with no effect due to sex of the animal, and these concentrations then decreased rapidly within 4 hours. Biokinetic parameters, obtained from Figure 3, showed significantly higher Cmax values for N-Cal than B-Cal (Table 4). However, other parameters such as the AUC, T1/2, and MRT values of B-Cal and N-Cal were similar. After 14 days of daily dosing, similar results were obtained (Figure 3; Table 4). Tmax values for N-Cal and B-Cal were 1 and 2 hours, respectively, and high Cmax values were obtained for N-Cal, whereas, T1/2 and MRT values were slightly higher for B-Cal. It should be noted that no abnormal behaviors, symptoms, or body weight changes were observed during the 14-day treatment period. Absorption amounts calculated based on AUC values are presented in Table 4. About 4%–5% of B-Cal and N-Cal entered the blood stream, and this was unaffected by particle size, sex, or number of treatments.
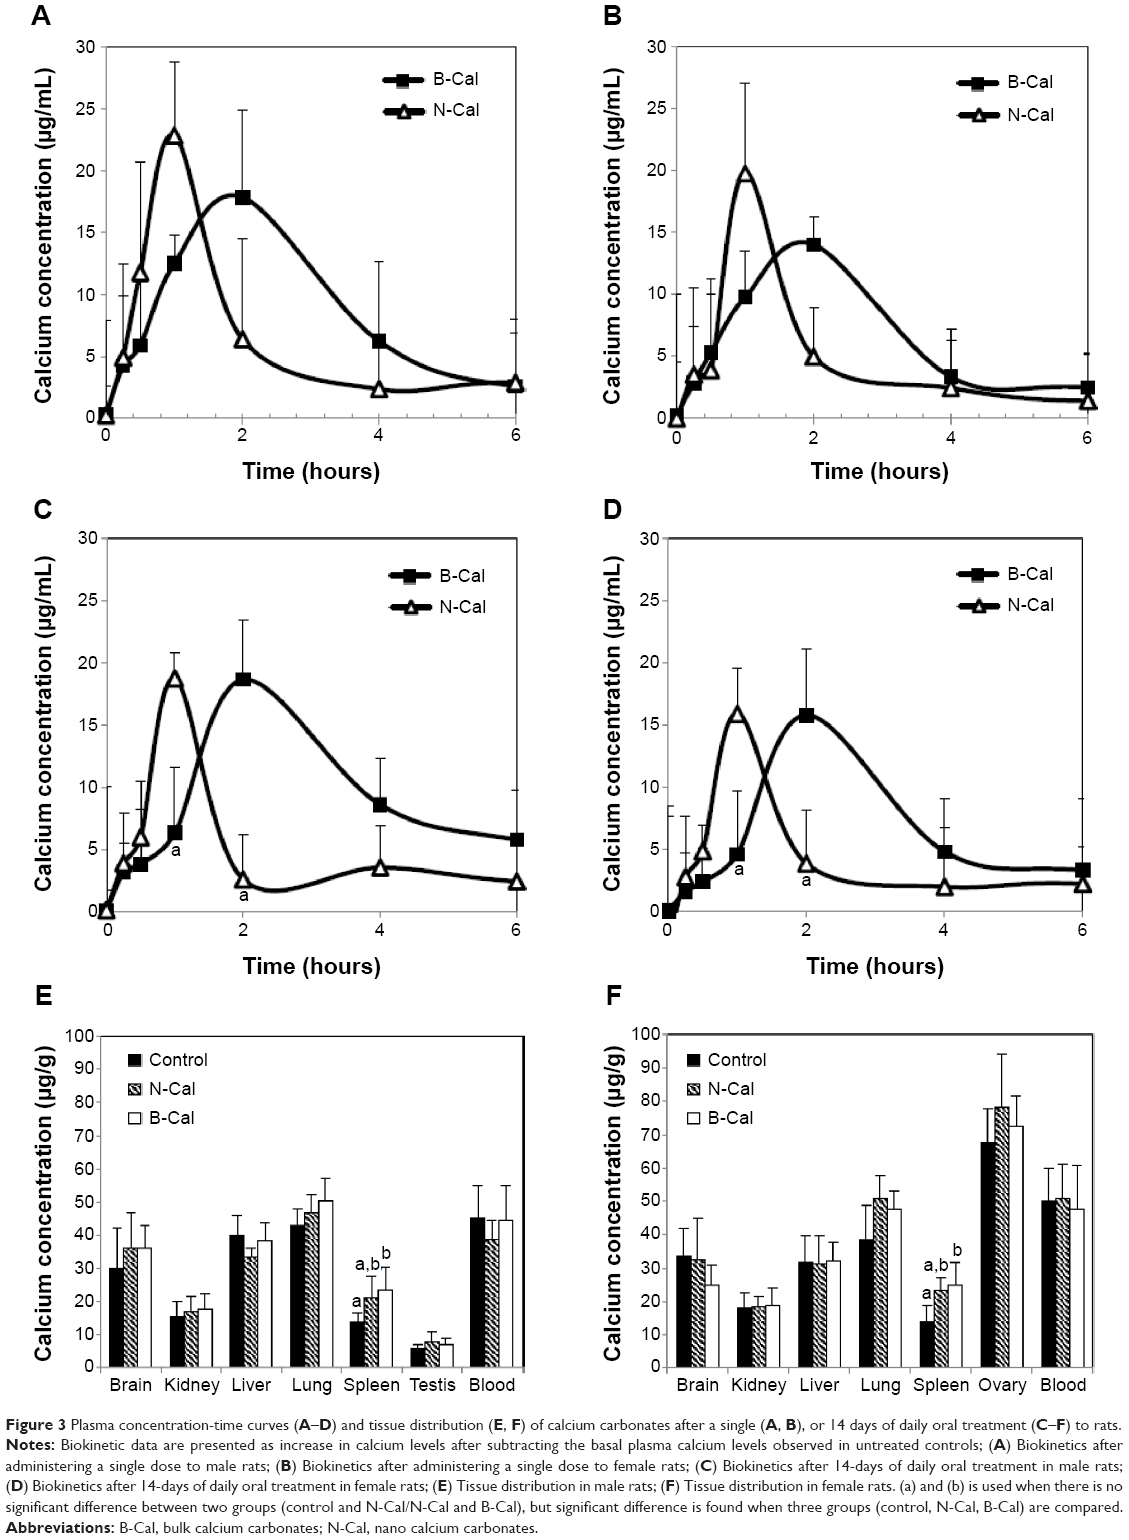 | Figure 3 Plasma concentration-time curves (A–D) and tissue distribution (E, F) of calcium carbonates after a single (A, B), or 14 days of daily oral treatment (C–F) to rats. |
 | Table 4 Biokinetic parameters and absorption of calcium carbonates after oral administration to rats |
Tissue distribution patterns of B-Cal and N-Cal were evaluated in blood, brain, kidneys, liver, lungs, spleen, and ovaries or testis after 14-day repeated oral administration (Figure 3E–F). Significant increases in total calcium concentrations were observed only in the spleens of rats administered B-Cal or N-Cal. No accumulation was observed in any other organ.
Discussion
Increasing attention is being focused on nanomaterials in the food industry, in order to enhance the oral absorption efficiencies and bioavailabilities of nutraceuticals, nutrients and bioactive molecules. N-Cal has been developed to increase the low oral absorption of calcium. However, the question as to whether the bioavailabilities of nanosized CaCO3 are greater than those with larger particle sizes remains to be answered. Moreover, the effects of protein corona formation on bioavailability need to be elucidated.
In this study, we evaluated the physicochemical properties, biological interactions, fates, and biokinetics of bulk and nanosized CaCO3. B-Cal and N-Cal had the same calcite crystalline phase and similar chemical properties, but they had different particle sizes, size distributions, morphologies, and suspension properties in aqueous media. B-Cal had both small primary particles (~40 nm) and large particles (a few micrometers) and a heterogeneous size distribution in aqueous suspension with large agglomerates. On the other hand, N-Cal showed a homogeneous size distribution of primary size ~30 nm in both powder and suspension states, with a slight tendency to form agglomerates. The specific surface areas of B-Cal and N-Cal were 0.83 and 15.8 m2/g, respectively, showing larger specific surface area for nanosized sample. Furthermore, their Z-average values were 7,363 and 2,187 nm, respectively, which suggested quite different particle sizes in aqueous suspension. The zeta potential of N-Cal was positive in DW, as has been previously reported,30 while that of B-Cal was almost zero, which suggested the presence of a surface charge neutralizing organic moiety on the surface of B-Cal particles, as was also shown by infrared spectra (Figure S1; Table 1). Seashells have been reported to be composed of calcite–protein composites, in particular, with negatively charged proteins like conchiolin, thus neutralizing positively charged calcites to some extent under physiological condition.32 These organic impurities may be not fully removed during the manufacturing process for B-Cal. Because the biological behaviors of materials are mainly governed by their surface interactions with biomatrices, the different zeta potentials, particle sizes, and specific surface areas of B-Cal and N-Cal could influence their interactions and biokinetic characteristics in physiological systems.
According to our results regarding biological interactions in 1) in vitro simulated body fluids, 2) rat ex vivo GI fluid and plasma, and 3) the in vivo GI fluid of rats administered B-Cal and N-Cal, CaCO3 was partially transformed to dicalcium phosphate dihydrate in physiological fluids in vitro, ex vivo, and in vivo, as determined by XRD analysis. Decreases in peak intensity or the disappearance of the calcite diffraction peak in ex vivo and in vivo biofluids might have been caused by the disappearance of CaCO3 due to digestion, phase transformation, or dissolution. The evolution of the calcium phosphate phase from CaCO3 could importantly explain its biological behavior because the solubility product constants (Ksp) of calcium phosphate (Ksp =2.07×10⁻³³ at 25°C) is much smaller than that of calcite (Ksp =3.36×10⁻⁹ at 25°C). Furthermore, the formation of calcium phosphate on the surface of calcite could inhibit the further dissolution of Ca2+ and contribute to its low oral absorption. It should be noted that CaCO3 must be dissolved to enter the circulatory system as Ca2+.6 According to our in vitro dissolution test result (Table 2), much higher dissolutions of both B-Cal and N-Cal were found in gastric fluid than in intestinal fluid or plasma. The higher dissolution of CaCO3 under gastric condition is in good agreement with previous reports on pH dependent dissolution of CaCO3.33–35 On the other hand, the dissolution of Ca2+ was not significantly higher for N-Cal in vitro, whereas N-Cal was dissolved markedly more by ex vivo and in vivo fluids, in-line with expectation based on its considerably larger specific surface area (specific surface area =15.8 m2/g versus 0.83 m2/g). It is likely that in vitro simulated fluids do not completely reflect in vivo biological conditions, and thus caution is required to interpret in vitro results.
The particle size and morphology of N-Cal were generally well preserved in biological fluids, which was in good agreement with the low dissolution of Ca2+, although the particles found in all biofluids showed a smooth surface. The morphologic change of inorganic materials from a rough to a smooth surface is often observed when inorganic materials are covered with organic moieties.36–38 Thus, the smooth surfaces of B-Cal and N-Cal in physiological fluids observed in the present study could have been due to corona formation.
CaCO3 can interact with proteins to cause fluorescence quenching of proteins, particularly in in vitro and ex vivo systems, as shown in other nanoparticles.14,39,40 Biological interactions between particles and proteins were more obvious for N-Cal than B-Cal based on fluorescence quenching assay results (Table 2); N-Cal had a three to four times higher quenching ratio. These results could be explained by the different specific surface areas of B-Cal and N-Cal and their different surface charges. Small particles with large specific surface area could interact more vigorously with proteins. Furthermore, proteins are generally a few nanometers long, which would tend to facilitate their interactions with particles tens of nanometers. In terms of surface charge, N-Cal with the positive zeta potential showed more effective interactions with proteins. The isoelectric points of albumin and pepsin are 4.7 and 1.0, respectively, and thus both would be attracted to the surface of positively charged N-Cal. Hence, both particle size and surface charge play critical roles in interaction between particles and biomatrices. On the other hand, no significant change in fluorescence intensities in GI fluid or plasma was observed after oral administration, suggesting that the interaction between CaCO3 and biological matrices was not strong in vivo, which contradicts our in vitro and ex vivo results. This may be closely related to dynamic GI fluidic condition containing various organic/inorganic biomatrices and major ionic uptake of CaCO3 in the blood stream.
Ex vivo proteomics analysis revealed that N-Cal interacts more actively with plasma proteins, as demonstrated by much high amount of adsorbed proteins on nanoparticles (Figure 2). In addition, the profiles of binding proteins differed for B-Cal and N-Cal, suggesting that biological interactions were dependent on particle size. It should be noted that different surface charge between B-Cal and N-Cal can also play a role in biological interaction. Because almost all plasma proteins are negatively charged in physiological fluids as shown in Table 3, positively charged N-Cal seems to interact more actively with plasma proteins. Furthermore, protein corona profiles were not matched by relative protein compositions in plasma, as has been reported by others.18 Interestingly, albumin, the most abundant protein in plasma, interacted only with B-Cal and at a relatively low level. Hu et al reported that serum albumin bound to 400 nm Fe3O4 particles, but not to 30 or 200 nm particles,41 which concurs with our results. According to our LC-MS/MS results, immunoglobulin, apolipoprotein, thrombin, and fibrinogen are important components of CaCO3-plasma protein coronas, regardless of particle size. It is worth noting that immunoglobulin participates in opsonization,42 promoting phagocytosis, and that this may be related to the accumulation of CaCO3 in spleen (Figure 3). Thrombin and fibrinogen are involved in coagulation and also have an impact on the immune system.43,44 In the present study, apolipoproteins were found to bind strongly to CaCO3, especially N-Cal. Apolipoproteins bind lipids or cholesterol to form lipoproteins and eventually transport lipids in the circulatory system.45 It has been reported that apolipoproteins are a major protein component of the plasma proteins adsorbed onto the hydrophobic surfaces of particles.46 Apolipoproteins have been also reported to bind to many types of nanoparticles, such as, titanium dioxide, silicon dioxide, zinc oxide, iron oxide, hydrocarbonized porous silicon, and polymer nanoparticles.15,18,30,46 Taken together, plasma protein coronas appear to form in a particle size-dependent manner, and this may affect the transport and delivery of CaCO3 to target organs.
Biokinetic data showed rapid absorption of N-Cal as compared with B-Cal, based on its low Tmax values (Table 4). B-Cal entered the blood stream more slowly, but the AUC values of the two materials were not significantly different. It is worth noting that high N-Cal dissolution was observed in ex vivo and in vivo fluids. Different dissolutions of B-Cal and N-Cal surely affect absorption at the systemic level since the oral absorption of CaCO3 is known to be highly dependent on the release of Ca2+ under acidic conditions and its absorption by intestinal epithelium. In particular, in vivo high dissolution of N-Cal during the early period of postadministration is likely to be closely related to the faster absorption of N-Cal than B-Cal, as shown in Figure 3 and Table 4. However, the high dissolution of N-Cal did not enhance its total oral absorption, indicating that increased dissolution did not influence absorption efficacy, but rather, it determined absorption rate. Therefore, it is probable that N-Cal dissolves more rapidly than B-Cal in GI fluid, but that they are similar in terms of the release of total calcium ions over time. Meanwhile, the 4%–5% oral absorption of CaCO3 was highly correlated to their in vivo dissolutions, which suggests that most CaCO3 primarily enter the circulatory system as calcium ions, not as particulate forms. This result corresponds well to the known oral absorption of CaCO3 (about 4%),4 which supports it uptake as the calcium ion. On the other hand, the ionic fate of CaCO3 in the blood stream might explain the result that no particle–protein interaction was observed in vivo. After 14 days of daily dosing, the oral absorptions of B-Cal and N-Cal did not increase, indicating that even N-Cal did not accumulate in the systemic circulation. Our tissue distribution study of CaCO3 was also consistent with their biokinetics, showing no accumulation in organs, except spleen, even after repeated administration. The slight increase in calcium levels in spleen might have been associated with particle uptake by mononuclear phagocyte system.
Conclusion
In the present study, the physicochemical properties, biological interactions, fates, and the biokinetics of food grade CaCO3 of different particle sizes, that is, bulk and nano, were evaluated. Partial phase transformation to dicalcium phosphate dihydrate was observed in both N-Cal and B-Cal particles, which is explained by the dissolution property of CaCO3 to release Ca2+ and then form CaHPO4. Both B-Cal and N-Cal remained in the particulate form in vitro and in vivo, regardless of particle size, although slight surface smoothing was observed in biological systems due to corona formation. N-Cal was found to interact more with proteins than B-Cal in in vitro and ex vivo systems, which seems to be related to its small particle size and positive surface charge, but the protein–particle interaction was not evident in vivo. Analysis of the adsorbed plasma proteins on B-Cal and N-Cal revealed that immunoglobulins, apolipoproteins, thrombins, and fibrinogens play important roles in protein corona formation, regardless of particle size. Our biokinetic study demonstrated that N-Cal was more rapidly absorbed into the systemic circulation, but that total oral absorption was unaffected by particle size. It is likely that rapid dissolution of N-Cal after early time of postadministration affects the absorption rate, but not the absorption efficiency. Meanwhile, the oral absorption of B-Cal and N-Cal matched to their dissolution properties, suggesting that most CaCO3 are likely to be absorbed as dissolved Ca2+. The ionic fate of CaCO3 at the systemic level may explain the fact that plasma protein corona formed differently by B-Cal and N-Cal in vitro and ex vivo had little effect on their absorption and distribution in vivo. However, particle–protein interactions can importantly determine the biokinetics of nanoparticles that are able to enter the blood stream as particulate forms. Taken together, we conclude that CaCO3 nanoparticles can function more actively with biological matrices in vitro and ex vivo, but that in vivo their biological interactions and biokinetics are not affected by particle size.
Acknowledgments
This research was supported by a grant (13182MFDS608) from the Ministry of Food and Drug Safety in 2013 and by Basic Science Research Program through the National Research Foundation of Korea (NRF) funded by the Ministry of Science, ICT, and Future Planning (2013R1A1A3009283).
Disclosure
The authors report no conflicts of interest in this work.
References
Reid IR, Ames RW, Evans MC, Gamble GD, Sharpe SJ. Effect of calcium supplementation on bone loss in postmenopausal women. N Engl J Med. 1993;328(7):460–464. | ||
White E, Shannon JS, Patterson RE. Relationship between vitamin and calcium supplement use and colon cancer. Cancer Epidemiol Biomarkers Prev. 1997;6(10):769–774. | ||
Porter C. Vitamin and mineral supplements: part 1. The Rx Consultant. 2003;12:1–8. | ||
Hanzlik RP, Fowler SC, Fisher DH. Relative bioavailability of calcium from calcium formate, calcium citrate, and calcium carbonate. J Pharmacol Exp Ther. 2005;313(3):1217–1222. | ||
Decktor DL, Robinson M, Maton PN, Lanza FL, Gottlieb S. Effects of aluminum/magnesium hydroxide and calcium carbonate on esophageal and gastric pH in subjects with heartburn. Am J Ther. 1995;2(8):546–552. | ||
Bo-Linn GW, Davis GR, Buddrus DJ, Morawski SG, Santa Ana C, Fordtran JS. An evaluation of the importance of gastric acid secretion in the absorption of dietary calcium. J Clin Invest. 1984;73(3):640–647. | ||
Park YD, Kim SY, Jang HS, et al. Towards a proteomic analysis of atopic dermatitis: a two-dimensional-polyacrylamide gel electrophoresis/mass spectrometric analysis of cultured patient-derived fibroblasts. Proteomics. 2004;4(11):3446–3455. | ||
Chen HS, Chang JH, Wu JS. Calcium bioavailability of nanonized pearl powder for adults. J Food Sci. 2008;73(9):H246–H251. | ||
Park HS, Jeon BJ, Ahn J, Kwak HS. Effects of nanocalcium supplemented milk on bone calcium metabolism in ovariectomized rats. Asian-australas J Anim Sci. 2007;20:1266–1271. | ||
Huang S, Chen JC, Hsu CW, Chang WH. Effects of nano calcium carbonate and nano calcium citrate on toxicity in ICR mice and on bone mineral density in an ovariectomized mice model. Nanotechnology. 2009;20(37):375102. | ||
Shahnazari M, Martin BR, Legette LL, Lachcik PJ, Welch J, Weaver CM. Diet calcium level but not calcium supplement particle size affects bone density and mechanical properties in ovariectomized rats. J Nutr. 2009;139(7):1308–1314. | ||
Nel AE, Mädler L, Velegol D, et al. Understanding biophysicochemical interactions at the nano-bio interface. Nat Mater. 2009;8(7):543–557. | ||
Tenzer S, Docter D, Kuharev J, et al. Rapid formation of plasma protein corona critically affects nanoparticle pathophysiology. Nat Nanotechnol. 2013;8(10):772–781. | ||
Aggarwal P, Hall JB, McLeland CB, Dobrovolskaia MA, McNeil SE. Nanoparticle interaction with plasma proteins as it relates to particle biodistribution, biocompatibility and therapeutic efficacy. Adv Drug Deliv Rev. 2009;61(6):428–437. | ||
Sarparanta M, Bimbo LM, Rytkönen J, et al. Intravenous delivery of hydrophobin-functionalized porous silicon nanoparticles: stability, plasma protein adsorption and biodistribution. Mol Pharm. 2012;9(3):654–663. | ||
Kreuter J, Shamenkov D, Petrov V, et al. Apolipoprotein-mediated transport of nanoparticle-bound drugs across the blood–brain barrier. J Drug Target. 2002;10(4):317–325. | ||
Lundqvist M, Stigler J, Elia G, Lynch I, Cedervall T, Dawson KA. Nanoparticle size and surface properties determine the protein corona with possible implications for biological impacts. Proc Natl Acad Sci U S A. 2008;105(38):14265–14270. | ||
Tenzer S, Docter D, Rosfa S, et al. Nanoparticle size is a critical physicochemical determinant of the human blood plasma corona: a comprehensive quantitative proteomic analysis. ACS Nano. 2011;5(9):7155–7167. | ||
Burgi BR, Pradeep T. Societal implications of nanoscience and nanotechnology in developing countries. Curr Sci. 2006;90:645–658. | ||
Salata O. Applications of nanoparticles in biology and medicine. J Nanobiotechnology. 2004;2(1):3. | ||
Albanese A, Tang PS, Chan WC. The effect of nanoparticle size, shape, and surface chemistry on biological systems. Annu Rev Biomed Eng. 2012;14:1–16. | ||
Shukla R, Bansal V, Chaudhary M, Basu A, Bhonde RR, Sastry M. Biocompatibility of gold nanoparticles and their endocytotic fate inside the cellular compartment: a microscopic overview. Langmuir. 2005;21(23):10644–10654. | ||
Harush-Frenkel O, Debotton N, Benita S, Altschuler Y. Targeting of nanoparticles to the clathrin-mediated endocytic pathway. Biochem Biophys Res Commun. 2007;353(1):26–32. | ||
Choi SJ, Choy JH. Layered double hydroxide nanoparticles as target-specific delivery carriers: uptake mechanism and toxicity. Nanomedicine (Lond). 2011;6(5):803–814. | ||
Govers MJ, Van der Meet R. Effects of dietary calcium and phosphate on the intestinal interactions between calcium, phosphate, fatty acids, and bile acids. Gut. 1993;34(3):365–370. | ||
Peacock M. Calcium metabolism in health and disease. Clin J Am Soc Nephrol. 2010;5(Suppl 1):S23–S30. | ||
Gobom J, Nordhoff E, Mirgorodskaya E, Ekman R, Roepstorff P. Sample purification and preparation technique based on nano-scale reversed-phase columns for the sensitive analysis of complex peptide mixtures by matrix-assisted laser desorption/ionization mass spectrometry. J Mass Spectrom. 1999;34(2):105–116. | ||
Adler HH, Kerr PF. Infrared study of aragonite and calcite. Am Mineral. 1962;47:700–717. | ||
Horiba Scientific [webpage on the Internet]. Available from: http://www.horiba.com/scientific/products/particle-characterization/education/sz-100/particle-size-by-dynamic-light-scattering-resources/what-is-z-average/. Accessed Dec 16, 2014. | ||
Amankonah JO, Somasundaran P. Effects of dissolved mineral species on the electrokinetic behavior of calcite and apatite. Colloid Surf. 1985;15:335–353. | ||
Sowrey FE, Skipper LJ, Pickup DM, et al. Systematic empirical analysis of calcium–oxygen coordination environment by calcium K-edge XANES. Phys Chem Chem Phys. 2004;6:188–192. | ||
Bowen CE, Tang H. Conchiolin-protein in aragonite shells of mollusk. Comp Biochem Physiol. 1996;115A:269–275. | ||
Compton RG, Unwin PR. The dissolution of calcite in aqueous solution at pH. 4: kinetics and mechanism. Phil Trans R Soc Lond A. 1990;330:1–45. | ||
De Giudici GD. Surface control vs. diffusion control during calcite dissolution: dependence of step-edge velocity upon solution pH. Am Mineral. 2002;87:1279–1285. | ||
Kurapati R, Raichur AM. Composite cyclodextrin-calcium carbonate porous microparticles and modified multilayer capsules: novel carriers for encapsulation of hydrophobic drugs. J Mater Chem B. 2013;1:3175–3184. | ||
Díez-Pascual AM, Díez-Vicente AL. Poly(3-hydroxybutyrate)/ZnO bionanocomposites with improved mechanical, barrier and antibacterial properties. Int J Mol Sci. 2014;15(6):10950–10973. | ||
Geng Z, He J. An effective method to significantly enhance the robustness and adhesion-to-substrate of high transmittance superamphiphobic silica thin films. J Mater Chem A. 2014;2:16601–16607. | ||
Islam M, Chidembo AT, Aboutalebi SH, et al. Liquid crystalline graphene oxide/PEDOT: PSS self-assembled 3D architecture for binder-free supercapacitor electrodes. Front Energy Res. 2014;2:31. Available from: http://journal.frontiersin.org/Journal/10.3389/fenrg.2014.00031/full. Accessed February 13, 2015. | ||
Lacerda SH, Park JJ, Meuse C, et al. Interaction of gold nanoparticles with common human blood proteins. ACS Nano. 2010;4(1):365–379. | ||
Lai L, Lin C, Xu ZQ, et al. Spectroscopic studies on the interaction between CdTe quantum dots coated with different ligands and human serum albumin. Spectrochim Acta A. 2012;97:366–376. | ||
Hu Z, Zhang H, Zhang Y, Wu R, Zou H. Nanoparticle size matters in the formation of plasma protein coronas on Fe3O4 nanoparticles. Colloids Surf B Biointerfaces. 2014;121:354–361. | ||
Bjornson AB, Bjornson HS. Participation of immunoglobulin and the alternative complement pathway in opsonization of Bacteroides fragilis and Bacteroides thetaiotaomicron. J Infect Dis. 1978;138(3):351–358. | ||
Gorbet MB, Sefton MV. Biomaterial-associated thrombosis: roles of coagulation factors, complement, platelets and leukocytes. Biomaterials. 2004;25(26):5681–5703. | ||
Markiewski MM, Nilsson B, Ekdahl KN, Mollnes TE, Lambris JD. Complement and coagulation: strangers or partners in crime? Trends Immunol. 2007;28(4):184–192. | ||
Oram JF, Yokoyama S. Apolipoprotein-mediated removal of cellular cholesterol and phospholipids. J Lipid Res. 1996;37(12):2473–2491. | ||
Deng ZJ, Mortimer G, Schiller T, Musumeci A, Martin D, Minchin RF. Differential plasma protein binding to metal oxide nanoparticles. Nanotechnology. 2009;20(45):455101. |
Supplementary materials
 | Figure S1 XRD patterns (A) and FT-IR spectra (B) of (a) B-Cal and (b) N-Cal. |
 | Figure S2 SEM images for the produced B-Cal (A, C) and N-Cal (B, D). |
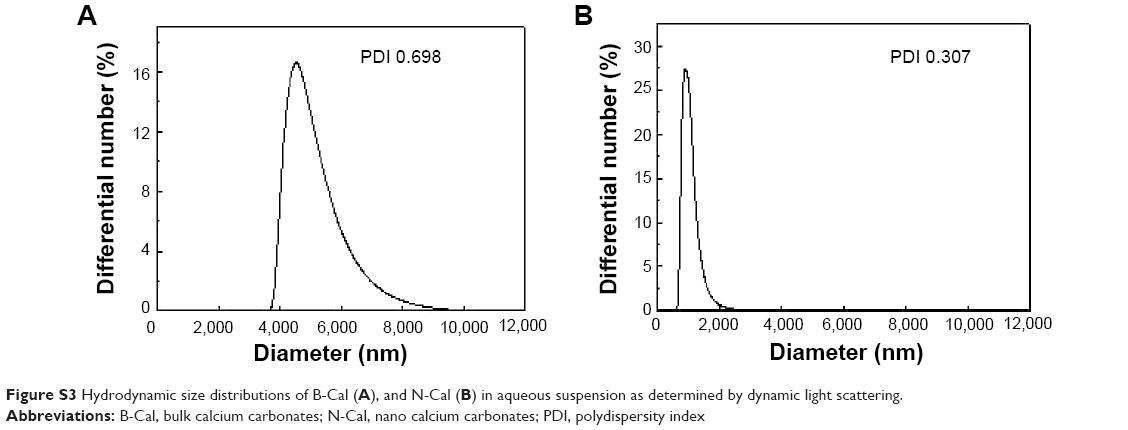 | Figure S3 Hydrodynamic size distributions of B-Cal (A), and N-Cal (B) in aqueous suspension as determined by dynamic light scattering. |
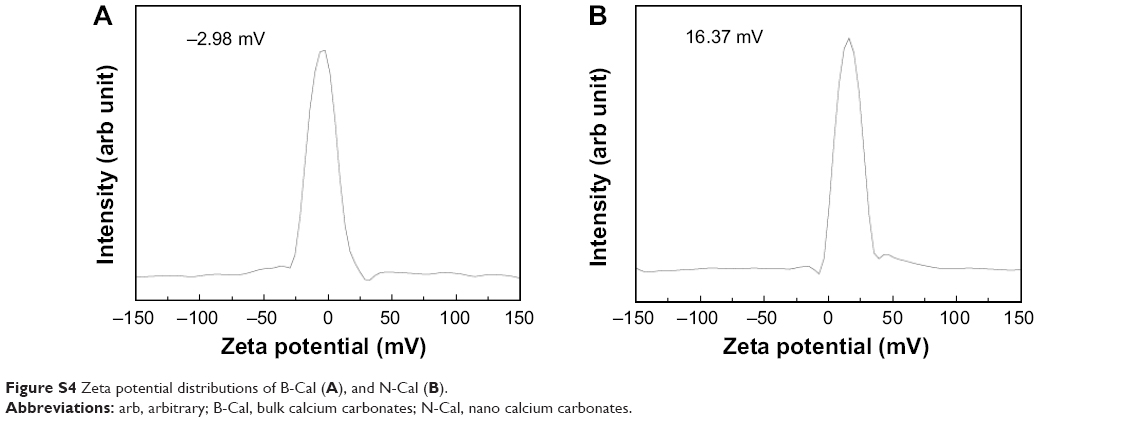 | Figure S4 Zeta potential distributions of B-Cal (A), and N-Cal (B). |
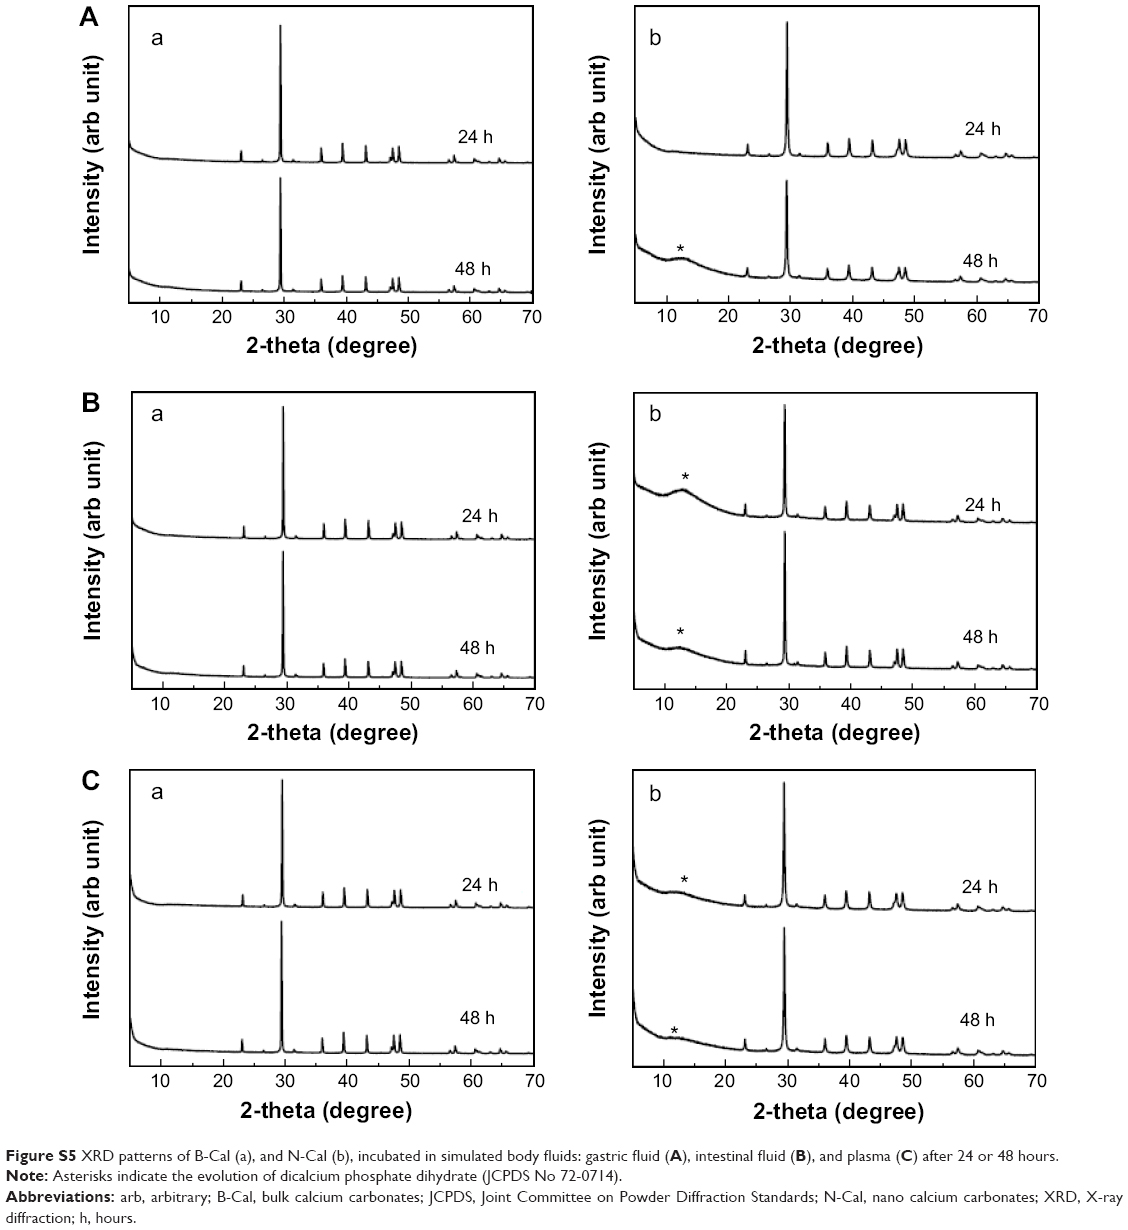 | Figure S5 XRD patterns of B-Cal (a), and N-Cal (b), incubated in simulated body fluids: gastric fluid (A), intestinal fluid (B), and plasma (C) after 24 or 48 hours. |
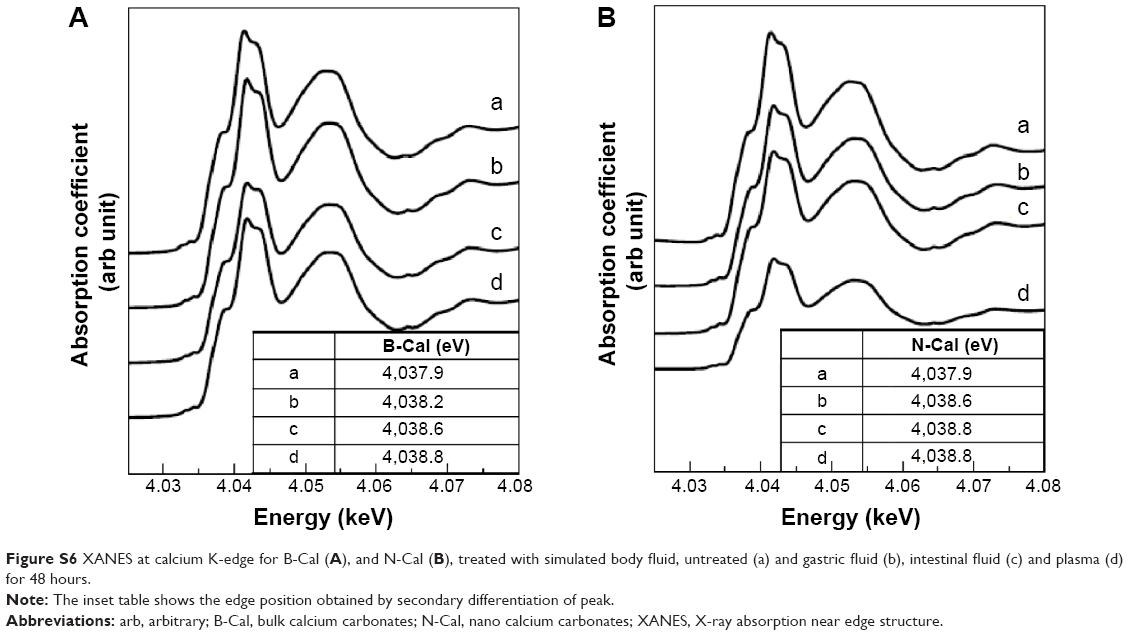 | Figure S6 XANES at calcium K-edge for B-Cal (A), and N-Cal (B), treated with simulated body fluid, untreated (a) and gastric fluid (b), intestinal fluid (c) and plasma (d) for 48 hours. |
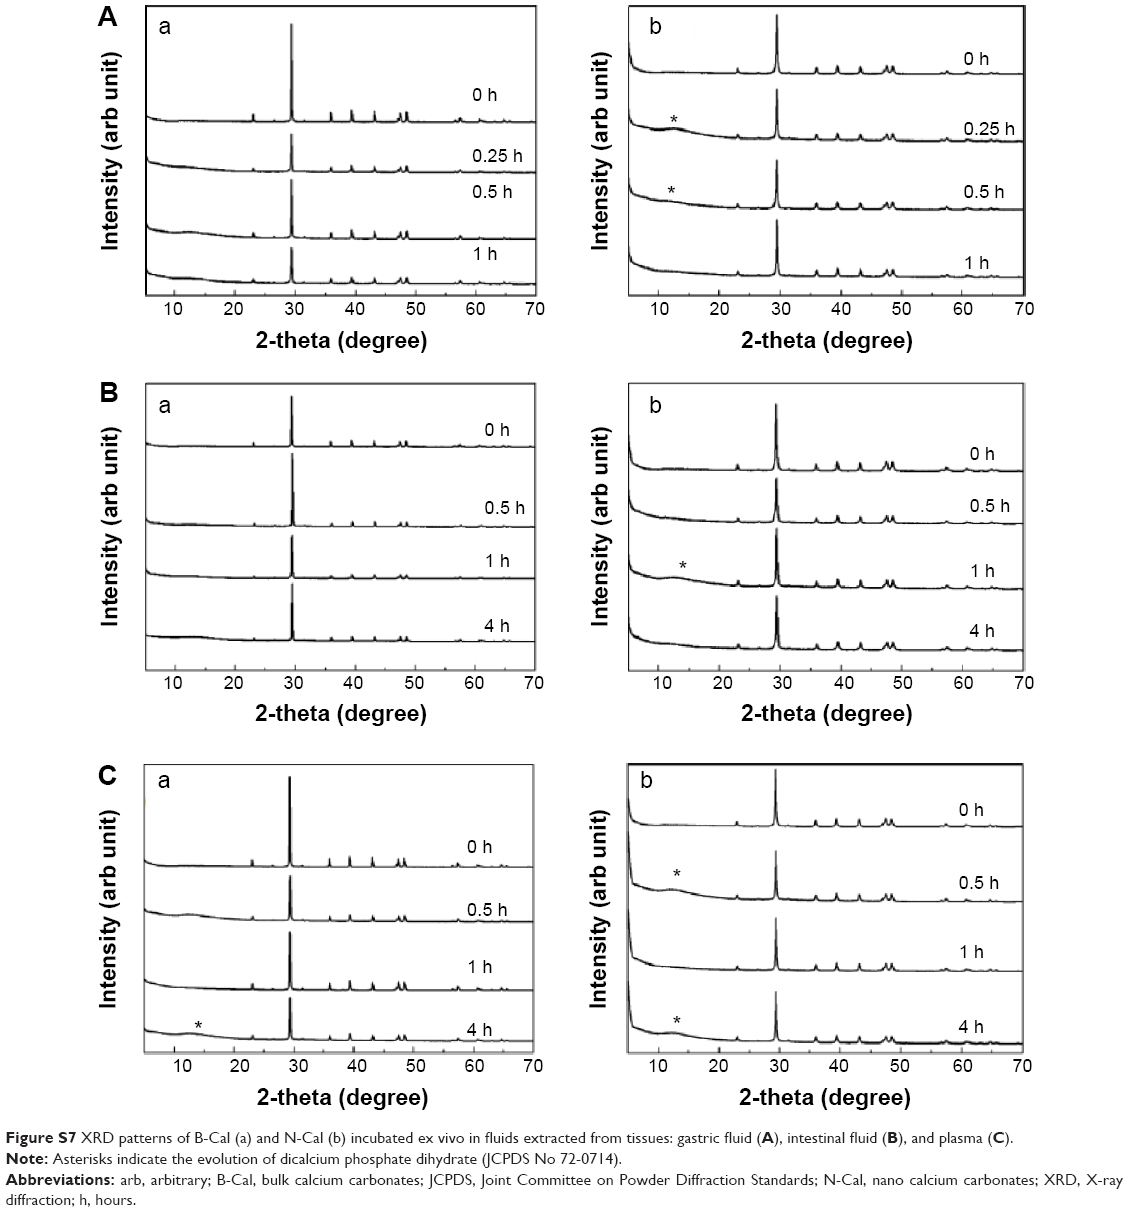 | Figure S7 XRD patterns of B-Cal (a) and N-Cal (b) incubated ex vivo in fluids extracted from tissues: gastric fluid (A), intestinal fluid (B), and plasma (C). |
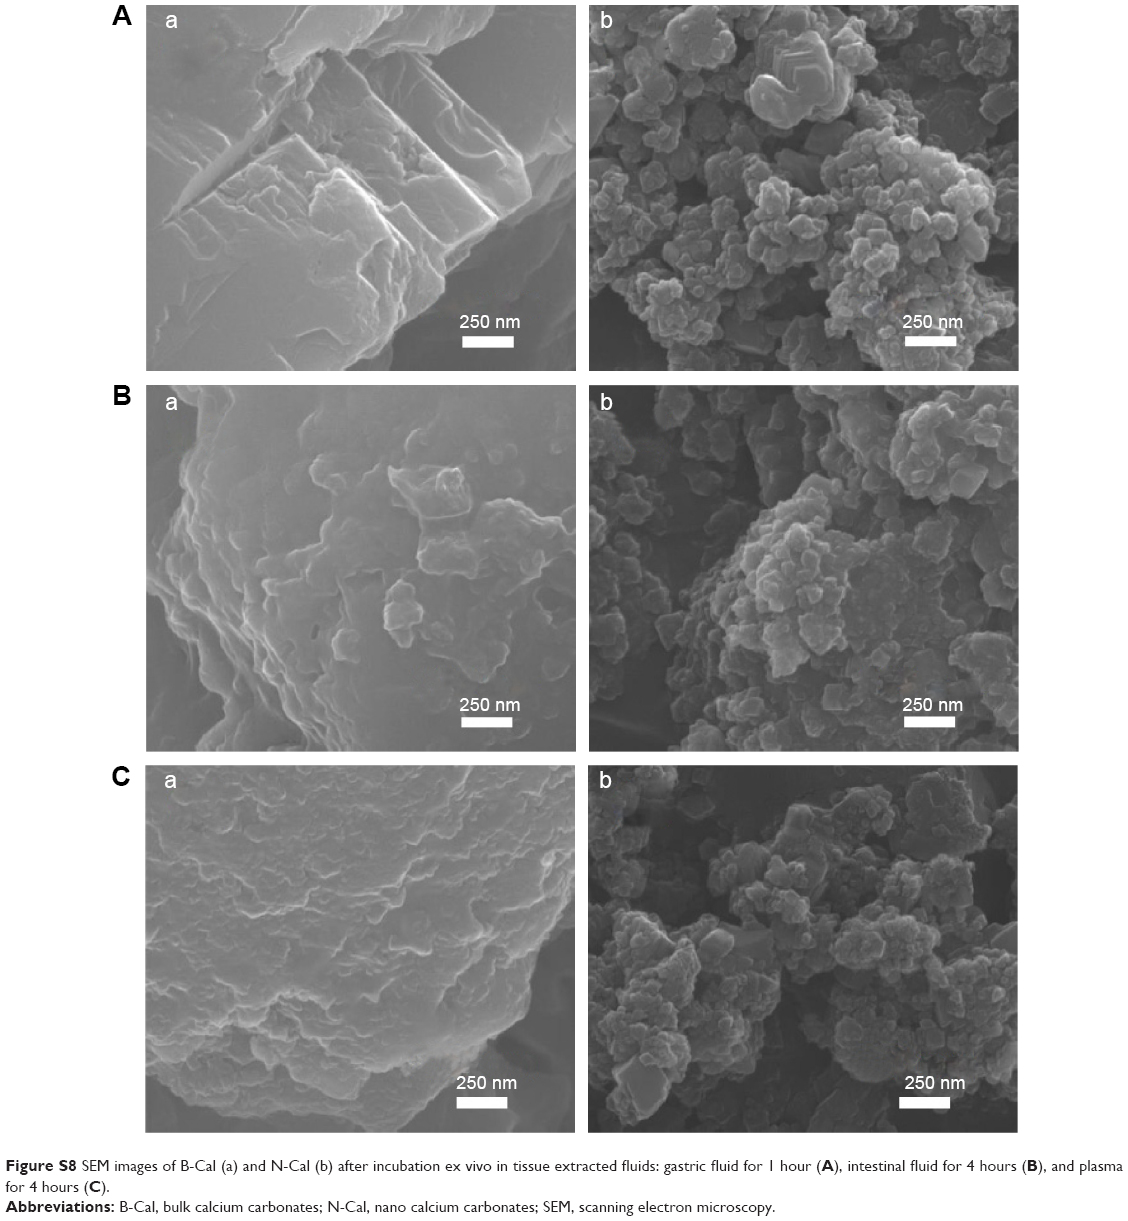 | Figure S8 SEM images of B-Cal (a) and N-Cal (b) after incubation ex vivo in tissue extracted fluids: gastric fluid for 1 hour (A), intestinal fluid for 4 hours (B), and plasma for 4 hours (C). |
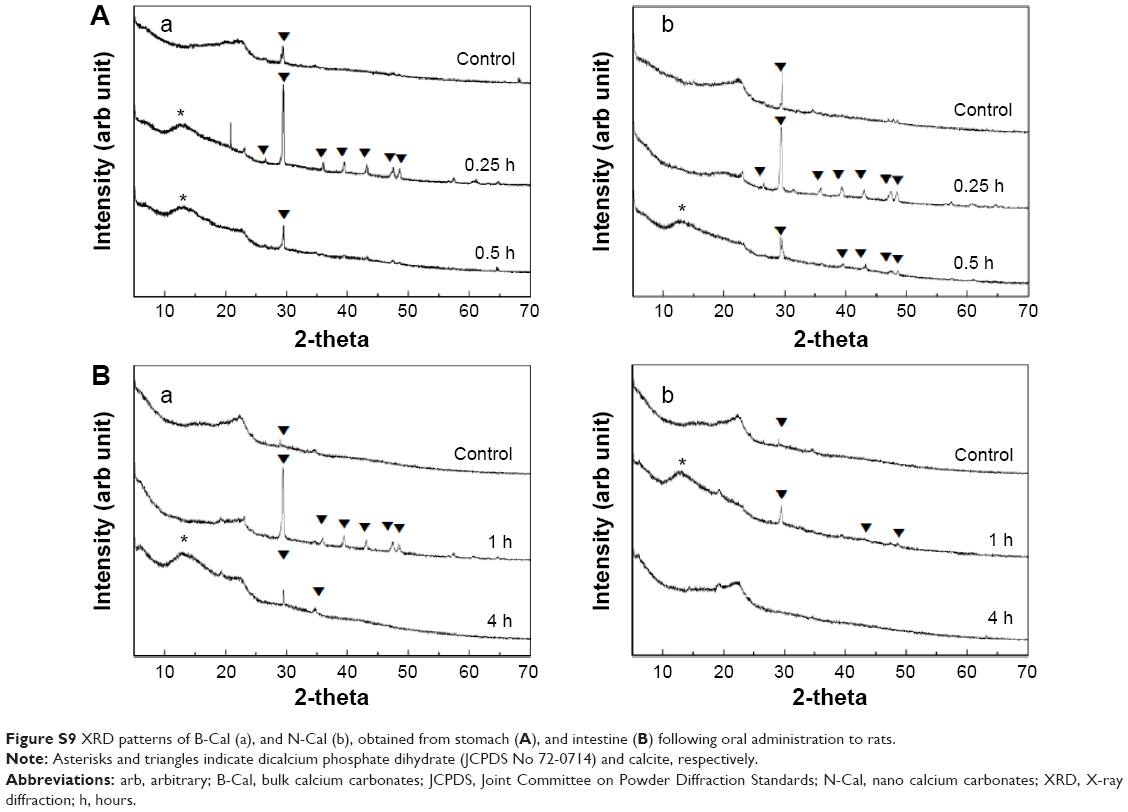 | Figure S9 XRD patterns of B-Cal (a), and N-Cal (b), obtained from stomach (A), and intestine (B) following oral administration to rats. |
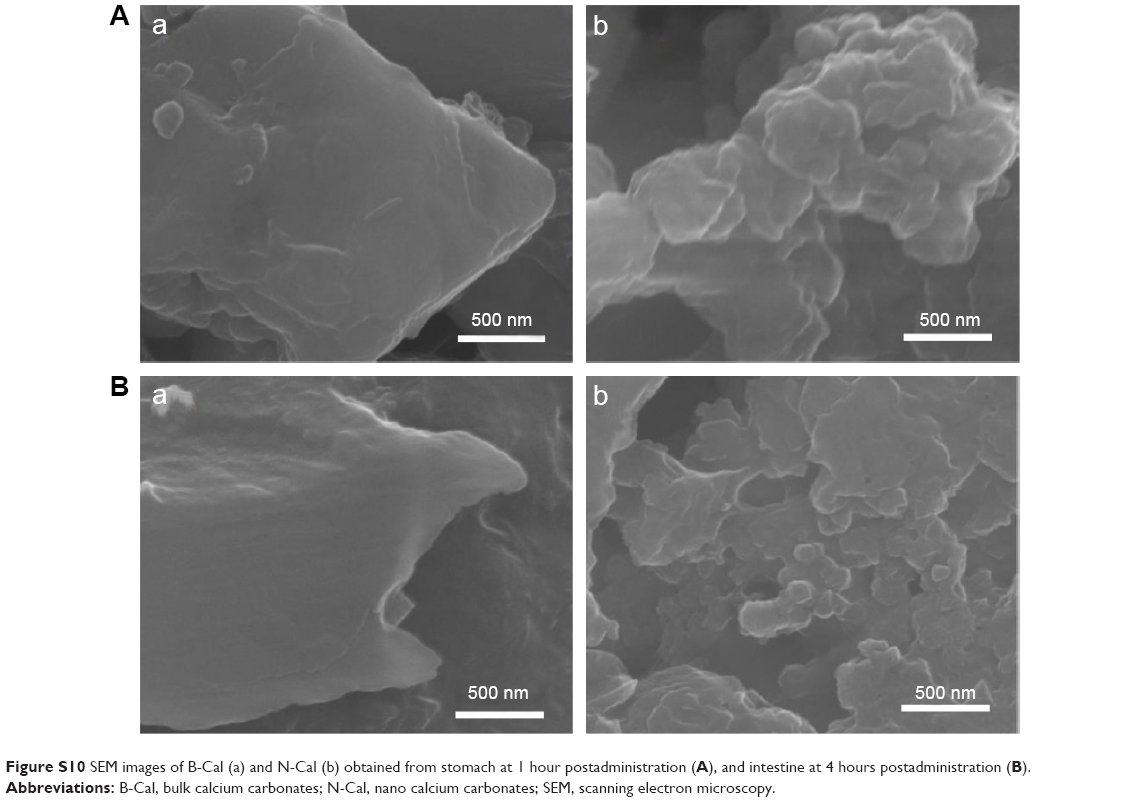 | Figure S10 SEM images of B-Cal (a) and N-Cal (b) obtained from stomach at 1 hour postadministration (A), and intestine at 4 hours postadministration (B). |
 © 2015 The Author(s). This work is published and licensed by Dove Medical Press Limited. The full terms of this license are available at https://www.dovepress.com/terms.php and incorporate the Creative Commons Attribution - Non Commercial (unported, v3.0) License.
By accessing the work you hereby accept the Terms. Non-commercial uses of the work are permitted without any further permission from Dove Medical Press Limited, provided the work is properly attributed. For permission for commercial use of this work, please see paragraphs 4.2 and 5 of our Terms.
© 2015 The Author(s). This work is published and licensed by Dove Medical Press Limited. The full terms of this license are available at https://www.dovepress.com/terms.php and incorporate the Creative Commons Attribution - Non Commercial (unported, v3.0) License.
By accessing the work you hereby accept the Terms. Non-commercial uses of the work are permitted without any further permission from Dove Medical Press Limited, provided the work is properly attributed. For permission for commercial use of this work, please see paragraphs 4.2 and 5 of our Terms.