")
Back to Journals » Therapeutics and Clinical Risk Management » Volume 11
Target-controlled infusion and population pharmacokinetics of landiolol hydrochloride in patients with peripheral arterial disease
Authors Kunisawa T , Yamagishi A, Suno M, Nakade S, Honda N, Kurosawa A, Sugawara A, Tasaki Y, Iwasaki H
Received 24 September 2014
Accepted for publication 13 October 2014
Published 17 January 2015 Volume 2015:11 Pages 107—114
DOI https://doi.org/10.2147/TCRM.S74867
Checked for plagiarism Yes
Review by Single anonymous peer review
Peer reviewer comments 2
Editor who approved publication: Professor Garry Walsh
Takayuki Kunisawa,1 Akio Yamagishi,2 Manabu Suno,3 Susumu Nakade,4 Naoki Honda,4 Atsushi Kurosawa,2 Ami Sugawara,2 Yoshikazu Tasaki,5 Hiroshi Iwasaki2
1Surgical Operation Department, Asahikawa Medical University Hospital, Asahikawa, Japan; 2Department of Anesthesiology and Critical Care Medicine, Asahikawa Medical University, Asahikawa, Japan; 3Department of Oncology Pharmaceutical Care and Sciences, Okayama University, Okayama, Japan; 4Pharmacokinetic Research Laboratories, Ono Pharmaceutical Co., Ltd., Osaka, Japan; 5Department of Hospital Pharmacy and Pharmacology, Asahikawa Medical University, Asahikawa, Japan
Purpose: We previously determined the pharmacokinetic (PK) parameters of landiolol in healthy male volunteers and gynecological patients. In this study, we determined the PK parameters of landiolol in patients with peripheral arterial disease.
Methods: Eight patients scheduled to undergo peripheral arterial surgery were enrolled in the study. After inducing anesthesia, landiolol hydrochloride was administered at target plasma concentrations of 500 and 1,000 ng/mL for 30 minutes each. A total of 112 data points of plasma concentration were collected from the patients and used for the population PK analysis. A population PK model was developed using a nonlinear mixed-effect modeling software program (NONMEM).
Results: The patients had markedly decreased heart rates at 2 minutes after initiation of landiolol hydrochloride administration; however, systolic blood pressures were lower than the baseline values at only five time points. The concentration time course of landiolol was best described by a two-compartment model with lag time. The estimates of PK parameters were as follows: total body clearance, 30.7 mL/min/kg; distribution volume of the central compartment, 65.0 mL/kg; intercompartmental clearance, 48.3 mL/min/kg; distribution volume of the peripheral compartment, 54.4 mL/kg; and lag time, 0.633 minutes. The predictive performance of this model was better than that of the previous model.
Conclusion: The PK parameters of landiolol were best described by a two-compartment model with lag time. Distribution volume of the central compartment and total body clearance of landiolol in patients with peripheral arterial disease were approximately 64% and 84% of those in healthy volunteers, respectively.
Keywords: landiolol hydrochloride, pharmacokinetics, target-controlled infusion, peripheral arterial disease, TCI, pharmacokinetic parameters, PAD
Introduction
Landiolol hydrochloride is a newly developed cardioselective, ultra-short-acting β1-adrenergic receptor blocking agent that has been used in the emergency management of atrial fibrillation, atrial flutter, and tachycardia, as well as for perioperative arrhythmia control.1,2 Landiolol has a short half-life (~4 minutes) and high cardioselectivity (β1/β2=255). Since the dose–response relationship has already been proven, the standard maintenance dose is selected on the basis of the dose indicated on the package insert (10–40 μg/kg/min). However, a lower dose of landiolol hydrochloride has been reported to be effective,3 suggesting variations in sensitivity to the drug. However, whether the efficacy of landiolol is attributable to pharmacokinetics (PK) or pharmacodynamics (PD) is still unknown, because information on the landiolol PK in high-risk patients is lacking. Recently, we determined that PK parameters of landiolol in low-risk gynecological patients are similar to those in healthy volunteers;4 however, PK parameters in high-risk patients are still unknown. Therefore, in order to address the above question, we designed the present study with the purpose of determining the PK parameters of landiolol in patients with peripheral arterial disease (PAD).
Methods
Clinical methodology
This study was approved and supervised by the Research Ethics Committee of Asahikawa Medical University (Asahikawa, Japan) and registered with the UMIN Clinical Trials Registry (UMIN000015077). Informed consent was obtained from each patient. Eight patients scheduled to undergo peripheral arterial surgery were enrolled. The inclusion criteria for our study were as follows: age greater than 20 years, weight less than 80 kg, and an American Society of Anesthesiologists (ASA) physical status score of 2 or 3. Patients with arrhythmias, such as atrial fibrillation or disturbance of the conduction system, or who had received α-methyldopa, clonidine, or beta-blockers, were excluded.
The patients were fasted beginning at midnight prior to the study and received no premedication. On arrival at the study site, an 18-gauge (G) intravenous catheter was inserted in the forearm and a 20-G intravenous catheter in the dorsum of the hand for the administration of landiolol hydrochloride and other drugs, respectively. A 500 mL solution of Ringer’s acetate was initially infused via both catheters for 30 minutes, followed by infusions at the rate of 60 mL/h via the 18-G and 80 mL/h via the 20-G catheter. A 20-G catheter was inserted into the radial artery to collect blood samples for analysis of plasma landiolol concentrations. General anesthesia was induced and maintained using target-controlled infusion (TCI) of propofol and remifentanil. Propofol was administered using a Diprifusor (AstraZeneca plc, London, UK), and the target concentration of propofol was adjusted to maintain a bispectral index value of 40–60 (Aspect A2000 BIS Anesthesia Monitor; Nihon Kohden, Tokyo, Japan). Remifentanil was administered using the TCI system with a target effect-site concentration of 2 ng/mL. STANPUMP software (http://opentci.org/doku.php) was used to run the infusion pump (Graseby™ 3500 Syringe Pump; Smiths Medical, London, UK) with the Minto’s parameter setting.5 Rocuronium (0.6 mg/kg) was administered for intubation, and supplemental 10 mg doses were administered as necessary. Twenty minutes prior to the skin incision, the target effect-site concentration of remifentanil was increased to 8 ng/mL to avoid response to surgical stimuli. At the same time, 3 μg/kg/min of dopamine was administered for hemodynamic stability. After the skin incision was made, we ensured that the vital signs remained stable and started TCI of landiolol hydrochloride using a Harvard pump (Harvard Pump 22; Harvard Apparatus Co., South Natick, MA, USA) controlled by STANPUMP software with Honda et al’s parameter6 of the two-compartment model. Only landiolol was administered via the 18-G catheter, along with carrier water. The landiolol line was connected to the nearest port of the intravenous line to minimize dead space. Since the STANPUMP software cannot input lag time (ALAG), we used Honda et al’s parameter6 without ALAG. It is important to note that this method shifts the predicted plasma concentration curve toward left parallel,4 although the administration strategy does not change and PK analysis is not affected because the actual history of landiolol administration for PK analysis is used. TCI of landiolol hydrochloride was performed to achieve target plasma concentrations of 500 and 1,000 ng/mL (Figure 1). These concentrations were chosen to represent approximately 50% and 100% of the concentration during the highest clinical dosage.1 If the patients developed bradycardia (heart rate [HR] <45 beats per minute [bpm]), 0.5 mg of atropine was administered intravenously. If the bradycardia did not resolve, administration of landiolol was stopped and the study was terminated. If the patients developed hypotension (systolic blood pressure [BP] <80 mmHg or 20% less than the baseline value) accompanied by slight bradycardia (HR <60 bpm), 5 mg of ephedrine was administered intravenously. In cases of hypotension without bradycardia (HR ≥60 bpm), 0.05 mg of phenylephrine was administered. To avoid affecting the PD of landiolol, care was taken to avoid administering a bolus infusion of any cardiovascular agent (except for continuous infusion of dopamine) 5 minutes before and after changing the landiolol target concentration.
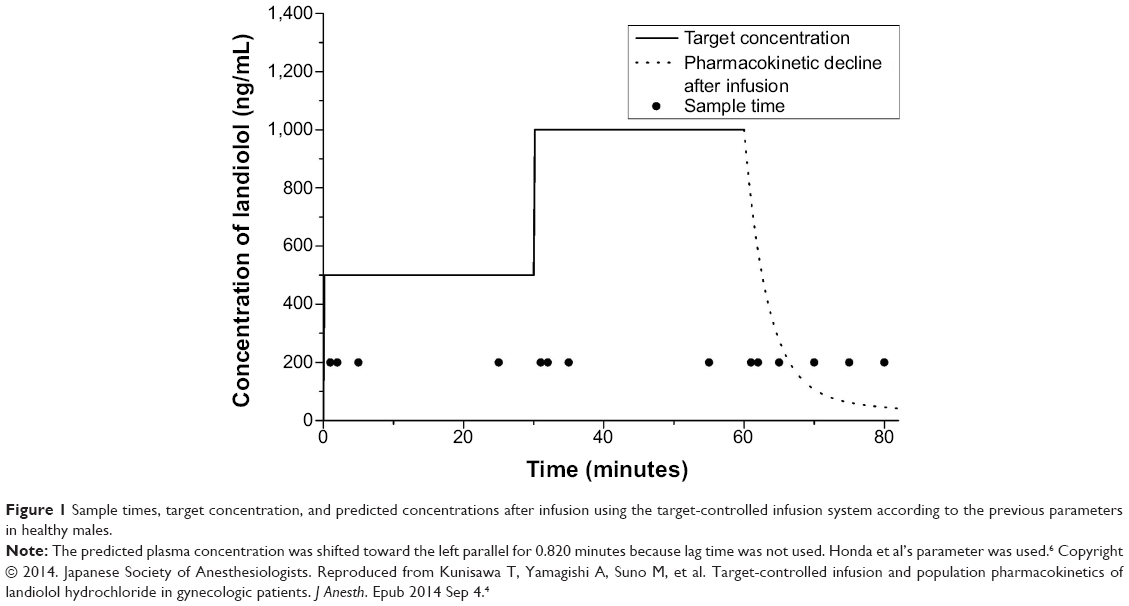 | Figure 1 Sample times, target concentration, and predicted concentrations after infusion using the target-controlled infusion system according to the previous parameters in healthy males. |
Blood sampling and landiolol assay
Landiolol hydrochloride was administered with a computer-controlled infusion pump. Concentrations were determined at 1, 2, 5, and 25 minutes after beginning the infusion; after changing target concentration; and at 1, 2, 5, 10, 15, and 20 minutes after termination of the infusion (Figure 1). One milliliter of whole blood was collected in a test tube filled with chilled ethanol and neostigmine. The neostigmine was drawn into the syringe in the presence of ethylenediaminetetraacetic acid disodium salt (EDTA-2Na) dust to prevent landiolol from being hydrolyzed by the pseudocholinesterase enzyme present in plasma. The plasma was collected after centrifugation at 1,600× g for 10 minutes and stored at -20°C until the landiolol concentration was assayed.7 The plasma samples were assayed using a high-performance liquid chromatography method with fluorescence detection, as reported by Suno et al.7
PK and PD analysis
One-way analysis of variance (ANOVA) was performed for overall comparison of the hemodynamic values. If the values showed a significant difference, a post hoc analysis using the Dunnett test was performed to compare the baseline value and values obtained after administration of landiolol hydrochloride.
The population PK model was developed using nonlinear mixed-effect modeling software (NONMEM, v VII, level 1.2; ICON Development Solutions, Ellicott City, MD, USA). First-order conditional estimation with the interaction method was used for parameter estimation. After investigation of one-, two-, and three-compartment models, the concentration time course of landiolol was best described by a two-compartment model. The model parameters were total body clearance ([CL] mL/min/kg), distribution volume of the central compartment ([V1] mL/kg), intercompartmental clearance ([Q] mL/min/kg), distribution volume of the peripheral compartment ([V2] mL/kg), and ALAG (minutes). The interindividual variability in the PK parameters of landiolol and residual variability were investigated using an exponential error model.
Starting from a simple compartment model, a variety of covariates that could influence the PK of landiolol were added, in a stepwise manner, to the basic model (forward selection method). An individual covariate was considered to improve the model significantly if the difference in the objective function value between the basic model and the tested model was greater than 3.84 (P<0.05). Covariates considered for inclusion in the model were subject demographic factors (body weight, lean body mass,8 and age). The influence of these covariates was treated as a continuous function. To confirm that the final model actually reflected the observed plasma concentrations, the predicted values were plotted against the observed values for the final model. The conditional weighted residuals were plotted against the predicted values, or against the time after the beginning of infusion. The adequacy of the present model was evaluated by a visual predictive check. The visual predictive check was generated using 1,000 simulations from the present model and its parameter estimates, including interindividual and residual variability. A graphical comparison was made between observed concentrations and the model-predicted concentrations (median, and the 5% and 95% prediction interval) over time. The percent performance error for each concentration was also determined, as follows:
([measured – predicted]/predicted ×100) | (1) |
The median performance error (MDPE), the median absolute performance error (MDAPE), and their 25th and 75th percentiles were determined. The MDPE and MDAPE represent the median bias of the model and the median accuracy of the prediction, respectively. These values for the previous and present models were compared.10
Results
The demographic information of the eight patients with PAD included in this study is shown in Table 1. The average age was 73 years (range, 64–84 years), and the average weight was 58.9 kg (range, 40.4–71.8 kg). A total of 112 plasma concentration data points were collected and used for the population PK analysis. The observed concentrations in each point are shown in Figure 2. The observed values showed a tendency to exceed the concentrations predicted in the previous model.6 The predicted values from the following model were closer to the observed values, especially immediately after the target concentration was increased. Hemodynamic values are shown in Figure 3. HR significantly decreased 2 minutes after starting the administration of landiolol hydrochloride and remained lower than the baseline HR until 20 minutes after the administration of landiolol hydrochloride ended. The systolic BP value was lower than the baseline value at 5 minutes after the start and also at 1, 2, 5, and 10 minutes after the end of landiolol hydrochloride administration. There was no significant change between the diastolic BP values at any particular time point compared to baseline values. None of the patients required administration of atropine or termination of the study. The amounts of ephedrine and phenylephrine administered were 10.6±6.8 mg (range, 5–20 mg) and 0.23±0.15 mg (range, 0–0.45 mg), respectively.
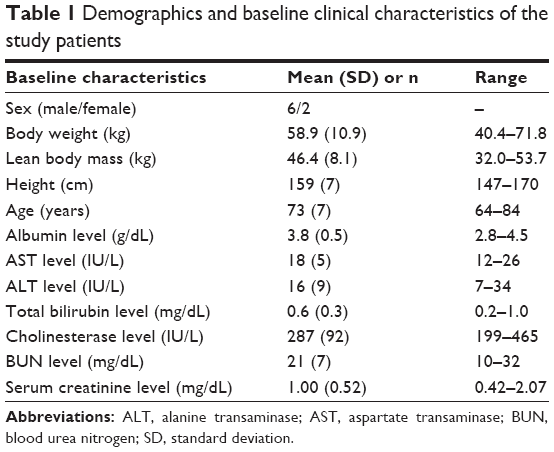 | Table 1 Demographics and baseline clinical characteristics of the study patients |
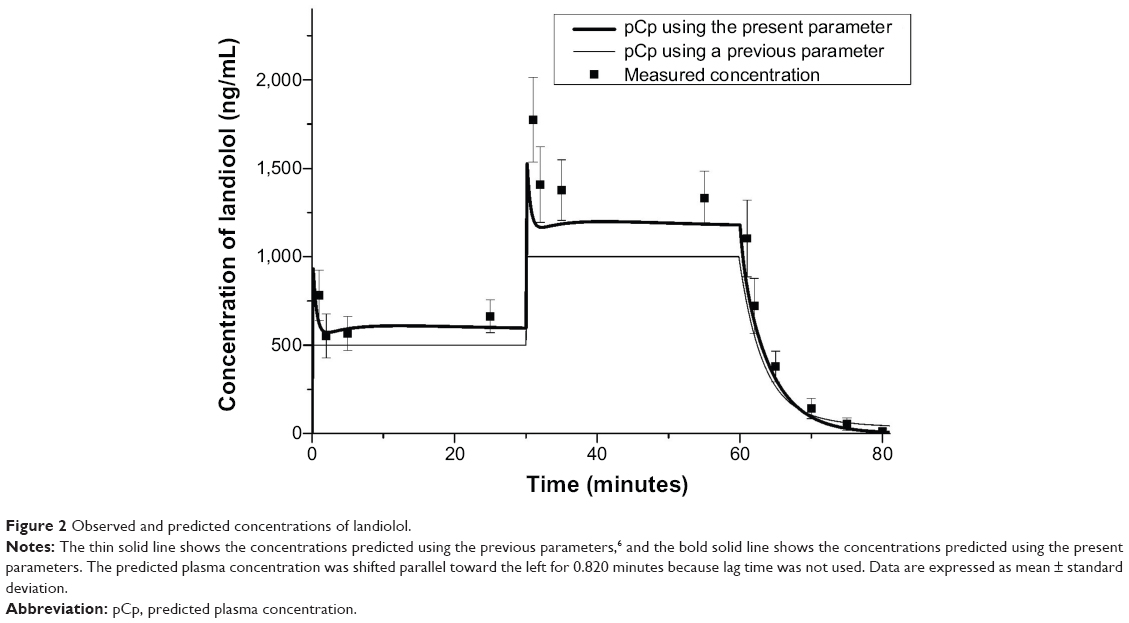 | Figure 2 Observed and predicted concentrations of landiolol. |
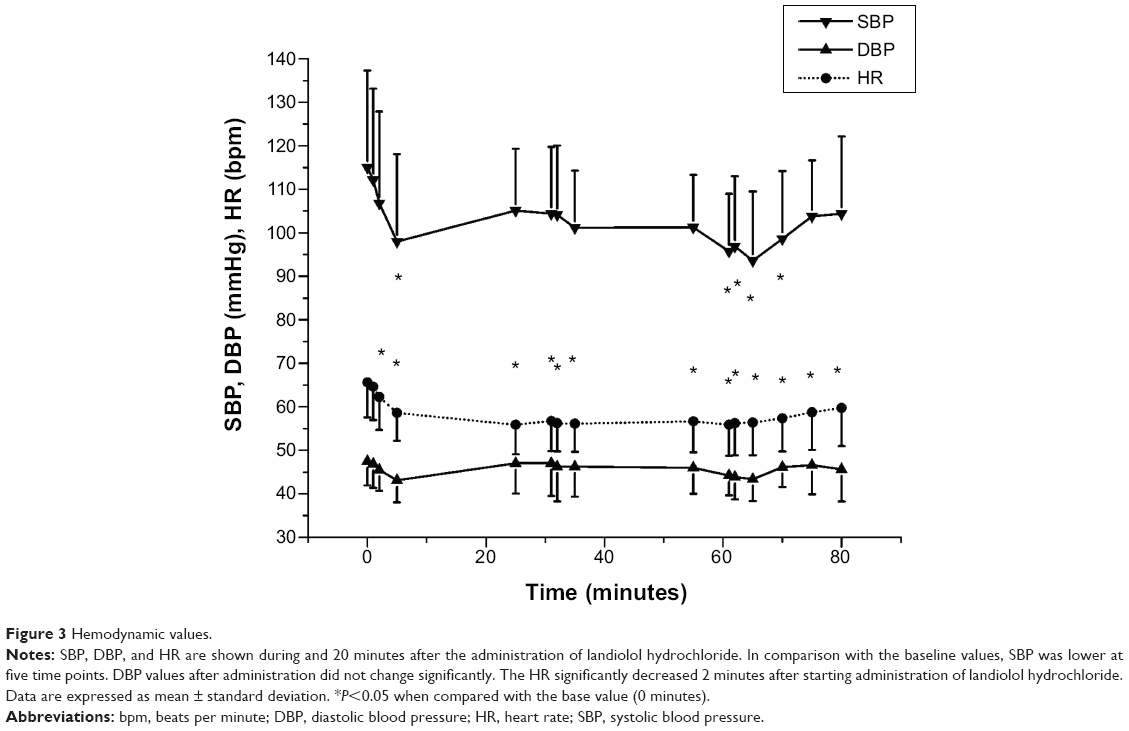 | Figure 3 Hemodynamic values. |
The results of the population PK analysis suggest that the concentration time course of landiolol is best described by a two-compartment model with ALAG based on the Akaike information criterion and diagnostic plots. The ALAG is a necessary component in each model, because its incorporation significantly improves the plot fitting. The Akaike information criterion value of the two-compartment model with ALAG was 1,247.171. One- and three-compartment models did not converge; thus, the two-compartment model was used as the structural model. Next, random variables for interindividual variability were added, in a stepwise manner, to develop the population model. No significant covariate was identified. Most of the routine hematology and blood chemistry values were within normal range, except for mildly abnormal total albumin, cholinesterase, blood urea nitrogen, and serum creatinine levels. Since the frequency and extent of abnormalities were limited, these laboratory parameters were not considered as covariates when constructing the model. Random variables for interindividual variability were required for the parameter CL as an exponential error model, but not for the V1, Q, V2, and ALAG parameters. Residual variability was best described by an exponential error model.
Table 2 shows the parameter estimates for the final model. The final parameters were as follows: CL, 30.7 mL/min/kg; V1, 65.0 mL/kg; Q, 48.3 mL/min/kg; V2, 54.4 mL/kg; and ALAG, 0.633 minutes. The interindividual variability in CL was 13.5%. The residual variability was 27.8%. The values predicted by the present model were plotted against the observed values (Figure 4). The scatters were symmetrically distributed on both sides, and we observed no significant bias. Conditional weighted residual plots are shown in Figure 5. The plots were relatively symmetrical and mostly distributed around zero. No obvious bias pattern was observed in the conditional weighted residuals plots versus the predicted concentrations, or versus the time after beginning of infusion. Figure 6 shows the median and the 5th and 95th percentiles from the visual predictive check simulation with the observed concentrations. This plot shows that most of the observed concentrations fell within the 5% to 95% prediction interval, and observed concentrations were <10% outside the prediction intervals. The visual predictive check shows that the present model adequately describes the majority of the observed concentrations. We also plotted a comparison of the performance errors in the previous and present models (Figure 7). The MDPE values of the previous and present models were 26.7 (0.3, 53.3) and 7.1 (−5.3, 17.1), respectively (Table 3). The MDAPE of the present model was 13.2 (7.0, 19.3) and outweighed that of the previous model (36.4 [21.4, 58.2]). The predictive performance of the present model was better than that of the previous model. In addition, the MDPE of the present model was between −20% and 20%, and the MDAPE was <30%. These values meet the acceptable criteria of model performance defined by Glass et al.11
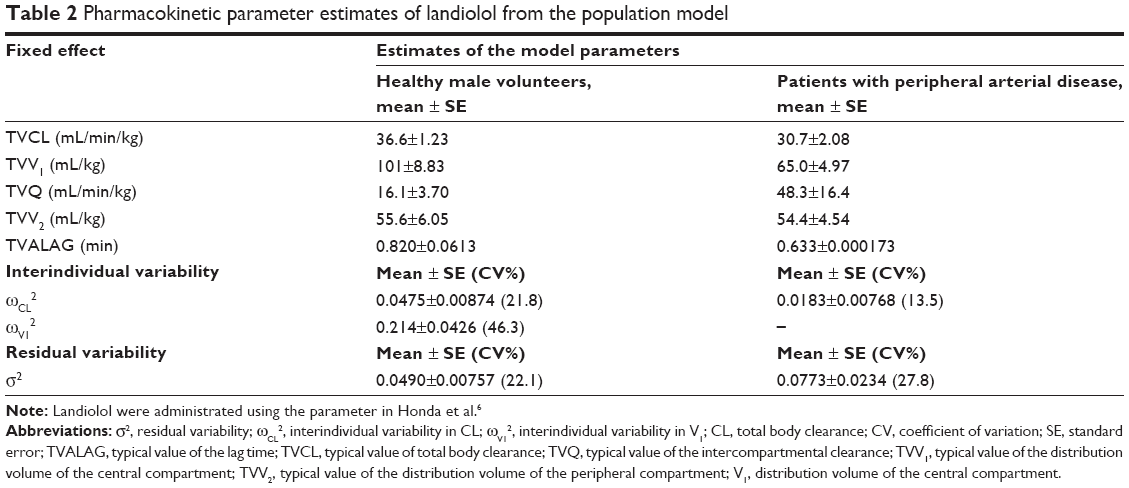 | Table 2 Pharmacokinetic parameter estimates of landiolol from the population model |
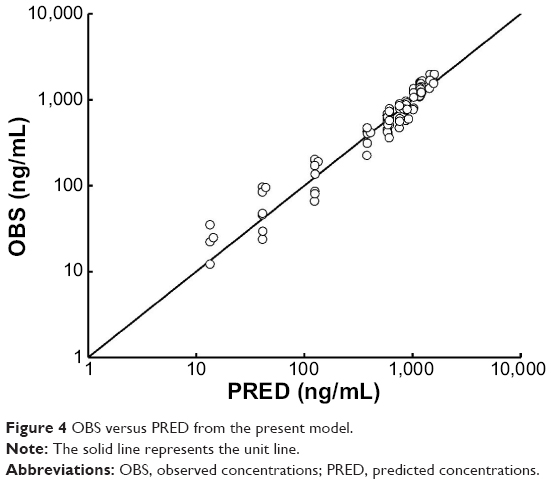 | Figure 4 OBS versus PRED from the present model. |
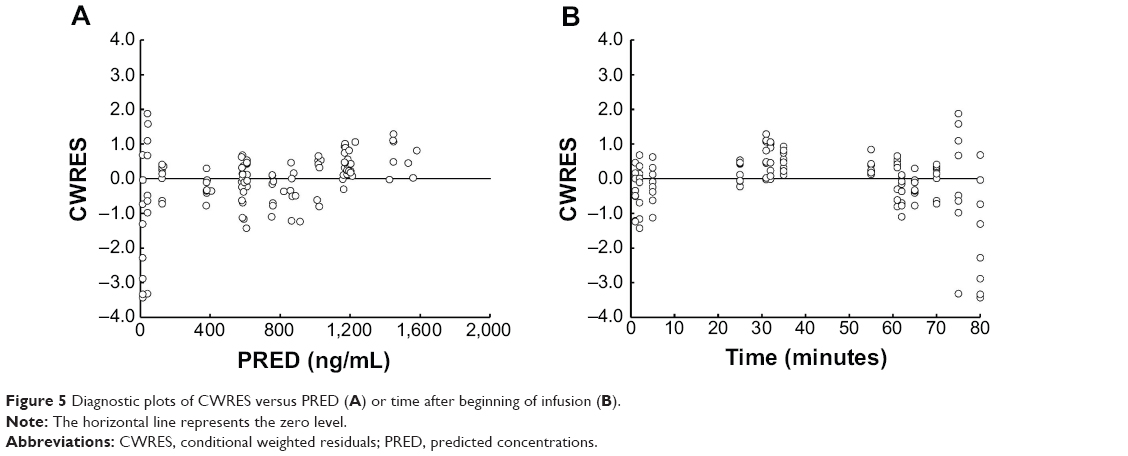 | Figure 5 Diagnostic plots of CWRES versus PRED (A) or time after beginning of infusion (B). |
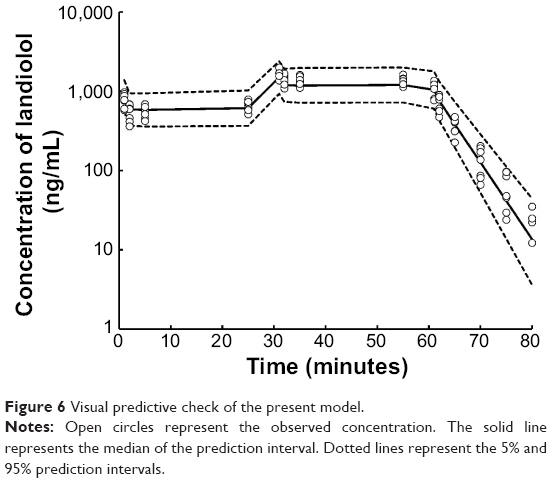 | Figure 6 Visual predictive check of the present model. |
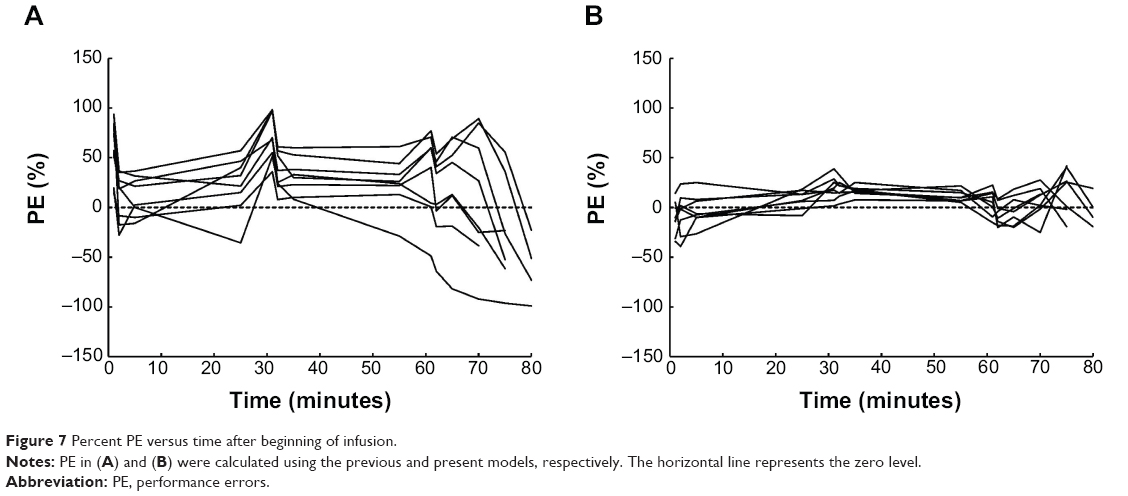 | Figure 7 Percent PE versus time after beginning of infusion. |
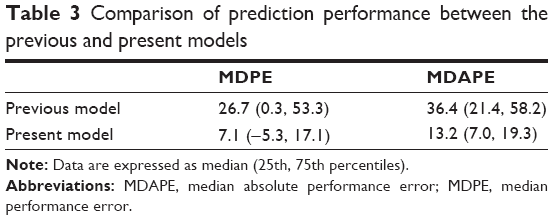 | Table 3 Comparison of prediction performance between the previous and present models |
Discussion
Landiolol hydrochloride, in low doses, has been reported to be efficacious for preventing ischemic heart disease and atrial fibrillation in high-risk intensive care unit patients.3 However, it has been suggested that poor-risk patients have increased sensitivity to landiolol hydrochloride and thus require dose reduction. Whether the PK or PD accounts for this sensitivity has not been explored. In fact, PK parameters of landiolol in low-risk patients and healthy volunteers are similar.4 The present study revealed that V1 and CL in patients with PAD decreased approximately 36% and 16%, respectively, compared with the values in healthy volunteers. These findings indicate that the increase of plasma concentration of landiolol hydrochloride in patients with PAD is due to V1 in the early period of administration and to CL in steady state, when compared with the concentration in healthy volunteers and/or low-risk patients. These results suggest that PK may be one of the reasons for high sensitivity to landiolol in poor-risk patients. However, we cannot determine the degree to which PK influenced sensitivity because the sensitivity examination was not performed in this study. Moreover, the difference between PK in patients with PAD and cardiovascular patients is still unclear. Further studies are required to determine the PK parameters and PD of landiolol in cardiovascular patients. Furthermore, since PK parameters were acquired in a particular situation (eg, dopamine was administered), it should be noted that PK parameters in patients with PAD may change in other clinical settings.
The new model provides an improved fit for the observed concentrations; however, the predicted concentrations were found to be lower than the observed concentrations above the target concentration of 1,000 ng/mL. This deviation may be due to slight nonlinearity of the landiolol PK profile, and could be the limitation of the model.
Administration by TCI has proven useful for anesthetics,12–14 and cardiovascular agents are considered to be similar to anesthetics.15 In this study, PK parameters obtained from healthy volunteers were used in the TCI system. Despite the use of PK parameters of healthy volunteers, the predicted concentrations were reasonably close to the observed concentrations in patients. Therefore, administration of landiolol hydrochloride using the TCI system was useful. However, the predicted concentration using the PK parameters derived from data on patients was more accurate. Consequently, the development and selection of appropriate PK parameters are more important for increasing the accuracy of TCI. Since the concentration of landiolol is subject to change as a result of the continuous infusion dose and because of its rapid action and ease of titration, the merit of TCI is not as great as for long-acting anesthetics. Nevertheless, landiolol TCI does have some merit: as with remifentanil (the short-acting anesthetic metabolized by esterase), TCI enables administration based on the concentration that prevents unnecessary overdose as a result of continuous infusion.13
With respect to the hemodynamics, BP decreased in patients during the study and a pressor was required. The decrease in BP and subsequent necessity of a pressor were attributable to the use of anesthesia; remifentanil was administered by TCI to prevent the changes in hemodynamics in response to surgical stimuli. The HR significantly decreased after the initial administration of landiolol hydrochloride and remained constant throughout the study. Taken together, in spite of the temporary increase in landiolol concentration, the present study suggests that landiolol can be used safely in patients with normal HR, and that TCI was a safe and useful option for the landiolol administration. The final goal for use of landiolol in patients with PAD is improvement in outcome. Regarding hemodynamic effects, this study only revealed that the decrease in BP was within a permissible range and that HR was maintained at a low rate and within a safe range. Further study is needed to reveal the effects on cardiac events and mortality.
Conclusion
TCI of landiolol hydrochloride is useful for controlling HR, and the landiolol PK parameters are best described by a two-compartment model with ALAG. V1 and CL of landiolol in patients with PAD were approximately 64% and 84%, respectively, of those in healthy volunteers.
Acknowledgments
This work was supported by JSPS KAKENHI Grant Number 23791680. Support was also provided from institutional and/or departmental sources. Pure landiolol hydrochloride and ONO-SA-137 for the internal standards were kindly provided by the Ono Pharmaceutical Co., Ltd., (Osaka, Japan).
Disclosure
Susumu Nakade and Naoki Honda, who conducted the population pharmacokinetic analysis using fixed data supplied by Asahikawa Medical University, are employees of the Ono Pharmaceutical Co., Ltd. (Osaka, Japan), which sells landiolol hydrochloride in Japan. The authors report no other conflicts of interest in this work.
References
Nakashima M, Kanamaru M. [Phase I study of ONO-1101, a new ultra short acting β1-blocking agent in healthy volunteers]. Rinsho Iyaku. 2000;16:1531–1556. Japanese. | ||
Iguchi S, Iwamura H, Nishizaki M, et al. Development of a highly cardioselective ultra short-acting beta-blocker, ONO-1101. Chem Pharm Bull (Tokyo). 1992;40:1462–1469. | ||
Yoshida Y, Terajima K, Sato C, et al. Clinical role and efficacy of landiolol in the intensive care unit. J Anesth. 2008;22(1):64–69. | ||
Kunisawa T, Yamagishi A, Suno M, et al. Target-controlled infusion and population pharmacokinetics of landiolol hydrochloride in gynecologic patients. J Anesth. Epub 2014 Sep 4. | ||
Minto CF, Schnider TW, Egan TD, et al. Influence of age and gender on the pharmacokinetics and pharmacodynamics of remifentanil. I. Model development. Anesthesiology. 1997;86(1):10–23. | ||
Honda N, Nakade S, Kasai H, et al. Population pharmacokinetics of landiolol hydrochloride in healthy subjects. Drug Metab Pharmacokinet. 2008;23(6):447–455. | ||
Suno M, Kunisawa T, Yamagishi A, et al. Detection of landiolol using high-performance liquid chromatography/fluorescence: a blood esterase-sensitive ultra-short-acting beta(1)-receptor antagonist. J Chromatogr B Analyt Technol Biomed Life Sci. 2009;877(16–17):1705–1708. | ||
Dyck JB, Maze M, Haack C, Azarnoff DL, Vuorilehto L, Shafer SL. Computer-controlled infusion of intravenous dexmedetomidine hydrochloride in adult human volunteers. Anesthesiology. 1993;78(5):821–828. | ||
Hooker AC, Staatz CE, Karlsson MO. Conditional weighted residuals (CWRES): a model diagnostic for the FOCE method. Pharm Res. 2007;24(12):2187–2197. | ||
Sepulveda P, Cortínez LI, Sáez C, et al. Performance evaluation of paediatric propofol pharmacokinetic models in healthy young children. Br J Anaesth. 2011;107(4):593–600. | ||
Glass PS, Shafer S, Reves JG. Intravenous drug delivery systems. In: Miller RD, editor. Miller’s Anesthesia. 6th ed. Philadelphia, PA: Churchill Livingstone; 2005:439–480. | ||
Passot S, Servin F, Allary R, et al. Target-controlled versus manually-controlled infusion of propofol for direct laryngoscopy and bronchoscopy. Anesth Analg. 2002;94(5):1212–1216, table of contents. | ||
De Castro V, Godet G, Mencia G, Raux M, Coriat P. Target-controlled infusion for remifentanil in vascular patients improves hemodynamics and decreases remifentanil requirement. Anesth Analg. 2003;96(1):33–38, table of contents. | ||
Vermeyen KM, Hoffmann VL, Saldien V. Target controlled infusion of rocuronium: analysis of effect data to select a pharmacokinetic model. Br J Anaesth. 2003;90(2):183–188. | ||
Lehtonen LA, Antila S, Pentikäinen PJ. Pharmacokinetics and pharmacodynamics of intravenous inotropic agents. Clin Pharmacokinet. 2004;43(3):187–203. |
 © 2015 The Author(s). This work is published and licensed by Dove Medical Press Limited. The full terms of this license are available at https://www.dovepress.com/terms.php and incorporate the Creative Commons Attribution - Non Commercial (unported, v3.0) License.
By accessing the work you hereby accept the Terms. Non-commercial uses of the work are permitted without any further permission from Dove Medical Press Limited, provided the work is properly attributed. For permission for commercial use of this work, please see paragraphs 4.2 and 5 of our Terms.
© 2015 The Author(s). This work is published and licensed by Dove Medical Press Limited. The full terms of this license are available at https://www.dovepress.com/terms.php and incorporate the Creative Commons Attribution - Non Commercial (unported, v3.0) License.
By accessing the work you hereby accept the Terms. Non-commercial uses of the work are permitted without any further permission from Dove Medical Press Limited, provided the work is properly attributed. For permission for commercial use of this work, please see paragraphs 4.2 and 5 of our Terms.