")
Back to Journals » International Journal of Nanomedicine » Volume 9 » Issue 1
Synthesis and characterization of bioactive conjugated near-infrared fluorescent proteinoid-poly(L-lactic acid) hollow nanoparticles for optical detection of colon cancer
Authors Kolitz-Domb M, Corem-Salkmon E, Grinberg I, Margel S
Received 1 June 2014
Accepted for publication 19 July 2014
Published 31 October 2014 Volume 2014:9(1) Pages 5041—5053
DOI https://doi.org/10.2147/IJN.S68582
Checked for plagiarism Yes
Review by Single anonymous peer review
Peer reviewer comments 4
Michal Kolitz-Domb, Enav Corem-Salkmon, Igor Grinberg, Shlomo Margel
Institute of Nanotechnology and Advanced Materials, Department of Chemistry, Bar-Ilan University, Ramat Gan, Israel
Abstract: Colon cancer is one of the major causes of death in the Western world. Early detection significantly improves long-term survival for patients with colon cancer. Near-infrared (NIR) fluorescent nanoparticles are promising candidates for use as contrast agents for tumor detection. Using NIR offers several advantages for bioimaging compared with fluorescence in the visible spectrum: lower autofluorescence of biological tissues and lower absorbance and, consequently, deeper penetration into biomatrices. The present study describes the preparation of new NIR fluorescent proteinoid-poly(L-lactic acid) (PLLA) nanoparticles. For this purpose, a P(EF-PLLA) random copolymer was prepared by thermal copolymerization of L-glutamic acid (E) with L-phenylalanine (F) and PLLA. Under suitable conditions, this proteinoid-PLLA copolymer can self-assemble to nanosized hollow particles of relatively narrow size distribution. This self-assembly process was used for encapsulation of the NIR dye indocyanine green. The encapsulation process increases significantly the photostability of the dye. These NIR fluorescent nanoparticles were found to be stable and nontoxic. Leakage of the NIR dye from these nanoparticles into phosphate-buffered saline containing 4% human serum albumin was not detected. Tumor-targeting ligands such as peanut agglutinin and anticarcinoembryonic antigen antibodies were covalently conjugated to the surface of the NIR fluorescent P(EF-PLLA) nanoparticles, thereby increasing the fluorescent signal of tumors with upregulated corresponding receptors. Specific colon tumor detection by the NIR fluorescent P(EF-PLLA) nanoparticles was demonstrated in a chicken embryo model. In future work, we plan to extend this study to a mouse model, as well as to encapsulate a cancer drug such as doxorubicin within these nanoparticles for therapeutic applications.
Keywords: proteinoid, self-assembly, thermal condensation, hollow nanoparticles, fluorescent nanoparticles, NIR fluorescence
Introduction
The thermal condensation of amino acids was first described and further characterized by Fox and Harada.1–6 When proteinoids are incubated in an aqueous solution, they form hollow particles that range in size according to environmental conditions. Recently, the proteinoid particles were studied by several groups for use as new drug delivery systems,7–9 catalytic enzyme-like biomaterials,10 and so on.
In this work, we report the synthesis of a new form of proteinoid. When intended for medical use, polymer particles should be biodegradable, nonimmunogenic, and nontoxic.11 They should also be of nanometric size, with a narrow size distribution. To synthesize suitable particles for this application, proteinoids made of natural amino acids along with low-molecular weight poly(L-lactic acid) (PLLA) were synthesized.
In general, synthetic polymers may offer significant advantages over natural ones, in that they can be designed according to the desired use, providing a wide range of properties. Furthermore, synthetic polymers form a reliable source of raw materials, as they are unaffected by issues such as immunogenicity and infection. Here, the natural amino acids L-glutamic acid (E) and L-phenylalanine (F) are thermally polymerized with 2,000 Da PLLA. Without exception, all of the monomers used are safe, as PLLA is widely used in biomedical applications as medical implants, such as screws, pins, sutures, rods,12 and so on.
After preparation, the crude proteinoids can go through a self-assembly process to form micro and nanosized particles.13 Unlike polystyrene microparticles, for example, which are formed during the polymerization process in the presence of a surfactant,14 the proteinoid particles are formed through the self-assembly of the dried crude proteinoid in water. The treatment involves either dissolving it in water by heating and then cooling slowly15 or pH changes of the proteinoid solution in water.16 This way, particles in the size range of several nanometers to 10 μm may be formed.17 When the self-assembly procedure is carried out in a solution containing drug or dye molecules, the proteinoid can encapsulate the desired molecule. This way, the proteinoid particles can be used in delivery systems inside the body, depending on its special features.8,9,18,19
This work offers a new approach to the use of proteinoid particles as a biological delivery system. In recent years, several types of nanoparticles have been introduced in the field of cancerous tissue detection. It is well known that the early detection of cancer is the key to increasing survival rates. In relation to colon cancer specifically, the early detection of adenomatous colonic polyps is a major concern.20–23 Current techniques include fecal occult blood test, double-contrast barium enema, and colonoscopy. All these methods are considered invasive and insensitive, so that colon cancer continues to be a major concern and the need to develop more effective techniques remains.24 Optical imaging provides anatomical and functional information about biological tissues.25 Although use of white light in optical imaging provides superficial observation only and displays a high signal from the background along with the wanted signal, the use of fluorescence imaging allows deeper penetration into biological matrices and a higher signal-to-noise ratio. Yet significant autofluorescence of biological tissues remains a limiting factor, as the fluorescence imaging is in the visible region of the electromagnetic spectrum. Using fluorescent materials in the near-infrared (NIR) region (700–1,000 nm) allows both deeper penetration and lowered background signal, as there is very low autofluorescence of the body in this region.26,27 Among various NIR fluorescent dyes, cyanine dyes are already approved and used in a wide range of biological applications, as they are known to be water-soluble, stable, and sensitive and to have sharp fluorescence bands.28 In this work, indocyanine green (ICG), a well-known fluorescent cyanine dye, is encapsulated by P(EF-PLLA) to form new NIR fluorescent proteinoid-PLLA nanoparticles. Functional nanoparticle-based NIR probes have significant advantages over free NIR dyes, such as enhanced photostability, biocompatibility, improved fluorescence signal (a large number of dye molecules per nanoparticle), and easy bioconjugation of biomolecules to the functional groups on the nanoparticle surface.28–30 Nanoparticles containing NIR dyes based on silica, calcium phosphate, lipoprotein, albumin, iron oxide, and bisphosphonate have already been developed.31–35 Here, NIR fluorescent P(EF-PLLA) nanoparticles containing ICG were conjugated to bioactive targeting molecules (peanut agglutinin [PNA] and anticarcinoembryonic antigen [anti-CEA] antibodies).36,37 The nonconjugated and the bioactive-conjugated NIR fluorescent P(EF-PLLA) nanoparticles were found to specifically detect colon cancerous tumors, as demonstrated in tumor implants in a chicken embryo model. The bioactive-conjugated P(EF-PLLA) nanoparticles provide a much higher fluorescent signal in tumors with upregulated receptors (the LS174t cell line as opposed to SW480 tumors).
Materials and methods
Materials
The following analytical-grade chemicals were purchased from commercial sources and were used without further purification: L-glutamic acid (E), L-phenylalanine (F), ICG, human serum albumin (HSA), bovine plasma fibrinogen, 1-ethyl-3-(3-dimethylaminopropyl) carbodiimide, Matrigel, PNA, Triton-x-100, fluorescein isothiocyanate-conjugated PNA (FITC-PNA), and monoclonal anti-CEA antibodies (T86-66) from Sigma (Rehovot, Israel); poly(L-lactic acid) MW 2,000 Da from Polysciences (Warrington, PA, USA); N-hydroxysulfosuccinimide (Sulfo-NHS) and 2-morpholino ethanesulfonic acid (MES, pH 6) from Thermo Fisher Scientific (Rockford, IL, USA); phosphate-buffered saline (PBS), minimum essential medium (MEM) eagle, McCoy’s 5A medium and Dulbecco’s Modified Eagle’s Medium (DMEM), fetal bovine serum (FBS), glutamine, penicillin, streptomycin, and mycoplasma detection kit from Biological Industries (Bet Haemek, Israel); a 2,3-bis-(2-methoxy-4-nitro-5-sulfophenyl)-2H-tetrazolium-5 carboxanilide salt (XTT) assay kit from Roche (Basel, Switzerland); and LS174t and SW480 cell lines from American Type Culture Collection. Water was purified by passing deionized water through an Elgastat Spectrum reverse osmosis system (Elga Ltd., High Wycombe, UK).
Preparation of the P(EF-PLLA) and P(EF) by thermal polymerization
L-glutamic acid (2.25 g) was heated to a molten state (180°C) in an oil bath under nitrogen atmosphere. The molten mass was stirred at 180°C for 30 minutes. To this, L-phenylalanine (2.25 g) and PLLA (Mw =2,000 Da; 10% of the total monomer weight, 0.5 g) were added and kept at 180°C under nitrogen. The mixture was mechanically stirred at 150 rpm for 3 hours. The product was a highly viscous orange–brown paste that hardened to a glassy mass when cooled to room temperature. Then, water (10 mL) was added to the crude product and the mixture was stirred for 20 minutes. The solution was then intensively dialyzed through a cellulose membrane (3,500 Da MWcutoff) against distilled water. The content of the dialysis tube was then lyophilized to obtain a yellow–white powder.
P(EF) was prepared similarly from L-glutamic acid and L-phenylalanine (2.5 g of each) in the absence of PLLA.
Characterization of P(EF-PLLA) and P(EF)
The molecular weights and polydispersity indices of the dried crude P(EF-PLLA) and P(EF) were determined using gel permeation chromatography, consisting of a Waters Spectra Series P100 isocratic high-performance liquid chromatography pump with an ERMA ERC-7510 refractive index detector and a Rheodyne (Coatati, CA, USA) injection valve with a 20 μL loop (Waters, MA, USA). The samples were eluted with super-pure high-performance liquid chromatography water through a linear BioSep SEC-s3000 column (Phenomenex) at a flow rate of 1 mL/minute. The molecular weight was determined relative to poly(ethylene glycol) standards (Polymer Standards Service-USA, Silver Spring, MD, USA) with a molecular weight range of 100–450,000 Da, HSA (67 kDa), and bovine plasma fibrinogen (340 kDa), using Clarity chromatography software. The optical activities of the P(EF-PLLA) and P(EF) were determined using a PE 343 polarimeter (PerkinElmer). The measurements were done in water, at 589 nm and 25°C. Fourier transform infrared measurements were performed by the attenuated total reflectance technique, using a Bruker ALPHA-Fourier transform infrared QuickSnap™ sampling module equipped with a Platinum attenuated total reflectance diamond module.
Formation of nonfluorescent and NIR fluorescent P(EF-PLLA) and P(EF) hollow nanoparticles
The P(EF-PLLA) and P(EF) hollow nanoparticles were prepared by a self-assembly process.17 Briefly, 100 mg of the dried fabricated P(EF-PLLA) were resuspended in 10 mL of 10−5 N NaCl solution. The mixture was then heated to 80°C while stirring for 15 minutes. To this solution, 1 mg (1% of the proteinoid polymer) of ICG was added. The mixture was then removed from the hot plate and allowed to return to room temperature. During the cooling process, hollow particles were formed and precipitated from solution. The obtained NIR fluorescent nanoparticles dispersed in water were then dialyzed against 4 L of 10−5 N NaCl aqueous solution overnight at room temperature.
Nonfluorescent particles were prepared from P(EF-PLLA) and P(EF) by the same procedure, excluding the addition of ICG.
Characterization of nonfluorescent and NIR fluorescent P(EF-PLLA) and P(EF) hollow nanoparticles
The hydrodynamic diameter and size distribution of the nanoparticles dispersed in an aqueous phase were measured at room temperature by dynamic light scattering with photon cross-correlation spectroscopy (Nanophox particle analyzer; Sympatec GmbH, Germany). The mean dry diameter was determined using a scanning electron microscope (SEM; JEOL, JSM-840 Model, Japan). For this purpose, a drop of dilute particles dispersion in distilled water was spread on a glass surface and then dried at room temperature. The dried sample was coated with carbon in vacuum before viewing under SEM. The average particle size and size distribution were determined by the measurement of the diameter of more than 200 particles with image analysis software (Analysis Auto, Soft Imaging System GmbH, Germany). Absorbance spectra were obtained using a Cary 100 UV-Visible spectrophotometer (Agilent Technologies Inc.). Excitation and emission spectra were recorded using a Cary Eclipse spectrofluorometer (Agilent Technologies Inc.). The density of the particles was determined by pycnometry.38 Briefly, dry preweighed particles were put in a calibrated pycnometer, which was then filled with water. The density of the sample could then be calculated from the known density of the water, the weight of the pycnometer filled only with water, the weight of the pycnometer containing both sample and water, and the weight of the sample, as described in the literature.38
Determination of the encapsulated ICG content
A calibration curve of free ICG was obtained by measuring the integrals of the absorbance peaks of standard solutions (0.5–10 μg/mL) in PBS at wavelengths of 630–900 nm. The concentration of the encapsulated ICG was determined by measuring the integral of the absorbance spectrum at 630–900 nm of a 1 mg/mL dispersion of the NIR fluorescent nanoparticles in PBS. An estimation of encapsulated ICG per milligram of nanoparticles was determined according to the calibration curve.
Optimization of the encapsulated ICG content
The fluorescence intensity of the P(EF-PLLA) nanoparticles was varied by changing the ICG concentration within the nanoparticles (0.5%, 1%, 2%, and 5% w/w).
Different samples of the NIR fluorescent P(EF-PLLA) nanoparticles were prepared as described previously. The nanoparticle aqueous dispersions were diluted to 1 mg/mL in PBS, illuminated at 750 nm, and their relative fluorescence intensities at 809 nm were measured and compared.
Leakage extent of the encapsulated ICG from the nanoparticles into the PBS continuous phase
A NIR fluorescent P(EF-PLLA) nanoparticle dispersion (10 mg/mL in PBS containing 4% HSA) was shaken at room temperature for 1 hour and then filtered via a 300 kDa filtration tube (VS0241 VIVA SPIN) at 4,000 rpm (Centrifuge CN-2200 MRC). The fluorescence and absorbance intensities of the filtrate were measured as mentioned previously to account for ICG leaks from the nanoparticles to their surroundings.
Photostability of the NIR fluorescent P(EF-PLLA) nanoparticles
An aqueous solution of ICG (0.05 M) in PBS was prepared, and the fluorescence intensity with λex set at 780 nm and λem set at 800 nm was measured. A dispersion of NIR fluorescent P(EF-PLLA) nanoparticles in PBS was prepared and diluted to give a similar fluorescence intensity to the dye at the same wavelengths. The excitation and emission slits were opened to 20 and 5 nm, respectively. Each of the samples was illuminated continuously with a xenon lamp, and the fluorescence intensity was measured over a period of 20 minutes by a Cary Eclipse fluorescence spectrophotometer (Agilent Technologies Inc.). Intensity values were normalized for comparison.
Nanoparticle stability
P(EF-PLLA) nanoparticle aqueous dispersions (1 mg/mL) were placed in a refrigerator at 4°C for 6 months. Samples were taken at different times and filtered through a centrifugation tube (Vivaspin 3000 Da MWcutoff), and then the filtrate was checked by ultraviolet light at 200–210 nm to find soluble P(EF-PLLA) and at 630–900 nm to find free ICG. In addition, the nanoparticle aqueous dispersions were checked both for their size and size distribution, and for their fluorescence intensity, as mentioned previously. To check the nanoparticle stability after drying, the nanoparticles were lyophilized to dryness and then dispersed in an aqueous phase to their original concentration. The nanoparticles were then rechecked for size, size distribution, and fluorescence intensity.
In vitro cytotoxicity of the P(EF-PLLA) nanoparticles
In vitro cytotoxicity of the P(EF-PLLA) nanoparticles was tested using human colorectal adenocarcinoma LS174t and SW480 cell lines. The cell lines adhere to the used culture dishes. LS174t cells were grown in MEM eagle supplemented with heat-inactivated FBS (10%), 1% glutamine, and 1% penicillin/streptomycin. SW480 cells were maintained in DMEM supplemented with heat-inactivated FBS (10%), 1% glutamine, and 1% penicillin/streptomycin. Cells were screened to ensure they remained mycoplasma-free, using a Mycoplasma Detection Kit.39
An XTT (sodium 3′-[1-(phenylaminocarbonyl)-3,4-tetrazolium]-bis [4 methoxy-6-nitro] benzene sulfonic acid hydrate) assay was performed to determine the viability of the LS174t and SW480 cell lines after nanoparticle treatment. The assay is based on the ability of the mitochondrial succinate-tetrazolium reductase system to convert yellow tetrazolium salt XTT to orange formazan dye. The test denotes the percentage of the cells that survive after toxic exposure.
Cells were seeded in a 96 well plate at a density of 1×10⁴ cells/well in 100 μL culture medium and grown in a humidified 5% CO2 atmosphere at 37°C. After 24 hours at 37°C, different volumes of the nanoparticles dispersed in PBS were added to the cells, giving final concentrations of 2.5, 1.25, and 0.625 mg/mL per well. After incubation for 24 or 48 hours at 37°C, 50 μL XTT solution was added to each well according to the kit manufacturer’s instructions. Absorbance was read at 480 nm. Cell viability was determined using the formula shown in the manufacturer’s protocol.40 The reference wavelength used was 650 nm.
Conjugation of the tumor-targeting ligands to the nanoparticles
PNA was covalently conjugated to the NIR fluorescent P(EF-PLLA) nanoparticles by the carbodiimide activation method.34 Briefly, 1-ethyl-3-(3-dimethylaminopropyl) carbodiimide (1 mg) and sulfo-NHS (1 mg) were each dissolved in 0.1 M MES (pH 6.0, 1 mL) containing 0.5 M NaCl. The 1-ethyl-3-(3-dimethylaminopropyl) carbodiimide solution (1 mg/mL, 10 μL) was added to an aqueous solution of PNA (0.25 mg, 62.5 μL), followed by the addition of the sulfo-NHS solution (1 mg/mL, 25 μL). The mixture was then shaken for 15 minutes, followed by the addition of the NIR fluorescent P(EF-PLLA) nanoparticles (2.5 mg in 1 mL PBS). The mixture was then shaken for 90 minutes. The obtained PNA-conjugated fluorescent nanoparticles were then washed from excess reagents by dilution and filtration through a 30 kDa filtration tube (VS2021 VIVA SPIN) at 1,000 rpm (Centrifuge CN-2200 MRC) for 2 minutes, and this was repeated three times. FITC-PNA and anti-CEA were conjugated to the NIR fluorescent nanoparticles through a similar procedure. The concentration of bound PNA was determined with FITC-PNA by a calibration curve of FITC-PNA fluorescence, using a multiplate reader (TECAN SpectraFluor Plus, Neotec Scientific Instruments). The concentration of bound anti-CEA was determined using a mouse IgG enzyme-linked immunosorbent assay kit (Biotest, Israel).
Chicken chorioallantoic membrane grafting procedure
Human colorectal adenocarcinoma cell lines were used for each of the experiments. The LS174t cell line was maintained in MEM eagle supplemented with heat-inactivated FBS (10%), penicillin (100 IU/mL), streptomycin (100 μg/mL), and L-glutamine (2 mM). The SW480 cell line was maintained in DMEM supplemented with FBS (10%), penicillin (100 IU/mL), streptomycin (100 μg/mL), and L-glutamine (2 mM).
Tumor cells were grafted on chicken chorioallantoic membrane (CAM), according to the literature.41 Briefly, fertile chicken eggs obtained from a commercial supplier were incubated at 37°C at 60%–70% humidity in a forced-draft incubator. On day 3 of incubation, an artificial air sac was formed, allowing the CAM to drop. After 8 days of incubation, a window was opened in the shell and the CAM was exposed. Tumor cells were collected by trypsinization, washed with culture medium, and pelleted by gentle centrifugation. After removal of the medium, 5×10⁶ cells were resuspended in 30 μL ice-cold Matrigel and inoculated on the CAM at the site of the blood vessels. Eggs were then sealed and returned to incubation. On day 6 postgrafting, day 14 of incubation, the tumor diameter ranged from 3 to 5 mm with visible neoangiogenesis.
Optical detection of human colon tumors with the NIR fluorescent P(EF-PLLA) nanoparticles
Chicken embryos with 6-day-old human adenocarcinoma tumors (LS174t and SW480 cancer cell lines) implanted on the CAM were treated with the nonconjugated, PNA-conjugated, and anti-CEA-conjugated NIR fluorescent P(EF-PLLA) nanoparticles (40 μL, 2 mg/mL). In addition, nonpathological CAM treated with nonconjugated nanoparticles and untreated tumors served as control groups. After 40 minutes, the nanoparticle dispersions were removed and the tumors were washed with PBS. Then, the tumors and the nonpathological CAM were removed from the eggs, washed again with PBS, and spread on a matte black background for observation using a Maestro II™ in vivo imaging system (Cambridge Research & Instrumentation Inc., Woburn, MA, USA). A NIR excitation/emission filter set was used for the experiments (λex, 710–760 nm; λem, >750 nm). The liquid crystal tunable filter was programmed to acquire image cubes from λ =790 nm to 860 nm with an increment of 10 nm per image. Fluorescence intensity measurements were calculated as average intensity over the tumor surface area, using ImageJ software.
Results and discussion
Synthesis and characterization of the P(EF-PLLA) and P(EF) nanoparticles
As described in the Materials and methods section, P(EF-PLLA) and P(EF) were formed by thermal polymerization of L-glutamic acid (E), L-phenylalanine (F), and PLLA. Glutamic acid has to be present in the thermal polymerization because it is used as the solvent in its molten state and it also provides carboxylate functional groups for the conjugation of bioactive ligands. Phenylalanine and PLLA were incorporated within the proteinoid because of the rigid side chain of phenylalanine and the hydrophobicity of both monomers, which can improve the rigidity of the resulted particles.
The proteinoid-PLLA and proteinoid without PLLA were characterized for their molecular weights and polydispersity indices by gel permeation chromatography. As shown in Table 1, the molecular weights of the resulted proteinoid-PLLA and proteinoid were 168 kDa (Mn [number average molecular weight], 156 kDa; polydispersity index, 1.07) and 164 kDa (Mn, 138 kDa; polydispersity index, 1.19), respectively. These molecular weights are high compared with the proteinoids reported in the literature.16 Furthermore, the low-polydispersity indices, which indicate high uniformity within the synthesized polymers, are unexpected, as the polymerization process is random.
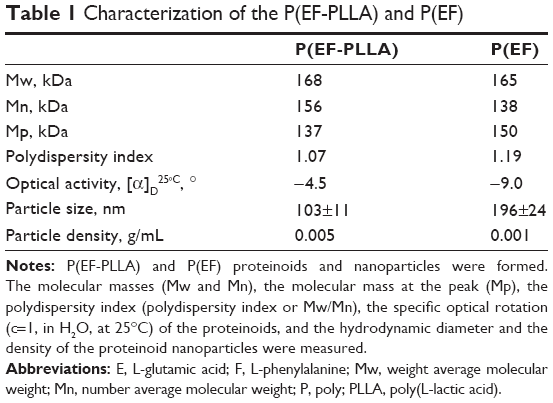 | Table 1 Characterization of the P(EF-PLLA) and P(EF) |
Because both the proteinoid-PLLA and the proteinoid are made of optically active monomers, including the PLLA segments incorporated in the structure, they were checked for optical activity, as mentioned in the Materials and methods section. The proteinoid-PLLA and the proteinoid were found to have specific optical rotation ([α]D: c=1, in H2O, at 25°C) of -4.6° and -9.0°, respectively. This fact can become of benefit later, in the design of a stereospecific drug carrier, for example.
P(EF-PLLA) and P(EF) particle density, measured as described in the Materials and methods section, was 0.005 and 0.001 g/mL, respectively, meaning that the particles have a relatively high volume along with a very low mass. This very low density indicates that the particles formed are hollow, as already known for the proteinoid particles reported by Fox and colleagues.3 The hollow nature of the particles is significantly important, as they can be used for the encapsulation of drugs and dyes, and so on.
Table 1 exhibits that the incorporation of PLLA segments in the proteinoid backbone does not significantly influence the molecular weight masses, improves slightly the polydispersity, and decreases significantly the size and size distribution of the obtained nanoparticles (103±11 nm for the P[EF-PLLA] nanoparticles and 196±24 nm for the P[EF] particles). The proteinoids, as they are produced by random thermal copolymerization, are far more resistant to enzymatic cleavage than relevant peptides or proteins. The insertion of the PLLA segments in the P(EF) backbone provide, via the ester bonds, an additional safe method of biodegradation. This novelty, size, and size distribution decrease and an alternative method of biodegradation caused us to decide to continue the present work, which aims to design a new drug delivery system, with the P(EF-PLLA) only.
Fourier transform infrared spectrum of the P(EF-PLLA) is illustrated in Figure 1. This spectrum indicates peaks of NH stretching and OH stretching at 3,360 and 2,990 cm−1, amide CO stretching at 1,565–1,700 cm−1, an amide NH bending at 1,450 cm−1, and CO bending at 500–700 cm−1.
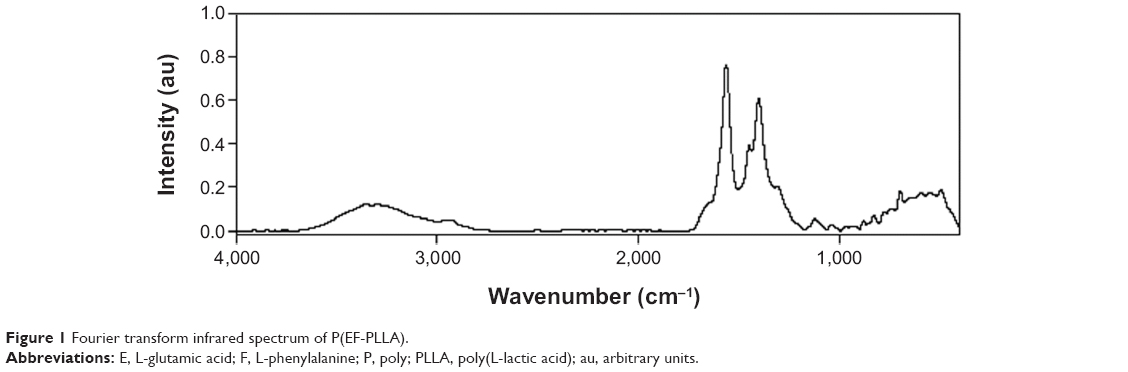 | Figure 1 Fourier transform infrared spectrum of P(EF-PLLA). |
Synthesis of the NIR fluorescent P(EF-PLLA) nanoparticles
P(EF-PLLA) was used to encapsulate ICG, a well-known NIR dye already in use in medical diagnostics. The NIR fluorescent nanoparticles were prepared by self-assembly of the crude P(EF-PLLA) in the presence of ICG. To achieve maximal fluorescence, the dye should be strongly associated with the nanoparticles. ICG content was determined using a calibration curve of free ICG in PBS, as mentioned in the Materials and methods section. The estimation of encapsulated ICG showed that the complete quantity of ICG used in the encapsulation procedure was encapsulated within the P(EF-PLLA) nanoparticle interior. After particle formation, no leakage of the dye into PBS containing 4% HSA was detected over time. This indicates that the dye molecules are strongly associated with the P(EF-PLLA) nanoparticles, especially with the hydrophobic interior created in the self-assembly process, probably through strong physical interactions.
As suggested in previous studies, a proteinoid forms particles of different sizes according to the nature of its surroundings.7 When talking about P(EF-PLLA), the hydrophobic portions, in this case mainly the PLLA segments and the aromatic rings of the phenylalanine portion, are assembled within the particle matrix, whereas the polar hydrophilic groups (mainly carboxylates) are exposed to the aqueous environment, as illustrated in Figure 2.
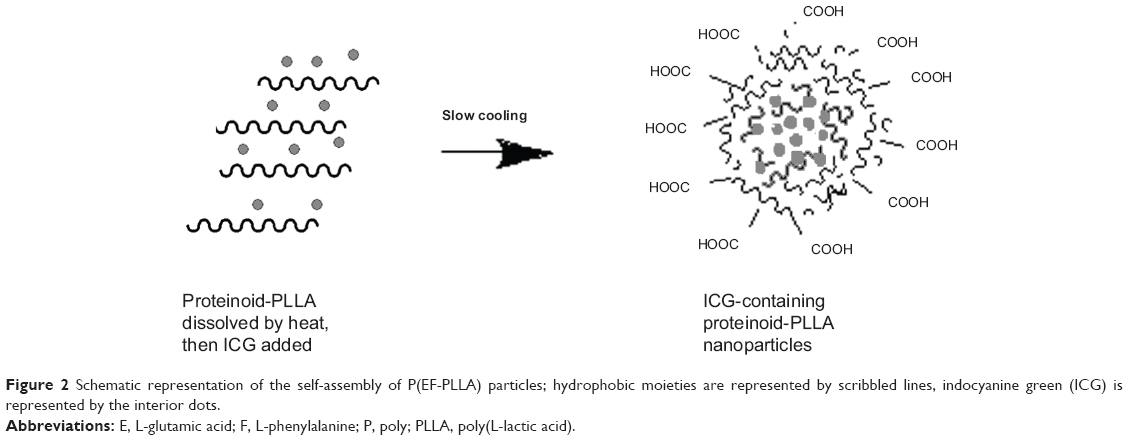 | Figure 2 Schematic representation of the self-assembly of P(EF-PLLA) particles; hydrophobic moieties are represented by scribbled lines, indocyanine green (ICG) is represented by the interior dots. |
Size and size distribution
The hydrodynamic diameter of these fluorescent nanoparticles dispersed in water is 145±20 nm, as illustrated by the typical light scattering measurement shown in Figure 3A. The dry diameter of the NIR fluorescent P(EF-PLLA) nanoparticles is 70±15 nm, as illustrated by the typical SEM photomicrograph shown in Figure 3B. It should be noted that the entrapment of the ICG dye within the P(EF-PLLA) nanoparticles leads to the increase in the hydrodynamic diameter size and size distribution from 103±11 to 145±20 nm. The difference in the fluorescent nanoparticle size between the SEM and the light scattering measurements is probably because SEM measurements determine the dry diameter, whereas light scattering measurements determine the hydrodynamic diameter, which takes into account the hydrated water layers adsorbed on the nanoparticle’s surface, which is very hydrophilic in this case.
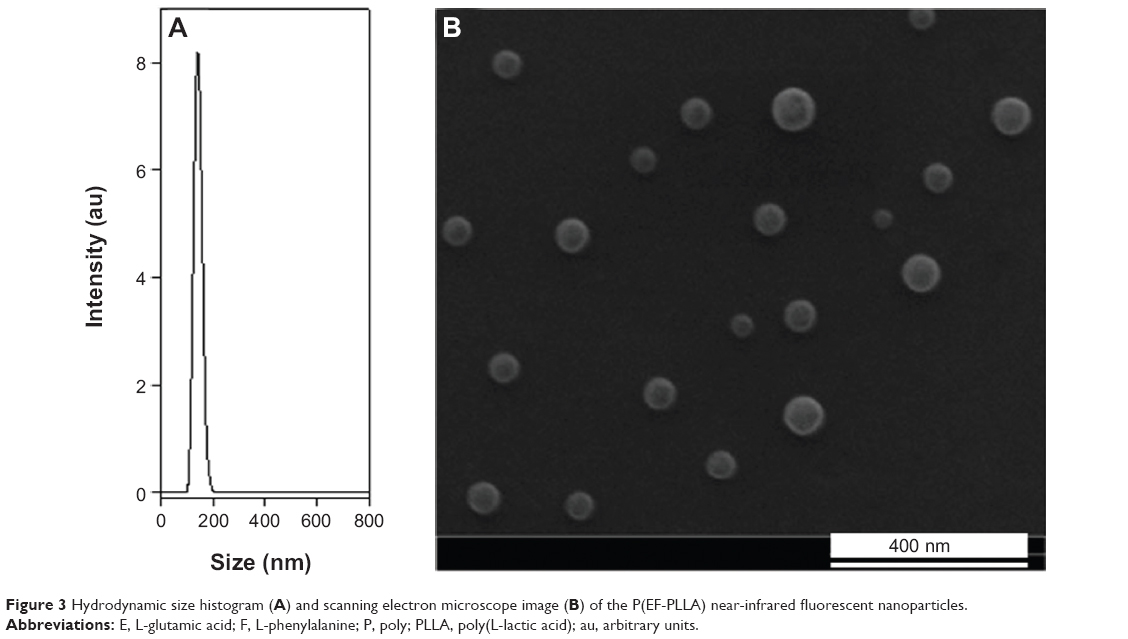 | Figure 3 Hydrodynamic size histogram (A) and scanning electron microscope image (B) of the P(EF-PLLA) near-infrared fluorescent nanoparticles. |
Optical spectra
Absorbance and emission spectra of the free and encapsulated ICG were recorded. As indicated in Figure 4, no shift of absorbance of the ICG after encapsulation is observed compared with that of the free ICG. However, because of the dye encapsulation process, the maximal absorbance peak of the free ICG became minimal and the minimal peak of the free dye became maximal after encapsulation. This behavior is probably because when the ICG molecules get close to each other inside the nanoparticle interior, aggregation of the dye may occur, causing this change in absorption peaks.42,43 Furthermore, a 12 nm blue-shift of the emission spectrum of the NIR fluorescent nanoparticles compared with the free dye in solution is also observed.
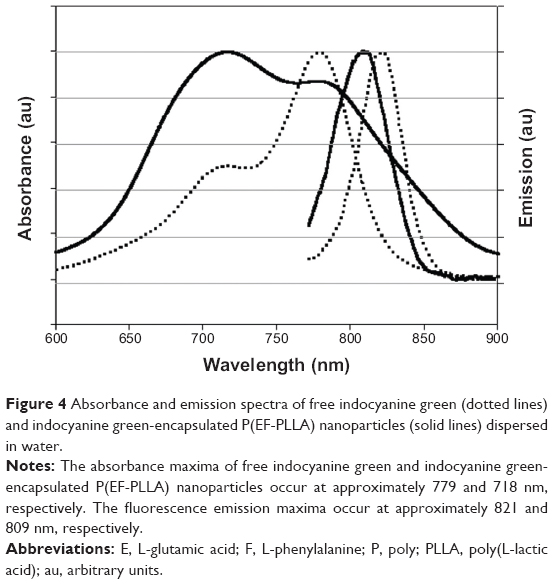 | Figure 4 Absorbance and emission spectra of free indocyanine green (dotted lines) and indocyanine green-encapsulated P(EF-PLLA) nanoparticles (solid lines) dispersed in water. |
Particle fluorescence optimization
To optimize the nanoparticle fluorescence intensity, different concentrations (0.5%–5% w/w relative to P[EF-PLLA]) of ICG were added to the P(EF-PLLA) hot solution before the formation of the nanoparticles through the self-assembly process, as described in the Materials and methods section. The NIR fluorescent P(EF-PLLA) nanoparticles dispersed in PBS were diluted to 1 mg/mL, and their fluorescence intensities were measured at 809 nm. As seen in Table 2, the encapsulated ICG concentration that gave the maximum fluorescence intensity of the resultant NIR fluorescent nanoparticles was 1% w/w relative to P(EF-PLLA). At higher dye concentrations, quenching of the fluorescence was observed, as the dye molecules encapsulated within the P(EF-PLLA) nanoparticle are close to each other, resulting in nonemissive energy transfer between them.
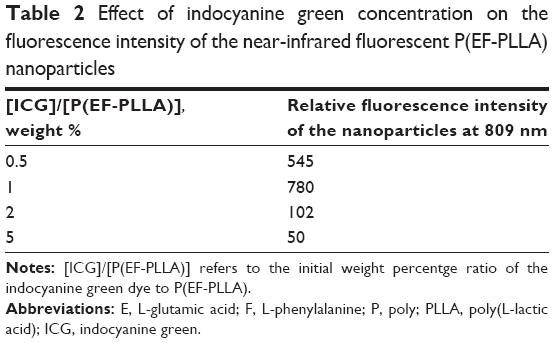 | Table 2 Effect of indocyanine green concentration on the fluorescence intensity of the near-infrared fluorescent P(EF-PLLA) nanoparticles |
Photostability
To examine the photostability of the encapsulated ICG, as opposed to free ICG, photobleaching experiments were performed for both the encapsulated and the free dye. Samples of free ICG and the ICG-containing P(EF-PLLA) particles were illuminated at 800 nm, and their fluorescence intensities were measured over a period of 20 minutes. During illumination, the fluorescence intensity of the ICG-containing P(EF-PLLA) particles remains intact, whereas that of the free ICG decreased significantly, as shown in Figure 5.
 | Figure 5 Photostability of the indocyanine green-P(EF-PLLA) particles (A) and free indocyanine green (B) as a function of time. |
As also illustrated in Figure 5, the photobleaching of ICG is significantly reduced by the encapsulation within the proteinoid-PLLA particles. The encapsulation probably protects the free dye from light-inducing factors such as oxygen, oxidizing or reducing agents, temperature, exposure time, and illumination levels, which may reduce the fluorescence intensity irreversibly.30,31
Nanoparticle stability
The stability of the NIR fluorescent P(EF-PLLA) nanoparticle was determined in two different conditions: long-term refrigerating as an aqueous dispersion and as dried particle powder. From the refrigerated aqueous dispersion, samples were taken at different periods to find soluble P(EF-PLLA) and free ICG in the aqueous phase. The particles’ size, size distribution, and fluorescence were determined as well. Overall, after 6 months, the nanoparticles maintain their size and size distribution, and no soluble P(EF-PLLA) or free ICG was found in the filtrate. Moreover, the particle dispersion preserves its fluorescence completely. These results indicate that the NIR fluorescent particles are very stable under refrigeration; hence, they can be kept in those conditions for a long period. To check whether the particles can be kept as a powder, the particles were lyophilized to dryness and then dispersed in an aqueous phase to their original concentration. Again, the particles’ size, size distribution, and fluorescence remain similar. This means that the particles may be held and stored as particle powder, which can be redispersed on use without the need to add cryoprotectants, as is usually required for drying and redispersing nanosized particles.44
Cytotoxicity of the P(EF-PLLA) nanoparticles
To revoke cell toxicity of the NIR P(EF-PLLA) nanoparticles, in vitro cytotoxicity of the particles was tested by using human colorectal adenocarcinoma LS174t and SW480 cell lines. The NIR fluorescent nanoparticles were tested by the XTT assay for in vitro cell viability after exposure to the nanoparticles. To determine the number of viable cells, the assay uses XTT.40 Only in living cells are mitochondria capable of reducing XTT to form orange-colored water-soluble dye, the concentration of which is proportional to the number of living cells and can be calculated as mentioned in the Materials and methods section. LS174t and SW480 were exposed to different concentrations of the P(EF-PLLA) nanoparticles. Figure 6 exhibits the cell viability levels of the cells after nanoparticle treatment. Treatment of LS174t cells with 1.25 and 2.5 mg/mL nanoparticles in PBS produced a minor decrease in viability level (10%) after 24 hours when compared with untreated (blank) cells. In contrast, the nanoparticles (1.25 and 0.625 mg/mL) increase the viability levels of SW480 cells (177% and 134%) 24 hours after treatment, probably as a result of cell exploitation of the nanoparticles as nutrients. Overall, the nanoparticles can be considered nontoxic and can be further used with human cells.
 | Figure 6 Cell viability levels of human colorectal adenocarcinoma LS174t and SW480 cell lines after exposure to the near-infrared fluorescent P(EF-PLLA) particles measured by the 2,3-bis-(2-methoxy-4-nitro-5-sulfophenyl)-2H-tetrazolium-5 carboxanilide salt assay. |
Conjugation of the bioactive reagents
To demonstrate the possibility of using the NIR fluorescent P(EF-PLLA) nanoparticles for tumor detection, PNA and anti-CEA were covalently conjugated to these fluorescent nanoparticles. PNA binds to the terminal sugar β-D-galactosyl-(1-3)-N-acetyl-D-galactosamine of the Thomsen-Friedenreich antigen.45 According to the literature, this antigen is upregulated on the mucosal side of various colorectal cancer cell lines such as LS174t compared with the SW480 cell line, in which this antigen is expressed to a much lower extent.45 Anti-CEA antibody is an antibody against CEA, a highly glycosylated glycoprotein expressed on most types of human carcinomas. As stated in the literature, CEA is upregulated on the mucosal side of LS174t colorectal cancer cell line, as opposed to SW480 (at least 103 less).46 The concentration of biological ligand conjugated to the nanoparticles should be monitored carefully. The ligand content on the surface should be both sufficient for recognition by the cell from any angle of approach and limited to revoke steric interference of the interaction with the cell receptors. The concentration of bioactive ligand bound to the nanoparticles was determined using FITC-PNA for PNA and mouse IgG enzyme-linked immunosorbent assay for anti-CEA, as described in the Materials and Methods section. The calculated quantities of bound PNA and anti-CEA were 3.2 and 1.9 μg/mg nanoparticles, respectively. As will be demonstrated later, when using these concentrations of bound ligands in testing the ligand–receptor interaction, an increased signal of fluorescence was seen in cancer cells with upregulated corresponding receptors. Experiments with a larger concentration of bound ligand showed a significant decrease in the fluorescence, possibly as a result of steric hindrance, as expected.
Tumor growth on the CAM model
A chicken embryo CAM model was used to test the specific tumor detection by both the nonconjugated and the bioactive (PNA and anti-CEA) conjugated NIR fluorescent P(EF-PLLA) nanoparticles. Among most commonly used animal models, the chicken egg model allows the imaging of several tumors in a short time and is less expensive than other models.47 All cancer cell lines evaluated in this study were able to form solid tumors, 3 to 5 mm in diameter, depending on the cell line. Figure 7 shows typical SW480 cell line-derived tumors bordered by plastic rings on a chicken embryo CAM inside the egg.
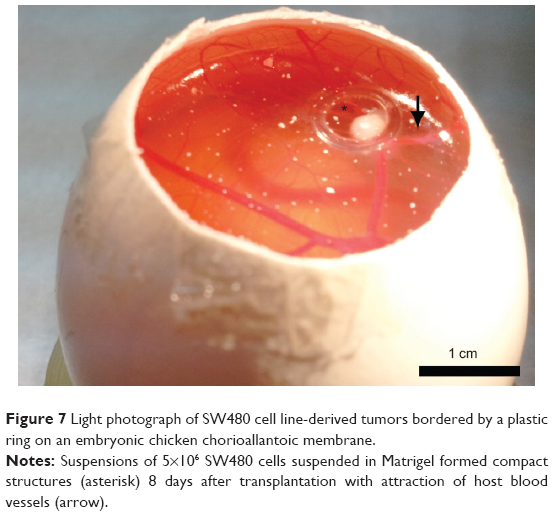 | Figure 7 Light photograph of SW480 cell line-derived tumors bordered by a plastic ring on an embryonic chicken chorioallantoic membrane. |
Optical detection of LS174t and SW480 human colorectal tumor cell lines on CAM model
LS174t and SW480 colorectal cell lines were used to demonstrate the possible use of the NIR fluorescent P(EF-PLLA) nanoparticles in tumor detection. As mentioned in the Materials and methods section, LS174t cells express certain receptors [β-D-galactosyl-(1-3)-N-acetyl-D-galactosamine and CEA] to a much higher extent than SW480 cells.34,35,46 This way, the chosen bioactive ligands PNA and anti-CEA, once conjugated to the P(EF-PLLA) nanoparticles, can lead the nanoparticles specifically to the LS174t cancer cells. As shown in Figure 8, the LS174t tumors treated with bioactive-conjugated nanoparticles (Figure 8B–C) gained higher fluorescence than SW480 tumors compared with those treated with nonconjugated nanoparticles (Figure 8A). This is accurate both for P(EF-PLLA) nanoparticles conjugated with PNA (Figure 8B) and anti-CEA (Figure 8C), probably as a result of effective ligand–receptor interactions. In addition, the SW480 tumors treated with bioactive-conjugated P(EF-PLLA) nanoparticles gained less fluorescence compared with those treated with the nonconjugated nanoparticles. The relative fluorescence intensities of the tumors treated by conjugated and nonconjugated P(EF-PLLA) nanoparticles are summarized in Figure 9. LS174t cells compared with SW480 cells gave fluorescence intensity ratios of 4:1 and 8:1 for PNA-conjugated nanoparticles and anti-CEA-conjugated nanoparticles, respectively. The nonconjugated P(EF-PLLA) nanoparticles also labeled the tumors. However, the differences in the intensities between the types of tumors were not statistically significant. In this case, the overall fluorescence in both types of cells was higher than when treated with PNA-conjugated nanoparticles. This fact shows that even the bare, nonconjugated nanoparticles penetrate the human cancer cell lines to a good extent. The possible reason is that the P(EF-PLLA) nanoparticles can penetrate and label the cancerous cells specifically by either receptor–ligand interaction or use of these nanoparticles as nutrients for tumor growth, as they resemble biological proteins. The fluorescence intensity ratios between the types of cells show the significance of the nanoparticle surface. As seen in Figure 8D, no autofluorescence was observed in untreated tumors, signifying that all fluorescent signals are related to the fluorescent P(EF-PLLA) nanoparticle labeling. Figure 8E shows that no nonspecific labeling of nonpathological CAM tissue was observed, indicating the specificity of the P(EF-PLLA) nanoparticles toward the tumor tissue.
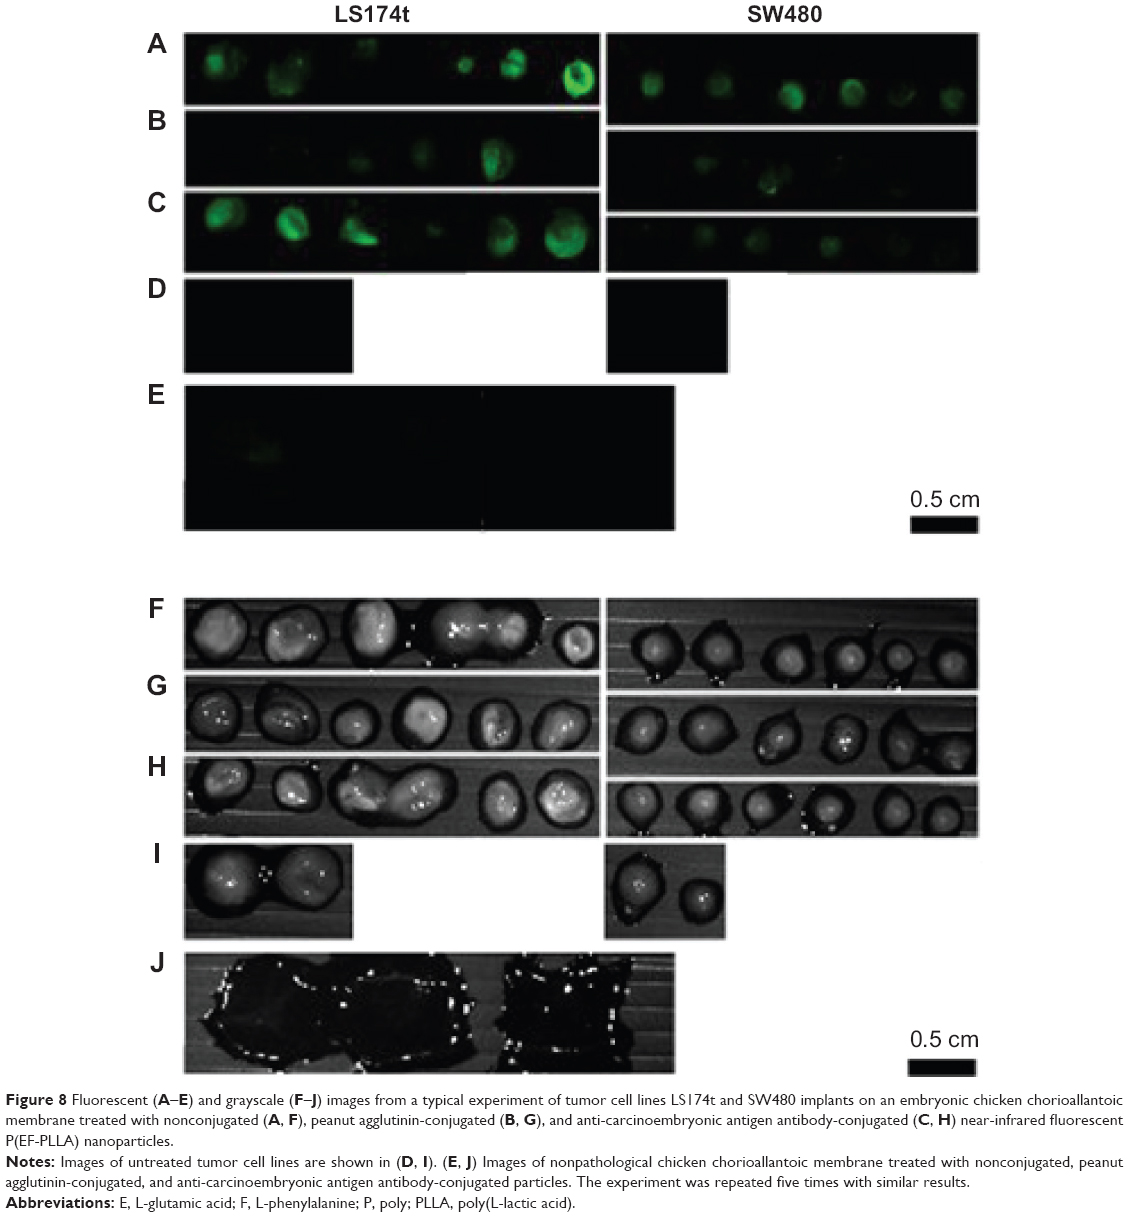 | Figure 8 Fluorescent (A–E) and grayscale (F–J) images from a typical experiment of tumor cell lines LS174t and SW480 implants on an embryonic chicken chorioallantoic membrane treated with nonconjugated (A, F), peanut agglutinin-conjugated (B, G), and anti-carcinoembryonic antigen antibody-conjugated (C, H) near-infrared fluorescent P(EF-PLLA) nanoparticles. |
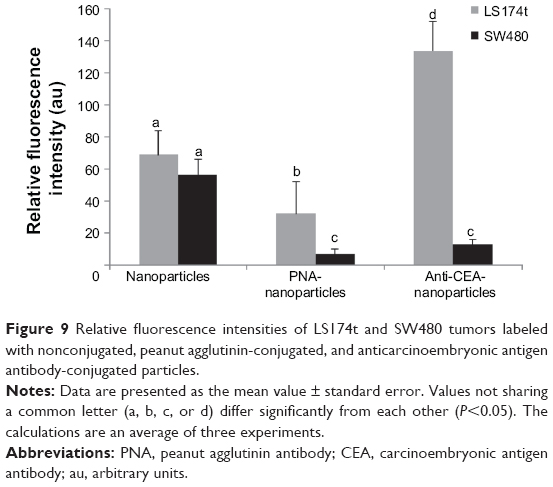 | Figure 9 Relative fluorescence intensities of LS174t and SW480 tumors labeled with nonconjugated, peanut agglutinin-conjugated, and anticarcinoembryonic antigen antibody-conjugated particles. |
Summary and conclusion
P(EF-PLLA) and P(EF) thermal proteinoids made of (L) glutamic acid, (L) phenylalanine in the presence and absence of PLLA (2,000 Da) were synthesized and characterized. P(EF-PLLA) was favored over P(EF) because of the biodegradability derived from the addition of PLLA to the polymer backbone and the obtained smaller particle size and size distribution. The proteinoid-PLLA was self-assembled in the presence of ICG to yield NIR fluorescent P(EF-PLLA) nanoparticles (70±15 nm dry diameter) by entrapping the dye within the hydrophobic interior of the nanoparticles. The nanoparticles were found to be stable, preventing leakage and photobleaching of the dye over time. The nanoparticles were tested for their cytotoxicity on human colorectal adenocarcinoma cell lines and were found to be nontoxic. This study demonstrated, using the CAM model, that the NIR fluorescent nanoparticles may be very useful for tumor diagnosis in vivo because of low background autofluorescence and deep penetration into biomatrices. When the NIR fluorescent proteinoid-PLLA nanoparticles are conjugated to bioactive ligands (PNA and anti-CEA), they maintain their activity and specifically detect the cancer cells with upregulated receptors (LS174t versus SW480). The nonconjugated NIR fluorescent nanoparticles marked both types of cells without specific recognition. It was suggested that the nonconjugated proteinoid-PLLA nanoparticles penetrate the cancer cells by both ligand–receptor interaction and uptake of the nanoparticles by the cells for nutrition. Moreover, the surrounding nonpathological tissue remains unlabeled by both the nonconjugated and the bioactive-conjugated fluorescent nanoparticles.
In future work, we plan to extend this study to other animal models, such as mice, to test the fluorescent labeling of tumors by intravenous injection of the NIR fluorescent nanoparticles. In addition, anticancer drugs such as doxorubicin and paclitaxel may be encapsulated within the NIR fluorescent P(EF-PLLA) nanoparticles, providing a strategy for both diagnosis and therapy of colon cancer.
Disclosure
The authors report no conflicts of interest in this work.
References
Fox SW, Harada K. Thermal copolymerization of amino acids to a product resembling protein. Science. 1958;128(3333):1214. | ||
Fox SW, Harada K. The thermal copolymerization of amino acids common to protein. J Am Chem Soc. 1959;82(14):3745–3751. | ||
Fox SW, Nakashima T, Przybylski A, Syren RM. The updated experimental proteinoid model. Int J Quantum Chem. 1982;22(Suppl S9):195–204. | ||
Fox SW, Waehneldt TV. The thermal synthesis of neutral and basic proteinoids. Biochim Biophys Acta. 1968;160(2):246–249. | ||
Harada K, Fox SW. The Thermal Condensation of Glutamic Acid and Glycine to Linear Peptides. J Am Chem Soc. 1957;80(11):2694–2697. | ||
Harada K, Matsuyama M. Polycondensation of thermal precursors of amino acids and characterization of constituent amino acids. Biosystems. 1979;11(1):47–53. | ||
Madhan Kumar AB, Panduranga Rao K. Preparation and characterization of pH-sensitive proteinoid microspheres for the oral delivery of methotrexate. Biomaterials. 1998;19(7–9):725–732. | ||
Quirk S. Triggered release of small molecules from proteinoid microspheres. J Biomed Mater Res A. 2009;91(2):391–399. | ||
Quirk S. Triggered release from peptide-proteinoid microspheres. J Biomed Mater Res A. 2010;92(3):877–886. | ||
Quirk S. Enhanced catalytic activity from proteinoid microspheres. J Biomed Mater Res A. 2013;101(4):1133–1143. | ||
Kumar D. Biodegradable Polymers. In: Encyclopedia of Polymer Science and Technology. Hoboken, NJ: Wiley Interscience; 2002. | ||
Auras R. Poly(lactic acid). In: Encyclopedia of Polymer Science and Technology. Hoboken, NJ: Wiley Interscience; 2010. | ||
Bahn PR, Pappelis A, Bozzola J. Protocell-like microspheres from thermal polyaspartic acid. Orig Life Evol Biosph. 2006;36(5–6):617–619. | ||
Bamnolker H, Nitzan B, Gura S, Margel S. New solid and hollow, magnetic and non-magnetic, organic-inorganic monodispersed hybrid microspheres: synthesis and characterization. J Mater Sci Lett. 1997;16(16):1412–1415. | ||
Syren RM, Sanjur A, Fox SW. Proteinoid microspheres more stable in hot than in cold water. Biosystems. 1985;17(4):275–280. | ||
Bae SK, Kim JD. Aggregation behaviors and their pH sensitivity of cholesterol-conjugated proteinoids composed of glutamic acid and aspartic acid matrix. J Biomed Mater Res A. 2003;64(2):282–290. | ||
Kokufuta E, Sakai H, Harada K. Factors controlling the size of proteinoid microspheres. Biosystems. 1983–1984;16(3–4):175–181. | ||
Müller-Herold U, Nickel G. The stability of proteinoid microspheres. Biosystems. 1994;33(3):215–220. | ||
Nakashima T. Metabolism of proteinoid microspheres. Top Curr Chem. 1987;139:57–81. | ||
Labianca R, Beretta GD, Mosconi S, Milesi L, Pessi MA. Colorectal cancer: screening. Ann Oncol. 2005;16(suppl 2):ii127–ii132. | ||
Burt RW, Barthel JS, Dunn KB, et al; NCCN. NCCN clinical practice guidelines in oncology. Colorectal cancer screening. J Natl Compr Canc Netw. 2010;8(1):8–61. | ||
Mandel JS, Church TR, Bond JH, et al. The effect of fecal occult-blood screening on the incidence of colorectal cancer. N Engl J Med. 2000;343(22):1603–1607. | ||
Nelson RS, Thorson AG. Colorectal cancer screening. Curr Oncol Rep. 2009;11(6):482–489. | ||
Kondepati VR, Keese M, Mueller R, Manegold BC, Backhaus J. Application of near-infrared spectroscopy for the diagnosis of colorectal cancer in resected human tissue specimens. Vib Spectrosc. 2007;44(2):236–242. | ||
Zeng H, Weiss A, Cline R, MacAulay CE. Real-time endoscopic fluorescence imaging for early cancer detection in the gastrointestinal tract. Bioimaging. 1998;6(4):151–165. | ||
Jiang S, Gnanasammandhan MK, Zhang Y. Optical imaging-guided cancer therapy with fluorescent nanoparticles. J R Soc Interface. 2010;7(42):3–18. | ||
Santra S, Dutta D, Walter GA, Moudgil BM. Fluorescent nanoparticle probes for cancer imaging. Technol Cancer Res Treat. 2005;4(6):593–602. | ||
Saxena V, Sadoqi M, Shao J. Indocyanine green-loaded biodegradable nanoparticles: preparation, physicochemical characterization and in vitro release. Int J Pharm. 2004;278(2):293–301. | ||
Saxena V, Sadoqi M, Shao J. Enhanced photo-stability, thermal-stability and aqueous-stability of indocyanine green in polymeric nanoparticulate systems. J Photochem Photobiol B. 2004;74(1):29–38. | ||
Sharma P, Brown S, Walter G, Santra S, Moudgil B. Nanoparticles for bioimaging. Adv Colloid Interface Sci. 2006;123–126:471–485. | ||
Altinoğlu EI, Adair JH. Near infrared imaging with nanoparticles. Wiley Interdiscip Rev Nanomed Nanobiotechnol. 2010;2(5):461–477. | ||
He X, Wang K, Cheng Z. In vivo near-infrared fluorescence imaging of cancer with nanoparticle-based probes. Wiley Interdiscip Rev Nanomed Nanobiotechnol. 2010;2(4):349–366. | ||
Gluz E, Grinberg I, Corem-Salkmon E, Mizrahi D, Margel S. Engineering of new crosslinked near-infrared fluorescent polyethylene glycol bisphosphonate nanoparticles for bone targeting. J Polym Sci A Polym Chem. 2013;51(20):4282–4291. | ||
Cohen S, Pellach M, Kam Y, et al. Synthesis and characterization of near IR fluorescent albumin nanoparticles for optical detection of colon cancer. Mater Sci Eng C. 2012;33(2):923–931. | ||
Corem-Salkmon E, Perlstein B, Margel S. Design of near-infrared fluorescent bioactive conjugated functional iron oxide nanoparticles for optical detection of colon cancer. Int J Nanomedicine. 2012;7:5517–5527. | ||
Sakuma S, Yano T, Masaoka Y, et al. Detection of early colorectal cancer imaged with peanut agglutinin-immobilized fluorescent nanospheres having surface poly(N-vinylacetamide) chains. Eur J Pharm Biopharm. 2010;74(3):451–460. | ||
Tang D, Yuan R, Chai Y. Magnetic core-shell Fe3O4@Ag nanoparticles coated carbon paste interface for studies of carcinoembryonic antigen in clinical immunoassay. J Phys Chem B. 2006;110(24):11640–11646. | ||
Heiskanen J. Comparison of three methods for determining the particle density of soil with liquid pycnometers. Commun Soil Sci Plant Anal. 1992;23(7–8):841–846. | ||
Epsztejn S, Glickstein H, Picard V, et al. H-ferritin subunit overexpression in erythroid cells reduces the oxidative stress response and induces multidrug resistance properties. Blood. 1999;94(10):3593–3603. | ||
Lanone S, Rogerieux F, Geys J, et al. Comparative toxicity of 24 manufactured nanoparticles in human alveolar epithelial and macrophage cell lines. Part Fibre Toxicol. 2009;6(14):14. | ||
Noiman T, Buzhor E, Metsuyanim S, et al. A rapid in vivo assay system for analyzing the organogenetic capacity of human kidney cells. Organogenesis. 2011;7(2):140–144. | ||
Haritoglou C, Freyer W, Priglinger SG, Kampik A. Light absorbing properties of indocyanine green (ICG) in solution and after adsorption to the retinal surface: an ex-vivo approach. Graefes Arch Clin Exp Ophthalmol. 2006;244(9):1196–1202. | ||
Zweck J, Penzkofer A. Microstructure of indocyanine green J-aggregates in aqueous solution. Chem Phys. 2001;269(1):399–409. | ||
Ma X, Santiago N, Chen YS, Chaudhary K, Milstein SJ, Baughman RA. Stability study of drug-loaded proteinoid microsphere formulations during freeze-drying. J Drug Target. 1994;2(1):9–21. | ||
Sakuma S, Yano T, Masaoka Y, et al. In vitro/in vivo biorecognition of lectin-immobilized fluorescent nanospheres for human colorectal cancer cells. J Control Release. 2009;134(1):2–10. | ||
Kaushal S, McElroy MK, Luiken GA, et al. Fluorophore-conjugated anti-CEA antibody for the intraoperative imaging of pancreatic and colorectal cancer. J Gastrointest Surg. 2008;12(11):1938–1950. | ||
Durupt F, Koppers-Lalic D, Balme B, et al. The chicken chorioallantoic membrane tumor assay as model for qualitative testing of oncolytic adenoviruses. Cancer Gene Ther. 2012;19(1):58–68. |
 © 2014 The Author(s). This work is published and licensed by Dove Medical Press Limited. The full terms of this license are available at https://www.dovepress.com/terms.php and incorporate the Creative Commons Attribution - Non Commercial (unported, v3.0) License.
By accessing the work you hereby accept the Terms. Non-commercial uses of the work are permitted without any further permission from Dove Medical Press Limited, provided the work is properly attributed. For permission for commercial use of this work, please see paragraphs 4.2 and 5 of our Terms.
© 2014 The Author(s). This work is published and licensed by Dove Medical Press Limited. The full terms of this license are available at https://www.dovepress.com/terms.php and incorporate the Creative Commons Attribution - Non Commercial (unported, v3.0) License.
By accessing the work you hereby accept the Terms. Non-commercial uses of the work are permitted without any further permission from Dove Medical Press Limited, provided the work is properly attributed. For permission for commercial use of this work, please see paragraphs 4.2 and 5 of our Terms.