")
Back to Journals » International Journal of General Medicine » Volume 8
Sleep Apnea Clinical Score, Berlin Questionnaire, or Epworth Sleepiness Scale: which is the best obstructive sleep apnea predictor in patients with COPD?
Authors Costa Faria A, Henrique da Costa C , Rufino R
Received 12 April 2015
Accepted for publication 11 June 2015
Published 25 August 2015 Volume 2015:8 Pages 275—281
DOI https://doi.org/10.2147/IJGM.S86479
Checked for plagiarism Yes
Review by Single anonymous peer review
Peer reviewer comments 3
Editor who approved publication: Dr Scott Fraser
Anamelia Costa Faria, Cláudia Henrique da Costa, Rogério Rufino
Cardiopulmonology Department, State University of Rio de Janeiro, Rio de Janeiro, RJ, Brazil
Introduction: The Sleep Apnea Clinical Score (SACS) and the Berlin Questionnaire (BQ) are used to predict the likelihood of obstructive sleep apnea (OSA). The Epworth Sleepiness Scale (ESS) is used to assess daytime sleepiness, a common OSA symptom. These clinical tools help prioritize individuals with the most severe illness regarding on whom polysomnography (PSG) should be performed. It is necessary to check the applicability of these tools in patients with chronic obstructive pulmonary disease (COPD). The aim of this study is to compare SACS, BQ, and ESS performance in patients with COPD.
Methods: The SACS, BQ, and ESS were applied to 91 patients with COPD. From this group, 24 underwent PSG. In this transversal study, these three tests were compared regarding their likelihood to predict OSA in patients with COPD using receiver-operating characteristic curve statistics.
Results: In this sample, 58 (63.7%) patients were men, and their mean age was 69.4±9.6 years. Fourteen patients (15.4%) had a high probability of OSA by SACS, 32 (32.5%) had a high probability by BQ, and 37 (40.7%) had excessive diurnal somnolence according to the ESS. From the 24 patients who underwent PSG, OSA diagnosis was confirmed in five (20.8%), according to the American Academy of Sleep Medicine criteria. BQ and ESS did not accurately predict OSA in this group of patients with COPD, with a receiver-operating characteristic curve area under the curves of 0.54 (95% CI: 0.329–0.745, P=0.75) and 0.69 (95% CI: 0.47–0.860, P=0.10), respectively. SACS performance was significantly better, with an area under the curve of 0.82 (95% CI: 0.606–0.943, P=0.02).
Conclusion: SACS was better than BQ and ESS in predicting OSA in this group of patients with COPD.
Keywords: overlap syndrome, COPD, emphysema, questionnaire, polysomnography, diagnosis
Introduction
Obstructive sleep apnea (OSA) and chronic obstructive pulmonary disease (COPD) represent two of the most prevalent chronic respiratory disorders in clinical practice.1,2
Therefore, it is expected that the coexistence of both conditions in the same individual – the so-called overlap syndrome (OS) – will be high by chance alone. The Sleep Heart Health Study provided epidemiologic data showing that OSA prevalence is the same in COPD and healthy individuals, with no physiopathogenic connection.3 It is important to know whether COPD and OSA coexist because both diseases are associated with systemic inflammation, which may contribute to cardiovascular disease. Furthermore, OS may predispose the patient to pulmonary hypertension.4 In fact, Marin et al showed that OS was associated with an increased risk of death and hospitalization due to COPD exacerbation when OSA was not treated with continuous positive airway pressure.5
While a COPD diagnosis is simple and inexpensive,6 confirmation of OSA requires an overnight polysomnography (PSG), a time-consuming and expensive test of limited availability.7 The increasing recognition of OSA as a prevalent and high-mortality disease has increased PSG demand. Even in developed countries, there are long waiting periods for sleep studies.8,9 Several approaches were developed to reduce costs and delay OSA testing, such as portable monitors for home PSG,10 split-night tests, which consist of performing a diagnostic PSG and titration on the same night,11 and clinical prediction models to prioritize the most severe cases.12,13 The Sleep Apnea Clinical Score (SACS)14 and the Berlin Questionnaire (BQ)15 are examples of such models, while the Epworth Sleepiness Scale (ESS) is used to assess daytime sleepiness.16 Since sleepiness is a very common OSA symptom, ESS scores are positively correlated with an objective apnea–hypopnea index (AHI) in non-COPD populations.17 The American Academy of Sleep Medicine (AASM) recommends home PSG and split-night tests only in patients with a high pretest probability of being OSA, since these methods may underestimate the AHI. However, the AASM does not define which one is the best model to estimate OSA probability.10
Many studies have tested the accuracy of these models in individuals referred to sleep laboratories, which may impair their external validation.18 Therefore, it is necessary to know how to select patients with COPD for referral to PSG. The aim of this study is to compare SACS, BQ, and ESS performance in patients with COPD.
Methods
Patients
Two hundred and six patients from the outpatient service at Rio de Janeiro State University were enrolled with a COPD diagnosis, defined according to the current document of the Global Initiative for Chronic Obstructive Lung Disease (GOLD), ie, forced expiratory volume in 1 second (FEV1)/forced vital capacity (FVC) ratio <0.70 associated with typical symptoms and history of exposure to risk factors. In this group, all patients included were currently or had previously been smokers, with a smoking history ≥20 packs per year. The severity assessment was based on a spirometric classification.6 Exclusion criteria were exacerbation in the last 3 months, oxygen supplementation, other lung diseases, body mass index (BMI) greater than 30 kg/m2, noncompensated heart failure, neuromuscular disease with repercussion on ventilatory mechanics, psychiatric or neurologic illness that could compromise the questionnaire’s validity, collagen diseases, uncontrolled hypothyroidism, and use of amphetamines. Patients with a BMI greater than 30 kg/m2 were excluded to avoid the inclusion of patients with obesity hypoventilation syndrome.
Questionnaires
The questionnaires were presented to all 206 patients with COPD (Figure 1).
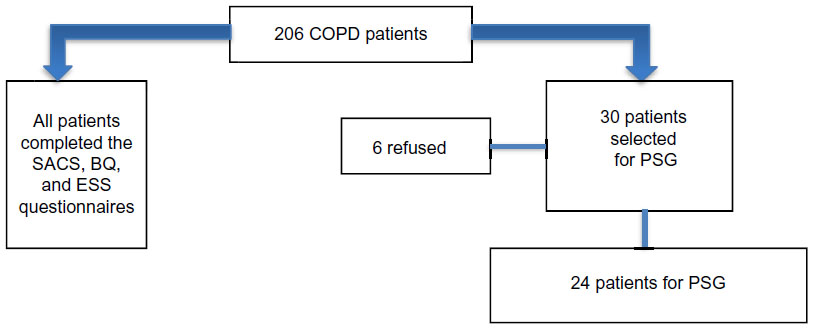 | Figure 1 Flowchart of recruitment. |
The SACS is a screening tool based on snoring, witnessed episodes of apnea, neck circumference (NC), and systemic hypertension, which can be used to calculate likelihood ratios for the presence of OSA. In non-COPD populations, those who obtain scores greater than or equal to 15 points are considered as having a high pretest probability of OSA.14
The BQ includes ten self-administered questions, organized into three categories: snoring and apnea (five questions), daytime sleepiness (four questions), and hypertension/obesity (one question). The determination of a high or low pretest probability of OSA is based on responses in each category of items.15
The ESS is a self-report questionnaire that evaluates the tendency to fall asleep in eight daily situations. The ESS score ranges from 0 to 24, and a score equal to or greater than 10 indicates excessive daytime sleepiness in non-COPD populations.16
PSG and OSA diagnostic criteria
Since it was not possible to perform PSG on all participants, 30 patients were randomly selected. However, six refused, so 24 were objectively tested. Twenty-four patients underwent PSG with the Embletta Gold® (Embla – Natus Medical Inc., San Carlos, CA, USA) portable monitor in a hospital setting. The Embletta Gold® is a portable diagnostic device that records airflow through a nasal cannula connected to a pressure transducer and an oronasal thermistor, oxygen saturation, and both respiratory and abdominal movements by respiratory inductance plethysmography, electrocardiography, and activity through actigraphy. This device, even without the actigraphy, is highly sensitive (92.4%) and specific (85.7%) in quantifying the AHI compared with an attended full-channel nocturnal PSG in patients with suspected OSA. The AHI obtained by the Embletta® correlated closely with that obtained by PSG (Pearson correlation, r=0.979, P<0.001). This simple device is considered useful for screening and diagnostic purposes when access to PSG is limited.19
Respiratory events were manually scored by a responsible physician, using the criteria of the AASM manual for the scoring of sleep and associated events, published in 2007.20 All tests lasted for a minimum of 6 hours. OSA was diagnosed according to current AASM criteria,21 namely daytime sleepiness, loud snoring, and witnessed breathing interruptions or awakenings due to gasping or choking; those who experienced five or more obstructive respiratory events (apneas or hypopneas) per hour of sleep were considered to have OSA, as well as those with 15 or more obstructive respiratory events per hour of sleep, even in the absence of sleep-related symptoms.
Statistical analysis
In this transversal study, receiver-operating characteristic (ROC) curves were constructed to assess the SACS, BQ, and ESS regarding their likelihood to predict OSA in patients with COPD. Differences in area under the curve (AUC) were calculated using the method of DeLong. The results of the three questionnaires were compared to each other using Pearson’s correlation coefficient. For continuous variables, comparisons between high and low probabilities of OSA by SACS and BQ were made using independent t-tests for normal distribution variables and the Mann–Whitney U-test for abnormal variables. The chi-square test or Fisher’s exact test was used for categorical variables, as deemed appropriate. The results were presented as means and standard deviations. P-values <0.05 were considered statistically significant. All analyses were performed using MedCalc version 12.7.0.0 (MedCalc Software bvba, Ostend, Belgium).
Ethical concerns
The Research Ethics Committee of the State University of Rio de Janeiro approved the study protocol (number 0061.0.228.000-10). After a description of objectives and methods to be used was provided, all participants gave their informed consent. The authors have no conflicts of interest related to this manuscript.
Results
From the 206 patients enrolled, 114 (55.3%) were excluded due to at least one of the exclusion criteria. Obesity and tuberculosis sequelae were the main causes of exclusion. All 91 patients included responded to the questionnaires, and 24 randomly underwent PSG.
From 91 patients, 58 (63.7%) were men, and the mean age was 69.4±9.6 years. Mean values of BMI, NC, and FEV1 were, respectively, 23.6±3.9 kg/m2, 37.0±3.7 cm, and 54.3%±20.9% of predicted values. The median value of SACS was four points (2.0–8.8), and the mean ESS was 9.2±5.7 points. Fourteen patients (15.4%) had a high probability of OSA by SACS, 32 (32.5%) had a high probability by BQ, and 37 (40.7%) had excessive diurnal somnolence by ESS.
Severity assessment
The correlation between the questionnaires was weak (ESS vs SACS, r=0.011, P=0.31; ESS vs Berlin, r=0.0007, P=0.79; SACS vs Berlin, r=0.033, P=0.08).
From 91 patients, 24 were randomly selected to perform PSG. This sample was composed of 16 men (66.7%), whose mean age was 68.9±8.2 years. Mean values of BMI, NC, and FEV1 were, respectively, 23.6±3.2 kg/m2, 37.0±3.1 cm, and 55.5%±22.2% of predicted values. The median value of the SACS was four points (2.0–7.5), and four patients (16.7%) had a high probability of OSA by SACS, while eight patients (33.0%) had a high probability by BQ. Mean ESS was 9.1±6.6 points, and eight patients (33.3%) were considered to have excessive diurnal somnolence. There was no significant difference between participants who underwent PSG (n=24) and those who did not (n=67) (Table 1).
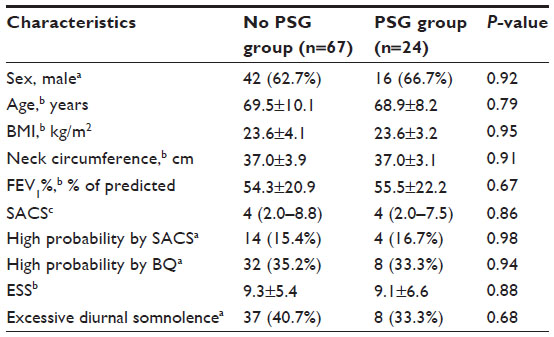 | Table 1 Comparison of patient characteristics between participants who underwent PSG and those who did not |
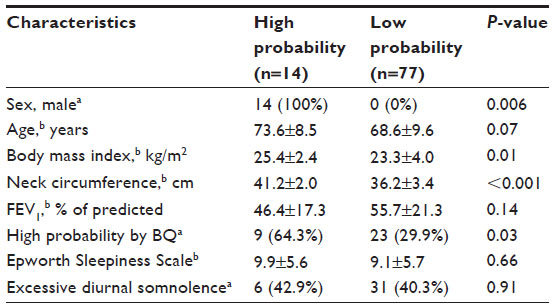
Demographic and clinical characteristics of the 24 participants, stratified by the OSA diagnosis, are presented in Table 2. Only NC mean, SACS median, and frequency of OSA high probability by SACS were statistically different between groups with and without OSA.
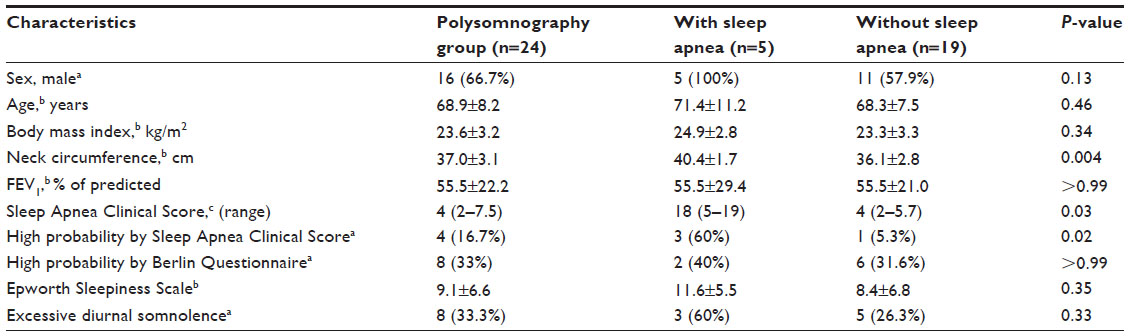 | Table 2 Characteristics of patients who performed polysomnography, stratified by sleep apnea diagnosis |
For the 24 participants who underwent PSG, we constructed ROC curves of SACS, BQ, and ESS. Table 3 shows sensitivity, specificity, positive predictive value, negative predictive value, and AUC of each questionnaire. Both BQ and ESS were poor at predicting or ruling out OSA, with AUCs of 0.542 (95% CI: 0.329–0.745; P=0.75) and 0.689 (95% CI: 0.470–0.860; P=0.10), respectively, while SACS had an AUC of 0.816 (95% CI: 0.606–0.943; P=0.02). SACS was significantly better than BQ in screening patients with COPD for OSA, with a difference between the areas of 0.274 (P=0.04). ROC curves for SACS, BQ, and ESS are shown in Figure 2. ROC statistics recommended a cutoff >11 points for SACS and >10 points for ESS.
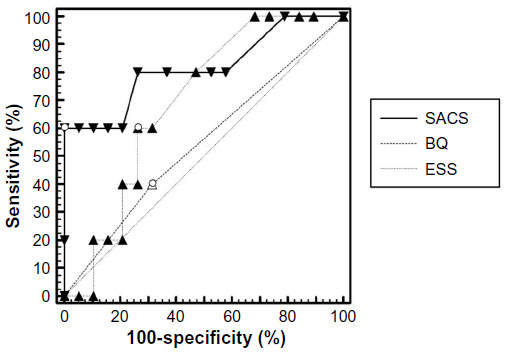 | Figure 2 ROC curves for SACS, BQ, and ESS. |
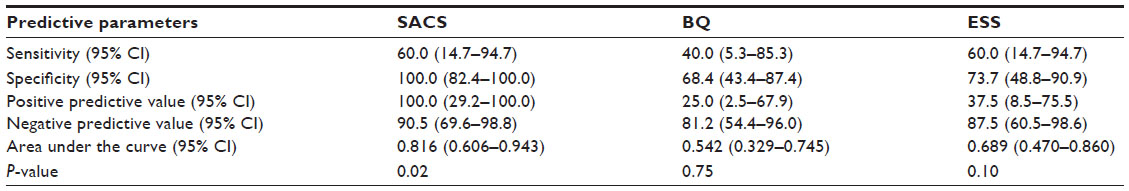 | Table 3 Predictive parameters for Sleep Apnea Clinical Score, Berlin Questionnaire, and Epworth sleepiness score |
Categorizing all 91 participants in groups of high and low probabilities of OSA by SACS, we found no difference in age, FEV1%, ESS, or frequency of sleepiness in patients, but NC, BMI, and frequency of high probability by BQ were significantly greater in the high probability group by SACS (Table 4).
 | Table 4 Patient characteristics according to obstructive sleep apnea probability by Sleep Apnea Clinical Score |
Comparing groups of high and low probabilities of OSA by BQ, there was no difference in sex, age, BMI, NC, ESS, or frequency of sleepiness in individuals. However, FEV1 %, SACS, and frequency of patients with a high probability of OSA by SACS were significantly greater in the high probability group by BQ (Table 5).
 | Table 5 Patient characteristics according to obstructive sleep apnea probability by the Berlin Questionnaire |
Discussion
In this transversal study, SACS, BQ, and ESS performance were evaluated as screening tools for sleep apnea in patients with COPD.
The literature shows that, in the general population, clinical prediction models tend to have high-sensitivity (76%–96%) and low specificity (13%–54%).12 Until now, no model was considered accurate enough to confirm or rule out OSA diagnosis reliably enough to dispense with PSG.7
The GOLD document, revised in 2006, recommends PSG when hypoxemia or right heart failure develops in the presence of relatively mild airflow limitation or when the patient has symptoms suggestive of sleep apnea. This recommendation remained until the 2011 revision, which makes no mention of sleep studies, although it assumes that patients with OS have clear benefits with the use of airway positive pressure.6 Both GOLD revisions recommend asking about sleep interruptions, dyspnea, or chest discomfort during follow-up visits with patients with COPD, which is nonspecific for OSA.
In the present study, all individuals with other pulmonary diseases, a history of recent exacerbation (<3 months), or other possible causes of pulmonary hypertension and hypoxemia were excluded. These criteria resulted in the exclusion of a significant number of patients (55.3% of the initial sample), many of whom had the overlap COPD–asthma and exacerbator phenotypes. Thus, the predominant phenotype in this sample was the emphysema–hyperinflation. Patients with this last phenotype presented were impaired with dyspnea as the most relevant symptom and a tendency toward a lower BMI. This phenotype is characterized by the presence of hyperinflation in the tomography, lower level of diffusion tests, and poor therapeutic response to inhaled corticosteroids and bronchodilators.22 In fact, in this sample, the mean lung diffusing capacity determined by the single-breath technique (DLCOsb) was reduced (56.7%±23.4% of predicted values), and the related residual volume/total lung capacity (RV/TLC%) was increased (121.9%±27.1% of predicted values).
Only patients with a well-established diagnosis of COPD, with a significant history of smoking (at least 20 packs per year), with a stable disease, without exacerbation for at least 3 months, and without other lung diseases were included. This rigorous sample selection differentiates this study from others that have larger samples.
Our sample was constituted predominantly by men with a mean age of 69.4±9.6 years (range: 48–85 years) who had typical epidemiological characteristics of COPD. Patients with a BMI of 30 kg/m2 or greater were excluded, which explains the relatively low average of this index (23.6±3.9 kg/m2).
Although mean ESS was normal, 37 patients (40.7%) had excessive daytime sleepiness (ESS >10 points). The quality of sleep in patients with COPD, even without OSA, was impaired due to increased rates of arousal and decreased rapid eye movement (REM) stages,23,24 which may explain the relatively high proportion of somnolent individuals in this sample.
According to the literature, NC is better than BMI as an OSA predictor, but there is a correlation between BMI and NC.25 The exclusion of obese patients (BMI above 30 kg/m2) possibly caused a drop in NC average, which may also have contributed to reduce the SACS value. In addition, it may have reduced the number of patients with the chronic bronchitis phenotype who used to be brevilineal, just like patients with OSA.
In contrast, BQ includes two questions with the word “tired” (Are you tired after sleeping? and Are you tired during waking time?).15 Patients with COPD interpret the word “tired” as dyspnea, which may have increased the number of patients with a high probability of OSA by BQ (despite the exclusion of patients with a BMI above 30 kg/m2, one of the BQ items). This hypothesis is supported by the fact that FEV1% was significantly lower in the group of high probability by BQ (Table 5). It is expected that individuals with lower FEV1 values have more pronounced dyspnea (tiredness). Interestingly, data from general populations have demonstrated that a high-risk Berlin score has a sensitivity ranging from 68% to 86% and a specificity ranging from 46% to 95% for OSA.15,26,27 These results were not seen in our group of patients with COPD.
Patients with a high probability of OSA by SACS were all males and had a higher frequency of OSA high probability by BQ than those with a low probability. Furthermore, NC was superior, which was to be expected, since this parameter was used to calculate the SACS value.
Comparing groups with low and high probabilities of OSA by BQ, FEV1% was significantly lower in the high probability group. Despite the lack of agreement between SACS and BQ, the mean value of SACS was higher in the high probability group by BQ.
Observing Table 3 and Figure 1, we can verify the superiority of SACS over BQ in sensitivity, specificity, positive predictive value, and negative predictive value. However, PSG is mandatory to confirm or exclude OSA diagnosis. According to Flemons, a score of 15 or greater on the SACS gives a likelihood of 4.45 of having moderate-to-severe sleep apnea (14); however, in this study group, ROC statistics recommended a cutoff >11 points for SACS.
It is difficult to compare the OSA proportion in this sample with epidemiological studies, since there were no obese individuals and none aged below 48 years. Nevertheless, the presence of very low AHI in patients with OS (only one case with severe OSA) led to the hypothesis that emphysema could “protect” against OSA. There are three mechanisms that could explain this “protection”. One is the lower prevalence of obesity, especially in patients with a more severe form of disease, which is often associated with malnutrition. Another mechanism is the reduction of REM stage duration, in which obstructive events (apneas and hypopneas) are more frequent due to higher muscle relaxation. Finally, the greater end-expiratory lung volume, caused by trapped air in hyperinflation, tends to increase axial traction walls of the pharynx, by caudal displacement of the trachea.28
One limitation of this trial was the use of PSG type III, which is not recommended by the AASM for the evaluation of patients with OSA COPD or other comorbidities.10 This occurred due to the absence of a type I monitor in our service. This limitation was minimized by using high-quality sensors (pressure cannula and effort belts with respiratory inductance plethysmography), by the presence of actigraphy in Embletta® to enable the elimination of periods of waking/artifact from the final index time (the monitoring time used for AHI calculation), and by manually scoring the respiratory events using the AASM criteria.
In the Sleep Heart Health Study,3 5,954 individuals from the general population were evaluated by type II PSG and spirometry, and all patients with FEV1/FVC <70% were considered to have “chronic obstructive airway”, regardless of the origin of the lower airway obstruction. Furthermore, obese patients were not excluded, and COPD classification of severity was based on FEV1/FVC and not on FEV1%, as recommended by the GOLD initiative. According to the classification adopted by Sanders, 96% of patients with “obstructive airway disease” had a mild form of the disease (FEV1/FVC >60%), unlike our sample, in which only 10.9% had a mild form of the disease according to the spirometric GOLD criteria. Sanders found no statistically significant difference between OSA prevalence in patients with “obstructive airway disease” and in individuals without “obstructive airway disease”. However, data obtained from this study should be interpreted with caution, despite the large number of participants.
The present study demonstrated that, in the group of emphysema patients, the correlation between SACS and BQ was low. Sensitivity, specificity, positive predictive value, negative predictive value, and accuracy of SACS were higher than BQ. SACS can be a useful tool in screening patients with COPD for referral to sleep studies.
Acknowledgments
The authors thank the sleep technicians who performed the exams as well as all patients who took part in the present research. In addition, the authors recognize the vital support received from FAPERJ (Foundation for Research Support of the State of Rio de Janeiro).
Disclosure
The authors report no conflicts of interest in this work.
References
Tufik S, Santos-Silva R, Taddei JA, Bittencourt LR. Obstructive sleep apnea syndrome in the Sao Paulo Epidemiologic Sleep Study. Sleep Med. 2010;11(5):441–446. | |
Menezes AM, Jardim JR, Perez-Padilla R. Prevalence of chronic obstructive pulmonary disease and associated factors: the PLATINO Study in Sao Paulo, Brazil. Cad Saude Publica. 2005;21(5):1565–1573. | |
Steveling EH, Clarenbach CF, Miedinger D, et al. Predictors of the overlap syndrome and its association with comorbidities in patients with chronic obstructive pulmonary disease. Respiration. 2014;88(6):451–457. | |
Chaouat A, Weitzenblum E, Krieger J, Ifoundza T, Oswald M, Kessler R. Association of chronic obstructive pulmonary disease and sleep apnea syndrome. Am J Respir Crit Care Med. 1995;151(1):82–86. | |
Marin JM, Soriano JB, Carrizo SJ, Boldova A, Celli BR. Outcomes in patients with chronic obstructive pulmonary disease and obstructive sleep apnea: the overlap syndrome. Am J Respir Crit Care Med. 2010; 182(3):325–331. | |
Global Initiative for Chronic Obstructive Lung Disease. [homepage on the internet]. Available at www.goldcopd.com. Accessed April 12, 2015. | |
Epstein LJ, Kristo D, Strollo PJ Jr, et al. Clinical guideline for the evaluation, management and long-term care of obstructive sleep apnea in adults. J Clin Sleep Med. 2009;5(3):263–276. | |
Flemons WW, Douglas NJ, Kuna ST, Rodenstein DO, Wheatley J. Access to diagnosis and treatment of patients with suspected sleep apnea. Am J Respir Crit Care Med. 2004;169(6):668–672. | |
Fleetham J. Postal code diagnosis and treatment of sleep apnea. Can Respir J. 2010;17(4):169. | |
Collop NA, Anderson WM, Boehlecke B, et al. Portable Monitoring Task Force of the American Academy of Sleep Medicine. Clinical guidelines for the use of unattended portable monitors in the diagnosis of obstructive sleep apnea in adult patients. J Clin Sleep Med. 2007;3(7):737–747. | |
Deutsch PA, Simmons MS, Wallace JM. Cost-effectiveness of split-night polysomnography and home studies in the evaluation of obstructive sleep apnea syndrome. J Clin Sleep Med. 2006;2(2):145–153. | |
Rowley JA, Aboussouan LS, Badr MS. The use of clinical prediction formulas in the evaluation of obstructive sleep apnea. Sleep. 2000;23(7):929–938. | |
Musman S, Passos VM, Silva IB, Barreto SM. Evaluation of a prediction model for sleep apnea in patients submitted to polysomnography. J Bras Pneumol. 2011;37(1):75–84. | |
Flemons WW, Whitelaw WA, Brant R, Remmers JE. Likelihood ratios for a sleep apnea clinical prediction rule. Am J Respir Crit Care Med. 1994;150(5):1279–1285. | |
Netzer NC, Stoohs RA, Netzer CM, Clark K, Strohl KP. Using the Berlin Questionnaire to identify patients at risk for the sleep apnea syndrome. Ann Intern Med. 1999;131(7):485–491. | |
Johns MW. A new method for measuring daytime sleepiness: the Epworth Sleepiness Scale. Sleep. 1991;14(6):540–545. | |
Goncalves MA, Paiva T, Ramos E, Guilleminault C. Obstructive sleep apnea syndrome, sleepiness, and quality of life. Chest. 2004;125(6):2091–2096. | |
Abrishami A, Khajehdehi A, Chung F. A systematic review of screening questionnaires for obstructive sleep apnea. Can J Anesth. 2010;57(5):423–438. | |
Ng SS, Chan TO, To KW, et al. Validation of Embletta Portable Diagnostic System for identifying patients with suspected obstructive sleep apnoea syndrome (OSAS). Respirology. 2010;15(2):336–342. | |
Iber C, Ancoli-Israel S, Chesson AL Jr, Quan SF. For the American Academy of Sleep Medicine. The AASM Manual for the Scoring of Sleep and Associated Events: Rules, Terminology and Technical Specifications. 1st ed. Westchester: American Academy of Sleep Medicine; 2007. | |
American Academy of Sleep Medicine. International Classification of Sleep Disorders: Diagnostic and Coding Manual. 2nd ed. Westchester: American Academy of Sleep Medicine; 2005. | |
Miravitlles M, Calle M, Soler-Cataluna JJ. Clinical phenotypes of COPD: identification, definition and implications for guidelines. Arch Bronch. 2012;48(3):86–98. | |
McNicholas WT. Impact of sleep in COPD. Chest. 2000;117(2 Suppl):48S–53S. | |
Budhiraja R, Siddiqi TA, Quan SF. Sleep disorders in chronic obstructive pulmonary disease: etiology, impact, and management. J Clin Sleep Med. 2015;11(3):259–270. | |
Davies RJ, Ali NJ, Stradling JR. Neck circumference and other clinical features in the diagnosis of the obstructive sleep apnoea syndrome. Thorax. 1992;47(2):101–105. | |
Ahmadi N, Chung SA, Gibbs A, Shapiro CM. The Berlin questionnaire for sleep apnea in a sleep clinic population: relationship to polysomnographic measurement of respiratory disturbance. Sleep Breath. 2008;12(1):39–45. | |
Sharma SK, Vasudev C, Sinha S, Banga A, Pandey RM, Handa KK. Validation of the modified Berlin questionnaire to identify patients at risk for the obstructive sleep apnoea syndrome. Indian J Med Res. 2006; 124(3):281–290. | |
Stanchina ML, Malhotra A, Fogel RB, et al. The influence of lung volume on pharyngeal mechanics, collapsibility, and genioglossus muscle activation during sleep. Sleep. 2003;26(7):851–856. |
 © 2015 The Author(s). This work is published and licensed by Dove Medical Press Limited. The full terms of this license are available at https://www.dovepress.com/terms.php and incorporate the Creative Commons Attribution - Non Commercial (unported, v3.0) License.
By accessing the work you hereby accept the Terms. Non-commercial uses of the work are permitted without any further permission from Dove Medical Press Limited, provided the work is properly attributed. For permission for commercial use of this work, please see paragraphs 4.2 and 5 of our Terms.
© 2015 The Author(s). This work is published and licensed by Dove Medical Press Limited. The full terms of this license are available at https://www.dovepress.com/terms.php and incorporate the Creative Commons Attribution - Non Commercial (unported, v3.0) License.
By accessing the work you hereby accept the Terms. Non-commercial uses of the work are permitted without any further permission from Dove Medical Press Limited, provided the work is properly attributed. For permission for commercial use of this work, please see paragraphs 4.2 and 5 of our Terms.