")
Back to Journals » Journal of Pain Research » Volume 10
Sensitivity to Pain Traumatization Scale: development, validation, and preliminary findings
Authors Katz J , Fashler SR, Wicks C, Pagé MG , Roosen KM, Kleiman V, Clarke H
Received 7 February 2017
Accepted for publication 7 April 2017
Published 30 May 2017 Volume 2017:10 Pages 1297—1316
DOI https://doi.org/10.2147/JPR.S134133
Checked for plagiarism Yes
Review by Single anonymous peer review
Peer reviewer comments 2
Editor who approved publication: Professor E Alfonso Romero-Sandoval
Joel Katz,1,2 Samantha R Fashler,1 Claire Wicks,1 M Gabrielle Pagé,3 Kaley M Roosen,1 Valery Kleiman,1 Hance Clarke2
1Department of Psychology, York University, 2Department of Anesthesia and Pain Management, Toronto General Hospital, Toronto, ON, 3Centre de recherche du Centre hospitalier de l’Université de Montréal (CRCHUM), Montreal, QC, Canada
Background: This article reports three studies describing the development and validation of the 12-item Sensitivity to Pain Traumatization Scale (SPTS-12). SPT refers to the anxiety-related cognitive, emotional, and behavioral reactions to pain that resemble the features of a traumatic stress reaction.
Methods: In Study 1, a preliminary set of 79 items was administered to 116 participants. The data were analyzed by using combined nonparametric and parametric item response theory resulting in a 12-item scale with a one-factor structure and good preliminary psychometric properties. Studies 2 and 3 assessed the factor structure and psychometric properties of the SPTS-12 in a community sample of 823 participants (268 with chronic pain and 555 pain-free) and a clinical sample of 345 patients (126 with chronic post-surgical pain, 92 with other nonsurgical chronic pain, and 127 with no chronic pain) at least 6 months after undergoing coronary artery bypass graft surgery, respectively.
Results: The final SPTS-12 derived from Study 1 comprised 12 items that discriminated between individuals with different levels of SPT, with the overall scale showing good to very good reliability and validity. The results from Studies 2 and 3 revealed a one-factor structure for chronic pain and pain-free samples, excellent reliability and concurrent validity, and moderate convergent and discriminant validity.
Conclusion: The results of the three studies provide preliminary evidence for the validity and reliability of the SPTS-12.
Keywords: chronic pain, chronic post-surgical pain, trauma, psychology, scale development, measurement, item response theory analysis, factor analysis
Introduction
In the past 20 years, there has been an increase in the published literature linking chronic pain with anxiety, anxiety-related states, and traumatic stress reactions.1–6 For example, a large US population-based survey of 5,692 individuals reported a 12-month prevalence rate of 19% for chronic neck or back pain and 26.5% for any anxiety disorder, with the highest odds ratios for posttraumatic stress disorder (PTSD; 2.6 [95% confidence interval {CI}: 2.1, 3.3]) and generalized anxiety disorder (GAD; 2.6 [95% CI: 2.0, 3.5]), indicating that individuals with spinal pain are >2.5 times more likely to have PTSD or GAD than are those without chronic pain.7
Results such as these have led to theoretical models explaining the high level of comorbidity between chronic pain and PTSD. Mutual maintenance models6,8 propose that the psychological, physical, and behavioral symptoms of PTSD maintain both pain and PTSD, emphasizing the role of seven core mechanisms that are mutually reinforcing: attentional/reasoning biases, anxiety sensitivity, reminders of the trauma or emotional triggers, avoidance, depressive symptoms, anxiety related to pain perceptions, and high cognitive load. Vulnerability models1,9,10 propose that preexisting risk factors, and their interplay, render vulnerable individuals more susceptible to develop both PTSD and chronic pain. Possible shared vulnerability factors include individual characteristics (eg, anxiety sensitivity), behavioral response to trauma (eg, avoidance/escape), and physiological factors (eg, low threshold for alarm, heightened startle response). Moreover, the shared vulnerability model suggests that elevated anxiety can reduce the threshold for pain, which may increase distress and pain-related disability.1
Taken together, theoretical and empirical research has advanced an understanding of the etiology and maintenance of comorbid chronic pain and PTSD, highlighting the contribution of several pain-related anxiety constructs. However, research examining how these constructs are conceptually related has lagged behind theoretical models.4 Some researchers11 have proposed that comorbidity between chronic pain and PTSD is due to a single underlying construct to which these individual factors relate. Kleiman et al4 evaluated the presence of such a hierarchical organization by examining the factor structure of three commonly used pain-related anxiety constructs: anxiety sensitivity (Anxiety Sensitivity Index; ASI), pain anxiety (Pain Anxiety Symptoms Scale – Short Form; PASS-20), and pain catastrophizing (Pain Catastrophizing Scale; PCS). The authors found that one higher-order factor best accounted for the shared variation among these scales and termed this construct “Sensitivity to Pain Traumatization” (SPT). SPT was defined as the propensity to develop anxiety-related somatic, cognitive, emotional, and behavioral responses to pain that resemble features of a traumatic stress reaction.
More specifically, Kleiman et al4 conducted an exploratory factor analysis (EFA) and a subsequent higher-order analysis of the ASI, PCS, and PASS-20 items from 444 patients scheduled for major surgery. The results revealed that, 1) 20 items loaded exclusively, and significantly, on one higher-order factor (SPT); 2) SPT scores correlated significantly with scores on the Posttraumatic Stress Disorder Checklist – Civilian Version (PCL-C); 3) SPT scores were significantly higher in patients with a history of pain than in those without a history of pain, both prior to surgery and 1-year after surgery; and 4) pre-surgery SPT scores, but not pre-surgery PCL-C scores, were significantly higher in patients with chronic postsurgical pain (CPSP) 1-year after surgery. These results provided preliminary support for the validity of the SPT construct.
Kleiman et al4 emphasized that SPT is not equivalent to PTSD. Although both involve traumatic stress reactions, SPT defines a sensitivity (ie, vulnerability) to develop pain traumatization which partly depends on the pain and traumatic histories of the person. Pain itself is viewed as a potential traumatic stressor in vulnerable people (which is clearly inconsistent with current Diagnostic and Statistical Manual of Mental Disorders, Fifth Edition (DSM-5) conceptualization of PTSD) and people who are high on the SPT construct have not necessarily been traumatized by a specific painful event.
Kleiman et al4 also noted that further work was needed to refine the construct and its corresponding measurement. First, although most of the 20 items making up the preliminary SPT scale fell into symptom clusters consistent with traumatic stress reactions (eg, experiencing/re-experiencing, avoidance, increased arousal), three items did not. Second, because the scales administered (ASI, PCS, and PASS-20) were not specifically designed to measure pain as a traumatic stress reaction, certain symptoms common to such reactions were not represented in the SPT factor structure (eg, emotional numbing, dissociation, and detachment). Thus, the main objectives of the following three studies were to develop a scale to measure the SPT construct and evaluate its psychometric properties in three different samples of participants. The data analytic approach included Item Response Theory (IRT) and Classical Test Theory (CTT) analyses to develop the scale (Study 1) and EFA (Studies 2 and 3) to evaluate its factor structure.
Study 1
Aims
The aims of Study 1 were to develop an initial sample of items for the Sensitivity to Pain Traumatization Scale (SPTS) using IRT and to assess the preliminary psychometric properties of this new measurement tool.12 Items were selected (see ‘Methods’ section) for inclusion in the final scale on the basis of their psychometric properties and their theoretical relatedness to the six dimensions of SPT.
Methods
Item generation
Given the preliminary work by Kleiman et al,4 the authors of the present study began to compile a list of items related to the SPT construct from the PCS, PASS-20, and ASI as well as from other related scales and measures that have been proven both valid and reliable, including the Fear of Pain Questionnaire – III (FPQ-III), PCL-C, and Impact of Event Scale (IES). They derived other items, de novo, based on a review of the literature on pain and traumatic stress symptoms and psychological reactions and classified all the items into the following categories: 1) pain sensitivity, 2) pain experiencing, 3) pain avoidance, 4) pain and dissociation (eg, emotional numbing), 5) pain and hyperarousal, and 6) fear of pain. Initially, a total of 203 items were generated separately by four researchers (JK, KR, MGP, and VK) who then met on several occasions to select items to retain, as well as those to remove due to ambiguous or repetitive wording; thereby yielding a set of 79 items.
Procedure
The study protocol was reviewed and approved by the research ethics board at York University, the Human Participants Review Subcommittee (Certificate #: 2009-008). Following online informed consent, the 79 items were administered to a sample of 116 first-year undergraduate students from York University in Toronto, Ontario, using an online survey provided by York University’s Undergraduate Research Participant Pool. Participants rated the 79 items using the following 5-point Likert-type scale: 1 = “not at all true,” 2 = “slightly true,” 3 = “somewhat true,” 4 = “very true,” and 5 = “entirely true.” Participants also completed a demographic information form and a current pain and pain history questionnaire.
Measures
Demographic information and pain history
Participants provided information about their gender, ethnic background, and age. Pain history questions asked whether participants experienced pain on an ongoing basis as well as the diagnostic information, duration, frequency, extent of pain interference, and average intensity of their pain using an 11-point Numeric Rating Scale (NRS). Participants also rated the perceived severity of common experiences of pain (ie, tooth ache, paper cut, stubbed toe, biting your tongue, earache, and sunburn) on an 11-point Likert-type scale with item anchors 0 = “none” and 10 = “severe” as a measure of pain sensitivity.
The following measures were reviewed and used together as a pool of items from which to select possible items for the SPTS. They were not administered to participants in Study 1.
ASI
The ASI13 assesses fear of the physical symptoms of anxiety, such as pounding heart and shortness of breath. It is composed of 16 items using a 5-point Likert-type scale, with item anchors 0 = “very little” and 4 = “very much.” It comprises three subscales that measure physical concerns, mental incapacitation concerns, and social concerns. The total score ranges from 0 to 64 with higher scores indicating greater fear of anxiety symptoms. The ASI has good internal consistency (α ranges from 0.80 to 0.90), adequate test-retest reliability (α=0.72) over a 2-year interval, and good discriminant validity.14
IES
The IES15 assesses posttraumatic stress symptoms that may be experienced in response to a specific life event. It is composed of 15 items using a 4-point Likert-type scale, with item anchors 0 = “not at all” to 5 “often.” It has two subscales that provide a separate score for intrusive symptoms and avoidance symptoms. The score range is 0–75, with higher scores indicating a more severe impact of a traumatic event. The IES has good internal consistency (α ranges from 0.79 to 0.92)16 and high split-half reliability (r=0.86)15 and shows good test-retest reliability over a 1-week period (r=0.87). The IES shows good convergent validity with a diagnosis of PTSD.17
PASS-20
The PASS-2018 assesses pain-related anxiety and is the shorter, revised version of the 40-item Pain Anxiety Sensitivity Scale.19 It is composed of 20 items using a 6-point Likert-type scale, with item anchors 0 = “never” to 5 = “always.” The score range is 0–100, with higher scores indicating higher levels of anxiety related to pain. The PASS-20 has excellent internal consistency (α=0.91), reliability with the original 40-item scale is very strong (r=0.97), and it has demonstrated good divergent, convergent, predictive, and construct validity.18
FPQ-III
The FPQ-III20 assesses the degree of fear associated with various painful experiences.20 It is composed of 30 items using a 5-point Likert-type scale, with item anchors 0 = “not at all” to 4 = “extreme.” The score range is 0–120, with higher scores indicating higher levels of fear of experiencing different types of pain. The FPQ-III has good internal consistency and test-retest reliability, with the scale demonstrating strong construct, concurrent, ecological, and predictive validity.20
PCS
The PCS21 assesses ruminative thinking, perception of threat, and feelings of helplessness in relation to painful experiences and sensations. It is composed of 13 items using a 5-point Likert-type scale, with item anchors 0 = “not at all” and 4 = “all the time.” It has three subscales that provide a separate score for rumination, magnification, and helplessness. The score range is 0–52, with higher scores indicating greater levels of pain catastrophizing. The PCS has good internal consistency (coefficient α=0.87) and test-retest reliability over a 6-week period (r=0.75).21 The PCS has strong construct, predictive, concurrent, and discriminant validity.21,22
PCL-C
The PCL-C23 assesses the traumatic response that individuals may have in response to stressful events. It is composed of 17 items using a 5-point Likert-type scale, with item anchors 1 = “not at all” to 5 = “extremely.” The score range is 17–85, with higher scores reflecting greater traumatic responses. The PCL-C has excellent internal consistency (α=0.92–0.94), the test-retest reliability over a 2-week period is good (r=0.66), and the scale demonstrates good convergent and discriminant validity.24
Statistical analyses
IRT modeling
Item reduction analyses were conducted in Testgraf9825 using Nonparametric Item Response Theory (NIRT) with a nonparametric regression model. NIRT was selected as it is appropriate for use with polytonomous data, small sample sizes, and non-normally distributed data.26 To satisfy the assumption of local independencies for NIRT, items using closely related wording and with high correlations (r>0.70) were examined and the item with the least variance across participants was removed. Next, item response functions were estimated using kernel smoothing26 by fitting a parametric function to the data using a weighted average from each point of the item response function. Items were selected for inclusion on the SPTS on the basis of an analysis of the item characteristic curves (ICCs), option characteristic curves (OCCs), and the representation of items to the theoretical dimensions of SPT (ie, pain and avoidance, pain and emotional numbing, pain and hyperarousal, pain experiencing, fear of pain, and pain sensitivity).
The final scale structure was evaluated in R (Version 3.2.4) using the package “ltm.”27 Items selected for the final scale were examined with a graded response model28 through parametric item response theory (PIRT) to provide a numeric estimate of the latent trait, presumably SPT, within each of the scale items. This 2-parameter logistic (2PL) model assesses whether items have a relatively consistent level of difficulty and their maximum discrimination capacity.
Results
Data preparation
A total of 116 participants were recruited. Data from participants who had excessive missing data (>50%; N=8) were excluded from the analysis. For the remaining participants, the mean time to complete the questionnaire was 16.7 minutes (SD=6.92, range: 6–44). Participants completing the questionnaire very quickly (ie, in or below the 5th percentile or in ≤9 minutes) were considered to be careless responders and subsequently excluded from analysis (N=3).
Participant characteristics
The remaining 105 participants (n=84 female, n=20 male, n=1 did not self-identify) ranged in age from 18 to 46 years (mean [M]=20.89, standard deviation [SD]=4.25). The participants were ethnically diverse, being identified as African–Canadian (n=1), African–Caribbean (n=8), East Asian (n=11), Hispanic/Latino/a (n=5), Middle Eastern or North African (n=13), South Asian (n=13), Caucasian (n=39), other (n=7), and mixed (n=6), with two individuals declining to respond.
Thirty-five (~33%) participants reported the presence of ongoing pain problems that had persisted for ≥1 month and, of them, 14 indicated that pain occurred daily. Of this subsample, the majority reported their pain as mild (42.9%) or moderate (51.4%) in intensity with two participants reporting severe pain intensity (5.7%). Participants reported that the pain slightly (54.3%), moderately (28.6%), or did not at all (11.4%) interfere with their life, whereas two participants reported that pain severely interfered with their life (5.7%).
For the whole sample (N=105), 30.5% of participants reported experiencing pain currently (78.1% participants reported mild pain, 34.4% reported moderate pain, and one participant declined to respond). Fifty-eight (55.2%) participants reported using medication when they experienced pain, 26.8% were currently using medication for pain, and 27.6% had had a previous surgery.
IRT modeling
Exploratory nonparametric IRT: regression Kernel smoothing
Prior to IRT analyses, 12 items with high correlations were removed to satisfy the assumption of local independence. The remaining 67 items were analyzed with NIRT using nonparametric kernel smoothing to estimate the participants’ probability of endorsing each item option at every level based on standard normal scores or the Item Response Function calculated.25 When analyzing the OCCs, item discrimination is based on analyses of different option responses. In this case, four thresholds (or five distinct option response curves) were examined for adequate separation between option responses and predetermined order, otherwise known as monotonicity. Items that did not show any discrimination between options were eliminated. The ICCs were also examined based on the ability of an item to estimate the latent trait following participant responses on a particular item. In other words, it demonstrates whether individuals high on SPT also generally select higher response items on a particular item. The ICCs were less discriminative between items than the OCCs. Therefore, ICCs were considered as an additional confirmatory property when the “best” items were selected based on the OCCs. This iterative process resulted in the removal of 35 items.
Researchers (JK, KR, GP, and VK) met to evaluate the remaining 32 items on the basis of the following criteria: 1) the items demonstrate good OCCs and ICCs, 2) the items show good face validity, and 3) the items represent conceptually distinct constructs from other items. Items were re-classified based on the initial theoretical conceptualizations of the construct SPT (ie, pain sensitivity, pain experiencing, pain and avoidance, pain and dissociation/emotional numbing, pain and hyperarousal, and fear of pain). To ensure that the breadth of the SPT construct was represented, two items were selected from each of the six categories to make up the preliminary 12-item SPTS (Table 1): pain and emotional numbing (items 8 and 11), pain and hyperarousal (items 1 and 12), pain avoidance (items 3 and 9), pain experiencing/intrusive thoughts (items 2 and 6), sensitivity to pain (items 5 and 7), and fear of pain (items 4 and 10).
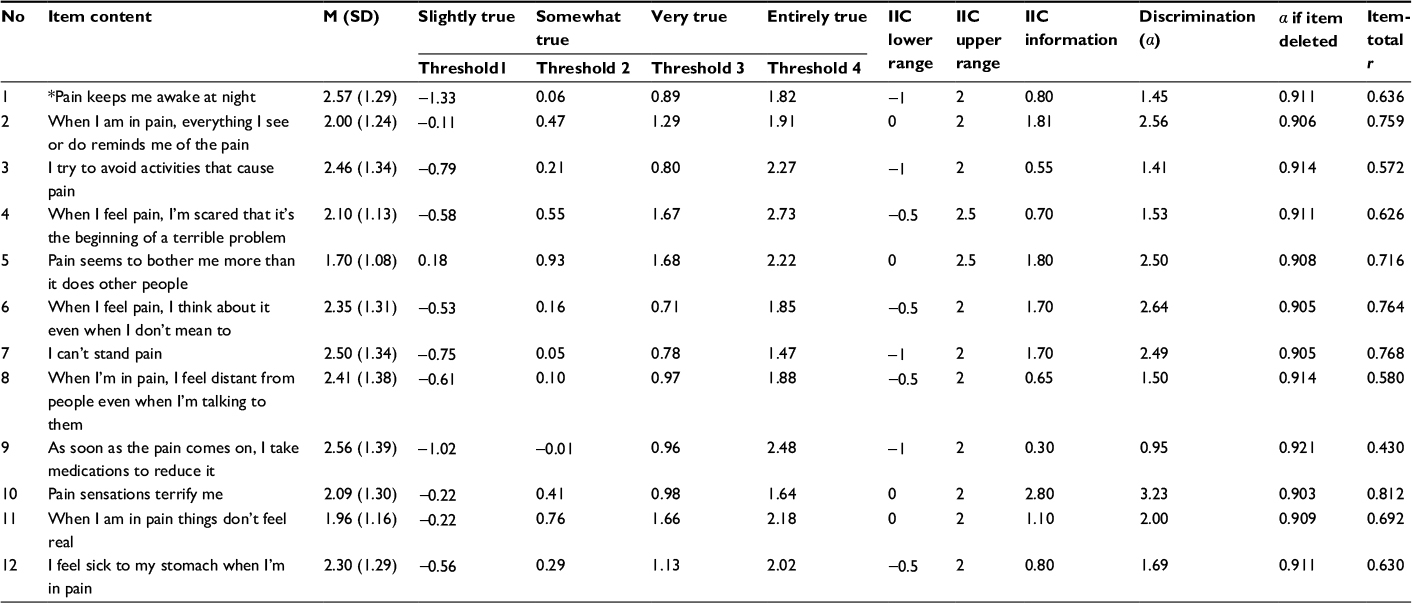 | Table 1 Item means (M), standard deviations (SD), threshold levels of SPT where each item option is expected to be observed, and lower and upper range item information curve (IIC), IIC information amount, and level of discrimination (α) of each item estimated by the graded response model Notes: *The final version of the Sensitivity to Pain Traumatization Scale-12 (SPTS-12) uses slightly different wording for this item (“When I am in pain, it keeps me awake at night”). SPTS-12 items for Study 1 are rated from 1 to 5 corresponding to options “not at all true,” “slightly true,” “somewhat true,” “very true,” and “entirely true,” respectively. Threshold 1 represents the level of SPT when participants begin to report “slightly true” rather than “not at all true.” Thresholds 2–4 represent the level of SPT at which participants begin to report the next highest category. Range is the level (z-scores) at which the item gives the most information about participants. Cronbach’s α (α if item deleted) and corrected item-total correlation coefficients (r) are also summarized. Data from Study 1. |
To evaluate the structural features of the scale without the requirement that the data be normally distributed, the 12 items of the SPTS were re-analyzed using nonparametric kernel smoothing. All items had at least two threshold intersections displayed between the 5th and 95th percentiles suggesting adequate efficiency in separating individuals from the majority of the sample across levels of estimated SPT.29
Parametric IRT: graded response model
The 12-items were then analyzed using PIRT with a 2PL graded response model. In parametric IRT, the graded response model was examined, which estimates OCCs as well as item information curves (IICs). Visual inspection of the OCCs and IICs revealed two items that had poor item discrimination and information: “I react with anger when in pain” (representing pain and hyperarousal) and “as soon as the pain comes on, I take medications to reduce it” (representing pain avoidance). These items, 1) did not discriminate well between options (OCCs), 2) did not provide an adequate level of information about participants (IICs), and 3) had low discrimination levels (α=1.004 and α=1.107, respectively). The item “I react with anger when I am in pain” was subsequently replaced with the item “I feel sick to my stomach when I am in pain” that performed well in nonparametric analysis, fit into the same category (ie, pain and hyperarousal) and showed good face validity. There was no suitable replacement for the item “as soon as the pain comes on I take medications to reduce it,” and it was kept to capture the pain avoidance dimension of SPT to maintain face validity of the scale.
Table 1 summarizes the M, SD, threshold levels (b arameter), IIC range, and IIC information amount and discrimination level (a parameter) of each item. Items 2, 5, 6, 7, and 10 had the highest discrimination ability and provided the most information overall about levels of SPT. Item 9, “As soon as the pain comes on, I take medications to reduce it,” performed poorly, providing the least amount of overall information and discrimination. Figure 1 shows the information curves for each of the 12 items of the SPTS-12. The SPTS-12 provided information primarily in the top 50% of SPT scores and the majority of items seem to be most relevant among those with the highest levels of SPT.
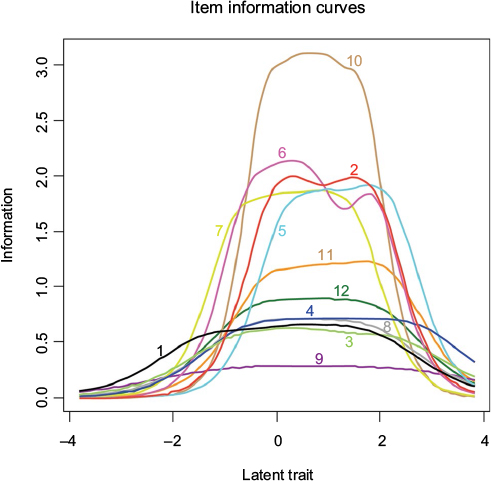 | Figure 1 Item information curves (ICCs) for each of the 12 items of the Sensitivity to Pain Traumatization Scale (N=103 participants). Note: IICs provide the most information about the latent trait (Sensitivity to Pain Traumatization) where the curve peaks. |
Preliminary scale properties
Internal consistency for the SPTS-12 was high (α=0.92) and not improved by deleting any one item (α=0.90–0.92). Kendall’s inter-correlational matrix displayed adequate item inter-correlations (0.80≥r≥0.30, p<0.001). EFA (principal axis factor analysis, varimax rotation with eigenvalue >1) showed a one-factor solution explaining 53.67% of the total variance12 (data not shown).
Discussion
The aims of Study 1 were to generate an initial set of items for the development of a new questionnaire called the SPTS and to test the preliminary psychometric properties of the scale using IRT methods. The initial set of 79 items was reduced to 12 items by using NIRT. These 12 items were further analyzed by using the parametric IRT graded response model. The results revealed a 12-item scale with a majority of highly discriminating items that provide an adequate amount of information about an individual’s SPT level and good preliminary psychometric properties.
Study 2
Aims
The aim of Study 2 was to evaluate the psychometric properties of the SPTS-12, including its factor structure, reliability, and construct, discriminant, and concurrent validity in two samples of undergraduate students; those who are pain-free and those who report ongoing pain. The authors of the present study hypothesized that: 1) the SPTS-12 would have a one-factor structure in both the pain-free group and the group reporting ongoing pain based on the initial results by Kleiman et al4 and an EFA by Roosen12 (data not reported in Study 1); 2) the SPTS-12 would demonstrate excellent internal consistency; 3) the SPTS-12 total scores would correlate to a significantly greater extent with a similar construct (ie, symptoms of posttraumatic stress scores as measured by the PCL-C) than a dissimilar construct (ie, symptoms of depression as measured by the Beck Depression Inventory – II [BDI-II]); and 4) the SPTS-12 total score would correlate significantly with the sum of the 20 items Kleiman et al4 identified in the initial study of SPT.
Methods
Procedure
The study protocol was reviewed and approved by the research ethics board at York University, the Human Participants Review Subcommittee (Certificate #: 2009-008 and Certificate #: 2013-018). Participants were recruited online through the Undergraduate Research Participant Pool at York University in three waves between 2009 and 2013. Participants provided consent electronically through an online consent form. Next, they were asked to complete an online survey consisting of basic demographic questions and nine questionnaires to assess anxiety, traumatic responses, perception of painful experiences, and depressive symptoms (SPTS-12, ASI, BDI-II, FPQ-III, Illness Sensitivity Index – Revised [ISI-R], PASS-20, PCS, PCL-C, and State–Trait Anxiety Index – Trait Version [STAI-T]). After completing the study, they were presented with a debriefing form that explained the purpose of the investigation and provided with the contact information of the investigators to answer any follow-up questions. Participants received one course credit for participating.
Measures
Demographic information and pain history
Participants provided information about their gender, ethnic background, and age. Pain history questions asked whether participants experienced pain on an ongoing basis as well as the diagnostic information, duration, frequency, and extent of pain interference. Participants also rated the perceived severity of common experiences of pain (ie, tooth ache, paper cut, stubbed toe, biting your tongue, earache, and sunburn) on an 11-point Likert-type scale with item anchors 0 = “none” and 10 = “severe” as a measure of pain sensitivity.
SPTS-12 as developed in Study 1
For Study 2, two changes were made to the SPTS-12. Item 1 (“Pain keeps me awake at night”) was re-worded to make it consistent with the other items and applicable to people who do not have pain at the time of questionnaire completion (“When I am in pain, it keeps me awake at night”). For Study 2, SPTS-12 items are rated on a 5-point scale ranging from 0 (not at all true) to 4 (entirely true) with a total possible score of 48. The final version of the SPTS-12 is shown in Figure 2.
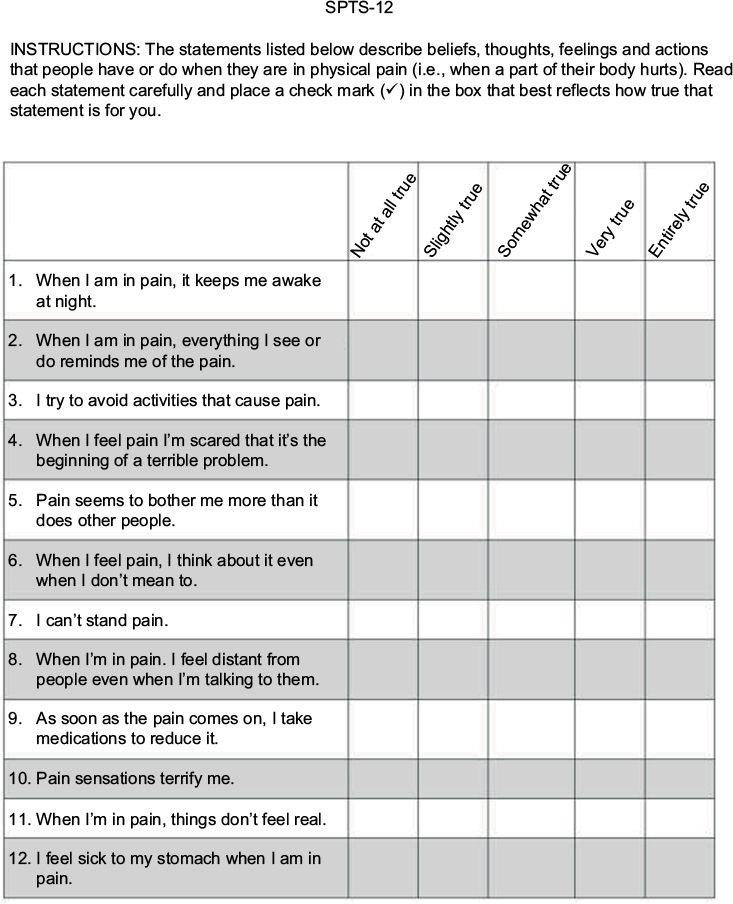 | Figure 2 Final version of the 12-item Sensitivity to Pain Traumatization Scale (SPTS-12). Each of the 12 items are rated on a 5-point (0–4) scale, where 0 = not at all true; 1 = slightly true; 2 = somewhat true; 3 = very true; and 4 = entirely true. |
ASI
The ASI (as described in Study 1) showed very good internal consistency in Study 2 (α=0.89).13
BDI-II
The BDI-II assesses cognitive, emotional, and physical symptoms of depression.30 It is composed of 21 items using a 4-point Likert-type scale, with each question having different item anchors (range 0–3). The score range is 0–63, with higher scores reflecting greater depressive symptoms. The BDI-II has excellent internal consistency (α=0.90), shows good test-retest reliability over a range of times (r=0.73–0.93), and has established high content, concurrent, and construct validity.30,31 The BDI-II showed excellent internal consistency in Study 2 (α=0.93).
FQP-III
The FPQ-III20 (as described in Study 1) showed excellent internal consistency in Study 2 (α=0.94).
ISI-R
The ISI-R is the revised version of the 11-item scale that assesses fear of illness and injury.32,33 It is composed of nine items using a 5-point Likert-type scale, with item anchors 0 = “agree very little” to 4 “agree very much.” It has two subscales that provide a separate score for fear of illness and fear of injury. The score range is 0–36 with higher scores indicating greater levels of fear of illness and injury. The ISI-R has very good internal consistency (α=0.86) and good convergent validity (r>0.65) with other injury- and illness-related measures and correlates very highly with the original scale (r=0.96).32 The ISI-R showed excellent internal consistency in Study 2 (α=0.92).
PASS-20
The PASS-2018 (as described in Study 1) showed excellent internal consistency in Study 2 (α=0.94).
PCS
The PCS21 (as described in Study 1) showed excellent internal consistency in Study 2 (α=0.94).
PCL-C
The PCL-C23 (as described in Study 1) showed excellent internal consistency in Study 2 (α=0.93).
STAI-T
The STAI assesses both temporary “state” levels of anxiety and enduring “trait” characteristics of anxiety.34 The present study only assessed trait levels of anxiety with the trait subscale (STAI-T), which is composed of 20 items using a 4-point Likert-type scale, with item anchors 1 = “almost never” to 4 = “almost always.” The score range is 20–80 with higher scores indicating greater levels of trait anxiety. The STAI-T has good internal consistency (Cronbach’s α=0.89),35 high test–retest reliability (r=0.73–0.86),34 and strong concurrent validity with related anxiety measures.34 The STAI-I showed excellent internal consistency in Study 2 (α=0.92).
EFA
Analyses were conducted in R (Version 3.3.0) using the packages “paramap,” “car,” “polycor,” “psych,” and “Hmisc.” Evaluation of scale items was conducted with EFA using the polychoric correlation matrix and principal axis factoring estimation,36 following recommendations for EFA on ordinal data.37 EFA was favored over confirmatory factor analysis (CFA) as the SPTS-12 had not been previously examined in clinical and nonclinical settings. Five methods were used to determine the number of factors to retain: examination of the scree plot,38 parallel analysis,39 Velicer’s minimum average partial (MAP) test,40,41 the root mean square residual (RMR),42 and ratio of the first to second eigenvalue.43
Reliability
Unstandardized Cronbach’s α, corrected item-total correlations, and Cronbach’s α-if-item-deleted correlations were used to examine the internal consistency of the SPTS-12.
Validity
Construct validity was evaluated by examining the convergent and discriminant validity. Spearman’s correlations were used for comparisons. Convergent validity was determined by correlating the total score on SPTS-12 with the PCL-C, a theoretically related construct that is not directly related to pain. A high correlation (r>0.60) was deemed to indicate adequate convergent validity. Discriminant validity was determined by correlating the SPTS-12 total scores with BDI-II depression scores which are related but theoretically distinct measures. A low-to-moderate correlation (r<0.60) between total SPTS-12 and BDI-II scores was deemed to indicate adequate discriminant validity. The magnitude of the difference was evaluated between the correlation coefficients for SPTS-12 and PCL-C and for SPTS-12 and BDI-II.44A significantly larger correlation between the former and the latter would suggest good convergent and discriminant validity. Concurrent validity was evaluated by calculating the correlation between the SPTS-12 and the 20 items Kleiman et al4 derived in the initial study of SPT. All data are presented as M ± SD unless otherwise stated.
Results
Data preparation
A total of 860 participants were recruited. Data from participants who failed to respond to all the questions of the SPTS-12 (N=26) or did not indicate whether or not they experienced ongoing pain (N=11) were excluded from the analysis. For the remaining questionnaires, total scores were prorated if ≥80% questions were completed.45,46 Missing data ranged from a low of 1.19% for the ISI-R to a high of 2.35% for BDI-II.
Participant characteristics
Of the 823 remaining participants, 268 (32.56%) endorsed experiencing pain on an ongoing basis, whereas 555 (67.44%) did not. The age range for those with ongoing pain was 16–45 years (M=20.63, SD=4.63). The majority was female (n=202; n=66 male, n=1 declined to respond). The participants were ethnically diverse, being identified as African descent (n=11), Asian descent (n=105), Hispanic/Latino/a (n=5), Caucasian (n=99), and other (n=46), with two individuals declining to respond.
For participants not endorsing pain, the age range was 17–42 years (M=19.34, SD=3.43). The majority was female (n=388; n=165 male, n=2 declined to respond). The participants were ethnically diverse, being identified as African descent (n=30), Asian descent (n=291), Hispanic/Latino/a (n=10), Caucasian (n=136), and other (n=90), with eight individuals declining to respond. Further demographic information was collected from participants reporting ongoing pain. For the length of time that participants endorsed ongoing pain, 16.4% reported experiencing pain for <3 months, 11.6% between 3 and 6 months, 13.4% between 6 months and 1 year, and 55.6% for >1 year (3% declined to respond). For frequency of pain, 38.1% reported experiencing pain daily, 37.7% weekly, and 16.4% monthly (5.2% described the frequency of pain as “other” and 1.9% declined to respond). For severity, 30.6% described their pain as mild, 57.5% as moderate, and 10.8% as severe (1.1% declined to respond). For degree of interference that their pain level had on daily functioning, 9.3% reported that it was not at all affected, 56.0% that it was slightly affected, 28.4% that it was moderately affected, and 5.2% that it was severely affected (1.1% declined to respond).
Participants endorsing ongoing pain were compared to those who did not endorse pain. Age differed significantly, t(420.87)=3.79, p<0.001 (degrees of freedom adjusted due to a violation in Levene’s test of equality of variance, F(2, 839)=18.20, p<0.001), where participants reporting ongoing pain were older (M=20.63, SD=4.64) than participants not reporting pain (M=19.35, SD=3.43). Sex did not differ significantly, χ2(1, N=843)=2.12, p=0.137.
Factor analysis
The factor loadings for participants reporting ongoing pain and participants who were pain-free are summarized in Table 2. For participants not reporting ongoing pain (N=555), an examination of the scree plot suggested a one-factor model. Parallel analysis using real-data eigenvalues and results from the original and revised Velicer’s MAP test both yielded a one-factor solution. The RMR was 0.057, indicating a good fit and providing support for the one-factor model. In addition, the ratio of the first (6.28) to the second (0.89) eigenvalue was >4. The one-factor model accounted for 48.2% of the variance.
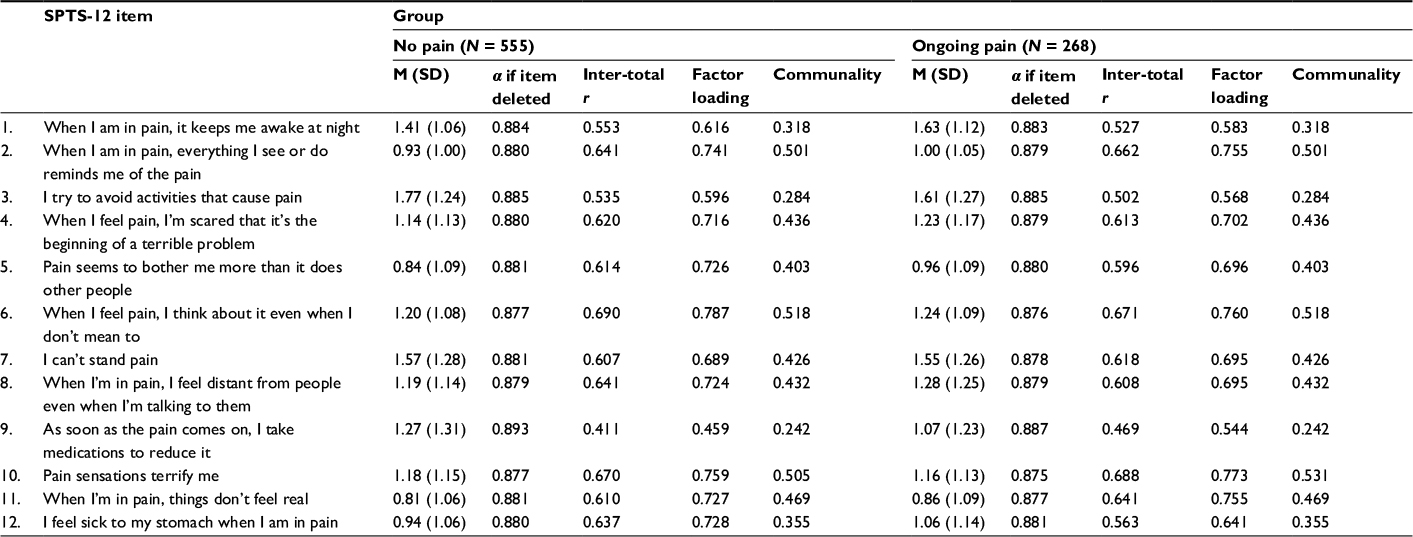 | Table 2 Item-total statistics and factor loadings for the 12 items of the Sensitivity to Pain Traumatization Scale (SPTS-12) for participants with and without ongoing pain Notes: SPTS-12 items for Study 2 are rated from 0 to 4 corresponding to options “not at all true,” “slightly true,” “somewhat true,” “very true,” and “entirely true,” respectively. Data from Study 2. Abbreviations: M, mean; SD, standard deviation. |
For participants reporting ongoing pain (N=268), an examination of the scree plot suggested a one-factor model. Parallel analysis using real-data eigenvalues and results from the original and revised Velicer’s MAP test both yielded a one-factor solution. The RMR was 0.057, indicating a good fit and providing support for the one-factor model. In addition, the ratio of the first (6.14) to the second (0.99) eigenvalue was >4. The one-factor model accounted for 46.9% of the variance.
Reliability
Internal consistency reliability of the SPTS-12 was calculated using Cronbach’s α. For pain-free participants, the internal consistency was α=0.89. Reliability was not improved when any one item was deleted (α=0.88–0.89). For participants reporting ongoing pain, the internal consistency was α=0.89. The reliability was not improved by deleting any one item (α=0.88–0.89).
Validity
Concurrent, convergent, and discriminant validity were calculated by examining the correlation between measures of the same construct (ie, sum of the 20 items Kleiman et al4 identified in the initial study of SPT), a similar construct (ie, PCL-C), and a different (although related) construct (ie, BDI-II), respectively. The correlation matrix for individuals reporting ongoing pain and reporting no pain is provided in Tables 3 and 4.
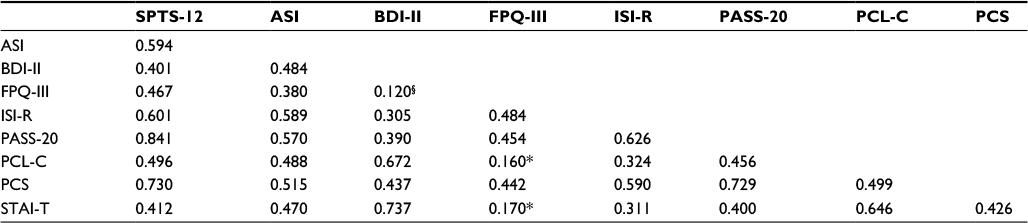 | Table 3 Spearman correlation matrix for participants reporting ongoing pain (N range: 263–268) Notes: All correlations significant at p<0.001 unless otherwise indicated. *p<0.01; §p=0.052. Abbreviations: ASI, Anxiety Sensitivity Index; BDI-II, Beck Depression Inventory – II; FPQ-III, Fear of Pain Questionnaire – III; ISI-R, Illness Sensitivity Index – Revised; PASS-20, Pain Anxiety Symptoms Scale – Short Form; PCS, Pain Catastrophizing Scale; PCL-C, PTSD Checklist – Civilian Version; PTSD, post-traumatic stress disorder; SPTS-12, 12-item Sensitivity to Pain Traumatization Scale; STAI-T, Spielberger State-Trait Anxiety Inventory (Trait Subscale). |
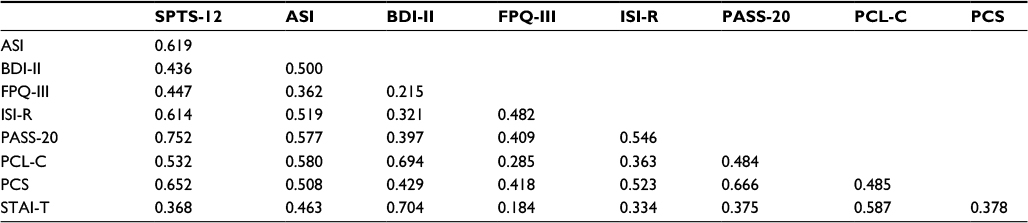 | Table 4 Spearman correlation matrix for participants reporting no pain (N range: 547–554) Note: All correlations significant at p<0.001. Abbreviations: ASI, Anxiety Sensitivity Index; BDI-II, Beck Depression Inventory – II; FPQ-III, Fear of Pain Questionnaire – III; ISI-R, Illness Sensitivity Index – Revised; PASS-20, Pain Anxiety Symptoms Scale – Short Form; PCS, Pain Catastrophizing Scale; PCL-C, PTSD Checklist – Civilian Version; PTSD, post-traumatic stress disorder; SPTS-12, 12-item Sensitivity to Pain Traumatization Scale; STAI-T, Spielberger State-Trait Anxiety Inventory (Trait Subscale). |
Concurrent validity
Concurrent validity of the SPTS-12 was excellent as shown by a very high correlation for participants without pain (r(384)=0.768, p<0.001) and participants with pain (r(207)=0.828, p<0.001) with the sum of the 20 items Kleiman et al4 derived in their study of SPT.
Convergent validity
Convergent validity was assessed by computing Spearman correlation coefficients between the SPTS-12 and the PCL-C. A moderate correlation was found for both pain-free participants, r(551)=0.532, p<0.001, and for participants reporting ongoing pain, r(268)=0.496, p<0.001. The coefficient of determination (r2) showed that 28% of variance is shared between the SPTS-12 and PCL-C for pain-free participants and that 25% of variance is shared for participants reporting ongoing pain.
Discriminant validity
Discriminant validity was assessed by computing Spearman correlation coefficients between the SPTS-12 and the BDI-II. A moderate correlation was found for both pain-free participants, r(552)=0.436, p<0.001, and for participants reporting ongoing pain, r(268)=0.401, p<0.001, indicating 19% and 16% of shared variance, respectively. For pain-free participants, the magnitude of the correlation between the SPTS-12 and PCL-C was significantly greater than the correlation between the SPTS-12 and the BDI-II (z=1.98, p=0.048).44 For participants reporting ongoing pain, the magnitude of the correlation between the SPTS-12 and PCL-C was not significantly greater than the correlation between the SPTS-12 and the BDI-II (z=1.312, p=0.190).
Sex and pain group differences
A 2 × 2 between-subject analysis of variance (ANOVA) was conducted using group (ongoing pain and no pain) and sex (female and male). A main effect of sex was found for SPTS-12, F(1, 815)=22.578, p<0.001, ηp2=0.027 with women scoring higher than men (Table 5). The SPTS-12 scores for individuals reporting ongoing pain and those not reporting pain did not differ significantly.
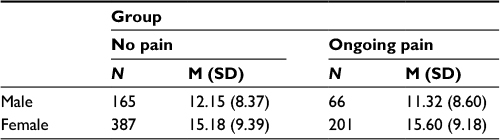 | Table 5 Sample size (N), mean (M), and standard deviation (SD) for the 12-item Sensitivity to Pain Traumatization Scale shown for males and females for participants with and without ongoing pain Note: Analysis of variance showed a significant main effect of sex. |
Discussion
Study 2 was designed to further evaluate the factor structure, reliability, and construct, discriminant, and concurrent validity in participants with and without chronic pain. The results indicate that the individual items of the SPTS-12 all load on a single factor, consistent with the results of Study 1 (data not reported) and those of Kleiman et al.4 Moreover, the single factor structure was found for both people who endorsed ongoing chronic pain problems and those who were pain-free, accounting for 48% and 47% of the variance, respectively. The reliability of the SPTS-12 was excellent in both pain (0.89) and pain-free (0.89) samples and deleting any one item had no appreciable effect on the internal consistency of the scale.
In terms of construct validity, the SPTS-12 correlated significantly with the sum of the 20 items Kleiman et al4 used in their original study of SPT for participants with pain (r=0.83) and those who were pain free (r=0.77) as well as the PCL-C among participants with chronic pain (r=0.50) and those who were pain-free (r=0.53). The relationship to the PCL-C indicates an acceptable overlap of 25% between a construct (PTSD) that is deemed related to, but distinct from, SPT. The SPTS-12 also displayed adequate discriminant validity based on its lower correlations with scores on the BDI-II (0.40–0.44) and STAI-T (0.37–0.41). Consistent with the pain literature,47,48 sex effects were found for all measures including the SPTS-12 with females scoring significantly higher than males regardless of pain status. Taken together, the results of Study 2 provide further evidence for the validity and reliability of the SPTS-12.
Study 3
Aim
The aim of Study 3 was to evaluate the psychometric properties of the SPTS-12, including its factor structure, reliability, and discriminant and convergent validity in a clinical sample of patients who had undergone coronary artery bypass graft (CABG) surgery.49 The authors of the present study hypothesized that: 1) the SPTS-12 would have a one-factor structure for the overall sample, as well as for participants with CPSP, other chronic pain (OCP), and no chronic pain (NCP); 2) the SPTS-12 would demonstrate excellent internal consistency; and 3) the SPTS-12 total scores would correlate to a significantly greater extent with a similar construct (ie, symptoms of posttraumatic stress as measured by the PCL-C) than a dissimilar construct (ie, symptoms of depression as measured by the Hospital Anxiety and Depression Scale [HADS]-D).
Methods
Procedure
The study protocol was approved by the University Health Network Research Ethics Board at Toronto General Hospital (REB Approval # 10-0852-AE) and by the York University Human Participants Review Subcommittee (Certificate #: 10-0852-AE). Patients who had undergone CABG surgery a minimum of 6 months earlier and had agreed to be contacted were either mailed a questionnaire package to complete and mail back, or completed it in-person during a hospital visit. All patients provided written informed consent to participate in the present study. The questionnaires consisted of basic demographic and pain history questions, as well as questionnaires to assess anxiety, traumatic responses, perception of painful experiences, and depressive symptoms (SPTS-12, ASI-3, HADS, PASS-20, PCS, and PCL-C).
Measures
Demographic information
Participants provided information about their gender, ethnic background, and age.
Pain intensity
Participants rated the intensity of their average postsurgical chest pain, movement-evoked pain (deep breathing), and pain upon gentle touch to the chest or leg scar using an 11-point NRS. The NRS has excellent validity and reliability and is one of the most commonly used measures of pain intensity when assessment time is limited.50
Pain quality
Participants rated the current intensity of their chronic postsurgical chest pain using the Leeds Assessment of Neuropathic Symptoms and Signs scale -self-report version (S-LANSS) 11-point NRS, and answered “yes”/“no” questions about pain quality to yield a total S-LANSS score.51 The S-LANSS has been validated in clinical settings and has a high internal consistency (α=0.76).51
SPTS-12
SPTS-12 used the original wording of item 1 from Study 1 (“Pain keeps me awake at night”) since data collection for Study 3 preceded Study 2.
ASI-3
The ASI-352 is an 18-item revision of the ASI described/used in Studies 1 and 2. Items are rated on a 5-point Likert scale ranging from 0 (very little) to 4 (very much), with a total possible score of 72. The ASI-3 yields a total score and three factor analytic subscale scores comprising physical, cognitive, and social concerns about anxiety and its manifestations. The ASI-3 has strong psychometric properties including good to excellent internal consistency for the three subscales (α=0.80–0.90) and total score (α=0.93),53 as well as clear evidence for its convergent and discriminant validity.52,53 The ASI-3 showed excellent internal consistency in Study 3 (α=0.92).
HADS
The HADS54 is the most widely used scale for measuring symptoms of anxiety and depression among medical inpatients.55 It consists of 14 items, each rated using a 4-point Likert-type scale (0–3) and has two subscales that provide a separate score for depressive symptoms (HADS-D) and anxiety symptoms (HADS-A). Total scores for each subscale range from 0 to 21. Higher scores indicate greater symptoms of anxiety or depression. The psychometric properties of the HADS are excellent. Cronbach’s α ranges from 0.80 to 0.93 for the HADS-A and from 0.81 to 0.90 for HADS-D.55,56 Concurrent validity of the HADS is very good as measured by correlation coefficients between 0.62 and 0.73 for the HADS-D with various well-validated depression scales and correlation coefficients between 0.49 and 0.81 for the HADS-A with well-validated anxiety measures.55,56 The HADS showed excellent internal consistency in Study 3 (HADS-A: α=0.810; HADS-D: α=0.811). The authors of the present study used the HADS-D (and not the BDI-II) as a measure of depressive symptoms as it is recommended for use in nonpsychiatric, hospitalized medical patients.55
PASS-20
The PASS-2018 (as used in Study 1 and 2) showed excellent internal consistency in Study 3 (α=0.94).
PCS
The PCS21 (as used in Study 1 and 2) showed excellent internal consistency in Study 3 (α=0.93).
PCL-C
The PCL-C23 (as used in Study 1 and 2) showed excellent internal consistency in Study 3 (α=0.92).
Exploratory factor analysis
Analyses were conducted in RStudio (Version 0.99.484) using the packages “paramap,” “car,” “polycor,” “psych,” and “Hmisc.” Evaluation of scale items was conducted with EFA using the polychoric correlation matrix and principal axis factoring estimation,36 following recommendations for EFA on ordinal data.37 EFA was favored over CFA as the SPTS-12 had not been previously examined in a clinical setting. Five methods were used to determine the number of factors to retain: examination of the scree plot,38 parallel analysis,39 Velicer’s MAP test,40,41 the RMR,42 and ratio of the first to second eigenvalue.43
Reliability
Unstandardized Cronbach’s α, corrected item-total correlations, and Cronbach’s α-if-item-deleted correlations were used to examine the internal consistency of the SPTS-12.
Validity
Construct validity was evaluated by examining the convergent and discriminant validity using Spearman correlation coefficients. Convergent validity was determined by correlating the total SPTS-12 score with total scores on the PCL-C, a theoretically related construct that is not directly related to pain. A high correlation (r>0.60) was deemed to indicate adequate convergent validity. Discriminant validity was determined by correlating the SPTS-12 total scores with HADS-D scores which are related but theoretically distinct measures. A low-to-moderate correlation (r<0.60) between total SPTS-12 and HADS-D scores was deemed to indicate adequate discriminant validity. The magnitude of the difference was evaluated between the correlation coefficients for SPTS-12 and PCL-C and for SPTS-12 and HADS-D.44 A significantly larger correlation between the former and the latter would suggest good convergent and discriminant validity.
Results
Data preparation
Data were collected from a total of 367 participants. Data from participants who failed to respond to all questions of the SPTS-12 (N=22) were excluded from the analysis.
Patient characteristics
Data from the 345 remaining participants (male = 263) were obtained at a minimum of 6 months after CABG surgery (M=40.55; SD=24.45 months; range 6.34–106.18 months). Patients were aged between 25 and 90 years (M=65.72; SD=11.61 years). Ethnicity of the participants included Caucasian (60.3%), Asian (2.0%), Black (0.3%), Hispanic (0.3%), and other (1.7%); 35.4% did not indicate their ethnicity.
Patients were classified into CPSP, OCP, or NCP groups based on their response to pain-related questions. Thirty-seven percent of patients (36.5%; n=126) reported chronic pain as a result of CABG surgery (ie, at the chest and/or leg) with 81% of these patients reporting pain at the time of assessment. Of these patients, the mean postsurgery current chest pain intensity (S-LANSS-NRS) was 3.41 (SD=2.27). The clinical cutoff for moderate to severe pain warranting treatment is a score of ≥4 on an 11-point NRS)57. Twenty-seven percent of the sample (26.7%; n=92) reported experiencing other ongoing pain problems unrelated to surgery, with 92.4% of these patients reporting pain at the time of assessment. Thirty-seven percent of patients (36.8%; n=127) reported no ongoing or current pain problems as a result of their surgery or from other causes. CPSP, OCP, and NCP groups were compared. Age differed significantly, F(2, 226.970)=7.939, p<0.001 (degrees of freedom adjusted due to a violation in Levene’s test of equality of variance), with mean age greatest in OCP (M=68.79, SD=8.82), followed by NCP (M=66.45, SD=12.47), and CPSP (M=62.74, SD=11.89) groups. Sex did not differ significantly, χ2(2, n=345)=4.619, p=0.099.
Six percent (6.1%) of the sample (n=21), comprising 19 pain patients, had a total score on the PCL-C ≥44 (a score of ≥44 on the PCL-C indicates symptom severity within the clinical range; M=26.15, SD=9.84).23,58
Factor analysis
Table 6 summarizes the M and SD for each SPTS-12 item as well as Cronbach’s α if item deleted, corrected item-total correlations, factor loadings, and communalities for the one-factor solution for the overall sample (N=345). Several evaluative methods supported a one-factor solution for the overall sample: parallel analysis using real-data eigenvalues, results from the original and revised Velicer’s MAP test, an examination of Cattell’s scree plot with eigenvalues from the MAP test, the ratio of the first (6.73) to the second (1.02) eigenvalue was >4, and the RMR was 0.07. For the overall sample, the one-factor solution accounted for 52.4% of the variance. In agreement with this finding for the overall sample, the results of EFAs for the CPSP, OCP, and NCP groups also supported a one-factor solution (54.7% for CPSP; 46.1% for OCP, and 52.2% for NCP).
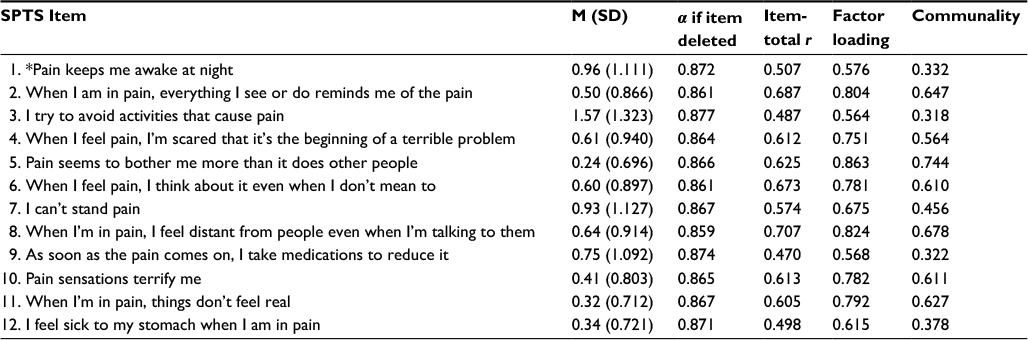 | Table 6 The 12 items of the SPTS-12 showing the mean (M; standard deviation [SD]) for each item as well as Cronbach’s as (a if item deleted), corrected item-total correlations (item-total r), factor loadings, and communalities for the one-factor solution generated by Exploratory Factor Analysis for N = 345 coronary artery bypass surgery patients. Notes: *The final version of the SPTS-12 uses slightly different wording for this item (“When I am in pain, it keeps me awake at night”). Each of the 12 items are rated on a 5-point scale, where 0 = not at all true; 1 = slightly true; 2 = somewhat true; 3 = very true; and 4 = entirely true. EFAs conducted on each of the three groups separately support a one-factor solution (data not shown). Data from Study 3. Abbreviation: SPTS-12, 12-item Sensitivity to Pain Traumatization Scale; EFA, exploratory factor analysis. |
Reliability
Unstandardized Cronbach’s as showed excellent internal consistency for the overall sample and the three groups: overall α=0.877; CPSP: α=0.900; OCP: α=0.839; NCP: α=0.847. Deletion of any single item did not significantly improve the internal consistency of the scale: overall α=0.859–0.877; CPSP: α=0.885–0.900; OCP: α=0.814–0.840; NCP: α=0.822–0.858. Corrected item-total correlations ranged from: overall 0.470 to 0.707; CPSP 0.460 to 0.749; OCP 0.278 to 0.680; NCP 0.378 to 0.711.
Validity
Convergent and discriminant validity were calculated by examining the correlation between the SPTS-12 and a similar construct (ie, PCL-C) and a different (although related) construct (ie, HADS-D), respectively. The correlation matrixes for CPSP, OCP, and NCP groups are reported in Tables 7–9.
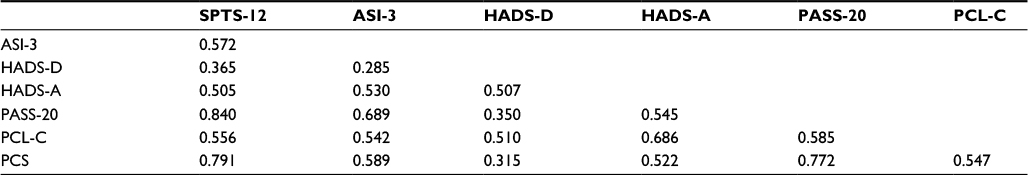 | Table 7 Spearman correlation matrix for CPSP group (N range: 125–126) Note: All correlations significant at p<0.01. Abbreviations: ASI-3, Anxiety Sensitivity Index-3; CPSP, chronic postsurgical pain; HADS-D, Hospital Anxiety and Depression Scale – Depression scale; HADS-A, Hospital Anxiety and Depression Scale – Anxiety scale; PASS-20, Pain Anxiety Symptoms Scale – Short Form; PCS – Pain Catastrophizing Scale; PCL-C, PTSD Checklist – Civilian Version; PTSD, post-traumatic stress disorder; SPTS-12, 12-item Sensitivity to Pain Traumatization Scale. |
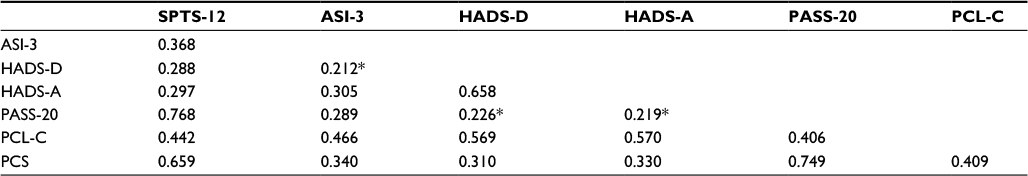 | Table 8 Spearman correlation matrix for OCP group (N = 92) Notes: All correlations significant at p<0.01 unless otherwise indicated; *p<0.05. Abbreviations: ASI-3, Anxiety Sensitivity Index-3; HADS-D, Hospital Anxiety and Depression Scale – Depression Scale; HADS-A, Hospital Anxiety and Depression Scale – Anxiety Scale; OCP, other chronic pain; PASS-20, Pain Anxiety Symptoms Scale – Short Form, PCS, Pain Catastrophizing Scale; PCL-C, PTSD Checklist - Civilian Version; PTSD, post-traumatic stress disorder; SPTS-12, 12-item Sensitivity to Pain Traumatization Scale. |
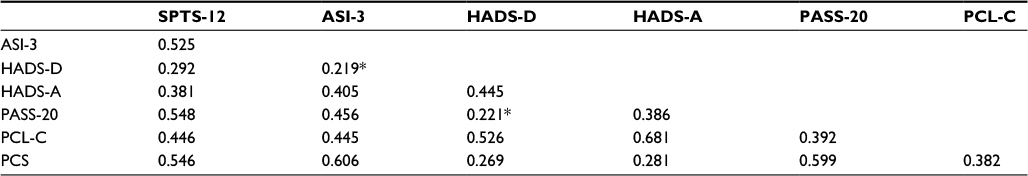 | Table 9 Spearman correlation matrix for NCP group (N range: 125–127) Notes: All correlations significant at p<0.01 unless otherwise indicated; *p<0.05. Abbreviations: ASI-3, Anxiety Sensitivity Index-3; HADS-D, Hospital Anxiety and Depression Scale – Depression Scale; HADS-A, Hospital Anxiety and Depression Scale – Anxiety Scale; NCP, no chronic pain; PASS-20, Pain Anxiety Symptoms Scale – Short Form; PCS, Pain Catastrophizing Scale; PCL-C, PTSD Checklist – Civilian Version; PTSD, post-traumatic stress disorder; SPTS-12, 12-item Sensitivity to Pain Traumatization Scale. |
Convergent validity
Convergent validity was assessed by computing Spearman correlation coefficients between the SPTS-12 and the PCL-C. A significant, moderate correlation was found between the SPTS-12 and the PCL-C for the overall sample r(343)=0.514, p<0.001, as well as all groups (Tables 7–9).
Discriminant validity
Discriminant validity was assessed by computing Spearman correlation coefficients between the SPTS-12 and the HADS-D. A low–moderate correlation was found between the SPTS-12 and the HADS-D for the overall sample r(342)=0.341, p<0.001, as well as all subgroups (Tables 7–9). This suggests a significantly greater overlap between the SPTS-12 and a measure of PTSD symptoms, than with a measure of depression symptoms. The magnitude of the correlation between the SPTS-12 and PCL-C was significantly greater than the correlation between the SPTS-12 and the HADS-D for the overall sample (z=3.83, p<0.001), as well as CPSP (z=2.53, p<0.02), OCP (z=1.72, p<0.05), and NCP patients (z=1.94, p<0.03),44 further supporting good convergent and discriminant validity in these groups.
Sex and pain group differences
A 3 × 2 ANOVA was conducted using pain group (CPSP, OCP, and NCP) and sex (female and male). The main effects of sex F(1, 344)=6.449, p=0.012 and pain group F(2, 344)=6.543, p=0.002 were significant. Overall, females (10.05 ± 7.81) had significantly higher SPTS scores than males (7.19 ± 7.21). Post hoc comparisons (Bonferroni) showed that the CPSP group (9.61 ± 8.83) had significantly (p=0.001) higher SPTS-12 scores than the NCP group (6.17 ± 6.00) but not the OCP group (7.83 ± 6.64; p=0.220) and the latter two groups did not differ significantly (p=0.286). The pain group × sex interaction effect was not significant (F(2, 344)=0.869, p=0.420) (Table 10).
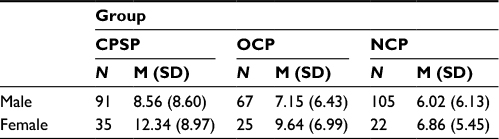 | Table 10 Sample size (N), mean (M), and standard deviation (SD) for the 12-item Sensitivity to Pain Traumatization Scale shown for males and females in the three groups of coronary artery bypass graft surgery patients Note: ANOVA showed significant main effects of group and sex. Abbreviations: CPSP, chronic postsurgical pain; OCP, other chronic pain; NCP, no chronic pain. |
Discussion
The aims of Study 3 were to evaluate the factor structure, reliability, and discriminant and concurrent validity of the SPTS-12 in a clinical sample of patients after undergoing CABG surgery a minimum of 6 months earlier. Results of the EFA revealed a one-factor solution for the SPTS-12 for the overall sample as well as for the CPSP, OCP, and NCP groups (52.4% for overall; 54.7% for CPSP; 46.1% for OCP, and 52.2% for NCP). These findings align with the results of Studies 1 and 2, as well as with the findings of Kleiman et al.4 Results of the reliability analysis for Study 3 suggest that the SPTS-12 has excellent overall internal consistency. Deletion of any one item did not improve the internal consistency of the scale and all SPTS-12 items relate strongly to the construct of SPT. The high level of internal consistency suggests that the SPTS-12 is reliable for use in a clinical setting. Examination of the convergent validity of the SPTS-12 showed a moderate to high correlation with PTSD symptomatology as measured by the PCL-C. In addition, the SPTS-12 was moderately correlated with current pain ratings as measured by the S-LANSS. The results of the analysis of discriminant validity yielded a lesser correlation between the SPTS-12 and depressive symptomatology as measured by the HADS-D compared to its correlation with PTSD symptoms. Consistent with Study 2, the SPTS-12 scores were significantly higher in women than men. This reflects a substantial body of research suggesting that women and men differ in their response to experimental pain and demonstrate that women show greater sensitivity to multiple pain modalities.47 Taken together, the results of the three studies provide evidence for the validity and reliability of the SPTS-12 in both clinical and nonclinical settings.
Overall, the SPTS-12 improves on the preliminary 20-item scale by Kleiman et al.4 All but 3 of the 20 items fell into symptom clusters consistent with traumatic stress reactions (eg, experiencing/re-experiencing, avoidance, and increased arousal). The 3 items which did not were not included in the present SPTS-12. Also, because the scales used by Kleiman et al4 to derive the 20 items (ASI, PCS, and PASS-20) were not specifically designed to measure pain as a traumatic stress reaction, certain symptoms common to such reactions were not represented in the initial SPT factor structure (eg, emotional numbing, dissociation, and detachment).4 The present SPTS-12 now contains two such items and therefore more accurately reflects the construct as originally defined.4
General discussion
The main objective of the present three studies was to develop and evaluate the factor structure, reliability, and validity of the SPTS-12. The results of the EFAs from all three studies suggest that the SPTS-12 has a one-factor structure for community and clinical, chronic pain and pain-free samples, excellent reliability and concurrent validity, and moderate convergent and discriminant validity. Taken together, these studies provide preliminary evidence for the validity and reliability of the SPTS-12. The findings are consistent with preliminary research on the SPT construct in which using a higher-order analysis identified a single factor that explained 68.3% of the common variance underlying the major pain-related anxiety constructs.4 These findings suggest that the SPT construct, as measured by the SPTS-12, represents a higher-order factor that describes a predisposition to respond to pain with somatic, cognitive, emotional, and behavioral response that is similar to a traumatic reaction.4 These findings support previous research that has suggested a higher-order factor underlies the pain-related anxiety constructs.11
SPTS scores in Study 3 were significantly higher in patients with CPSP than in pain-free patients but not compared to those with OCP conditions. These results are consistent with the findings from Kleiman et al4 who reported that patients with a history of pain scored higher than those without a history of pain both before surgery and at the 1-year follow-up. In contrast, in Study 2, SPTS scores did not differ significantly between participants with ongoing pain and those who did not report pain. The most obvious difference is that in the study by Kleiman et al4 and in Study 3 the participants were patients with CPSP who had had pain for at least 6 months and most for much longer, whereas in Study 2 participants were university students with ongoing pain problems that had been present for a shorter time.
Results of the reliability analysis suggest that the SPTS-12 has excellent overall internal consistency in community and postcardiac surgery samples, in pain and pain-free patients. Overall, this provides preliminary evidence that the scale is reliable for use in various settings. The SPTS-12 also demonstrated good to excellent internal consistency for both men and women in Studies 2 and 3. However, due to the small number of women in the study, this result should be interpreted tentatively especially in light of the almost ubiquitous findings that women and men differ in terms of their responses to acute experimental,47,59 clinical,60 and chronic pain.61 Reliability within subgroups such as sex should be examined in future studies with larger samples from various settings.
Examination of the convergent and discriminant validity of the SPTS-12 showed a higher correlation with PTSD symptomatology as measured by the PCL-C and a lesser correlation between the SPTS-12 and depressive symptomatology as measured by the BDI-II and the HADS-D compared to its correlation with PTSD symptoms. This suggests that the SPTS-12 shares significantly more variance with a measure of PTSD symptoms than with a measure of depressive symptoms. Taken together, the results of the validity analysis suggest good preliminary construct validity of the SPTS-12. The moderate correlation between the SPTS-12 and PCL-C also suggests that despite the overlap between SPT and PTSD, these constructs are distinct in terms of their relationship to pain. In sum, the results of the present study supported the initial hypotheses. The SPTS-12 was found to have a one-factor structure, which was consistent with results of the prior EFA analyses of Kleiman et al.4 The SPTS-12 demonstrated good preliminary psychometric properties including high internal consistency and good preliminary validity.
Future directions
The present study used EFA to better understand the underlying structure that produces correlations among the items of the SPTS-12. Since a consistent, unidimensional factor structure was supported in both community and clinical samples, future research should use CFA methods to evaluate and refine the SPTS-12.62
Studies 2 and 3 found a main effect of sex for the SPTS-12, such that women tended to score higher than men. This also aligned with the findings of Study 1 (data not reported here but see Roosen12). These findings are consistent with a substantial body of research suggesting that women and men differ in their response to pain in experimental and clinical settings.47 Although the precise etiology of sex differences in pain sensitivity and response are not yet clear, several psychosocial (eg, pain history and childhood abuse) and biological variables (eg, sex hormones and genetics) have been proposed.47,63 Future studies should investigate the relationship between sex and the SPTS-12 in other populations.
Future studies of patients undergoing major surgery would benefit from pre- and multiple, postsurgical administrations of the SPTS-12 to allow for additional tests of validity and to examine the relationship between changes in SPTS-12 levels over time and post-surgery outcomes. This would also allow for an evaluation of the sensitivity of the scale to change over time and to evaluate the predictive validity of the SPTS-12 given that SPTS-12 scores were higher in patients with CPSP than in those without. A prospective, longitudinal study of cancer patients after lateral thoracotomy showed that the contribution of pain intensity to the explanation of variance in pain disability dropped by ~30% from 6 to 12 months after surgery while that of emotional numbing (a symptom of PTSD) increased by ~16% over the same period.64 This pattern of results raised the possibility that as pain transitions to chronicity, pain intensity and pain disability become progressively uncoupled while emotional numbing and pain disability become more strongly connected.65 It is possible that SPT mediates this relationship at the 12-month time point and that it may be a risk factor for increased pain-related disability after major surgery.
Finally, since several studies have found differences in the pattern of pain-related anxiety constructs between pain and non-pain populations, the SPTS-12 might be examined in additional non-pain settings, nonsurgical chronic pain groups, and psychiatric clinical populations.
Limitations
The sample size varied across the three studies, and in particular, it was on the small side for the IRT conducted in Study 1 (N=105). However, as noted by Morizot et al,43 “there is no gold standard or magic number that can be proposed” (page 411), and this limitation was addressed by using NIRT, an item reduction analyses method that is robust to small sample sizes.26 In Study 3, the total sample size (N=345) was adequate, but subgroup analyses were based on sample sizes ranging from 92 to 127. These may have been less than adequate for EFAs. Nevertheless, that the SPTS-12 showed the same one-factor structure for each subgroup provides some reassurance that sample size was sufficient, as does the recent suggestion that EFAs may be appropriate for use with samples sizes as low as 50 participants.66
Conclusion
The results of the present studies have refined and extended the preliminary work by Kleiman et al4 who proposed that an SPT underlies a number of existing pain-related anxiety measures. The cohesiveness of the SPT factor, as measured by the SPTS-12, is suggested by its one-factor structure, good reliability and validity, and shared variation with pain ratings and a measure of PTSD (eg, the PCL-C). This latter finding is consistent with shared vulnerability models1,9,10 that propose common predisposing factors underlie the development of both chronic pain and PTSD. It has been demonstrated that levels of pain-related anxiety constructs are higher in anxiety disorder patients67 and chronic pain patients2,68 compared with community samples. Whether SPT is one such higher-order factor remains to be seen.
Acknowledgments
Study 1 is based on Kaley Roosen’s master’s thesis. Study 3 is based on Claire Wicks’ master’s thesis. Joel Katz is supported by a Canadian Institutes of Health Research (CIHR) Canada Research Chair in Health Psychology. Samantha R Fashler is supported by a CIHR Vanier Canada Graduate Scholarship. Kaley Roosen was supported by a Social Sciences and Humanities Research Council of Canada, Canada Graduate Scholarship, Master’s Award. Claire Wicks was supported by an Ontario Graduate Scholarship. M Gabrielle Pagé is supported by a CIHR postdoctoral fellowship. Hance Clarke is supported by a Merit Award, Department of Anesthesia, University of Toronto.
Disclosure
The authors report no conflicts of interest in this work.
References
Asmundson GJ, Coons MJ, Taylor S, Katz J. PTSD and the experience of pain: research and clinical implications of shared vulnerability and mutual maintenance models. Can J Psychiatry. 2002;47(10):930–937. | ||
Asmundson GJ, Katz J. Understanding the co-occurrence of anxiety disorders and chronic pain: state-of-the-art. Depression Anxiety. 2009;26(10):888–901. | ||
Demyttenaere K, Bruffaerts R, Lee S, et al. Mental disorders among persons with chronic back or neck pain: results from the World Mental Health Surveys. Pain. 2007;129(3):332–342. | ||
Kleiman V, Clarke H, Katz J. Sensitivity to pain traumatization: a higher-order factor underlying pain-related anxiety, pain catastrophizing and anxiety sensitivity among patients scheduled for major surgery. Pain Res Manag. 2011;16(3):169–177. | ||
Otis JD, Keane TM, Kerns RD. An examination of the relationship between chronic pain and post-traumatic stress disorder. J Rehab Res Dev. 2003;40(5):397–405. | ||
Sharp TJ, Harvey AG. Chronic pain and posttraumatic stress disorder: mutual maintenance? Clin Psychol Rev. 2001;21(6):857–877. | ||
Von Korff M, Crane P, Lane M, et al. Chronic spinal pain and physical-mental comorbidity in the United States: results from the national comorbidity survey replication. Pain. 2005;113(3):331–339. | ||
Liedl A, Knaevelsrud C. Chronic pain and PTSD: the perpetual avoidance model and its treatment implications. Torture. 2008;18(2):69–76. | ||
Turk DC. A diathesis-stress model of chronic pain and disability following traumatic injury. Pain Res Manag. 2002;7(1):9–19. | ||
Rosenbloom BN, Khan S, McCartney C, Katz J. Systematic review of persistent pain and psychological outcomes following traumatic musculoskeletal injury. J Pain Res. 2013;6:39–51. | ||
Keogh E, Asmundson GJG. Negative affectivity, catastrophizing, and anxiety sensitivity. In: Asmundson GJG, Vlaeyen J, Crombez G, editors. Understanding and Treating Fear of Pain. Oxford: Oxford University Press; 2004:91–115. | ||
Roosen K. Development of the Sensitivity to Pain Traumnatization Scale (SPTS) Using Item Response Theory Analysis [MA thesis]. Toronto, ON: Psychology, York University; 2009. Available from: http://www.collectionscanada.gc.ca/obj/thesescanada/vol2/002/MR53817.PDF. Accessed November 23, 2016. | ||
Reiss S, Peterson RA, Gursky DM, McNally RJ. Anxiety sensitivity, anxiety frequency and the prediction of fearfulness. Behav Res Ther. 1986;24(1):1–8. | ||
Rodriguez BF, Bruce SE, Pagano ME, Spencer MA, Keller MB. Factor structure and stability of the Anxiety Sensitivity Index in a longitudinal study of anxiety disorder patients. Behav Res Ther. 2004;42(1):79–91. | ||
Horowitz M, Wilner N, Alvarez W. Impact of event scale: a measure of subjective stress. Psychosom Med. 1979;41(3):209–218. | ||
Fischer J, Corcoran K. Measures for Clinical Practice. A Sourcebook. Vol 2. Adults. 2nd ed. New York: The Free Press; 1994. | ||
Wohlfarth TD, van den Brink W, Winkel FW, ter Smitten M. Screening for posttraumatic stress disorder: an evaluation of two self-report scales among crime victims. Psychol Assess. 2003;15(1):101–109. | ||
McCracken LM, Dhingra L. A short version of the Pain Anxiety Symptoms Scale (PASS-20): preliminary development and validity. Pain Res Manag. 2002;7(1):45–50. | ||
McCracken LM, Zayfert C, Gross RT. The Pain Anxiety Symptoms Scale: development and validation of a scale to measure fear of pain. Pain. 1992;50(1):67–73. | ||
McNeil DW, Rainwater AJ 3rd. Development of the Fear of Pain Questionnaire–III. J Behav Med. 1998;21(4):389–410. | ||
Sullivan MJ, Bishop SR, Pivik J. The pain catastrophizing scale: development and validation. Psychol Assessment. 1995;7(4):524–532. | ||
Osman A, Barrios FX, Kopper BA, Hauptmann W, Jones J, O’Neill E. Factor structure, reliability, and validity of the Pain Catastrophizing Scale. J Behav Med. 1997;20(6):589–605. | ||
Weathers FW, Litz BT, Herman DS, Huska JA, Keane TM. The PTSD Checklist (PCL): reliability, validity, and diagnostic utility. In: 9th Annual Conference of the International Society for Traumatic Stress Studies; Oct 25, 1993, San Antonio, TX. | ||
Conybeare D, Behar E, Solomon A, Newman MG, Borkovec TD. The PTSD Checklist-Civilian Version: reliability, validity, and factor structure in a nonclinical sample. J Clin Psychol. 2012;68(6):699–713. | ||
Ramsay JO. TestGraf: a program for the graphical analysis of multiple-choice and questionniare data [Computer software and manual]; 2000. Avalable from: http://www.psych.mcgill.ca/misc/fda/downloads/testgraf/. Accessed May 3, 2017. | ||
Meijer RR, Baneke JJ. Analyzing psychopathology items: a case for nonparametric item response theory modeling. Psychol Methods. 2004;9(3):354–368. | ||
Rizopoulos D. ltm: an R package for latent variable modeling and item response theory analyses. J Stat Softw. 2006;17(5):1–25. | ||
Samejima F. Estimation of latent ability using a response pattern of graded scores (Psychometric Monograph No. 17). 1969; Available from: http://www.psychometrika.org/journal/online/MN17.pdf. Accessed January 23, 2017. | ||
Zvolensky MJ, Strong D, Bernstein A, Vujanovic AA, Marshall EC. Evaluation of anxiety sensitivity among daily adult smokers using item response theory analysis. J Anxiety Disord. 2009;23(2):230–239. | ||
Beck AT, Steer RA, Brown GK. Manual for the Beck Depression Inventory-II. San Antonio, TX: Psychological Corporation; 1996. | ||
Wang YP, Gorenstein C. Psychometric properties of the Beck Depression Inventory-II: a comprehensive review. Rev Bras Psiquiatr. 2013;35(4):416–431. | ||
Carleton RN, Park I, Asmundson GJ. The Illness/Injury Sensitivity Index: an examination of construct validity. Depression Anxiety. 2006;23(6):340–346. | ||
Taylor S. The structure of fundamental fears. J Behav Ther Exp Psychiatry. 1993;24(4):289–299. | ||
Spielberger CD, Gorsuch RL, Lushene R, Vagg PR, Jacobs G. Manual for the State-Trait Anxiety Inventory (form Y): Self-evaluation questionnaire. Palo Alto, CA: Consulting Psychologists Press; 1983. | ||
Bieling PJ, Antony MM, Swinson RP. The State-Trait Anxiety Inventory, Trait version: structure and content re-examined. Behav Res Ther. 1998;36(7–8):777–788. | ||
O’Connor BP. SPSS and SAS programs for determining the number of components using parallel analysis and velicer’s MAP test. Behav Res Methods Instrum Comput. 2000;32(3):396–402. | ||
Osborne JW, Costello AB. Best practices in exploratory factor analysis: four recommendations for getting the most from your analysis. Pan-Pacific Manag Rev. 2009;12(2):131–146. | ||
Cattell RB. The scree test for the number of factors. Multivariate Behav Res. 1966;1(2):245–276. | ||
Longman RS, Cota AA, Holden RR, Fekken GC. A Regression equation for the parallel analysis criterion in principal components analysis: mean and 95th percentile eigenvalues. Multivariate Behav Res. 1989;24(1):59–69. | ||
Gorsuch RL. Exploratory factor analysis: its role in item analysis. J Pers Assess. 1997;68(3):532–560. | ||
Velicer WF. Determining the number of components from the matrix of partial correlations. Psychometrika. 1976;41(3):321–327. | ||
Hu LT, Bentler PM. Cutoff crieria for fit indexes in covariance structure analysis: conventional criteria versus new alternatives. Struct Equ Modeling. 1999;6(1):1–55. | ||
Morizot J, Ainsworth AT, Reise SP. Toward modern psychometrics: application of item response theory models in personality research. In: Robins RW, Fraley RC, Krueger RF, editors. Handbook of Research Methods in Personality Psychology. New York: Guilford; 2007:407–723. | ||
Lee A, Preacher KJ. Calculation for the test of the difference between two dependent correlations with one variable in common [Computer software]. September, 2013; Available from: http://quantpsy.org/corrtest/corrtest2.htm. Accessed January 24, 2017. | ||
Heckman JJ. Sample selection bias as a specification error. Econometrica. 1979;47(1):153–161. | ||
Rubin DB. Inference and missing data. Biometrika. 1976;63(3):581–592. | ||
Bartley EJ, Fillingim RB. Sex differences in pain: a brief review of clinical and experimental findings. Br J Anaesth. 2013;111(1):52–58. | ||
Racine M, Tousignant-Laflamme Y, Kloda LA, Dion D, Dupuis G, Choiniere M. A systematic literature review of 10 years of research on sex/gender and experimental pain perception - part 1: are there really differences between women and men? Pain. 2012;153(3):602–618. | ||
Wicks CE. Validation of the Sensitivity to Pain Traumatization Scale (SPTS) in a Clinical Sample of Post-Cardiac Surgery Patients with Persistent Pain [MA thesis]. Toronto, ON: Psychology, York Univeristy; 2015. Available from: http://yorkspace.library.yorku.ca/xmlui/handle/10315/32147. Accessed January 26, 2017. | ||
Katz J, Melzack R. Measurement of pain. Surg Clin North Am. 1999;79(2):231–252. | ||
Bennett MI, Smith BH, Torrance N, Potter J. The S-LANSS score for identifying pain of predominantly neuropathic origin: validation for use in clinical and postal research. J Pain. 2005;6(3):149–158. | ||
Taylor S, Zvolensky MJ, Cox BJ, et al. Robust dimensions of anxiety sensitivity: development and initial validation of the Anxiety Sensitivity Index-3. Psychol Assess. 2007;19(2):176–188. | ||
Wheaton MG, Deacon BJ, McGrath PB, Berman NC, Abramowitz JS. Dimensions of anxiety sensitivity in the anxiety disorders: evaluation of the ASI-3. J Anxiety Disord. 2012;26(3):401–408. | ||
Zigmond AS, Snaith RP. The hospital anxiety and depression scale. Acta Psychiatr Scand. 1983;67(6):361–370. | ||
Bjelland I, Dahl AA, Haug TT, Neckelmann D. The validity of the Hospital Anxiety and Depression Scale. An updated literature review. J Psychosom Res. 2002;52(2):69–77. | ||
Herrmann C. International experiences with the Hospital Anxiety and Depression Scale--a review of validation data and clinical results. J Psychosom Res. 1997;42(1):17–41. | ||
Gerbershagen HJ, Rothaug J, Kalkman C, Meissner W. Determination of moderate-to-severe postoperative pain on the numeric rating scale: a cut-off point analysis applying four different methods. Br J Anaesth. 2011;107(4):619–626. | ||
Blanchard EB, Jones-Alexander J, Buckley TC, Forneris CA. Psychometric properties of the PTSD Checklist (PCL). Behav Res Ther. 1996;34(8):669–673. | ||
Cruz-Almeida Y, Riley JL 3rd, Fillingim RB. Experimental pain phenotype profiles in a racially and ethnically diverse sample of healthy adults. Pain Med. 2013;14(11):1708–1718. | ||
Tighe PJ, Riley JL 3rd, Fillingim RB. Sex differences in the incidence of severe pain events following surgery: a review of 333,000 pain scores. Pain Med. 2014;15(8):1390–1404. | ||
Tsang A, Von Korff M, Lee S, et al. Common chronic pain conditions in developed and developing countries: gender and age differences and comorbidity with depression-anxiety disorders. J Pain. 2008;9(10):883–891. | ||
Brown TA. Confirmatory Factor Analysis for Applied Research. New York: Guilford Publications; 2014. | ||
Racine M, Tousignant-Laflamme Y, Kloda LA, Dion D, Dupuis G, Choiniere M. A systematic literature review of 10 years of research on sex/gender and pain perception - part 2: do biopsychosocial factors alter pain sensitivity differently in women and men? Pain. 2012;153(3):619–635. | ||
Katz J, Asmundson GJ, McRae K, Halket E. Emotional numbing and pain intensity predict the development of pain disability up to one year after lateral thoracotomy. Eur J Pain. 2009;13(8):870–878. | ||
Katz J. One man’s risk factor is another man’s outcome: difference in risk factor profiles for chronic postsurgical pain maintenance vs transition. Pain. 2012;153(3):505–506. | ||
de Winter JC, Dodou D, Wieringa PA. Exploratory factor analysis with small sample sizes. Multivariate Behav Res. 2009;44(2):147–181. | ||
Carleton RN, Abrams MP, Asmundson GJ, Antony MM, McCabe RE. Pain-related anxiety and anxiety sensitivity across anxiety and depressive disorders. J Anxiety Disorders. 2009;23(6):791–798. | ||
Katz J, Pagé MG, Fashler SR, Rosenbloom BN, Asmundson GJG. Chronic pain and the anxiety disorders: epidemiology, mechanisms and models of comorbidity, and treatment. In: Gaumond I, Saravane D, Marchand S, editors. Mental Health and Pain. New York: Springer; 2014:119–155. |
 © 2017 The Author(s). This work is published and licensed by Dove Medical Press Limited. The full terms of this license are available at https://www.dovepress.com/terms.php and incorporate the Creative Commons Attribution - Non Commercial (unported, v3.0) License.
By accessing the work you hereby accept the Terms. Non-commercial uses of the work are permitted without any further permission from Dove Medical Press Limited, provided the work is properly attributed. For permission for commercial use of this work, please see paragraphs 4.2 and 5 of our Terms.
© 2017 The Author(s). This work is published and licensed by Dove Medical Press Limited. The full terms of this license are available at https://www.dovepress.com/terms.php and incorporate the Creative Commons Attribution - Non Commercial (unported, v3.0) License.
By accessing the work you hereby accept the Terms. Non-commercial uses of the work are permitted without any further permission from Dove Medical Press Limited, provided the work is properly attributed. For permission for commercial use of this work, please see paragraphs 4.2 and 5 of our Terms.