")
Back to Journals » Drug Design, Development and Therapy » Volume 9
Schisandrin B inhibits cell growth and induces cellular apoptosis and autophagy in mouse hepatocytes and macrophages: implications for its hepatotoxicity
Authors Zhang Y, Zhou Z, Jin H, Hu C, He Z, Yu Z, Ko K, Yang T, Zhang X, Pan S, Zhou S
Received 5 November 2014
Accepted for publication 3 December 2014
Published 9 April 2015 Volume 2015:9 Pages 2001—2027
DOI https://doi.org/10.2147/DDDT.S77071
Checked for plagiarism Yes
Review by Single anonymous peer review
Peer reviewer comments 5
Editor who approved publication: Prof. Dr. Wei Duan
Video abstract presented by Yi Zhang
Views: 420
Yi Zhang,1,2 Zhi-Wei Zhou,2 Hua Jin,2 Chengbin Hu,2 Zhi-Xu He,3 Zhi-Ling Yu,4 Kam-Ming Ko,5 Tianxin Yang,6 Xueji Zhang,7 Si-Yuan Pan,1 Shu-Feng Zhou2
1Department of Pharmacology, School of Chinese Materia Medica, Beijing University of Chinese Medicine, Beijing, People’s Republic of China; 2Department of Pharmaceutical Sciences, College of Pharmacy, University of South Florida, Tampa, FL, USA; 3Guizhou Provincial Key Laboratory for Regenerative Medicine, Stem Cell and Tissue Engineering Research Center and Sino–US Joint Laboratory for Medical Sciences, Guiyang Medical University, Guiyang, Guizhou, People’s Republic of China; 4School of Chinese Medicine, Hong Kong Baptist University, Hong Kong, People’s Republic of China; 5Division of Life Science, Hong Kong University of Science and Technology, Hong Kong, People’s Republic of China; 6Department of Internal Medicine, University of Utah and Salt Lake Veterans Affairs Medical Center, Salt Lake City, UT, USA; 7Research Center for Bioengineering and Sensing Technology, University of Science and Technology Beijing, Beijing, People’s Republic of China
Abstract: A number of drugs and herbal compounds have been documented to cause hepatoxicity. Schisandrin B (Sch B) is an active dibenzocyclooctadiene isolated from Schisandrae fructus, with a wide array of pharmacological activities. However, the potential hepatotoxicity of Sch B is a major safety concern, and the underlying mechanism for Sch B-induced liver toxic effects is not fully elucidated. In the present study, we aimed to investigate the liver toxic effects and the molecular mechanisms of Sch B in mouse liver and macrophage cells. The results have shown that Sch B exhibits potent grow inhibitory, proapoptotic, and proautophagic effects in AML-12 and RAW 264.7 cells. Sch B markedly arrested cells in G1 phase in both cell lines, accompanied by the down-regulation of cyclin dependent kinase 2 (CDK2) and cyclin D1 and up-regulation of p27 Kip1 and checkpoint kinase 1. Furthermore, Sch B markedly increased the apoptosis of AML-12 and RAW 264.7 cells with a decrease in the expression of B-cell lymphoma-extra-large and (Bcl-xl) B-cell lymphoma 2 (Bcl-2), but an increase in the expression of B-cell lymphoma 2-associated X protein (Bax). Sch B promoted the cleavage of caspase 3 and poly-adenosine diphosphate-ribose polymerase (PARP) in both cell lines. Additionally, Sch B significantly induced autophagy of AML-12 and RAW 264.7 cells. Sch B inhibited the activation of phosphatidylinositol 3-kinase (PI3K)/protein kinase B (Akt)/mammalian target of rapamycin (mTOR) signaling pathway, as indicated by their altered phosphorylation, contributing to the proautophagic effect of Sch B. Taken together, our findings show that the inducing effects of Sch B on cell cycle arrest, apoptosis, and autophagy may contribute to its liver toxic effects, which might provide a clue for the investigation of the molecular toxic targets and underlying mechanisms for Sch B-induced hepatotoxicity in herbal consumers. More studies are warranted to fully delineate the underlying mechanisms, efficacy, and safety of Sch B for clinical use.
Keywords: herbal medicine, liver toxicity, mTOR, Bcl-2, AML-12 cell, RAW 264.7 cell
Introduction
Hepatotoxicity is the most common cause of liver injury and failure,1,2 and there are over 900 therapeutic drugs, toxins, and herbs that have been reported to cause hepatotoxicity.3 Hepatotoxicity is one of the main reasons for the withdrawal of a drug from the market.4 Hepatotoxicity can induces hepatocellular necrosis, apoptosis, or sensitization to cytokines and inflammatory mediators produced by non-parenchymal cells.5 The estimated annual incidence of hepatotoxicity induced by therapeutic drugs, toxins, and herbs is 13.9–24.0 per 100,000 incidences worldwide.6 In the United States, therapeutic drug-, toxin-, and herb-induced hepatotoxicity accounts for approximately 50% of the cases of acute liver failure.7 In People’s Republic of China, therapeutic drug-, toxin-, and herb-induced hepatotoxicity is also the leading cause of acute liver failure.8 However, the toxicity-related protein molecules and underlying mechanisms for xenobiotic-induced hepatotoxicity are not fully understood.9,10
Notably, the naturally occurring herbs or compounds are usually considered to be “safe”, and herb medicines/products have become increasingly popular all over the world to manage numerous aliments and improve body function.11 However, there is now growing evidence showing that herbs may cause adverse reactions, leading to organ toxicities including hepatotoxicity, nephrotoxicity, neurotoxicity, skin toxicity, and bone marrow toxicity.12 It has been reported that there are a number of herbal supplements can induce potential hepatotoxicity.13 In the United States, the proportion of liver injury cases resulting from herbal products has increased significantly in the last decade.14 In People’s Republic of China, herbal products have become the second most common etiology of drug-induced liver injury.15 Therefore, the investigation of herbal product-induced hepatotoxicity has drawn intensive attention. However, assessing potential hepatotoxicity of herbal products is challenging due to their multiple components and the complex composition.16,17 Moreover, herbal products are often co-administered with conventional therapeutic drugs to enhance the therapeutic effect, but this may result in severe consequences.18 Hence, there is a need to determine the organ toxicity, identify the potential targets related to the toxic effects, and delineate the underlying mechanisms for herbal products.
Schisandrin B (Sch B; Figure 1A) is the most abundant, active dibenzocyclooctadiene derivative isolated from Schisandrae fructus (“Wu-Wei-Zi” in Chinese), and it is commonly used in traditional Chinese medicine with a notable liver protective effect.19,20 However, our previous studies have shown that Sch B treatment concentration- and time-dependently increased hepatic weight, malondialdehyde level, and serum alanine transaminase activity in mice, indicating that Sch B possesses substantial hepatotoxic effects in vivo.21–23 Moreover, studies have shown that Sch B could kill various types of cells in vitro,24–26 but the underlying mechanisms for the cell-killing effects are largely unknown. In the present study, we aimed to investigate the hepatotoxic effects of Sch B with a focus on cell proliferation, cell cycle distribution, apoptosis, and autophagy, and to dissect the possible molecular mechanisms responsible for the cytotoxic effects of Sch B in mouse liver and macrophage cells.
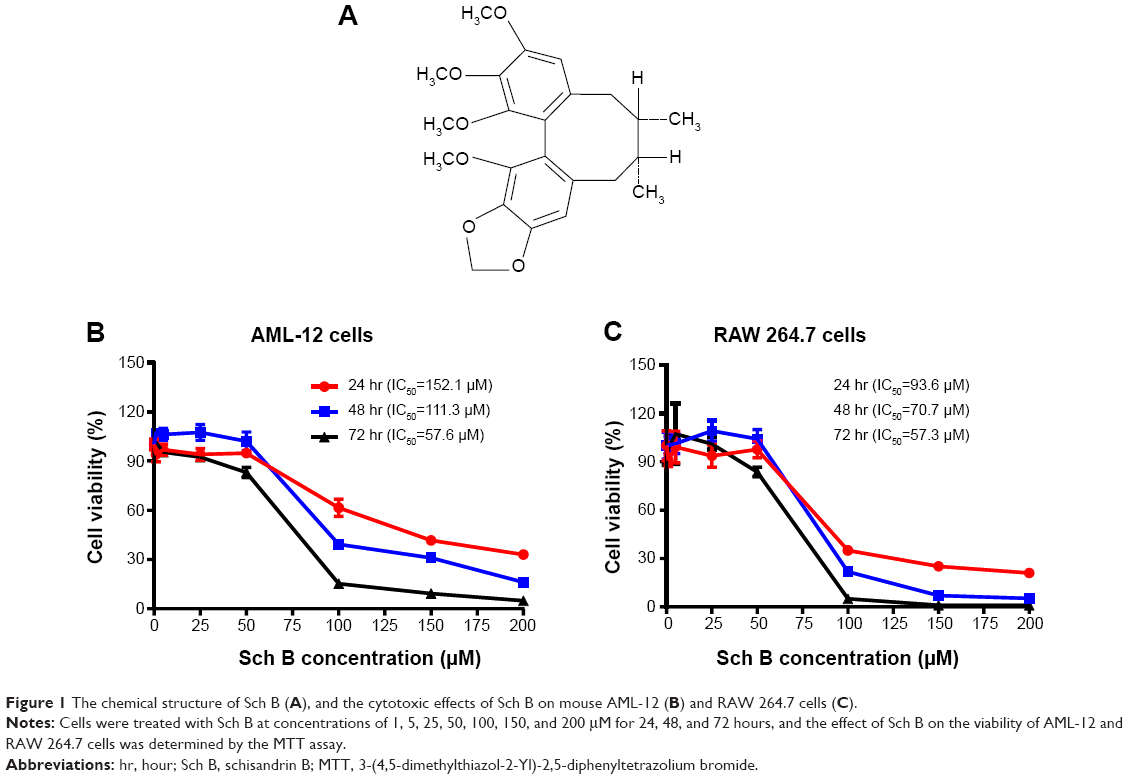 | Figure 1 The chemical structure of Sch B (A), and the cytotoxic effects of Sch B on mouse AML-12 (B) and RAW 264.7 cells (C). |
Materials and methods
Chemicals and reagents
Sch B was purified from the petroleum ether extract of dried S. fructus by silica gel column chromatography as previously described.27 The purity of Sch B was >95%, which was determined by high performance liquid chromatographic analysis. Dulbecco’s Modified Eagle’s Medium (DMEM) and Dulbecco’s Modified Eagle’s Medium Nutrient Mixture F-12 (DMEM/F-12) were obtained from Corning Cellgro Inc. (Herndon, VA, USA). Dulbecco’s phosphate-buffered saline (D-PBS), RNase A, propidium iodide (PI), (4,5-dimethyl-thiazol-2-yl)-2,5-diphenyl-tetrazolium bromide (MTT), 4-(2-hydroxyethyl) piperazine-1-ethanesulfonic acid (HEPES), dexamethasone, phosphatase and protease inhibitor cocktails, and fetal bovine serum (FBS) were purchased from Sigma-Aldrich Co. (St Louis, MO, USA). Cyto-ID® autophagy detection kit was bought from Enzo Life Sciences Inc. (Farmingdale, NY, USA), and annexin V:phycoerythrin (PE) apoptosis detection kit was purchased from BD Biosciences Inc. (San Jose, CA, USA). The polyvinylidene difluoride membrane was purchased from EMD Millipore Inc. (Bedford, MA, USA). Western blotting substrate was obtained from Thermo Fisher Scientific Inc. (Waltham, MA, USA). The Bio-Rad protein assay kit was bought from Bio-Rad Laboratories Inc. (Hercules, CA, USA). Primary antibodies against cyclin D1, cyclin B1, cyclin dependent kinase 2 (CDK2), p27 Kip1, cytochrome c, cleaved poly-adenosine diphosphate-ribose polymerase (PARP), cleaved caspase 3, phosphatidylinositol 3-kinase (PI3K) p85, phosphorylated (p-) PI3K at Tyr 458, 5′-adenosine monophosphate-activated protein kinase (AMPK), protein kinase B (Akt), p-Akt at Ser473, mammalian target of rapamycin (mTOR), p-mTOR at Ser2448, phosphatase and tensin homolog (PTEN), PI3K class III, beclin 1, cytosolic microtubule-associated protein 1A/1B-light chain 3 (LC3-I), and the membrane-bound LC3-phosphatidylrthanolamine conjugate (LC3-II) were purchased from Cell Signaling Technology Inc. (Beverly, MA, USA). The primary antibodies against mouse E2F transcriptional factor 1 (E2F1), proliferating cell nuclear antigen (PCNA), checkpoint kinase 1 (Chk1), B-cell lymphoma 2 (Bcl-2), B-cell lymphoma-extra-large (Bcl-xl), Bcl-2-like protein 4/Bcl-2-associated X protein (Bax), and β-actin were obtained from Santa Cruz Biotechnology Inc. (Dallas, TX, USA).
Cell lines and cell culture
The alpha mouse liver 12 (AML-12) and RAW 264.7 cell lines were obtained from American Type Culture Collection (ATCC; Manassas, VA, USA). The AML-12 cell line was established from hepatocytes from a mouse (CD1 strain, line MT42) transgenic for human transforming growth factor-α. These cells exhibit typical hepatocyte features such as peroxisomes and bile canalicular like structure. RAW 264.7 is mouse leukemic monocyte macrophage cell line and was established from a tumor induced by Abelson murine leukemia virus and shows typical macrophage functions. AML-12 cells were cultured in DMEM/F-12 medium containing l-glutamine, HEPES, insulin-transferrin-selenium (100×), and dexamethasone (40 ng/mL) supplemented with 10% heat-inactivated FBS and 1% penicillin-streptomycin. RAW 264.7 cells were cultured with DMEM containing 4.5 g/L glucose, l-glutamine, and sodium pyruvate supplemented with 10% heat-inactivated FBS and 1% penicillin-streptomycin. All cells were maintained in a 5% CO2/95% air humidified incubator at 37°C.
Cell viability assay
The effect of Sch B on the viability of AML-12 and RAW 264.7 cells was determined using the MTT assay. Briefly, AML-12 and RAW 264.7 cells were seeded into 96-well plates at a density of 6,000 cells/well. After 24-hour incubation, the cells were treated with Sch B at concentrations of 1, 5, 25, 50, 100, 150, and 200 μM for 24, 48, and 72 hours. Following the Sch B treatment, 10 μL of MTT solution (5 mg/mL) was added to each well and cells were incubated for 3 hours at 37°C. The medium was carefully aspirated, and 100 μL dimethyl sulfoxide (DMSO) was added to dissolve the crystal. The samples were incubated 10 minutes at 37°C in the dark. Then, the absorbance was measured using a Synergy™ H4 Hybrid microplate reader (BioTek Instruments Inc., Winooski, VT, USA) at a wavelength of 570 nm. The concentration required for 50% inhibition of the growth (IC50) was determined from concentration–response curves obtained in multi-replicated experiments by nonlinear regression analysis using the GraphPad Prism 6 software (GraphPad Software Inc., La Jolla, CA, USA).
Determination of cell cycle distribution using flow cytometry
The effect of Sch B on the cell cycle distribution was examined using PI as the DNA stain to determine DNA content by flow cytometry as described previously.28 Briefly, AML-12 and RAW 264.7 cells were treated with Sch B at concentrations of 0.1, 1, 10, and 25 μM for 24 hours. In separate experiments, AML-12 and RAW 264.7 cells were treated with 25 μM Sch B for 6, 24, 48, and 72 hours. Following the Sch B treatment, cells were collected, washed by D-PBS, and fixed in 70% ethanol at −20°C overnight. Then, the cells were resuspended in 1 mL D-PBS containing 1 mg/mL RNase A and 50 μg/mL PI. Cells were incubated in the dark for 30 minutes at room temperature. The cells were subjected to cell cycle analysis using a flow cytometer (BD™ LSR II; Becton Dickinson Immunocytometry Systems, San Jose, CA, USA). The flow cytometer collected 20,000 events for analysis.
Quantification of apoptosis
Apoptotic cells were quantitated using the flow cytometer with the annexin V:PE apoptosis detection kit after cells were treated with Sch B at concentrations of 0.1, 1, 10, and 25 μM for 24 hours. In separate experiments, AML-12 and RAW 264.7 cells were treated with 25 μM Sch B for 6, 12, 24, and 48 hours. Cells were collected and washed twice with cold D-PBS, and then cells were resuspended at a concentration of 1×10⁶ cells/mL in 1× binding buffer. A quota of the cells (100 μL) was transferred to a 5 mL clean culture tube with the addition of 2.5 μL annexin V:PE and 2.5 μL 7-amino-actinomycin D (7-AAD). The cells were gently mixed and incubated in the dark for 15 minutes at room temperature and then subjected to the flow cytometric analysis.28 Cells that stain positive for annexin V:PE and negative for 7-AAD are undergoing apoptosis; cells that stain positive for both annexin V:PE and 7-AAD are either in the end stage of apoptosis, are undergoing necrosis, or are already dead; and cells that stain negative for both annexin V:PE and 7-AAD are alive and not undergoing measurable apoptosis that collected 20,000 events for analysis.
Autophagy analysis using flow cytometry
AML-12 and RAW 264.7 cells were seeded at a density of 4×10⁵ cells/dish. The cells were treated with fresh medium alone, control vehicle alone (0.05% DMSO, v/v) or Sch B (0.1, 1, 10, and 25 μM) for 24 hours at 37°C. At the end of the treatment, the cells were collected and pelleted by centrifugation at 1,200× g for 5 minutes. The diluted Cyto-ID® green fluorescent stain solution (250 μL) (Enzo Life Sciences Inc.) was added to each sample and mixed well. Cells were incubated for 30 minutes at 37°C in the dark. After the incubation, cells were washed with 1× assay buffer and resuspended in 250 μL fresh 1× assay buffer. Thereafter, cells were analyzed using the green fluorescence (FL1) channel of the flow cytometer that collected 20,000 events for analysis.
Western blotting analysis
AML-12 and RAW 264.7 cells were washed with cold D-PBS after 24-hour treatment with Sch B at 0.1, 1, 10, and 25 μM, lysed with the lysis buffer consisting of 50 mM HEPES at pH 7.5, 150 mM NaCl, 10% glycerol, 1.5 mM MgCl2, 1% Triton-X 100, 1 mM ethylenediaminetetraacetic acid at pH 8.0, 10 mM sodium pyrophosphate, 10 mM sodium fluoride, and 1% phosphatase and protease inhibitor cocktails. The supernatant was collected after the cell lysate was centrifuged at 14,000× g for 15 minutes at 4°C. Protein concentration was measured using the Bio-Rad protein assay kit. Equal amount of protein sample (30 μg) was resolved by sodium dodecyl sulfate polyacrylamide gel electrophoresis (SDS-PAGE) sample loading buffer and denatured for 10 minutes at 95°C. Subsequently, the samples were electrophoresed on 8%–15% SDS-PAGE mini-gel and transferred onto immobilon polyvinylidene difluoride membrane at 80 V for 3 hours at 4°C. Membranes were probed with indicated primary antibodies overnight at 4°C and were then blotted with respective horseradish peroxidase-conjugated secondary anti-mouse or anti-rabbit antibody. Visualization was performed using Bio-Rad ChemiDoc™ XRS system (Bio-Rad Inc.) with enhanced-chemiluminescence substrate, and the blots were analyzed using Image Lab 3.0 (Bio-Rad Inc.). Protein level was normalized to the matching densitometric value of the internal control β-actin.
Statistics analysis
Data are presented as mean ± standard error of the mean (SEM). Comparisons of multiple groups were evaluated by one-way analysis of variance (ANOVA) followed by Dunnett’s multiple comparisons test. Values of P<0.05 were considered statistically significant. Assays were performed at least three times independently.
Results
Sch B inhibits the proliferation of AML-12 and RAW 264.7 cells
To investigate the cytotoxic effect of Sch B on mouse liver and macrophage cells, we first examined the effect of Sch B on cell proliferation in AML-12 and RAW 264.7 cells using the MTT assay. As shown in Figure 1B and C, Sch B significantly inhibited the growth of AML-12 and RAW 264.7 cells in concentration- and time-dependent manners. When AML-12 cells were treated with Sch B at 1, 5, 25, 50, 100, 150, and 200 μM, the percentage of cellular viability over the control cells (100%) was 94.0%, 96.9%, 94.0%, 94.9%, 61.6%, 41.7%, and 33.1% for 24-hour treatment, respectively (Figure 1B); the percentage of cellular viability over the control cells (100%) was 106.8%, 106.2%, 107.5%, 102.1%, 39.4%, 31.1%, and 16.1% for 48-hour treatment, respectively (Figure 1B); and the percentage of cellular viability over the control cells (100%) was 101.4%, 95.5%, 92.4%, 83.1%, 15.3%, 9.3%, and 5.0% for 72-hour treatment, respectively (Figure 1B). The IC50 values were 152.1, 111.3, and 57.6 μM after AML-12 cells were incubated with Sch B for 24, 48, and 72 hours, respectively (Figure 1B). Similarly, when RAW 264.7 cells were incubated with Sch B at 1, 5, 25, 50, 100, 150, and 200 μM, the percentage of cellular viability over the control cells (100%) was 91.0%, 99.2%, 93.6%, 97.7%, 35.0%, 25.2%, and 21.0% for 24-hour incubation, respectively (Figure 1C); the percentage of cellular viability over the control cells (100%) was 100.2%, 101.3%, 109.2%, 104.1%, 21.8%, 7.1%, and 5.3% for 48-hour incubation, respectively (Figure 1C); and the percentage of cellular viability over the control cells (100%) was 98.0%, 107.4%, 101.1%, 83.7%, 5.0%, 1.1%, and 1.1% for 72-hour incubation, respectively (Figure 1C). The IC50 values were 93.6, 70.7, and 57.3 μM after RAW 264.7 cells were incubated with Sch B for 24, 48, and 72 hours, respectively (Figure 1C). Taken together, these results indicate that Sch B exhibits concentration- and time-dependent inhibitory effects on the growth of AML-12 and RAW 264.7 cells.
Sch B induces G1 arrest in AML-12 and RAW 264.7 cells
Since we had observed an inhibitory effect on cell growth of AML-12 and RAW 264.7 cells, we next determined the effect of Sch B on cell cycle distribution in both cell lines using flow cytometric analysis. As shown in Figures 2 and 3, treatment of AML-12 and RAW 264.7 cells with Sch B concentration- and time-dependently arrested cells in G1 phase. At basal level, the percentages of AML-12 and RAW 264.7 cells in G1 phase were 59.2% and 54.6%, respectively (Figure 2A and B). Treatment of AML-12 and RAW 264.7 cells with 25 μM Sch B for 24 hours resulted in a substantial increase in the cell number in G1 phase. In comparison to the control cells, the percentages of cells arrested in G1 phase were 66.8% and 62.9% in AML-12 and RAW 264.7 cells, respectively, resulting in 12.8% and 15.1% increases in the cell number in G1 phase, respectively (P<0.01 by one-way ANOVA; Figure 2B). Lower concentrations of Sch B (0.1–10 μM) did not significantly alter the numbers of AML-12 and RAW 264.7 cells in G1 phase (P>0.05 by one-way ANOVA; Figure 2B). In contrast, Sch B concentration-dependently decreased the number of AML-12 cells in S and G2/M phases. There were 20.2% and 17.4% decreases in cell numbers in S and G2/M phases, respectively, when treated with 25 μM Sch B, compared to the control cells (P<0.001 or P<0.05 by one-way ANOVA; Figure 2B). In RAW 264.7 cells, treatment of cells with Sch B at 10 μM and 20 μM markedly decreased the number of cells in S phase by 15% and 24%, respectively (P<0.05 or P<0.001 by one-way ANOVA; Figure 2B). However, exposure of RAW 264.7 cells to Sch B at concentrations ranging from 0.1–25 μM for 24 hours did not significantly affect the number of cells in G2/M phase (Figure 2B).
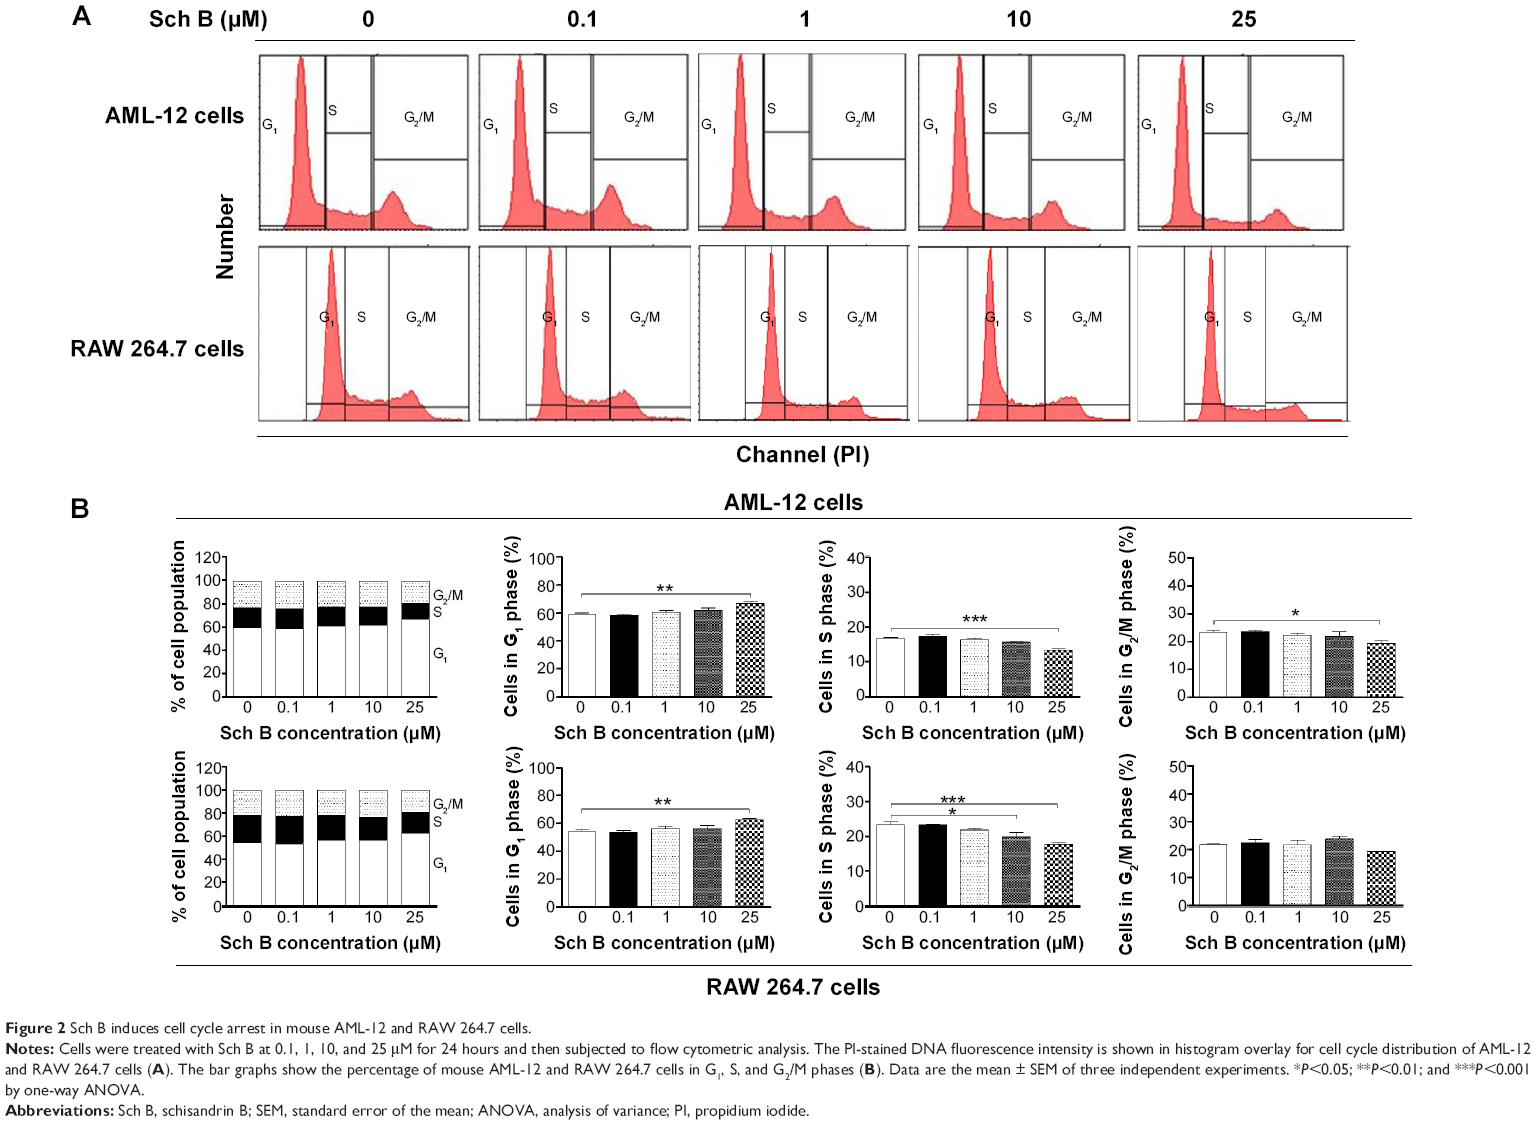 | Figure 2 Sch B induces cell cycle arrest in mouse AML-12 and RAW 264.7 cells. |
We further conducted separate experiments to evaluate the effect of Sch B on cell cycle distribution in AML-12 and RAW 264.7 cells over 72 hours. Compared to the control cells, the percentage of AML-12 cells in G1 phase was markedly increased from 42.8% at basal level (zero time) to 51.1%, 51.2%, and 71.6% after 24-, 48-, and 72-hour treatments with 25 μM Sch B, respectively (Figure 3A and B). These treatments yielded increases of 19.3%, 19.6%, and 67.2% in the number of AML-12 cells in G1 phase compared to the control cells treated with DMSO only, respectively (P<0.01 or P<0.001 by one-way ANOVA; Figure 3A and B). Treatment of AML-12 cells with Sch B at 25 μM significantly reduced the number of cells in S and G2/M phases (Figure 3A and B). The numbers of cells in S phase were decreased by 12.9%, 11.1%, and 59.7% in AML-12 cells when treated with Sch B at 25 μM for 24, 48, and 72 hours, respectively (P<0.05, P<0.01 or P<0.001 by one-way ANOVA; Figure 3A and B). The percentage of AML-12 cells in G2 phase was reduced by 10.7%, 18.8%, and 50.0%, respectively, when cells were treated with Sch B at 25 μM for 24, 48, and 72 hours (P<0.05, P<0.01, or P<0.001 by one-way ANOVA; Figure 3A and B).
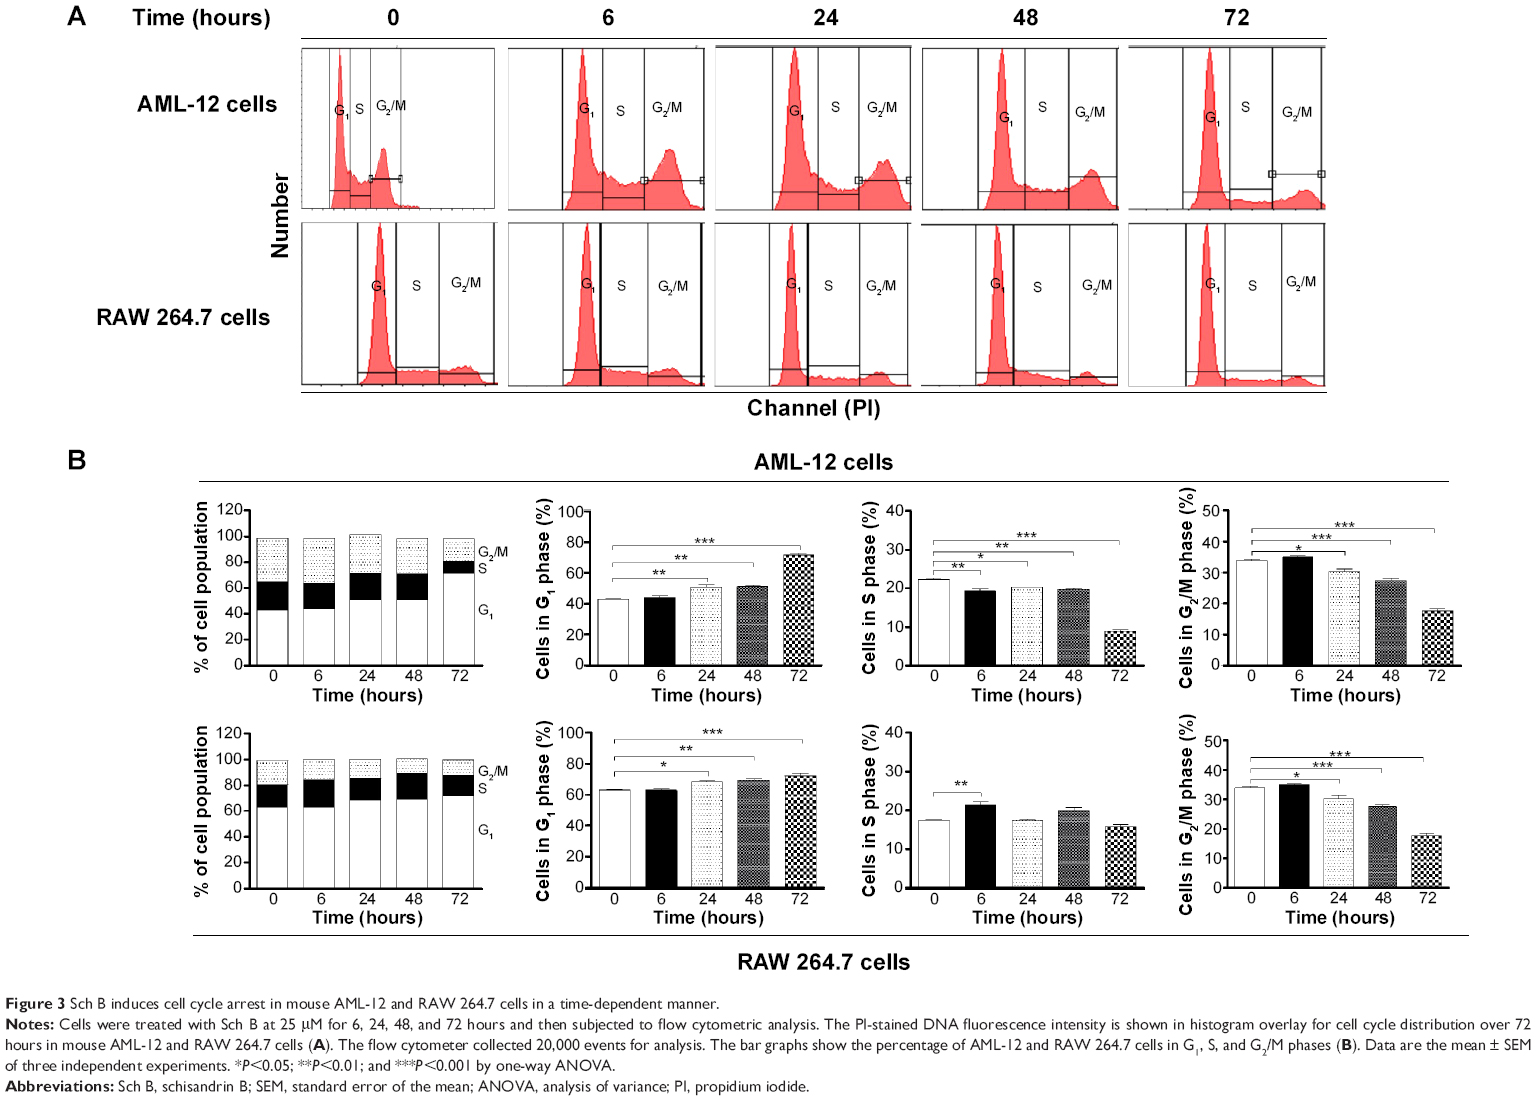 | Figure 3 Sch B induces cell cycle arrest in mouse AML-12 and RAW 264.7 cells in a time-dependent manner. |
Similarly, Sch B remarkably altered the cell cycle distribution over a 72-hour period of treatment in RAW 264.7 cells (Figure 3A and B). The percentage of RAW 264.7 cells in G1 phase was increased from 63.2% at basal level (zero time) to 68.4%, 69.5%, and 72.3% when cells were exposed to 25 μM Sch for 24, 48, and 72 hours, respectively (P<0.01 or P<0.001 by one-way ANOVA; Figure 3A and B). Sch B treatment led to varying alterations in the number of RAW 264.7 cells in S phase. Sch B at 25 μM markedly increased the number of cells in S phase by 23.0% after 6-hour treatment (P<0.01 by one-way ANOVA; Figure 3A and B); however, there was no significant change in S phase when RAW 264.7 cells were treated with 25 μM Sch B for 24, 48, and 72 hours. Moreover, the percentage of RAW 264.7 cells in G2/M phase was markedly decreased by 15.9%, 23.4%, 41.2%, and 38.0% after 6-, 24-, 48-, and 72-hour treatment with 25 μM Sch B, respectively (P<0.05, P<0.01, or P<0.001 by one-way ANOVA; Figure 3A and B). Collectively, the results show that Sch B possesses a potent inhibitory effect on cell cycle progression in AML-12 and RAW 264.7 cells.
Sch B induces G1 arrest via regulation of cell cycle G1/S checkpoint signaling pathway in AML-12 and RAW 264.7 cells
To further investigate the molecular mechanism for Sch B-induced cell cycle arrest in AML-12 and RAW 264.7 cells, the expression levels of CDK2, cyclin B1, cyclin D1, p27 Kip1, Chk1, PCNA, and E2F1 in AML-12 and RAW 264.7 cells were examined by Western blotting assay. As shown in Figure 4A and B, Sch B treatment resulted in varying alterations in the expression of these key cell cycle regulators in both cell lines. Compared to the control cells, incubation of AML-12 cells with Sch B significantly altered the expression levels of cyclin D1, p27 Kip1, Chk1, PCNA, and E2F1, whereas there were no significant changes in the expression levels of CDK2 and cyclin B1. There were 43.7% and 44.0% decreases in the expression level of cyclin D1 when AML-12 cells were treated with 10 and 25 μM Sch B, respectively (Figure 4A and B), and there was a 96.8% increase in the expression level of p27 Kip1 when AML-12 cells were treated with 25 μM Sch B (P<0.01 by one-way ANOVA; Figure 4A and B). Treatment of AML-12 cells with Sch B at 1, 10, and 25 μM resulted in a 109.1%, 89.6%, and 69.2% increase in the expression level of Chk1 (P<0.05 or P<0.01 by one-way ANOVA). In RAW 264.7 cells, Sch B significantly altered the expression levels of p27 Kip1 and PCNA, whereas there was no significant alteration in the expression levels of CDK2, cyclin B1, cyclin D1, Chk1, and E2F1 (Figure 4A and B). There was a 251.9% increase in the expression level of p27 Kip1 when RAW 264.7 cells were treated with 25 μM Sch B (P<0.01 by one-way ANOVA). The expression level of cyclin D1 in RAW 264.7 cells was decreased by 19.3%, 5.6%, 24.6%, and 53.3% when cells were treated with Sch B at 0.1, 1, 10, and 25 μM, respectively, but there was no statistical significance compared to control cells (P>0.05 by one-way ANOVA; Figure 4A and B).
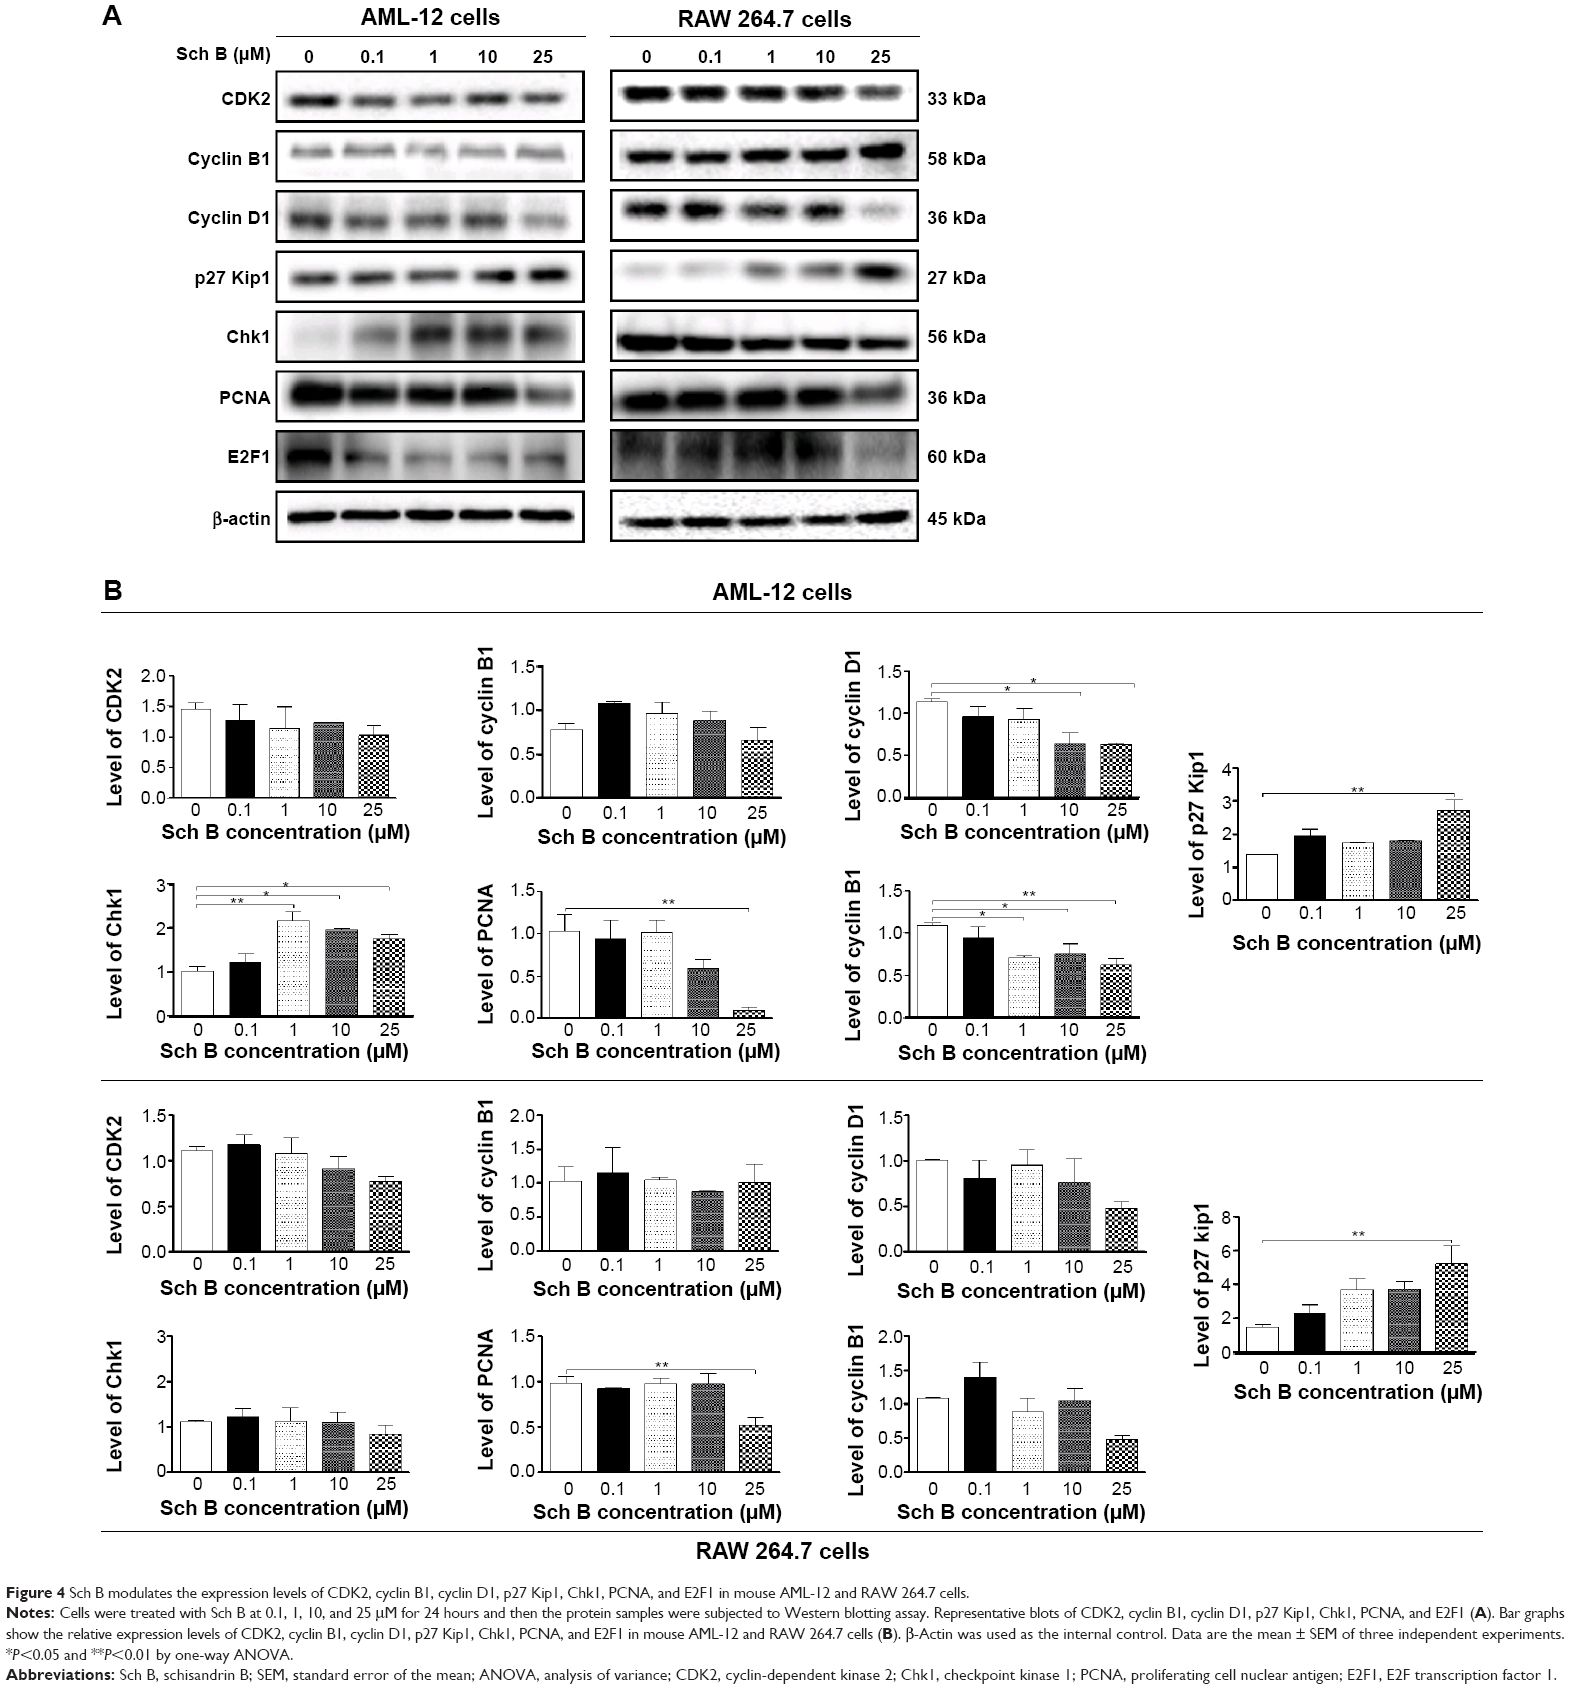 | Figure 4 Sch B modulates the expression levels of CDK2, cyclin B1, cyclin D1, p27 Kip1, Chk1, PCNA, and E2F1 in mouse AML-12 and RAW 264.7 cells. |
Furthermore, the effect of Sch B on the expression levels of PCNA and E2F1 was also examined, due to their important roles in the regulation of gene expression at the G1/S boundary of the cell cycle.29,30 As shown in Figure 4A and B, the expression levels of PCNA and E2F1 significantly decreased in both AML-12 and RAW 264.7 cells treated with Sch B. Treatment of AML-12 and RAW 264.7 cells with 25 μM Sch B for 24 hours significantly decreased the expression level of PCNA by 90.5% and 47.7%, respectively, compared to the control cells (P<0.01 by one-way ANOVA; Figure 4A and B). Sch B at 1, 10, and 25 μM significantly down-regulated the expression level of E2F1 by 34.9%, 31.0%, and 43.2% in AML-12 cells, respectively, compared with the control cells (P<0.05 or P<0.01 by one-way ANOVA; Figure 4A and B). In RAW 264.7 cells, although the expression level of E2F1 was not significantly changed when treated with Sch B, the expression of E2F1 was decreased 19.4%, 4.1%, and 56.9% with the treatment of Sch B at 1, 10, and 25 μM, respectively (P>0.05 by one-way ANOVA). Taken together, these findings show that the inducing effect of Sch B on cell cycle arrest in AML-12 and RAW 264.7 cells may be ascribed to the modulating effects of Sch B on the expression of the key regulators in the cell cycle progression.
Sch B induces the apoptosis of AML-12 and RAW 264.7 cells via activation of the mitochondrial pathway
In order to further test the hepatotoxicity of Sch B, the effect of Sch B on programmed cell death was examined. We first examined the apoptosis-inducing effect of Sch B in AML-12 and RAW 264.7 cells; the number of apoptotic cells was quantified using flow cytometric analysis. Treatment of AML-12 and RAW 264.7 cells with Sch B-induced apoptosis in concentration- and time-dependent manners (Figure 5A and B; Figure 6A and B). The percentages of apoptotic cells were 3.5% and 1.8% in AML-12 and RAW 264.7 cells treated with the control vehicle only (0.05% DMSO, v/v), respectively (Figure 5A and B). When AML-12 cells were treated with Sch B at 10 μM and 25 μM for 24 hours, the total percentages of apoptotic cells (early + late apoptosis) were increased to 5.9% and 6.8%, with a 69.5% and 94.3% rise compared to the control cells, respectively (P<0.05 or P<0.01 by one-way ANOVA; Figure 5A and B). Treatment of AML-12 cells with 25 μM Sch B for 6, 12, 24, and 48 hours increased the total percentage of apoptotic cells by 43.4%, 78.1%, 84.2%, and 110.5%, respectively (P<0.01 by one-way ANOVA; Figure 6A and B). Similarly, when RAW 264.7 cells were treated with Sch B at 10 μM and 25 μM for 24 hours, the total percentages of apoptotic cells were markedly increased 24.5% and 34.0%, respectively (P<0.05 or P<0.01 by one-way ANOVA; Figure 5A and B). However, treatment of RAW 264.7 cells with Sch B at 25 μM markedly increased the total percentage of apoptotic cells from 4.2% at basal level to 4.4% and 5.4% after 12- and 24-hour treatment, which then declined to 2.5% after 48-hour treatment of Sch B (P<0.01 or P<0.001 by one-way ANOVA; Figure 6A and B).
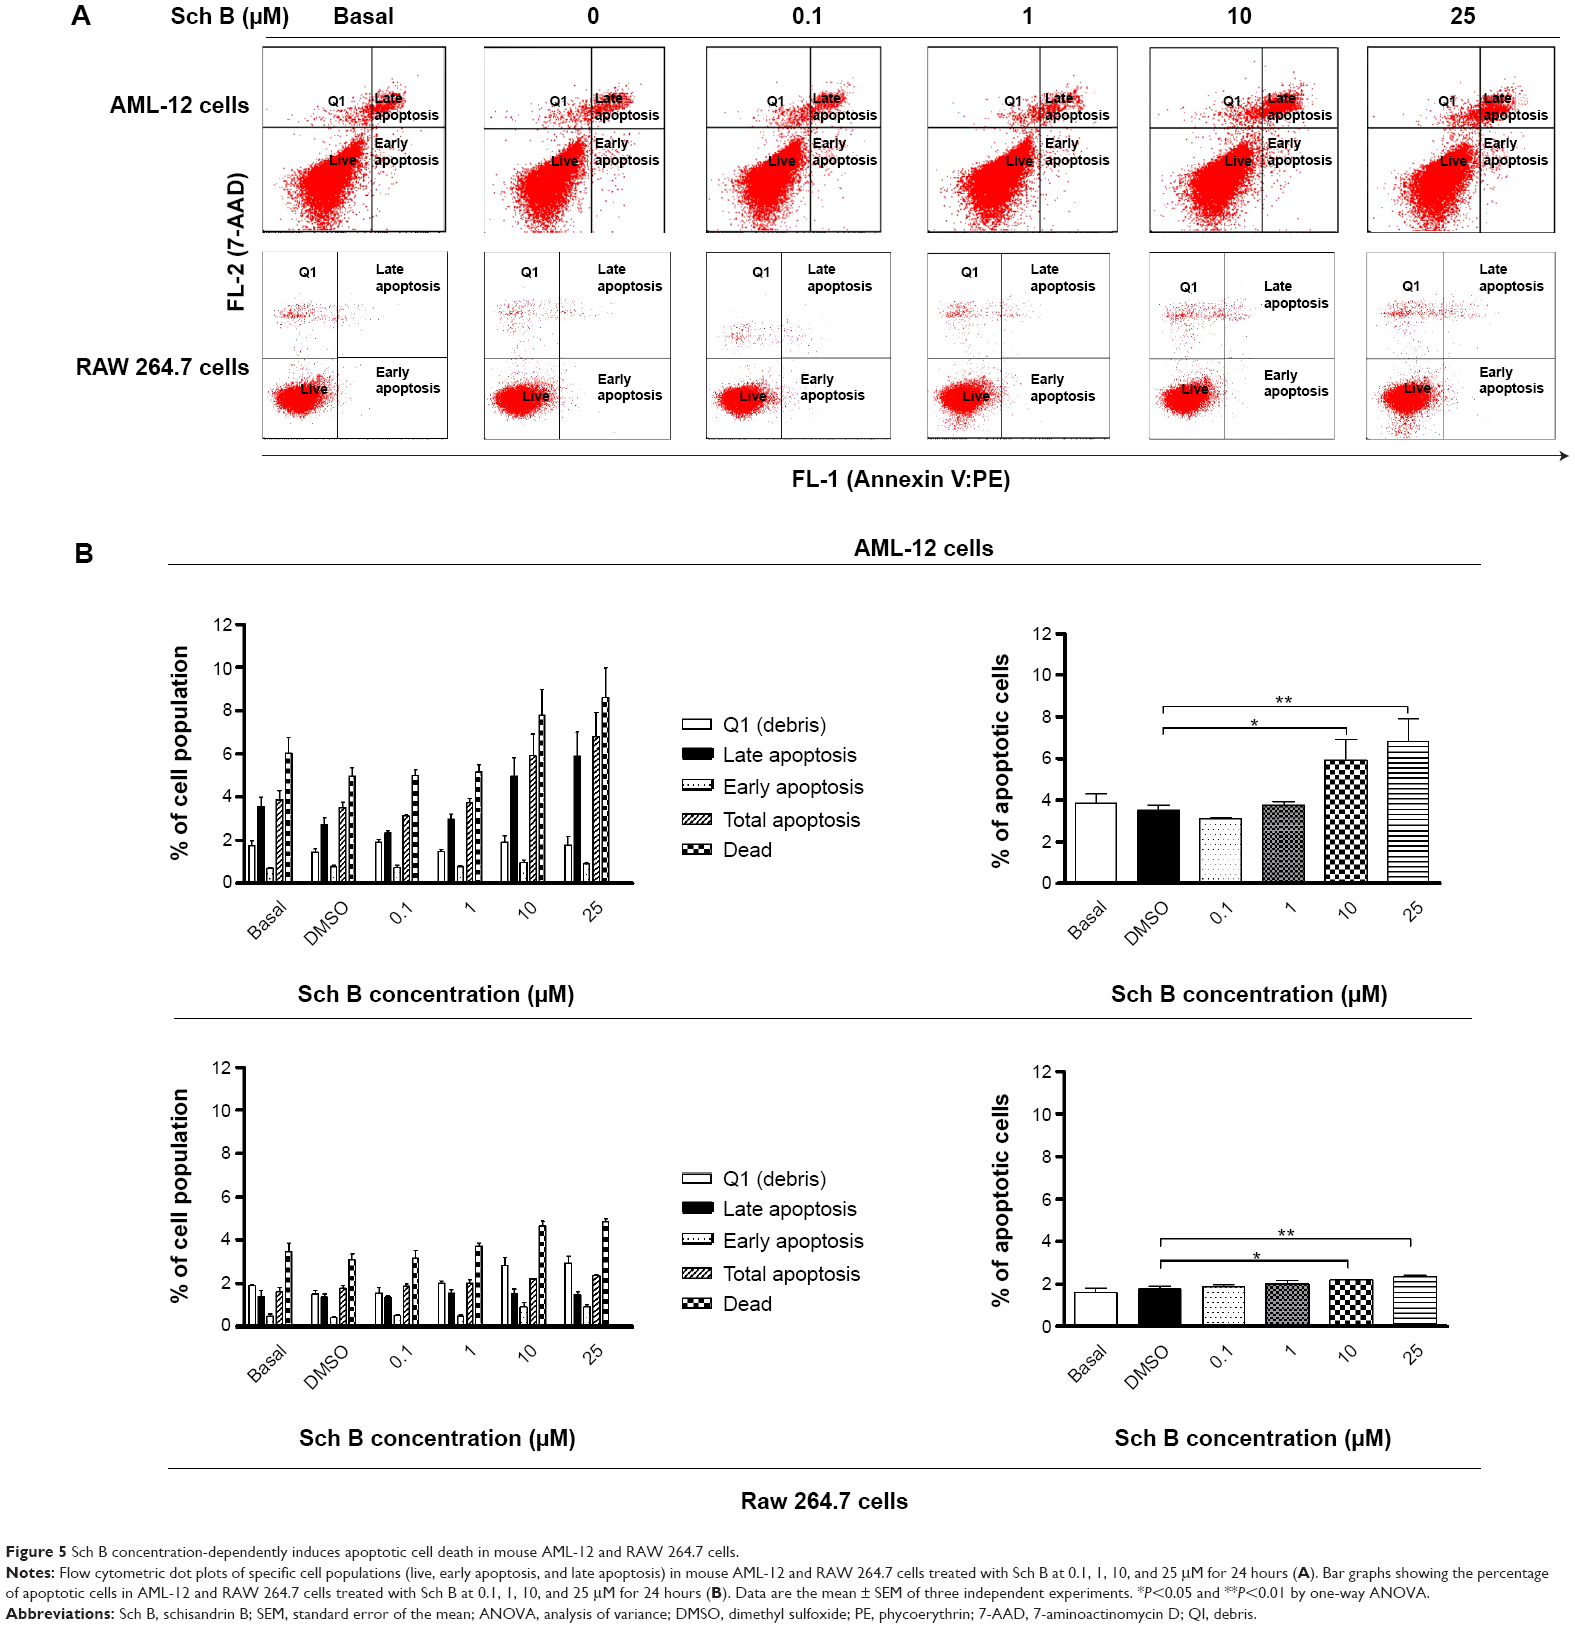 | Figure 5 Sch B concentration-dependently induces apoptotic cell death in mouse AML-12 and RAW 264.7 cells. |
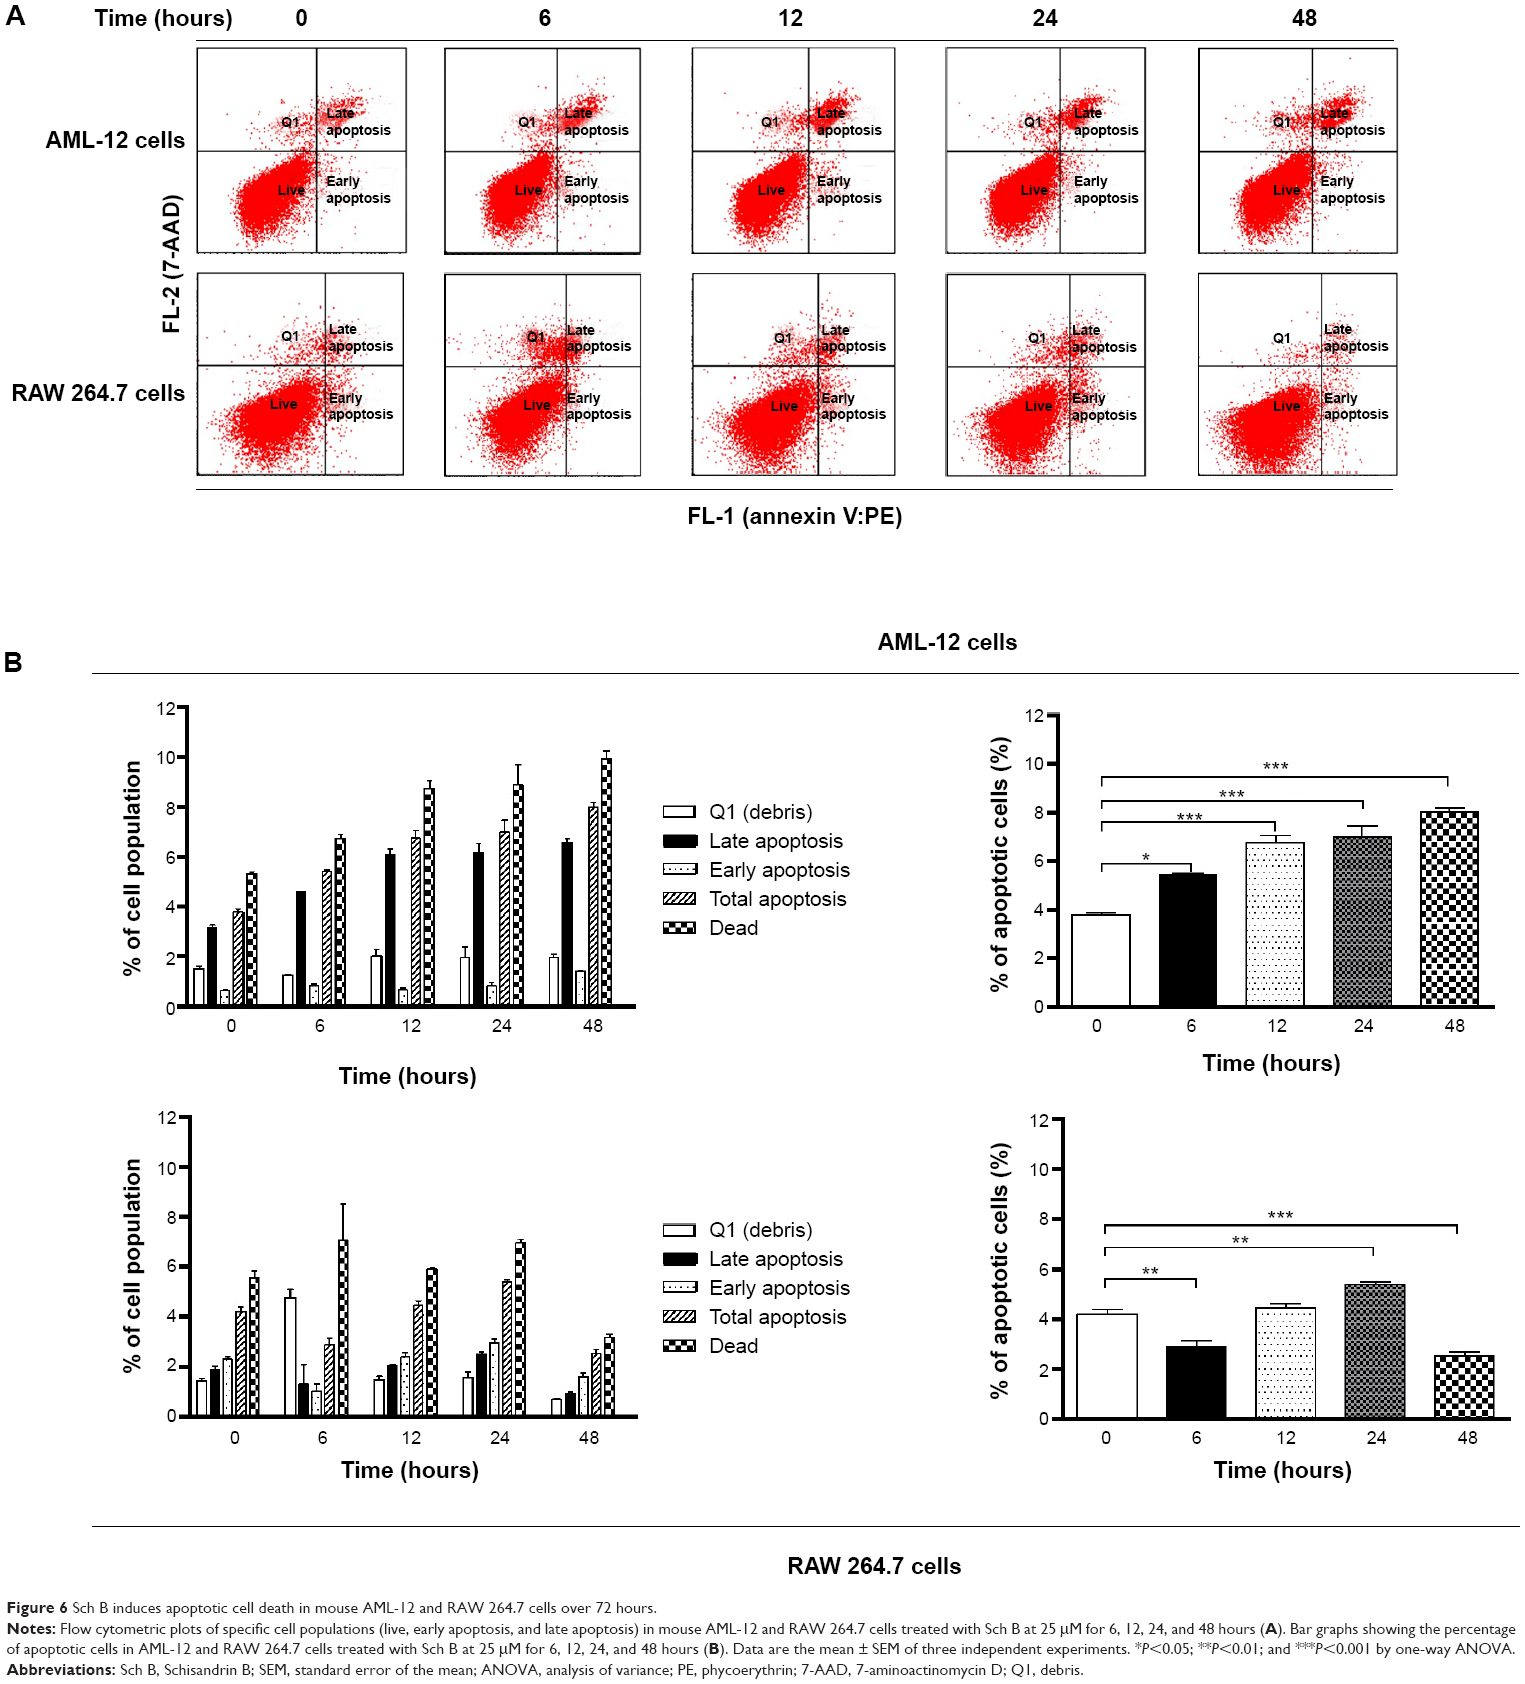 | Figure 6 Sch B induces apoptotic cell death in mouse AML-12 and RAW 264.7 cells over 72 hours. |
Since we had observed the pro-apoptotic effect of Sch B in AML-12 and RAW 264.7 cells, we further investigated the underlying mechanism for Sch B-induced apoptosis in AML-12 and RAW 264.7 cells. We evaluated the expression levels of Bcl-xl, Bcl-2, Bax, cytochrome c, cleaved PARP, and cleaved caspase 3 in these two cell lines treated with Sch B at 0.1, 1, 10, and 25 μM for 24 hours. We first examined the effects of Sch B on the expression levels of the pro-apoptotic protein Bax, the anti-apoptotic proteins Bcl-2 and Bcl-xl, and the Bax/Bcl-2 ratio by using Western blotting analysis. Treatment of AML-12 and RAW 264.7 cells with Sch B at 0.1, 1, 10, and 25 μM increased the expression level of Bax but decreased the expression level of Bcl-2, resulting in a significant decrease in Bax/Bcl-2 ratio in a concentration-dependent manner (Figure 7A and B). Incubation of AML-12 cells with Sch B at both 10 and 25 μM significantly increased the level of Bax by 66.4% and 81.4%, respectively (P<0.05 by one-way ANOVA; Figure 7A and B). In contrast, the expression level of Bcl-2 was reduced by 17.4%, 26.4%, and 23.3% when AML-12 cells were treated with Sch B at 1, 10, and 25 μM, respectively (P>0.05 by one-way ANOVA; Figure 7A and B). The ratio of Bcl-2/Bax was significantly decreased 39.3%, 42.0%, and 58.5% when AML-12 cells were treated with Sch B at 1, 10, and 25 μM, respectively (P<0.05 or P<0.01 by one-way ANOVA; Figure 7A and B). Similarly, exposure of RAW 264.7 cells to Sch B at 1, 10, and 25 μM significantly increased the expression level of Bax by 98.8%, 116.0%, and 160.7%, respectively, compared with control cells (P<0.05 or P<0.01 by one-way ANOVA; Figure 7A and C), but decreased the level of Bcl-2 by 19.7%, 54.9%, 45.6%, and 59.6%, after cells were treated with Sch B at 0.1, 1, 10, and 25 μM, respectively. The Bcl-2/Bax ratio in RAW 264.7 cells was significantly reduced 53.7%, 78.5%, 75.2%, and 84.4% when treated with Sch B at 0.1, 1, 10, and 25 μM, respectively (P<0.01 or P<0.001 by one-way ANOVA; Figure 7A and C). In AML-12 cells, the expression level of Bcl-xl was remarkably decreased by 38.6% and 53.3% when treated with Sch B at 10 and 25 μM, respectively (P<0.05 by one-way ANOVA; Figure 7A and B). In RAW 264.7 cells, the expression level of Bcl-xl was slightly decreased, without statistical significance, when treated with Sch B for 24 hours (P>0.05 by one-way ANOVA; Figure 7A and C).
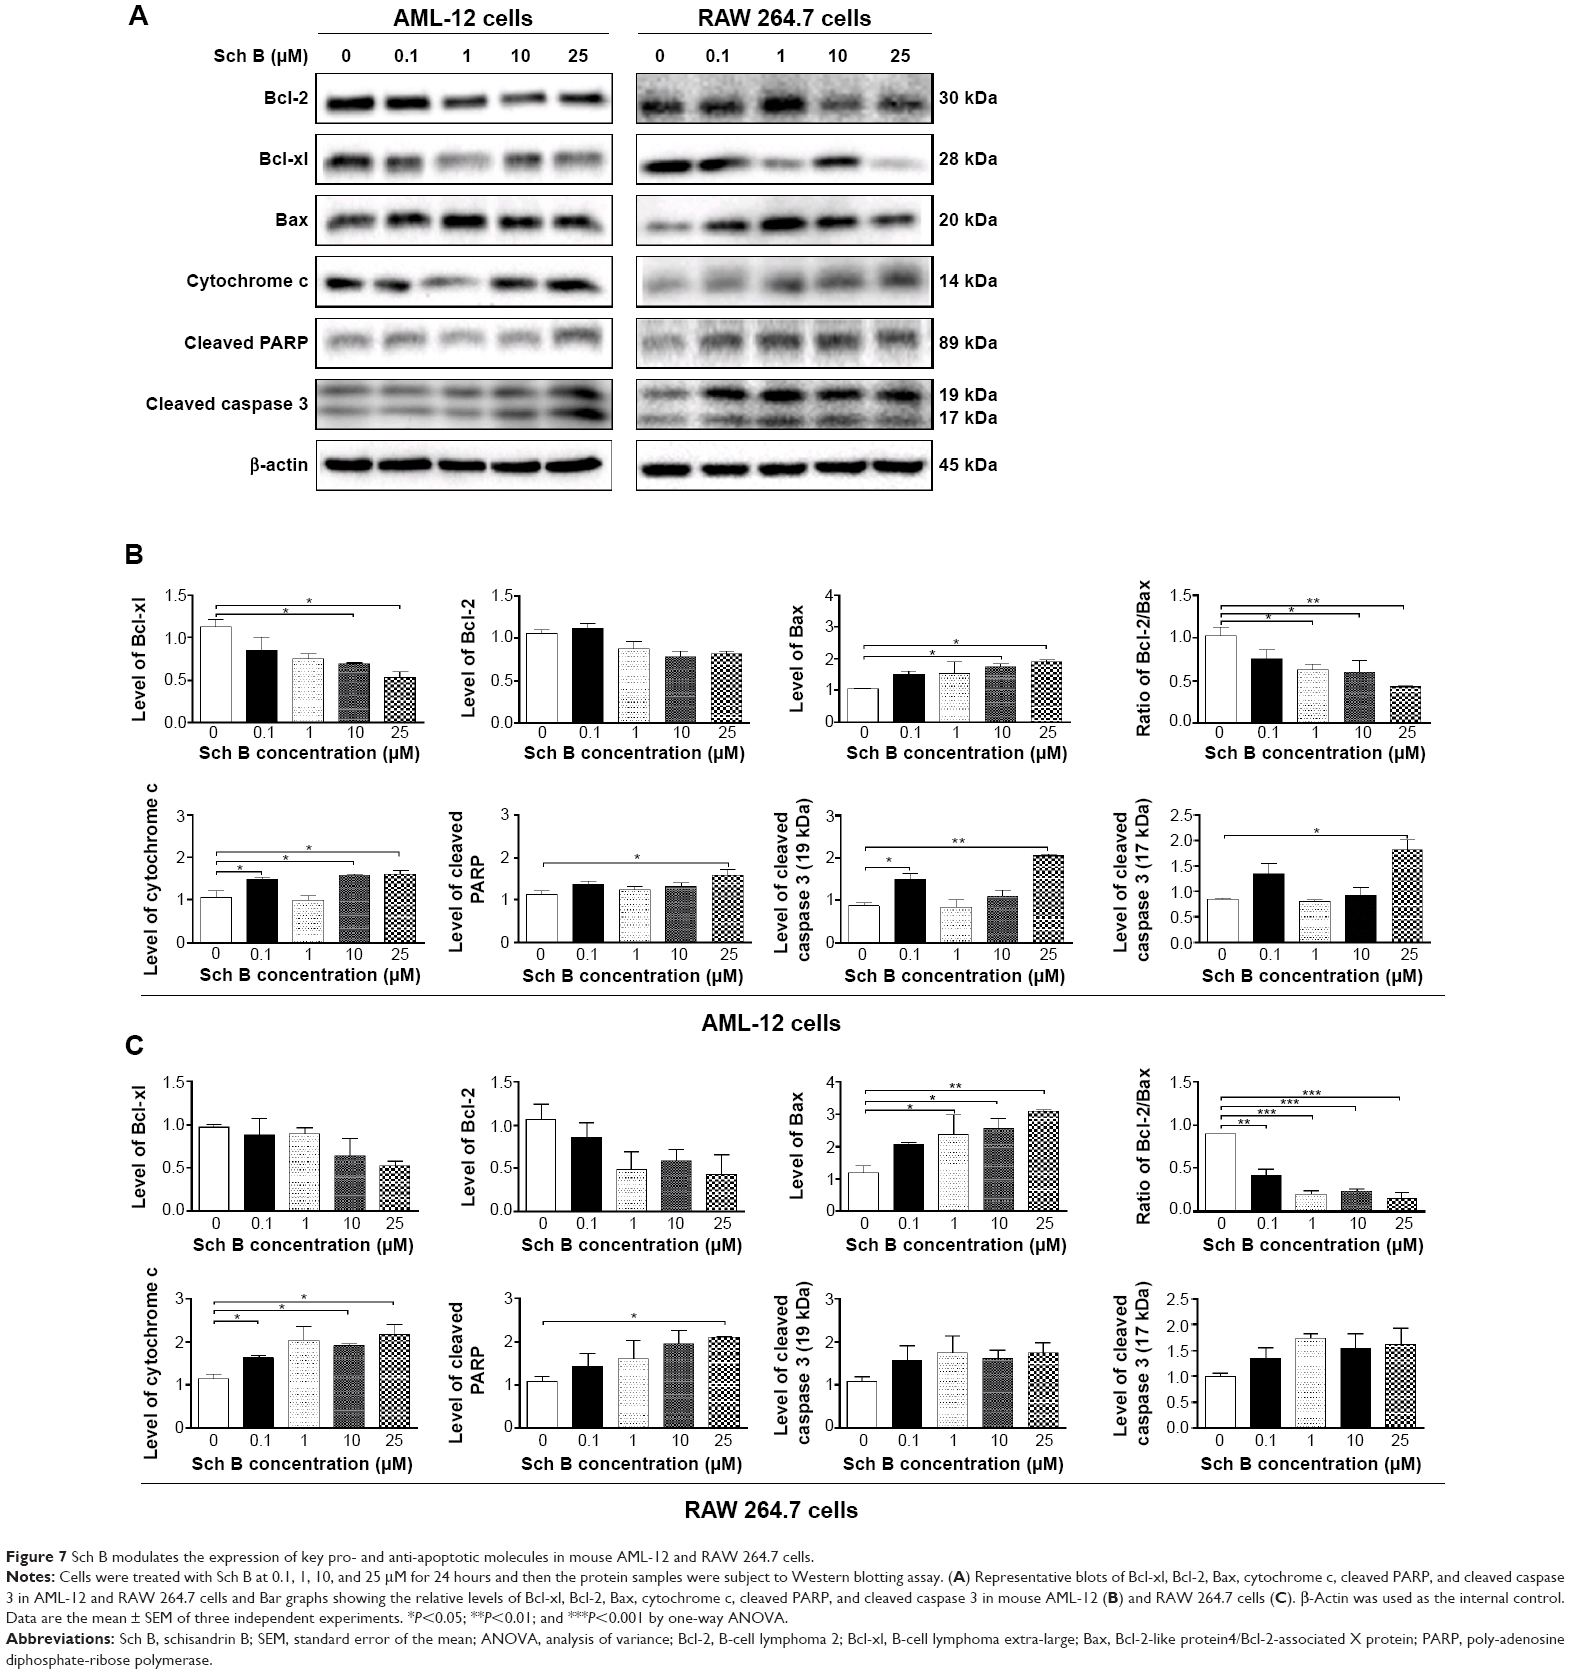 | Figure 7 Sch B modulates the expression of key pro- and anti-apoptotic molecules in mouse AML-12 and RAW 264.7 cells. |
We also evaluated the effect of Sch B on the release of cytochrome c from mitochondria to cytosol in both AML-12 and RAW 264.7 cells. Treatment of AML-12 and RAW 264.7 cells with Sch B significantly increased the release of cytochrome c from mitochondria to cytosol. Incubation of AML-12 cells with Sch B at 0.1, 10, and 25 μM markedly increased the cytosolic level of cytochrome c by 41.8%, 51.2%, and 53.7%, respectively (P<0.05 by one-way ANOVA; Figure 7A and B). In RAW 264.7 cells, treatment of cells with Sch B at 1, 10, and 25 μM markedly elevated the cytosolic level of cytochrome c by 78.4%, 66.0%, and 89.4%, respectively (P<0.05 by one-way ANOVA; Figure 7A and C). Subsequently, we observed a significant increase in the activation of cleaved caspase 3 and cleaved PARP in both AML-12 and RAW 264.7 cells (Figure 7). Incubation with 25 μM Sch B significantly elevated the level of cleaved PARP by 40.2% and 95.7% in AML-12 and RAW 264.7 cells, respectively, compared to the control cells (P<0.05 by one-way ANOVA; Figure 7). Treatment of Sch B at 0.1 and 25 μM also markedly increased the level of cleaved caspase 3 (17 kDa) by 71.1% and 133.4%, respectively, in AML-12 cells (P<0.05 and P<0.01, respectively, by one-way ANOVA; Figure 7A and B). Moreover, the level of cleaved caspase 3 (19 kDa) was significantly elevated by 117.0% when AML-12 cells were treated with Sch B at 25 μM (P<0.05 by one-way ANOVA; Figure 7A and B). Although the level of cleaved caspase 3 increased in RAW 264.7 cells, there was no significance with Sch B at any tested concentration (P>0.05 by one-way ANOVA; Figure 7A and C). These results indicate that Sch B induces remarkable activation of caspase 3 and PARP, and eventually leads to apoptotic death in AML-12 cells.
Sch B induces autophagy in AML-12 and RAW 264.7 cells with the involvement of PI3K/Akt/mTOR signaling pathway
Autophagy is a primary morphologically distinctive mode of programmed cell death, which is an important process involving the engulfment and degradation of non-essential or abnormal cellular organelles and proteins in living cells.31,32 To determine the effect of Sch B on autophagy, we determined autophagic AML-12 and RAW 264.7 cells using flow cytometric analysis. Treatment of AML-12 and RAW 264.7 cells with Sch B induced remarkable autophagic cell death (Figure 8A and B). In AML-12 cells, the percentage of autophagic cells at basal level was 7.3%; treatment with Sch B at 10 μM and 25 μM for 24 hours markedly increased the autophagy by 72.6% and 171.2%, respectively (P<0.05 or P<0.01 by one-way ANOVA; Figure 8A and B). In RAW 264.7 cells, the percentage of autophagic cells at basal level was 10.3%; incubation of the cells with 25 μM Sch B for 24 hours remarkably increased the autophagy by 67.6% (P<0.01 by one-way ANOVA; Figure 8A and B). Moreover, treatment of AML-12 and RAW 264.7 cells with rapamycin at 500 nM for 24 hours significantly elevated the autophagy by 158.0% and 161.3%, respectively (P<0.001 by one-way ANOVA; Figure 8A and B).
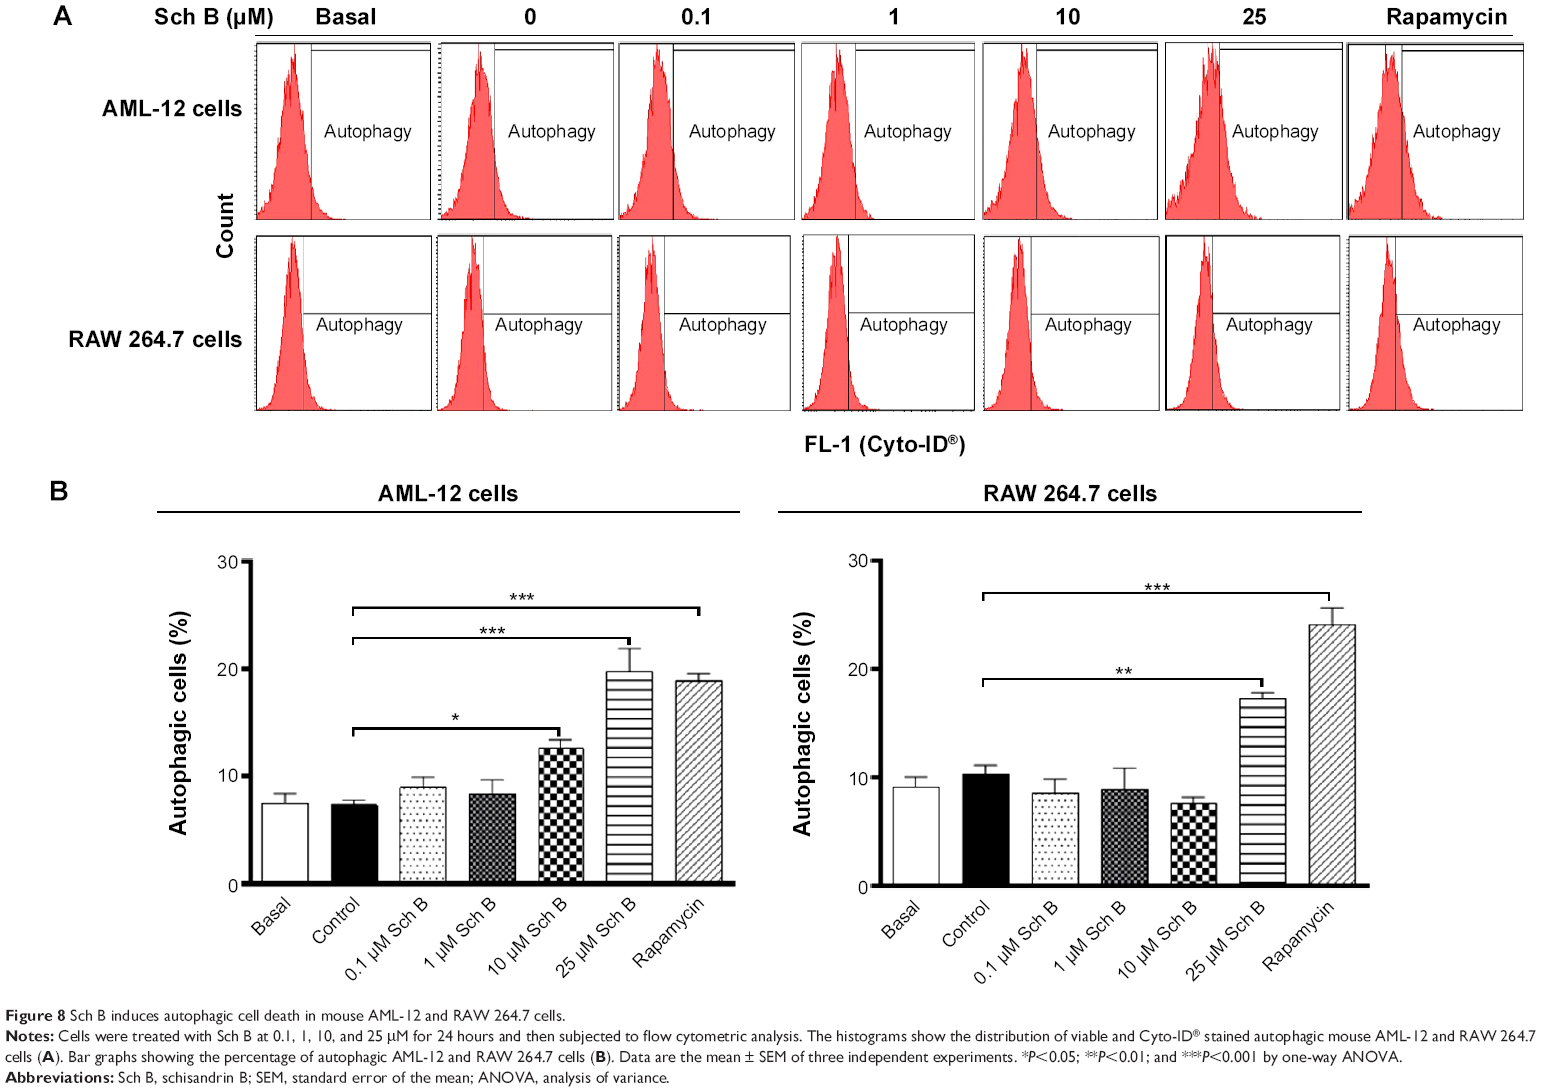 | Figure 8 Sch B induces autophagic cell death in mouse AML-12 and RAW 264.7 cells. |
Next, we examined the effect of Sch B on the expression level of PI3K class III, beclin 1, LC3-I, and LC3-II. As shown in Figures 9 and 10, treatment of AML-12 cells with Sch B at 25 μM markedly increased the expression level of PI3K class III by 139.5%, compared to the control cells (P<0.001 by one-way ANOVA). There were 38.9%, 140.6%, 100.8%, and 161.5% increases in the expression level of PI3K class III in RAW 264.7 cells treated with 0.1, 1, 10, and 25 μM Sch B for 24 hours, respectively (P<0.01 by one-way ANOVA; Figures 9 and 11). After 24 hours treatment with Sch B at 25 μM, the expression level of beclin 1 in AML-12 cells was increased 62.3%, compared to the control cells (P<0.01 by one-way ANOVA; Figures 9 and 10). In RAW 264.7 cells, treatment with Sch B at 1, 10, and 25 μM resulted in a 71.5%, 120.0%, and 169.2% increase in the expression of beclin 1, respectively (P<0.05 or P<0.01 by one-way ANOVA; Figures 9 and 11). Furthermore, in the present study, our Western blotting analysis revealed two clear bands of LC3-I and LC3-II in RAW 264.7 cells after Sch B treatment. However, only one distinct band of LC3-I could be detected in AML-12 cells (Figure 9). Compared to control cells, treatment of AML-12 cells with Sch B at 10 μM and 25 μM for 24 hours significantly increased the level of LC3-I by 73.6% and 96.2%, respectively (P<0.05 or P<0.01 by one-way ANOVA; Figures 9 and 10). In RAW 264.7 cells, the expression level of LC3-I was markedly increased by 81.2%, 89.2%, and 166.1%, respectively, when treated with Sch B at 0.1, 10, and 25 μM for 24 hours (P<0.05 or P<0.01 by one-way ANOVA; Figures 9 and 11). In addition, the level of LC3-II was significantly increased 3.8-, 4.8-, and 3.6-fold when RAW 264.7 cells were treated with Sch B at 0.1, 10, and 25 μM, respectively. Treatment of RAW 264.7 cells with Sch B at 0.1, 1, 10, and 25 μM increased the ratio of LC3-II/LC3-I, although the difference was not significant (P>0.05 by one-way ANOVA; Figures 9 and 11).
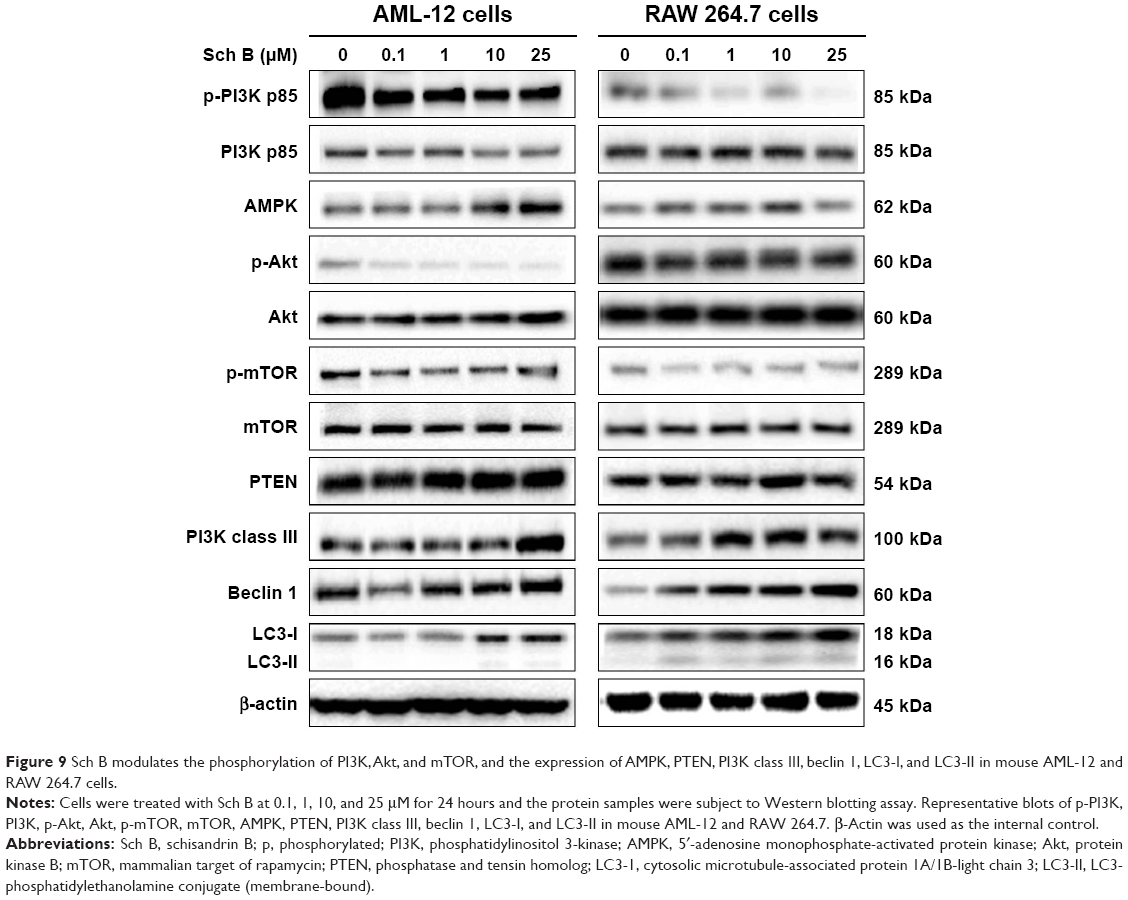 | Figure 9 Sch B modulates the phosphorylation of PI3K, Akt, and mTOR, and the expression of AMPK, PTEN, PI3K class III, beclin 1, LC3-I, and LC3-II in mouse AML-12 and RAW 264.7 cells. |
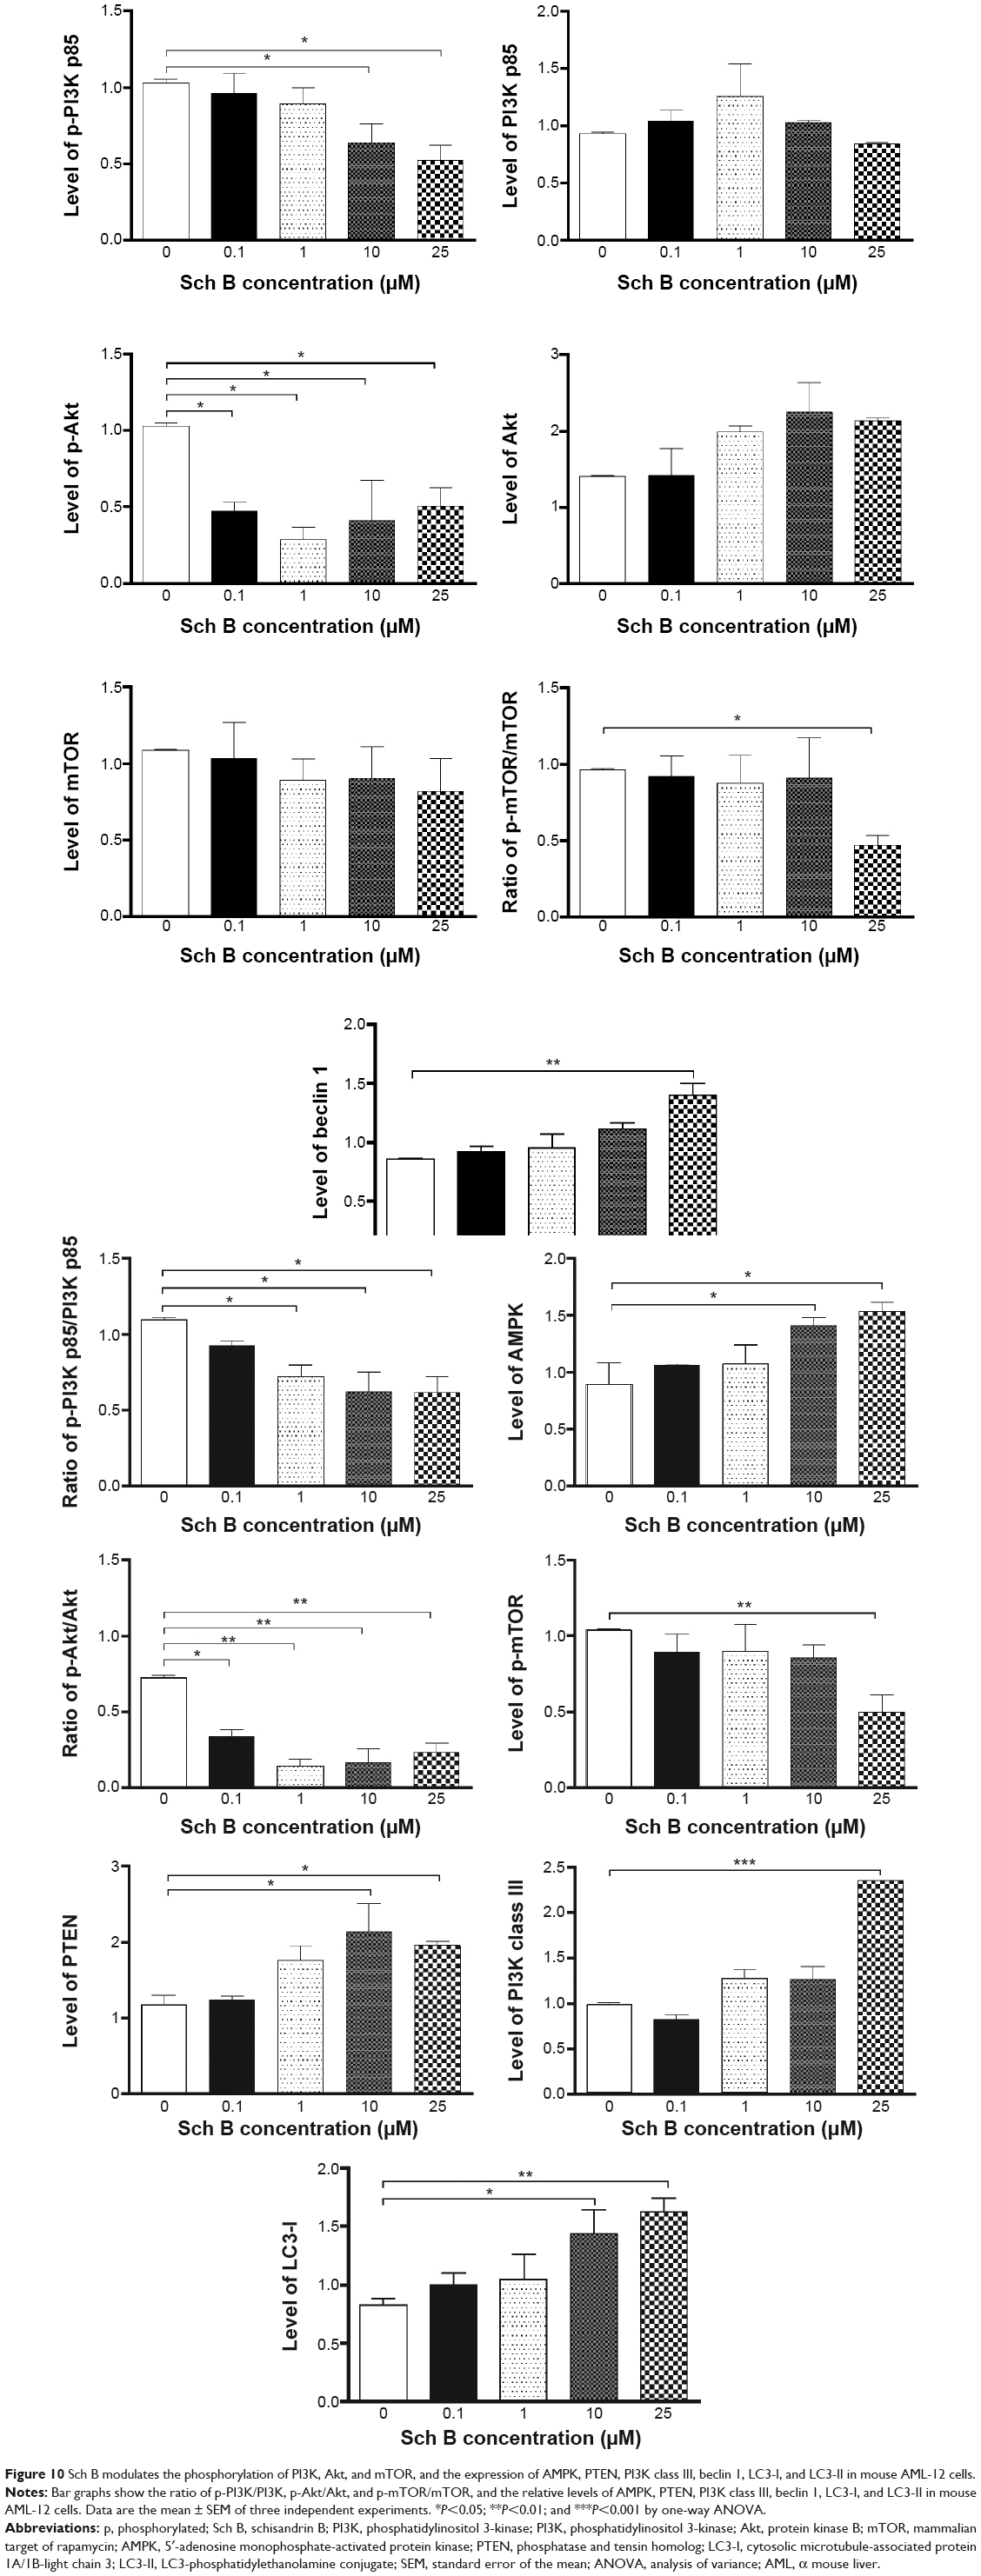 | Figure 10 Sch B modulates the phosphorylation of PI3K, Akt, and mTOR, and the expression of AMPK, PTEN, PI3K class III, beclin 1, LC3-I, and LC3-II in mouse AML-12 cells. |
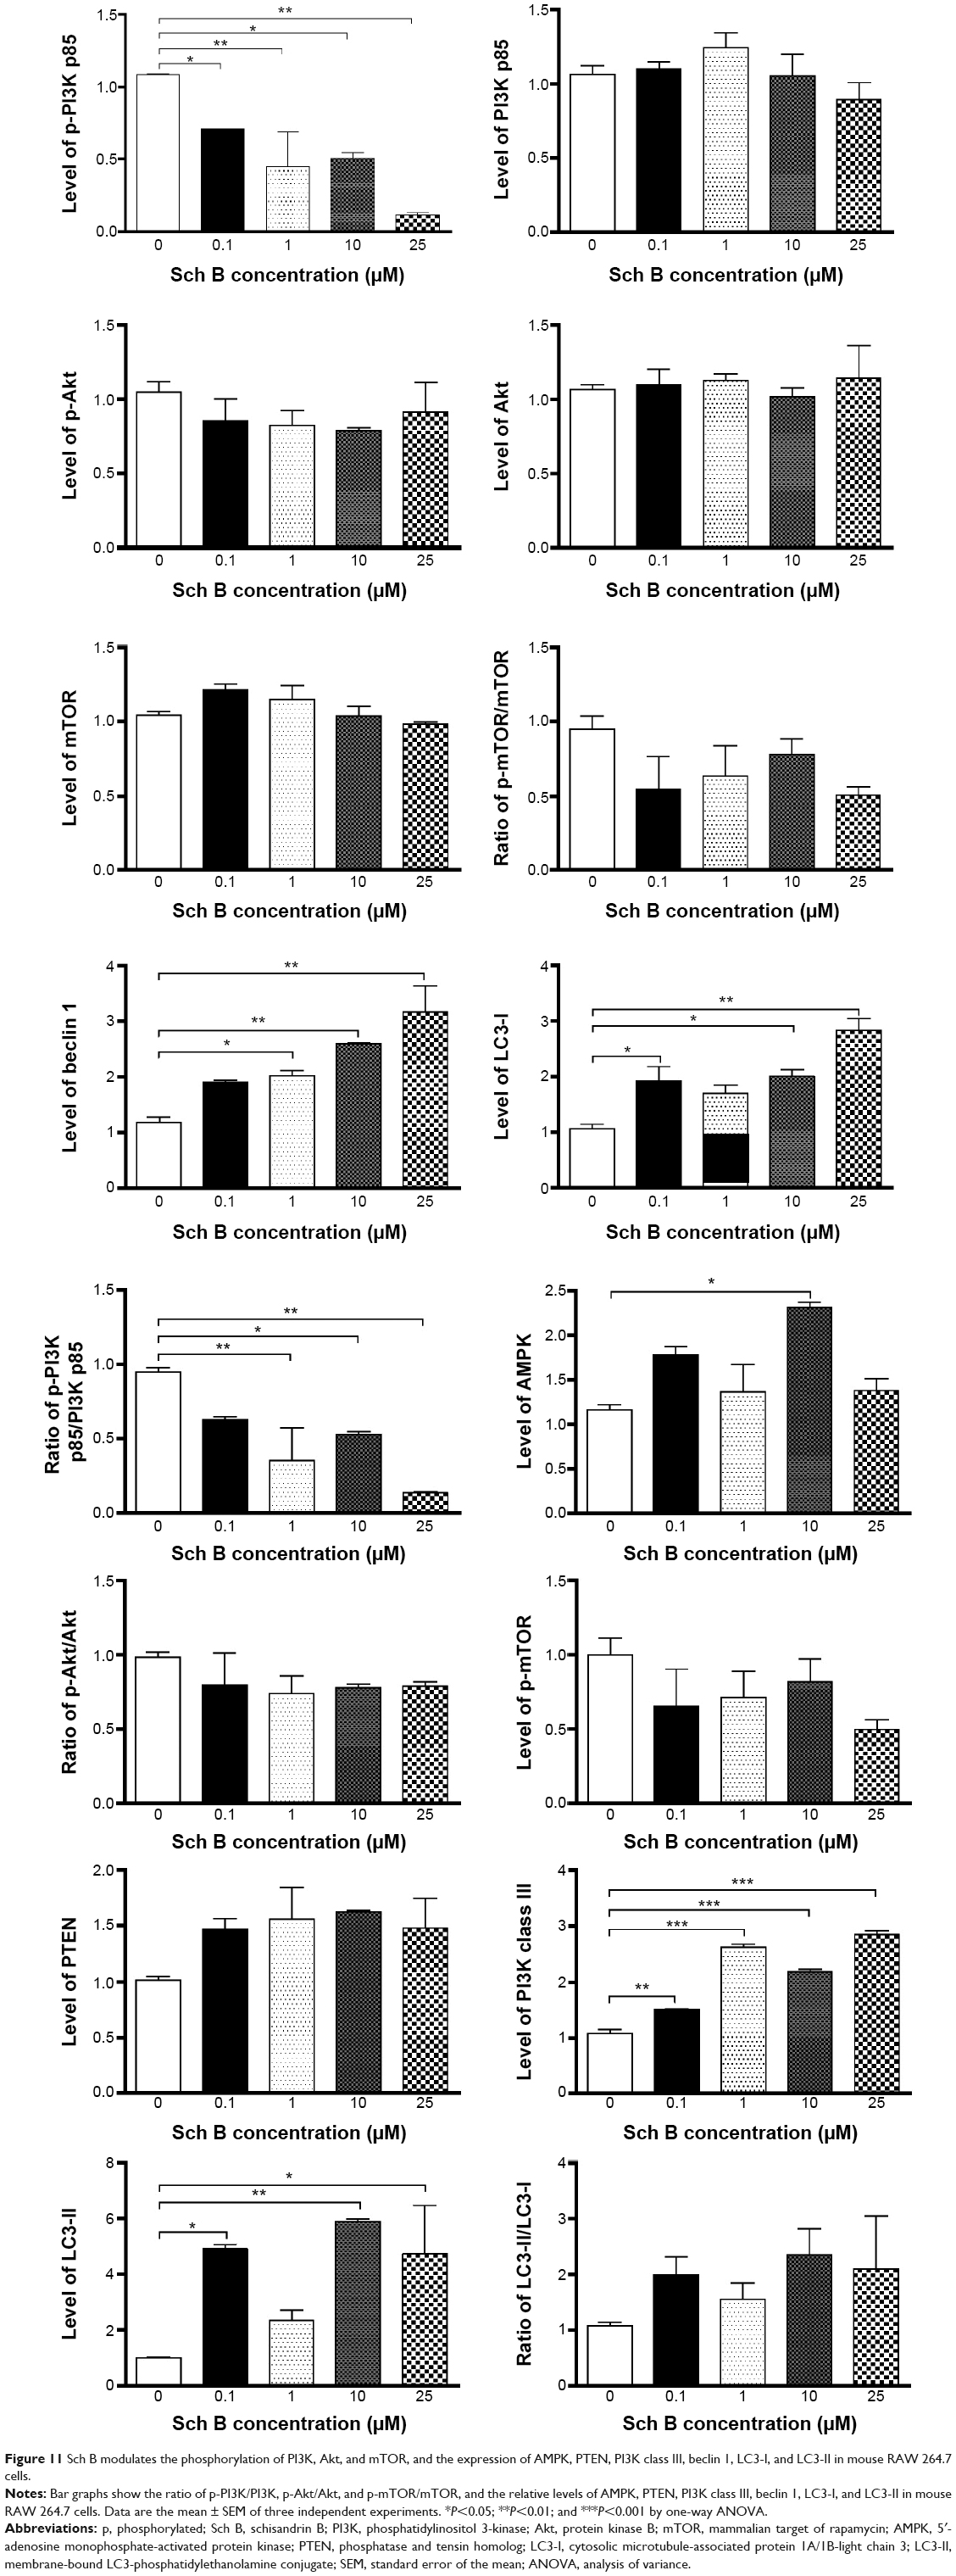 | Figure 11 Sch B modulates the phosphorylation of PI3K, Akt, and mTOR, and the expression of AMPK, PTEN, PI3K class III, beclin 1, LC3-I, and LC3-II in mouse RAW 264.7 cells. |
To further elucidate the effect of Sch B-induced autophagy in AML-12 and RAW 264.7 cells, we subsequently observed that Sch B treatment significantly decreased the phosphorylation of PI3K p85 at Tyr458 in both AML-12 and RAW 264.7 cells in a concentration-dependent manner (Figures 9–11). With increasing concentrations of Sch B, a decreasing level of p-PI3K at Tyr458 was observed in a concentration-dependent manner. Treating AML-12 cells with Sch B at 10 μM and 25 μM for 24 hours decreased the level of p-PI3K at Tyr458 by 38.2% and 49.4%, respectively (P<0.05 by one-way ANOVA; Figures 9 and 10), whereas exposure of AML-12 cells to Sch B did not significantly affect the expression of total PI3K. The p-PI3K/PI3K ratio was decreased from 1.10 at basal level to 0.72, 0.62, and 0.62, when AML-12 cells were treated with Sch B at 1, 10, and 25 μM, respectively (P<0.05 by one-way ANOVA; Figures 9 and 10). Similarly, incubation of RAW 264.7 cells with Sch B at 0.1, 1, 10, and 25 μM resulted in a 34.7%, 58.5%, 53.2%, and 89.2% reduction in the level of p-PI3K at Tyr458, respectively (P<0.05 by one-way ANOVA; Figures 9 and 11), whereas there was no significant alteration in the expression level of total PI3K. The p-PI3K/PI3K ratio was decreased from 0.95 at basal level to 0.35, 0.53, and 0.14 when RAW 264.7 cells were treated with Sch B at 1, 10, and 25 μM, respectively (P<0.05 or P<0.01 by one-way ANOVA; Figure 11). Moreover, the expression level of PTEN was significantly increased by 81.5% and 66.8% after AML-12 cells were treated with Sch B at 10 μM and 25 μM for 24 hours, respectively (P<0.05 by one-way ANOVA; Figures 9 and 10). Incubation of RAW 264.7 cells with Sch B at 0.1, 1, 10, and 25 μM increased the level of PTEN, but no significant change was observed when compared to the control cells (P>0.05 by one-way ANOVA; Figures 9 and 11). Furthermore, exposure of AML-12 cells to Sch B at 10 μM and 25 μM elevated the expression level of AMPK by 58.0% and 71.2%, respectively (P<0.05 by one-way ANOVA; Figures 9 and 10). Similarly, treatment of RAW 264.7 cells with Sch B at 10 μM markedly increased the level of AMPK by 89.3% (P<0.05 by one-way ANOVA; Figures 9 and 11).
We further investigated the activation of Akt after Sch B treatment. Incubation of AML-12 cells with Sch B for 24 hours significantly reduced the phosphorylation of Akt at Ser473 in a concentration-dependent manner. Treatment of AML-12 cells with Sch B at 0.1, 1, 10, and 25 μM markedly decreased the p-Akt levels by 54.4%, 72.2%, 60.0%, and 51.0%, respectively (P<0.05 by one-way ANOVA; Figures 9 and 10). However, exposure of RAW 264.7 cells to Sch B at 0.1 μM to 25 μM for 24 hours did not significantly alter the expression level of Akt, compared to the control cells (P>0.05 by one-way ANOVA; Figures 9 and 11). The ratio of p-Akt/Akt in AML-12 cells was significantly decreased from 0.73 at basal level to 0.34, 0.14, 0.17, and 0.24 when AML-12 cells were treated with Sch B at 0.1, 1, 10, and 25 μM, respectively (P<0.05 or P<0.01 by one-way ANOVA; Figures 9 and 10). Although treatment of RAW 264.7 cells with Sch B at 0.1, 1, 10, and 25 μM decreased the ratio of p-Akt/Akt, there was no significant difference compared to the control cells (P>0.05 by one-way ANOVA; Figure 11).
As showed in Figures 9 and 10, treatment of AML-12 cells with Sch B at 25 μM for 24 hours significantly decreased the phosphorylation of mTOR at Ser2448 by 52.2%, when compared to the control cells (P<0.01 by one-way ANOVA; Figures 9 and 10). However, there was no detectable change in total mTOR compared to control cells. The ratio of p-mTOR/mTOR was significantly decreased from 0.96 at basal level to 0.47 when AML-12 cells were treated with 25 μM Sch B for 24 hours (P<0.05 by one-way ANOVA; Figures 9 and 10). Treatment of RAW 264.7 cells with Sch B at 0.1, 1, 10, and 25 μM decreased the level of p-mTOR, but there was no significant difference in the ratio of p-mTOR/mTOR compared to the control cells (P>0.05 by one-way ANOVA; Figures 9 and 11). These results suggest that PI3K/Akt/mTOR signaling pathway is involved in Sch B-induced autophagy in AML-12 and RAW 264.7 cells.
Discussion
The liver is a central site for the metabolism of the majority of endogenous and exogenous agents, and it can detoxify the xenobiotics but also can metabolically activate toxic agents with the involvement of a number of Phase I and Phase II drug metabolizing enzymes.33,34 A reactive toxic agent may bind to cellular macromolecules, disrupting the cellular processes and leading to a toxic effect on hepatocytes, such as intracellular stress or mitochondrial impairment.35,36 Subsequently, the macrophages in the liver, such as Kupffer cells, can be stimulated and can promote the transcription of proinflammatory cytokines and chemokines, as well as production of reactive oxygen and nitrogen species, which induce further hepatic injury with substantial apoptosis and necrosis of hepatocytes.37 In the present study, we employed RAW 264.7 cells and AML-12 cells to test the effect of Sch B, with a focus on cell growth, cell cycle distribution, and programmed cell death. We observed that Sch B exhibited a potent inhibitory effect on the growth of these two cell lines, and that Sch B remarkably induced cell cycle arrest in G1 phase and promoted apoptotic and autophagic cell death in both AML-12 and RAW 264.7 cells.
Given the complex architecture of liver tissue, the interplay between two or more types of cell is a common phenomenon; in particular, the interaction between the hepatocytes and macrophages commonly occurs in the liver. Thus, reliable models are required to investigate the pathogenesis of xenobiotic-induced hepatotoxicity in vitro. Previous studies have shown that morphological features, phagocytic properties, or reactivity to external stimuli (eg, lipopolysaccharide) were similar in both RAW 264.7 macrophages and Kupffer cells.38–40 Therefore, in this study, RAW 264.7 cells were used as an in vitro experimental model mimicking Kupffer cells.
Cell cycle control is the major regulatory mechanism in the cell growth process. Many cytotoxic agents and DNA-damaging agents can arrest the cell cycle at the G0/G1, S, or G2/M phase, and then induce cell apoptosis.41,42 G1/S progression is highly regulated by cyclin D1, which combines with CDK4/6 and hyper-phosphorylates tumor suppressor retinoblastoma protein, leading to its dissociation from the E2F complex and permitting the transcription of key S phase-promoting genes.42 Loss of cyclin D1 can induce G1 phase arrest, and can lead to apoptosis in both tumoral and non-tumoral cells.43–45 Moreover, CDK2 regulates cell cycle G1/S transition and modulates cellular events in the S phase, such as DNA replication and centrosome duplication, in coordination with cyclin E/A.42 In addition, another key factor, PCNA, also plays an important role in the regulation of the cell cycle; PCNA coordinates cell cycle progression by interacting with several cell cycle-regulating proteins, such as cyclin–CDK complexes45,46 and p21 Cip1.47,48 In the present study, we found that Sch B remarkably arrested AML-12 and RAW 264.7 cells in G1 phase. We further explored the effect of Sch B on the key regulators in cell cycle checkpoints including CDK2, cyclin D1, E2F1, PCNA, and cyclin B1 in both cell lines. The CDK2–cyclin E, CDK4/6–cyclin D, and E2F complexes play pivotal roles in the regulation of the G1/S phase transition and mitosis.42 We observed a significant decrease in the expression level of cyclin D1 and CDK2 in AML-12 and RAW 264.7 cells treated with Sch B, which provides an explanation for the inducing effect of Sch B on G1 phase arrest in both cell lines. Furthermore, the decrease in the expression level of E2F1 induced by Sch B indicates a repression of E2F complex. Additionally, the level of PCNA was down-regulated by Sch B, linking PCNA to the cell cycle-regulating machinery in both cell lines. It is well known that the progression of cells from G2 to M phase is regulated by the activation of CDK1.49 However, the expression level of cyclin B1 was not significantly changed in AML-12 and RAW 264.7 cells in the present study. This may be attributed to the inducing effect of Sch B on cell cycle arrest in G1 phase, instead of G2 phase. As a proliferation inhibitor, p27 Kip1 blocks the progression of G1/S phase initiation by binding to and inhibiting the CDK2 activity.42,48 Chk1, which is widely known as a DNA damage checkpoint signaling protein, has been reported to induce G1 phase arrest by inhibition of Cdc25A activity.50,51 In our study, treatment of AML-12 and RAW 264.7 cells with Sch B markedly increased p27 Kip1 levels in a concentration-dependent manner, which probably contributes, at least in part, to the inhibitory effect of Sch B on cell proliferation and the inducing effect of Sch B on cell cycle arrest in AML-12 and RAW 264.7 cells. The expression level of Chk1 was concentration-dependently increased in AML-12 cells, but not in RAW 264.7 cells. This may be related to the DNA damage that partially inactivates this protein kinase in RAW 264.7 cells. Notably, the differential responses to the Sch B treatment in AML-12 and RAW 264.7 cells may be attributed to the differences between cell types. Taken together, these results indicate that Sch B promotes the expression of anti-proliferative regulators p27 Kip1 and Chk1, but inhibits the expression of pro-proliferative modulators CDK2, cyclin D1, PCNA, and E2F1, resulting in the G1 phase arrest in mouse liver and macrophage cells.
Apoptosis, a type I programmed cell death, is an active form of cell death, which is linked intimately with both physiological and pathological processes in a variety of cellular systems.52 The dysregulation of apoptosis is important in the pathogenesis of a wide range of liver diseases, including autoimmune disease, viral infections, tissue injury, and malignancy.52 Mitochondria, which play a key role in the process of apoptosis, frequently represent the main toxic target of many drugs.53 Dysfunction of this vital cell organelle results in impairment of energy metabolism and relevance of intracellular oxidant stress, which leads to irreversible injury and death of the affected cells. Bcl-2 family proteins have emerged as critical regulators of mitochondria-mediated apoptosis by functioning as either promoter (eg, Bax) or inhibitor (eg, Bcl-2 and Bcl-xl).52 Increases in the level of Bax and/or decreases in the level of Bcl-2 lead to the loss of mitochondrial membrane potential, which is a key event in the induction of apoptosis that causes the release of cytochrome c from mitochondria to cytosol.52 Cytochrome c, a key protein in electron transport, activates apoptotic protease activating factor-1, which triggers the activation of caspase 3 that will subsequently catalyze proteolytic cleavage of many key proteins, such as the PARP.54 In vitro studies have shown that Sch B induces apoptosis via the activation of the mitochondria-mediated intrinsic caspase pathway in different cancer cell lines.26,55 In our study, we found that treatment of AML-12 and RAW 264.7 cells with Sch B for 24 hours resulted in a marked decrease in the level of anti-apoptotic proteins Bcl-xl and Bcl-2, and simultaneously led to a remarkable increase in pro-apoptotic protein Bax. This alteration may be responsible for the concomitant execution phase of apoptosis, which includes the disruption of mitochondrial membrane potential and the release of cytochrome c to cytosol. Furthermore, this effect of Sch B leads to a remarkable activation of cleavage of caspase 3 and PARP. These data indicate that Sch B induces mitochondria-dependent apoptosis in mouse liver and macrophage cells.
Autophagy can be a survival response to stress stimuli, allowing the elimination of toxic metabolites, intracellular pathogens, and damaged proteins and organelles, and providing energy and amino acids necessary for vital functions during metabolic stress.56,57 Normal liver function requires hepatocellular basal autophagy, due to the high biosynthetic activity and the role of the liver in protein and carbohydrate storage.56 However, excessive autophagy may crumple the hepatocyte functions and induce cell death directly.56,57 Beclin 1 and LC3 are two specific markers of autophagy, and both of them are closely involved in autophagic processes.56,57 Beclin 1 has largely been characterized in the context of autophagy; it modulates the lipid kinase activity of PI3K class III catalytic unit vacuolar sorting protein 34, which generates phosphatidylinositol 3-phosphate, enabling the recruitment of a number of autophagy proteins involved in the nucleation of the autophagosome.56,57 LC3, a mammalian homologue of yeast autophagy-associated protein 8 (Atg8), has been used as a specific marker to monitor autophagy.56,57 LC3 proteins can be divided into two forms: LC3-I (18 kDa) and LC3-II (16 kDa). During autophagy, cytosolic LC3 (LC3-I) is conjugated to phosphatidylethanolamine to form LC3-II, which is recruited to autophagosomal membranes.56 Because the amount of LC3-II correlates with the number of autophagosomes, the level of LC3-II can be used as an autophagosomal marker to measure autophagic activity.56 In our study, we found that Sch B treatment concentration-dependently induced autophagy in AML-12 and RAW 264.7 cells. We also found that Sch B remarkably increased the expression of LC3-I and LC3-II, as well as the ratio of LC3-II over LC3-I in RAW 264.7 cells, but that Sch B concentration-dependently elevated the level of LC3-I in AML-12 cells only. Furthermore, there was a striking increase in the expression levels of beclin 1 and PI3K class III in both AML-12 and RAW 264.7 cells.
Furthermore, to understand the underlying mechanism for the autophagy-inducing effect of Sch B, we investigated the effect of Sch B on the classic PI3K/Akt/mTOR signaling pathway. mTOR is the catalytic subunit of two structurally and functionally distinct complexes, referred to as mTOR complex 1 (mTORC1) and mTOR complex 2.58 The major regulator of autophagy is mTORC1, which in the presence of nutrients and growth factors strongly inhibits the initiation of autophagy.59 mTORC1 inhibits autophagy directly via phosphorylation, and suppresses ULK1/Atg13/FIP200, a kinase complex critical for autophagy initiation and autophagosome formation.59 As an upstream positive regulator of mTOR, Akt inactivates tuberous sclerosis complex 2 by phosphorylating it on four residues; the resulting compound is a negative regulator of mTOR, thereby activating mTOR.60 In addition to Akt, one of the main mTOR regulators is AMPK, which also communicates directly with mTORC1 by phosphorylating raptor, leading to 14-3-3 binding and the allosteric inhibition of mTORC1.61 Moreover, PI3K is a heterodimeric protein containing an 85 kDa regulatory and a 110 kDa catalytic subunit.62 Active PI3K phosphorylates phosphatidylinositol (3,4)-bisphosphate (PIP2), converting it to phosphatidylinositol (3,4,5)-trisphosphate (PIP3), which recruits Akt and 3-phosphoinositide-dependent protein kinase 1 (PDK1) to the plasma membrane, enabling PDK1 to phosphorylate Akt at Ser308 and leading to the activation of Akt.58,60–62 PIP3 formation is negatively regulated by the well-known tumor suppressor PTEN, which converts PIP3 to PIP2 and has an ability to antagonize PI3K/Akt signaling.63 In the present study, Sch B significantly reduced the phosphorylation of PI3K at Tyr 458, Akt at Ser473, and mTOR at Ser2448 in both AML-12 and RAW 264.7 cells. However, the total PI3K, Akt, and mTOR were not significantly changed when AML-12 and RAW 264.7 cells were treated with Sch B. Furthermore, the expression levels of PTEN and AMPK were concentration-dependently increased. These results suggest that Sch B induces a down-regulation in the phosphorylation of PI3K, Akt, and mTOR, but induces an up-regulation of PTEN and AMPK, contributing to the autophagy-inducing effect of Sch B in mouse liver and macrophage cells.
In summary, the present study showed that Sch B inhibited cell proliferation, induced G1 phase arrest, activated the mitochondria-dependent apoptotic pathway, and promoted autophagy with the involvement of PI3K/Akt/mTOR signaling pathway in mouse liver and macrophage cells (Figure 12). These results demonstrate that Sch B may represent a remarkable cytotoxic agent at high concentration in vivo. However, the interplay between apoptosis and autophagy, and the contribution of autophagy to Sch B-induced cell death is still not clear. Therefore, more studies are needed to fully elucidate the crosstalk between apoptosis and autophagy, and to identify the targets and molecular mechanisms for Sch B-induced hepatotoxicity.
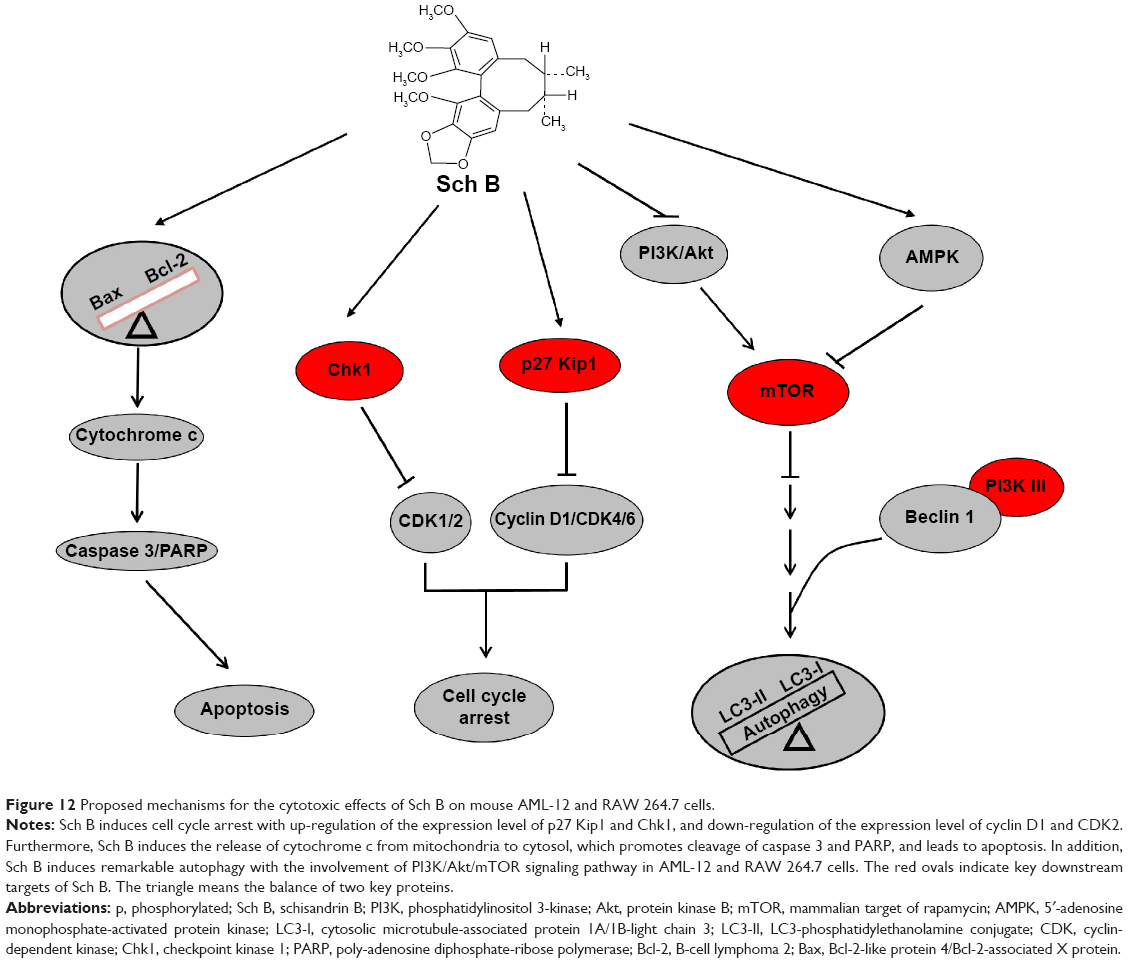 | Figure 12 Proposed mechanisms for the cytotoxic effects of Sch B on mouse AML-12 and RAW 264.7 cells. |
Acknowledgments
The authors appreciate the financial support from the Startup Fund of the College of Pharmacy, University of South Florida, Tampa, FL, USA. Dr Zhi-Wei Zhou is a holder of a postdoctoral scholarship from College of Pharmacy, University of South Florida, Tampa, Florida, USA. This work has also been supported by the National Natural Science Foundation of China (grant number 31071989).
Disclosure
The authors report no conflicts of interest in this work.
References
Navarro VJ, Senior JR. Drug-related hepatotoxicity. N Engl J Med. 2006;354(7):731–739. | ||
Stedman C. Herbal hepatotoxicity. Semin Liver Dis. 2002;22(2):195–206. | ||
Grant LM, Rockey DC. Drug-induced liver injury. Curr Opin Gastroenterol. 2012;28(3):198–202. | ||
Watkins PB, Seeff LB. Drug-induced liver injury: summary of a single topic clinical research conference. Hepatology. 2006;43(3):618–631. | ||
Peters TS. Do preclinical testing strategies help predict human hepatotoxic potentials? Toxicol Pathol. 2005;33(1):146–154. | ||
Suk KT, Kim DJ. Drug-induced liver injury: present and future. Clin Mol Hepatol. 2012;18(3):249–257. | ||
Ostapowicz G, Fontana RJ, Schiodt FV, et al; U.S. Acute Liver Failure Study Group. Results of a prospective study of acute liver failure at 17 tertiary care centers in the United States. Ann Intern Med. 2002;137(12):947–954. | ||
Zhao P, Wang C, Liu W, et al. Causes and outcomes of acute liver failure in China. PLoS One. 2013;8(11):e80991. | ||
Abboud G, Kaplowitz N. Drug-induced liver injury. Drug Saf. 2007; 30(4):277–294. | ||
Uetrecht J. Idiosyncratic drug reactions: current understanding. Annu Rev Pharmacol Toxicol. 2007;47:513–539. | ||
Bent S. Herbal medicine in the United States: review of efficacy, safety, and regulation: grand rounds at University of California, San Francisco Medical Center. J Gen Intern Med. 2008;23(6):854–859. | ||
Dunnick JK, Nyska A. The toxicity and pathology of selected dietary herbal medicines. Toxicol Pathol. 2013;41(2):374–386. | ||
Teschke R, Wolff A, Frenzel C, Schulze J, Eickhoff A. Herbal hepatotoxicity: a tabular compilation of reported cases. Liver Int. 2012;32(10):1543–1556. | ||
Navarro VJ, Barnhart H, Bonkovsky HL, et al. Liver injury from herbals and dietary supplements in the U.S. Drug-Induced Liver Injury Network. Hepatology. 2014;60(4):1399–1408. | ||
Zhou Y, Yang L, Liao Z, He X, Guo H. Epidemiology of drug-induced liver injury in China: a systematic analysis of the Chinese literature including 21,789 patients. Eur J Gastroenterol Hepatol. 2013;25(7):825–829. | ||
Saper RB, Phillips RS, Sehgal A, et al. Lead, mercury, and arsenic in US- and Indian-manufactured Ayurvedic medicines sold via the Internet. JAMA. 2008;300(8):915–923. | ||
Stickel F, Droz S, Patsenker E, Bögli-Stuber K, Aebi B, Leib SL. Severe hepatotoxicity following ingestion of Herbalife nutritional supplements contaminated with Bacillus subtilis. J Hepatol. 2009;50(1):111–117. | ||
Izzo AA, Ernst E. Interactions between herbal medicines and prescribed drugs: an updated systematic review. Drugs. 2009;69(13): 1777–1798. | ||
Zhu M, Yeung RY, Lin KF, Li RC. Improvement of phase I drug metabolism with Schisandra chinensis against CCl4 hepatotoxicity in a rat model. Planta Med. 2000;66(6):521–525. | ||
Wang O, Cheng Q, Liu J, et al. Hepatoprotective effect of Schisandra chinensis (Turcz.) Baill. lignans and its formula with Rubus idaeus on chronic alcohol-induced liver injury in mice. Food Funct. 2014; 5(11): 3018–3025. | ||
Zhang Y, Pan SY, Zhou SF, et al. Time and dose relationships between schisandrin B- and Schisandrae fructus oil-induced hepatotoxicity and the associated elevations in hepatic and serum triglyceride levels in mice. Drug Des Devel Ther. 2014;8:1429–1439. | ||
Pan SY, Jia H, Zhang Y, et al. Novel mouse model of combined hyperlipidemia associated with steatosis and liver injury by a single-dose intragastric administration of schisandrin B/cholesterol/bile salts mixture. J Pharmacol Sci. 2013;123(2):110–119. | ||
Pan SY, Dong H, Han YF, Li WY, Zhao XY, Ko KM. A novel experimental model of acute hypertriglyceridemia induced by schisandrin B. Eur J Pharmacol. 2006;537(1–3):200–204. | ||
Smejkal K, Slapetová T, Krmencˇík P, et al. Evaluation of cytotoxic activity of Schisandra chinensis lignans. Planta Med. 2010;76(15):1672–1677. | ||
Chyau CC, Ker YB, Chang CH, et al. Schisandra chinensis peptidoglycan-assisted transmembrane transport of lignans uniquely altered the pharmacokinetic and pharmacodynamic mechanisms in human HepG2 cell model. PLoS One. 2014;9(1):e85165. | ||
Xiang SS, Wang XA, Li HF, et al. Schisandrin B induces apoptosis and cell cycle arrest of gallbladder cancer cells. Molecules. 2014;19(9): 13235–13250. | ||
Ip SP, Poon MK, Wu SS, et al. Effect of schisandrin B on hepatic glutathione antioxidant system in mice: protection against carbon tetrachloride toxicity. Planta Med. 1995;61(5):398–401. | ||
Li YC, He SM, He ZM, et al. Plumbagin induces apoptotic and autophagic cell death through inhibition of the PI3K/Akt/mTOR pathway in human non-small cell lung cancer cells. Cancer Lett. 2014;344(2):239–259. | ||
Murray MM, Bui T, Smith M, et al. Staurosporine is chemoprotective by inducing G1 arrest in a Chk1- and pRb-dependent manner. Carcinogenesis. 2013;34(10):2244–2252. | ||
Shibutani ST, de la Cruz AF, Tran V, et al. Intrinsic negative cell cycle regulation provided by PIP box- and Cul4Cdt2-mediated destruction of E2f1 during S phase. Dev Cell. 2008;15(6):890–900. | ||
He C, Klionsky DJ. Regulation mechanisms and signaling pathways of autophagy. Annu Rev Genet. 2009;43:67–93. | ||
Boya P, Reggiori F, Codogno P. Emerging regulation and functions of autophagy. Nat Cell Biol. 2013;15(7):713–720. | ||
Zanger UM, Schwab M. Cytochrome P450 enzymes in drug metabolism: regulation of gene expression, enzyme activities, and impact of genetic variation. Pharmacol Ther. 2013;138(1):103–141. | ||
Zhou SF, Xue CC, Yu XQ, Wang G. Metabolic activation of herbal and dietary constituents and its clinical and toxicological implications: an update. Curr Drug Metab. 2007;8(6):526–553. | ||
Liu ZX, Kaplowitz N. Immune-mediated drug-induced liver disease. Clin Liver Dis. 2002;6(3):755–774. | ||
Kaplowitz N. Drug-induced liver injury. Clin Infect Dis. 2004;38 (Suppl 2):S44–S48. | ||
Gómez-Lechón MJ, Ponsoda X, Bort R, Castell JV. The use of cultured hepatocytes to investigate the metabolism of drugs and mechanisms of drug hepatotoxicity. Altern Lab Anim. 2001;29(3):225–231. | ||
Thakur V, Pritchard MT, McMullen MY, Nagy LE. Adiponectin normalizes LPS-stimulated TNF-α production by rat Kupffer cells after chronic ethanol feeding. Am J Physiol Gastrointest Liver Physiol. 2006;290(5):G998–G1007. | ||
Mandal P, Roychowdhury S, Park PH, Pratt BT, Roger T, Nagy LE. Adiponectin and heme oxygenase-1 suppress TLR4/MyD88-independent signaling in rat Kupffer cells and in mice after chronic ethanol exposure. J Immunol. 2010;185(8):4928–4937. | ||
Shen Z, Ajmo JM, Rogers CQ, et al. Role of SIRT1 in regulation of LPS- or two ethanol metabolite-induced TNF-α production in cultured macrophage cell lines. Am J Physiol Gastrointest Liver Physiol. 2009;296(5):G1047–G1053. | ||
Hengartner MO. The biochemistry of apoptosis. Nature. 2000;407(6805): 770–776. | ||
Bertoli C, Skotheim JM, de Bruin RA. Control of cell cycle transcription during G1 and S phases. Nat Rev Mol Cell Biol. 2013;14(8):518–528. | ||
Masamha CP, Benbrook DM. Cyclin D1 degradation is sufficient to induce G1 cell cycle arrest despite constitutive expression of cyclin E2 in ovarian cancer cells. Cancer Res. 2009;69(16):6565–6572. | ||
Choi YJ, Saez B, Anders L, et al. D-cyclins repress apoptosis in hematopoietic cells by controlling death receptor Fas and its ligand FasL. Dev Cell. 2014;30(3):255–267. | ||
Luo Y, Hurwitz J, Massague J. Cell-cycle inhibition by independent CDK and PCNA binding domains in p21Cip1. Nature. 1995;375(6527):159–161. | ||
Vermeulen K, Van Bockstaele DR, Berneman ZN. The cell cycle: a review of regulation, deregulation and therapeutic targets in cancer. Cell Prolif. 2003;36(3):131–149. | ||
Carreira S, Goodall J, Aksan I, et al. Mitf cooperates with Rb1 and activates p21Cip1 expression to regulate cell cycle progression. Nature. 2005;433(7027):764–769. | ||
Coqueret O. New roles for p21 and p27 cell-cycle inhibitors: a function for each cell compartment? Trends Cell Biol. 2003;13(2):65–70. | ||
O’Connell MJ, Walworth NC, Carr AM. The G2-phase DNA-damage checkpoint. Trends Cell Biol. 2000;10(7):296–303. | ||
Sørensen CS, Hansen LT, Dziegielewski J, et al. The cell-cycle checkpoint kinase Chk1 is required for mammalian homologous recombination repair. Nat Cell Biol. 2005;7(2):195–201. | ||
Reinhardt HC, Yaffe MB. Kinases that control the cell cycle in response to DNA damage: Chk1, Chk2, and MK2. Curr Opin Cell Biol. 2009; 21(2):245–255. | ||
Elmore S. Apoptosis: a review of programmed cell death. Toxicol Pathol. 2007;35(4):495–516. | ||
Wang C, Youle RJ. The role of mitochondria in apoptosis. Annu Rev Genet. 2009;43:95–118. | ||
Jiang X, Wang X. Cytochrome C-mediated apoptosis. Annu Rev Biochem. 2004;73:87–106. | ||
Li L, Lu Q, Shen Y, Hu X. Schisandrin B enhances doxorubicin-induced apoptosis of cancer cells but not normal cells. Biochem Pharmacol. 2006;71(5):584–595. | ||
Mizushima N. Autophagy: process and function. Genes Dev. 2007;21 (22):2861–2873. | ||
Codogno P. Shining light on autophagy. Nat Rev Mol Cell Biol. 2014;15(3):153. | ||
Jung CH, Ro SH, Cao J, Otto NM, Kim DH. mTOR regulation of autophagy. FEBS Lett. 2010;584(7):1287–1295. | ||
Li M, Khambu B, Zhang H, et al. Suppression of lysosome function induces autophagy via a feedback down-regulation of MTOR complex 1 (MTORC1) activity. J Biol Chem. 2013;288(50):35769–35780. | ||
Laplante M, Sabatini DM. mTOR signaling at a glance. J Cell Sci. 2009;122(Pt 20):3589–3594. | ||
Shang L, Wang X. AMPK and mTOR coordinate the regulation of Ulk1 and mammalian autophagy initiation. Autophagy. 2011;7(8):924–926. | ||
Yuan HX, Russell RC, Guan KL. Regulation of PIK3C3/VPS34 complexes by MTOR in nutrient stress-induced autophagy. Autophagy. 2013;9(12): 1983–1995. | ||
Carracedo A, Pandolfi PP. The PTEN-PI3K pathway: of feedbacks and cross-talks. Oncogene. 2008;27(41):5527–5541. |
 © 2015 The Author(s). This work is published and licensed by Dove Medical Press Limited. The full terms of this license are available at https://www.dovepress.com/terms.php and incorporate the Creative Commons Attribution - Non Commercial (unported, v3.0) License.
By accessing the work you hereby accept the Terms. Non-commercial uses of the work are permitted without any further permission from Dove Medical Press Limited, provided the work is properly attributed. For permission for commercial use of this work, please see paragraphs 4.2 and 5 of our Terms.
© 2015 The Author(s). This work is published and licensed by Dove Medical Press Limited. The full terms of this license are available at https://www.dovepress.com/terms.php and incorporate the Creative Commons Attribution - Non Commercial (unported, v3.0) License.
By accessing the work you hereby accept the Terms. Non-commercial uses of the work are permitted without any further permission from Dove Medical Press Limited, provided the work is properly attributed. For permission for commercial use of this work, please see paragraphs 4.2 and 5 of our Terms.