")
Back to Journals » International Journal of Nanomedicine » Volume 9 » Issue 1
Rapid and quantitative detection of C-reactive protein using quantum dots and immunochromatographic test strips
Authors Cheng X, Pu X, Jun P, Zhu X, Zhu D, Chen M
Received 22 September 2014
Accepted for publication 1 November 2014
Published 2 December 2014 Volume 2014:9(1) Pages 5619—5626
DOI https://doi.org/10.2147/IJN.S74751
Checked for plagiarism Yes
Review by Single anonymous peer review
Peer reviewer comments 3
Editor who approved publication: Dr Thomas Webster
Xianglin Cheng,1,* Xu Pu,2,* Pen Jun,3 XiaoBo Zhu,3 Di Zhu,4 Ming Chen1
1Department of Laboratory Medicine, First Affiliated Hospital of Yangtze University, Jingzhou, 2Department of Laboratory Medicine, RenMin Hospital of Wuhan University, Wuhan, 3Key Laboratory of Analytical Chemistry for Biology and Medicine (Ministry of Education), College of Chemistry and Molecular Sciences, Wuhan University, Wuhan, Hubei, People’s Republic of China; 4Department of Medical Oncology, Dana-Farber Cancer Institute, Harvard Medical School, Boston, MA, USA
*These authors contributed equally to this study and share first authorship
Background: Rapid immunochromatographic tests can detect disease markers in 10–15 minutes, which facilitates clinical diagnosis and treatment programs. However, most immunochromatographic tests employ gold nanoparticles as reporters, and these have only moderate sensitivity and act as qualitative methods for analyzing high biomarker concentrations.
Methods: In this study, we introduce quantum dots (QDs) as fluorescent probes and immunochromatographic strips to develop quantitative fluorescence point-of-care tests (QF-POCT) to analyze C-reactive protein (CRP) levels. Goat anti-rabbit IgG and rabbit IgG were used as control antibodies, and mouse monoclonal CRP antibody pairs were used for disease marker detection. One monoclonal CRP antibody was conjugated with QDs and served as a signal antibody, and the other monoclonal CRP antibody was dispensed onto the nitrocellulose membrane and served as a capturing antibody. In the presence of CRP, the fluorescence intensity of the monoclonal antibody-CRP-monoclonal antibody sandwich complex captured on the nitrocellulose membrane was determined using the fluorescence strip reader.
Results: QF-POCT assays could quantitatively analyze the concentration of CRP in 15 minutes had a detection limit of 0.25 mg/L, and had a wide detection linearity range (0.5–300 mg/L). The intra-assay and interassay coefficients of variation were 8.95% and 9.86% at 0.5 mg/L, 6.47% and 8.66% at 10 mg/L, and 6.81% and 9.10% at 60 mg/L, respectively. In a comparison between clinical samples, the results of this QD-based assay of CRP levels were significantly correlated with those of an Immulite 2000 assay (R=0.993, P<0.001).
Conclusion: Our results demonstrated that the QD-based immunochromatographic test is a rapid, sensitive, accurate, and quantitative method for the detection of disease biomarkers.
Keywords: C-reactive protein, immunochromatographic test, quantum dots, fluorescence point-of-care test
Introduction
The rapid and accurate detection of biomarkers, such as antigens and proteins, in body fluids is very important for clinical diagnosis and treatment programs.1–3 Immunological detection technology has improved rapidly in the past few decades, and a number of immunoassays are widely used in medicine, including radioimmunoassays, enzyme-linked immunosorbent assays, fluorescence immunoassays, immunoturbidimetric assays, and chemiluminescence immunoassays.4–6 However, most of these techniques require expensive instrumentation and an inflexible set of reagents.
Rapid immunochromatographic tests were developed in the 1980s, where clinical specimens are applied to a lateral flow strip containing antibodies against target antigens, and the presence or absence of the antigen is indicated by a color change on the test strip. These tests are simple to use, provide rapid results, and are referred to as point-of-care tests (POCTs).7 Most immunochromatographic tests use gold nanoparticles as reporters and can only provide qualitative results, but have good specificity and moderate sensitivity, and are generally used for analyzing moderate or high concentrations of analytes.8,9 A new fluorescence immunochromatographic assay has been developed that consists of an immunochromatographic strip and a laser fluorescence scanner to provide quantitative results.10 This assay employs organic fluorescent dyes, which have intrinsic limitations such as photobleaching, limiting its further applications.
Quantum dots (QDs) are semiconductors with optical characteristics that are closely related to the size and shape of the individual crystals. They have unique spectral properties such as broad excitation, narrow emission ranges, large absorption coefficients, strong emission intensity, size-tunable fluorescence emission, and excellent stability against photobleaching when compared with organic fluorescent dyes.11,12 QDs can be used for molecular labeling, cell, in vivo and in vitro imaging, and clinical laboratory diagnostics. QDs can also be employed as reporters in fluorescence immunochromatographic assays owing to their favorable optical properties. Li et al13 introduced QDs as fluorescent probes for immunochromatographic tests that can quantitatively detect nitrated ceruloplasmin. Yang et al14 developed a QD-based immunochromatography test for the detection of alpha fetoprotein.
C-reactive protein (CRP) is an acute-phase reactant that is synthesized by the liver and is used as a marker of inflammation. The serum CRP concentration can increase by up to 1,000-fold after infection, trauma, surgery, and other acute inflammatory events.15,16 Chronic inflammation is an important component in the development and progression of atherosclerosis, and increased serum CRP concentrations have been demonstrated to be independent predictors of future vascular events.17–19 However, the prospect of using CRP as a predictor of future vascular events requires high-sensitivity CRP methods. New-generation automated immunoturbidimetric and immunoluminometric assays have been developed and are commercially available.20,21 These new assays have improved the sensitivity and precision for low levels of CRP.22
In the present work, we introduce QDs as fluorescent probes and developed a fluorescence POCT assay (QF-POCT) that can rapidly, sensitively, and quantitatively analyze levels of CRP and high-sensitivity CRP.
Materials and methods
Materials
Goat anti-rabbit IgG and rabbit IgG were purchased from Abcam (Boston, MA, USA). Mouse monoclonal CRP antibody pairs, and CRP-free serum were obtained from HyTest (EuroCity, Finland). Standard human CRP was obtained from Sigma (Cambridge, MA, USA). QD-605 nanocrystals, QD-labeled goat-anti-rabbit antibody, succinimidyl trans-4-(N-maleimidylmethyl) cyclohexane-1-carboxylate (SMCC) stock solution, dithiothreitol stock solution, phosphate-buffered saline (0.01 M), bovine serum albumin, β-mercaptoethanol, Superdex 200 gel, and Tween-20 were obtained from JiaYuan QDs (Wuhan, People’s Republic of China). Absorbent pads, sample application pads, conjugation pads, backing cards, and nitrocellulose membranes were purchased from Millipore (Bedford, MA, USA).
A BioJet Quanti 3000 dispenser, LM5000 batch laminating system, and CM4000 guillotine cutting system were obtained from Biodot Ltd (Irvine, CA, USA). The portable fluorescence strip reader ESEQuant lateral flow system was purchased from Qiagen (Irvine, CA, USA). An Immulite 2000 immunoassay system was obtained from Siemens (Munich, Germany).
Preparation of QD/anti-CRP conjugate
The QD/anti-CRP conjugate was prepared according to the protocol of the QD conjugation kit supplied by the manufacturer (JiaYuan QDs). Briefly, 100 μL of QD-605 nanocrystals were first activated with 10 μL of 10 mM SMCC at 25°C for 60 minutes. The mixture was then subjected to a NAP-5 desalting column with the exchange buffer provided with the conjugation kit as the elution solvent. The colored eluate (~500 μL) was collected. At 25°C, 300 μL of anti-CRP with a concentration of 1 mg/mL was reduced with 20 mM dithiothreitol for 30 minutes. The resulting mixture was purified with a NAP-5 desalting column. The above two purified collections were mixed and allowed to react at 25°C for one hour to form the conjugation complex. Following the addition of 10 μL of β-mercaptoethanol, the conjugation reaction was quenched. The quenched reaction mixture was then concentrated to 20 μL using an ultrafiltration device run at 7,000 rpm for 10–15 minutes on a centrifuge. Superdex 200 gel was slowly packed into the column. The concentrated conjugation mixture was then pipetted into the size-exclusion column to purify the conjugated biocomplex. During the gravity elution, the first ten drops of colored conjugate were collected and diluted to 1 μM.
Fabrication of QD-based fluorescence immunochromatographic assay strips
Preparation of fluorescence immunochromatographic solution
The fluorescence immunochromatographic was prepared by diluting QD/anti-CRP conjugate and QD-labeled goat-anti-rabbit antibody with 10 mM phosphate-buffered saline and was then stored at 4°C until further use.
Preparation of sample application pads
The sample application pads were saturated with 10 mM phosphate-buffered saline (pH 7.4) containing 2.0% sucrose, 2.0% bovine serum albumin, and 0.05% Tween-20 for 15 minutes. They were then dried at room temperature for 24 hours. The pads were cut into 320×21 mm pieces and stored at room temperature.
Preparation of capturing antibody and control antibody
The other mouse monoclonal CRP antibody and rabbit IgG were diluted with 10 mM phosphate-buffered saline (pH 7.4) to 2 mg/mL and 0.5 mg/mL as the capturing antibody and control antibody, respectively. The capture antibody (test line) and control antibody (control line) were dispensed onto the nitrocellulose membrane using a BioJet Quanti 3000 dispenser.
Assembly
Absorbent pads, sample application pads, and nitrocellulose membranes were affixed on a 300×60 mm backing card, which was then cut into 4×60 mm strips and stored.
Sample assay procedure
First, 10 μL samples (standard samples or clinical serum) were added to the fluorescence immunochromatographic solution and mixed. Next, 75 μL mixed solution was applied to the sample pad for the reaction. After 6 minutes, the test strip was inserted into the portable fluorescence strip reader, the fluorescence intensity was estimated from QDs on the test line, control line, and baseline, and the fluorescence strip reader quantified the results. A schematic illustration of the QD-POCT assay procedure is shown in Figure 1A–E.
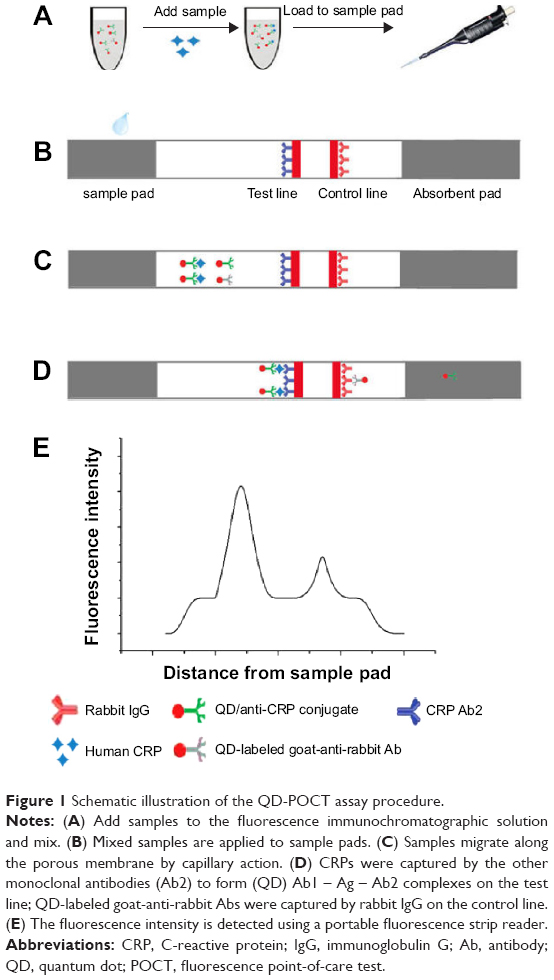 | Figure 1 Schematic illustration of the QD-POCT assay procedure. |
Method comparison
The samples for the calibration curve of the fluorescence POCT assay system were diluted with the standard human CRP solution. The limit of detection of the method was assessed by analyzing a zero calibrator 20 times and calculating the 2 SD (standard deviation) limit. Three different calibrator samples were used for the studies of precision. Each sample was run in duplicate on five different days, with ten runs per day, and the total imprecision was calculated.
To compare the assay systems, serum samples were obtained from patients at the First Affiliated Hospital of Yangtze University, People’s Republic of China, and stored at −80°C. They were collected from adult females and males aged 21–83 years. All participants provided signed informed consent forms, and the study was approved by the ethics committee of the First Affiliated Hospital of Yangtze University. The serum sample from each individual was run using Immulite 2000 and a fluorescence strip reader, and the CRP results were compared.
Results and discussion
Fluorescence imaging and raw readout values of the QD-POCT assay
Five different concentrations (0.5, 3, 20, 100, and 200 mg/L) of the human CRP standard samples were measured using the QF-POCT assay system. The fluorescent band could clearly be observed by ultraviolet excitation. The changes in fluorescent intensity of the test lines were associated with the concentration of CRP; in contrast, the fluorescence intensity of the control lines remained the same regardless of CRP concentration (Figure 2A–E). The fluorescence intensity readout curves of the portable fluorescence strip reader are shown in Figure 3. Supplementary Figure 1A–E shows the raw fluorescence intensity readout curves of the QD-POCT strips using portable fluorescence strip readers.
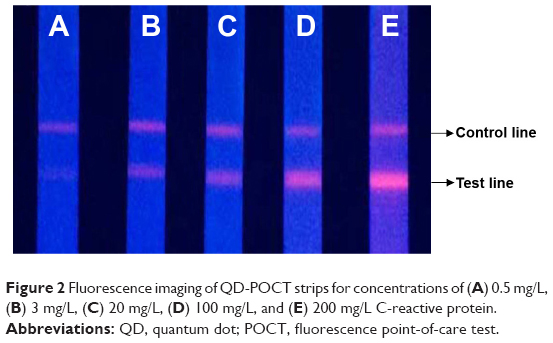 | Figure 2 Fluorescence imaging of QD-POCT strips for concentrations of (A) 0.5 mg/L, (B) 3 mg/L, (C) 20 mg/L, (D) 100 mg/L, and (E) 200 mg/L C-reactive protein. |
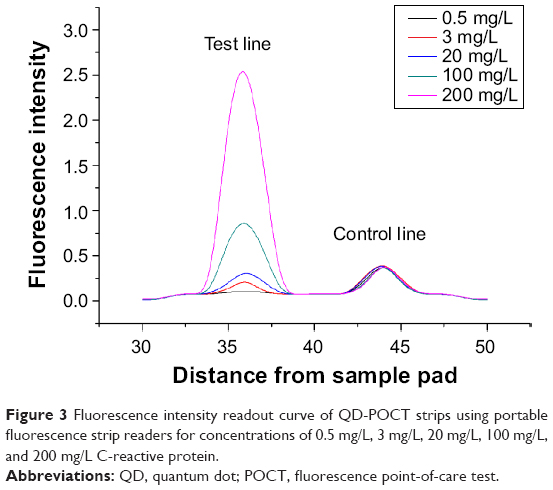 | Figure 3 Fluorescence intensity readout curve of QD-POCT strips using portable fluorescence strip readers for concentrations of 0.5 mg/L, 3 mg/L, 20 mg/L, 100 mg/L, and 200 mg/L C-reactive protein. |
Calibration curves and linearity of analytical results
We estimated the calibration curve with six different concentrations of standard CRP, from 0.5 to 300 mg/L, diluted in CRP-free serum. The calibration curve was obtained from log(T – B/C – B) (FL intensity of test lines – baseline/FL intensity of control lines – baseline) and logC (CRP concentration, mg/L) in the calibration samples. The log(T – B/C – B) values were plotted against logC. A reliable correlation coefficient (R2) was observed (R2 =0.9986), and a good linearity was displayed in the range of 0.5–300 mg/L (Figure 4).
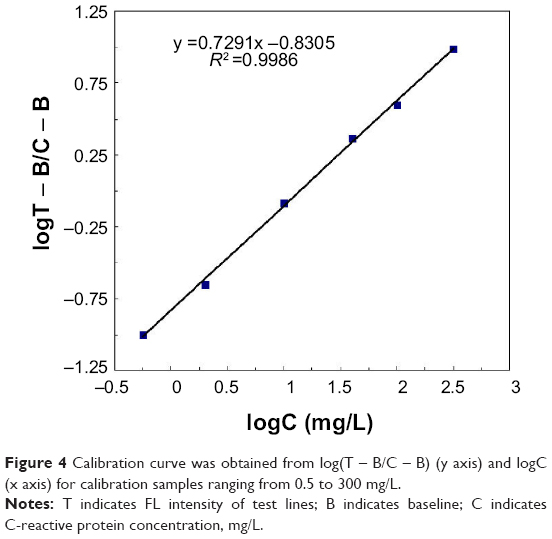 | Figure 4 Calibration curve was obtained from log(T – B/C – B) (y axis) and logC (x axis) for calibration samples ranging from 0.5 to 300 mg/L. |
Limit of detection
The limit of detection for each method was assessed by analyzing a zero calibrator 20 times. The mean value of T/C +2 SD was used for the calibration curve, and the lowest detection limit was observed for a concentration of 0.25 mg/L.
Imprecision and accuracy
We also evaluated the imprecision of the intraday (within day) and interday (between day) assays to determine the accuracy of the QF-POCT test. Duplicate tests were performed for low (0.5 mg/L), medium (10 mg/L), and high concentrations (60 mg/L) of human CRP standard samples. For each sample, the tests were repeated ten times per day for the intra-assay analysis, and performed on five sequential days with ten replicates for the interassay analysis. The intra-assay and interassay coefficients of variation in the QF-POCT assay were 8.95% and 9.86% at 0.5 mg/L, 6.47% and 8.66% at 10 mg/L, and 6.81% and 9.10% at 60 mg/L, respectively.
Recovery experiments were performed to assess the accuracy of the QF-POCT assay. The serum samples were spiked with three different concentrations of human CRP standard samples (2.89, 8.59, and 18.5 mg/L) for analysis. All of the recovery rates were within the range of 98.5%–104.6% and the average recovery rate was 101.3% (Table 1).
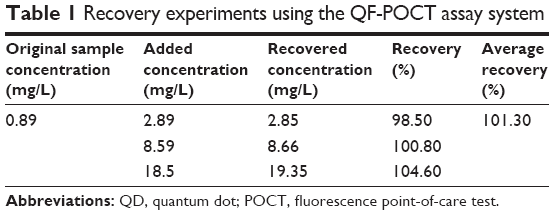 | Table 1 Recovery experiments using the QF-POCT assay system |
Clinical sample comparison
For the comparison between methods, 160 patient serum samples were analyzed by the automated assay (Immulite 2000) and the QF-POCT assay (Figure 5). The CRP values estimated using the new QD-based assay were significantly correlated with those using the Immulite 2000 assay (R2 =0.993, P<0.001). The Immulite 2000 method has been approved by the US Food and Drug Administration for clinical use and is consistent with other immunoturbidimetric and immunoluminometric assays. Thus, these results suggest that the QF-POCT assay system for CRP levels has a good performance compared with other widely used automated assay systems.
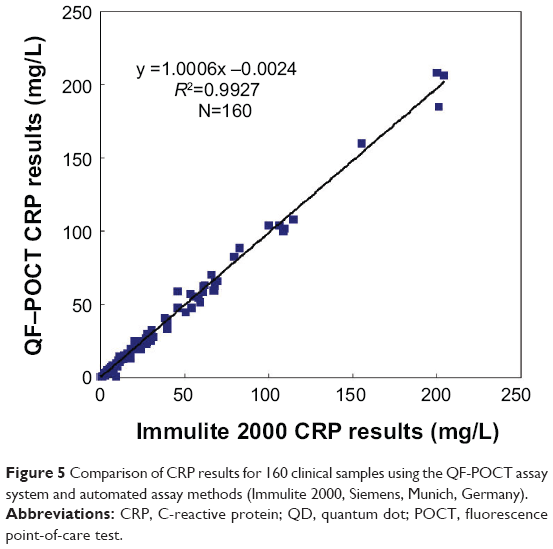 | Figure 5 Comparison of CRP results for 160 clinical samples using the QF-POCT assay system and automated assay methods (Immulite 2000, Siemens, Munich, Germany). |
Interference experiments
The human standard CRP was diluted to 40 mg/L and various interferents (bilirubin, triglycerides, and hemoglobin) were added to the fluorescence immunochromatographic solution. For each sample, the tests were repeated 20 times. The results showed that the QF-POCT assay has good specificity, and the interferent did not influence the test results (Table 2).
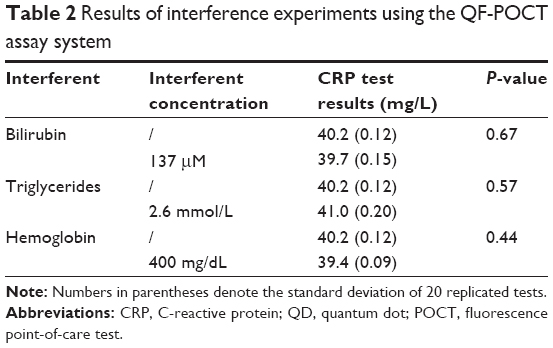 | Table 2 Results of interference experiments using the QF-POCT assay system |
Conclusion
In summary, we successfully developed a QF-POCT assay system based on an immunochromatographic strip and fluorescent probe for the rapid, sensitive, and quantitative detection of CRP. This QF-POCT assay system takes advantage of the low cost and speed of conventional immunochromatographic strips as well as the high sensitivity and photostability of QD-based fluorescent immunoassays. This assay system performed well compared with other automated assay methods and appeared to be well suited as a POCT platform for determination of CRP concentrations in clinical samples. The QF-POCT assay system had the lowest detection limit at 0.25 mg/L and good linearity in the range of 0.5–300 mg/L, indicating that this assay can be used for risk assessment of cardiovascular diseases and detection of acute inflammatory events.
Disclosure
The authors report no conflicts of interest in this work.
References
Firestein GS. A biomarker by any other name. Nat Clin Pract Rheumatol. 2006;2(12):635–638. | ||
Nwankire CE, Czugala M, Burger R, et al. A portable centrifugal analyser for liver function screening. Biosens Bioelectron. 2014;56(1):352–358. | ||
You DJ, Park TS, Yoon JY. Cell-phone-based measurement of TSH using Mie scatter optimized lateral flow assays. Biosens Bioelectron. 2013;40(1):180–185. | ||
Liang AH, Huang YJ, Jiang ZL. A rapid and sensitive immunoresonance scattering spectral assay for microalbumin. Clin Chim Acta. 2007;383(1–2):73–77. | ||
Gosling JP. A decade of development in immunoassay methodology. Clin Chem. 1990;36(3):1408–1427. | ||
Von Lode P. Point-of-care immunotesting: approaching the analytical performance of central laboratory methods. Clin Biochem. 2005;38(7):591–606. | ||
Ming C, Wei X, Biao A, et al. Sensitivity assessment of rapid influenza diagnostic tests for the detection of the 2009 pandemic influenza a (H1N1) virus in clinical specimens. LabMedicine. 2010;41(12):731–734. | ||
Zhu J, Zou N, Zhu D, et al. Simultaneous detection of high-sensitivity cardiac troponin I and myoglobin by modified sandwich lateral flow immunoassay: proof of principle. Clin Chem. 2011;57(12):1732–1738. | ||
Gordon J, Michel G. Analytical sensitivity limits for lateral flow immunoassays. Clin Chem. 2008;54(10):1250–1251. | ||
Oh SW, Kim YM, Kim HJ, et al. Point-of-care fluorescence immunoassay for prostate specific antigen. Clin Chim Acta. 2009;406(1–2):18–22. | ||
Alivisatos AP. Semiconductor clusters, nanocrystals, and quantum dots. Science. 1996;271(5251):933–997. | ||
Kilina S, Velizhanin KA, Ivanov S. Surface ligands increase photoexcitation relaxation rates in CdSe quantum dots. ACS Nano. 2012;6(7):6515–6524. | ||
Li Z, Wang Y, Wang J, et al. Rapid and sensitive detection of protein biomarker using a portable fluorescence biosensor based on quantum dots and a lateral flow test strip. Anal Chem. 2010;82(16):7008–7014. | ||
Yang Q, Gong X, Song T, et al. Quantum dot-based immunochromatography test strip for rapid, quantitative and sensitive detection of alpha fetoprotein. Biosens Bioelectron. 2011;30(1):145–150. | ||
Tulek B, Koylu H, Kanat F, Arslan U, Ozer F. Serum C-reactive protein and procalcitonin levels in non-small cell lung cancer patients. Contemp Oncol (Pozn). 2013;17(1):68–72. | ||
Ramamoorthy RD, Nallasamy V, Reddy R, Esther N, Maruthappan Y. A review of C-reactive protein: a diagnostic indicator in periodontal medicine. J Pharm Bioallied Sci. 2012;4 Suppl 2:422–426. | ||
Ridker PM, Danielson E, Fonseca FA, et al. Rosuvastatin to prevent vascular events in men and women with elevated C-reactive protein. N Engl J Med. 2008;359(21):2195–2207. | ||
Emsley HC, Tyrrell PJ. Inflammation and infection in clinical stroke. J Cereb Blood Flow Metab. 2002;22(4):1399–1419. | ||
Ridker PM, Rifai N, Rose L, et al. Comparison of C-reactive protein and low-density lipoprotein cholesterol levels in the prediction of first cardiovascular events. N Engl J Med. 2002;347(20):1557–1565. | ||
Roberts WL, Sedrick R, Moulton L, et al. Evaluation of four automated high-sensitivity C-reactive protein methods: implications for clinical and epidemiological applications. Clin Chem. 2000;46(4):461–468. | ||
Roberts WL, Moulton L, Law TC, et al. Evaluation of nine automated high-sensitivity C-reactive protein methods: implications for clinical and epidemiological applications. Part 2. Clin Chem. 2001;47(3):418–425. | ||
Ahn JS, Choi S, Jang SH, et al. Development of a point-of-care assay system for high-sensitivity C-reactive protein in whole blood. Clin Chim Acta. 2003;332(2):51–59. |
Supplementary material
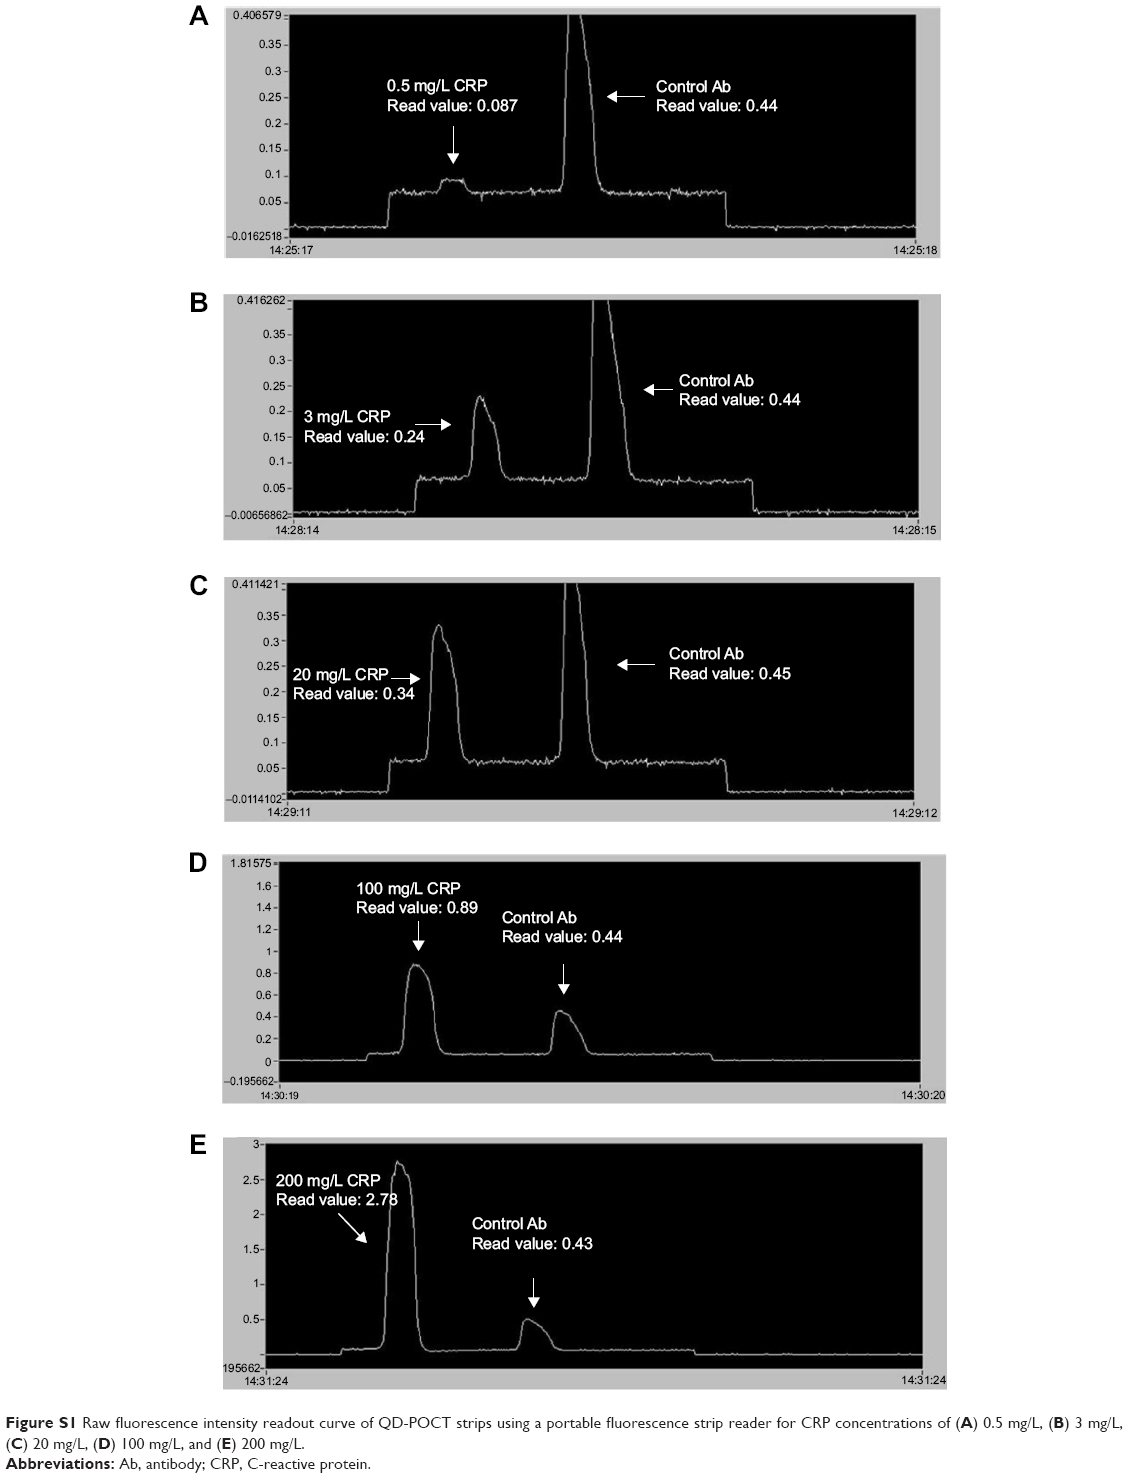 | Figure S1 Raw fluorescence intensity readout curve of QD-POCT strips using a portable fluorescence strip reader for CRP concentrations of (A) 0.5 mg/L, (B) 3 mg/L, (C) 20 mg/L, (D) 100 mg/L, and (E) 200 mg/L. |
 © 2014 The Author(s). This work is published and licensed by Dove Medical Press Limited. The full terms of this license are available at https://www.dovepress.com/terms.php and incorporate the Creative Commons Attribution - Non Commercial (unported, v3.0) License.
By accessing the work you hereby accept the Terms. Non-commercial uses of the work are permitted without any further permission from Dove Medical Press Limited, provided the work is properly attributed. For permission for commercial use of this work, please see paragraphs 4.2 and 5 of our Terms.
© 2014 The Author(s). This work is published and licensed by Dove Medical Press Limited. The full terms of this license are available at https://www.dovepress.com/terms.php and incorporate the Creative Commons Attribution - Non Commercial (unported, v3.0) License.
By accessing the work you hereby accept the Terms. Non-commercial uses of the work are permitted without any further permission from Dove Medical Press Limited, provided the work is properly attributed. For permission for commercial use of this work, please see paragraphs 4.2 and 5 of our Terms.