")
Back to Journals » International Journal of Nanomedicine » Volume 9 » Issue 1
R2* and R2 mapping for quantifying recruitment of superparamagnetic iron oxide-tagged endothelial progenitor cells to injured liver: tracking in vitro and in vivo
Authors Wang Q, Li K, Quan Q, Zhang G
Received 26 November 2013
Accepted for publication 15 January 2014
Published 11 April 2014 Volume 2014:9(1) Pages 1815—1822
DOI https://doi.org/10.2147/IJN.S58269
Checked for plagiarism Yes
Review by Single anonymous peer review
Peer reviewer comments 3
Qingguo Wang, Kangan Li, Qimeng Quan, Guixiang Zhang
Department of Radiology, Shanghai Jiaotong University Affiliated First People’s Hospital, Hongkou District, Shanghai, People’s Republic of China
Objective: To evaluate clinical 3.0T magnetic resonance for tracking and quantifying superparamagnetic iron oxide (SPIO)–labeled endothelial progenitor cells (EPCs) in vitro and homing to liver with acute injury in vivo.
Methods: The bone marrow-derived EPCs were isolated and cultured for 4 days and examined in vitro for lineage markers. Then the cultured cells were labeled with a ferumoxides-protamine sulfate complex. Iron uptake was analyzed with an electron microscope and Prussian blue staining. Agarose gel phantoms containing different amounts of EPCs (0–2.5 × 10⁶ cells per milliliter of 1.0% agarose gel) were analyzed with 3.0T R2 and R2* relaxometry. For in vivo tracking, liver injury was induced in healthy C57 mice (female, 6 weeks old, weight 19–20 g) by administration of carbon tetrachloride by single intraperitoneal injection. The R2* and R2 mapping of injured and normal livers of C57 mice were conducted by using 3.0T magnetic resonance on Days 0, 1, 4, and 8 after intravenous SPIO-tagged cells transplantation.
Results: Electron microscope and Perls Prussian blue stain revealed the efficiency of SPIO particles uptake was more than 95% and no structural changes of labeled cells were found compared with control group. R2 and R2* values were linearly correlated with the number of iron-loaded cells in the agarose gel phantoms, and R2* values were significantly greater than R2 (P<0.01). R2* values in all groups were obviously greater than R2 (P<0.01). The R2* values of the injured livers were greater than normal on Days 1 and 4 (P<0.01). No significant difference of R2 values could be found among the three groups.
Conclusion: Quantitative R2* mapping provides a useful method for quantifying intravascular administered SPIO-tagged EPCs homing to injured livers.
Keywords: EPC, magnetic resonance imaging, cell recruitment
Introduction
Recent reports suggest that endothelial progenitor cells (EPCs) transplantation significantly enhanced vascularization and improved survival rate after liver injury in mice.1,2 The administration of EPCs would be an attractive method in terms of achieving distribution in a whole liver, which is an important aspect of cell therapy applications in diffuse diseases, especially for diseases of the liver. Magnetic resonance (MR) provides an invaluable tool for noninvasive, longitudinal assessment of the migration and distribution of cell trafficking after transplantation. The purpose of our study was to evaluate MR with a clinical 3.0T MR unit for the tracking and quantifying of superparamagnetic iron oxide (SPIO)-tagged EPCs in vitro and homing to injured livers in vivo.
Materials and methods
All animal experiments were approved by the institutional animal care committee.
Superparamagnetic iron oxides
A clinically approved carboxydextran-coated SPIO (SHU 555 A, Resovist; Bayer Schering Pharma AG, Berlin, Germany) was used for all experiments. The SPIO particles have an average hydrodynamic diameter of 65 nm. The size of the iron oxide core is 5 nm.
Cell culture and identification
EPCs were cultured according to a previously described technique.3 Fresh bone marrow was harvested aseptically by flushing tibias and femurs from C57 mice (6-week-old females) using a syringe with 1 mL phosphate buffered saline (PBS). Mononuclear cells were isolated by density gradient centrifugation with Ficoll-Hypaque solution (Sigma-Aldrich, St Louis, MO, USA). Cells were plated on fibronectin-coated six-well plates (1 × 10⁶/cm2) in 2 mL Dulbecco’s Modified Eagle’s Medium (Life Technologies, Carlsbad, CA, USA) supplemented with 20% fetal calf serum, vascular endothelial growth factor (VEGF, 50 ng/mL), basic fibroblast growth factor (5 ng/mL), epidermal growth factor (10 ng/mL), penicillin (100 U/mL), and streptomycin (100 μg/mL) for 4 days’ culture.
After 4 days’ culture, the cells were incubated with 2.4 μg/mL 1,1′-dioctadecyl-3,3,3′,3′-tetramethylindocarbocyanine perchlorate–labeled acetylated low-density lipoprotein (Dil-Ac-LDL; Molecular Probes Company, Eugene, OR,USA) at 37°C for 2 hours. Then cells were washed and fixed with 1% polyfluoroalkoxy (PFA) for 10 minutes. After washing by PBS, the cells were incubated with fluorescein isothiocyanate (FITC)-labeled lectin from ulex europaeus agglutinin (UEA), (Vector Laboratories Inc., Burlingame, CA, USA) for 1 hour. The cells were then washed and observed by using an inverted fluorescent microscope (Olympus Corporation, Tokyo, Japan). The cells demonstrating double-positive fluorescence were identified as EPCs.4 Control group was incubated with PBS instead of Dil-Ac-LDL and UEA. Cells were incubated with anti-stem cell antigen 1-phosphoethanolamine (anti-Sca-1-PE ) and anti-VEGFR-2-FITC (vascular endothelial growth factor receptor 2, fluorescein isothiocyanate), (eBioscience, San Diego, CA, USA) and flow cytometry analysis was performed using a FACScan flow cytometer (BD Biosciences, San Jose, CA, USA).5
EPC labeling
EPCs were labeled with SPIO using a previously established protocol.6 Cultured EPCs were cocultured for 12 hours in the standard media that contained SPIO–Lipofectamine complexes; iron concentration was 50 μg/mL. Lipofectamine™ 2000 (Life Technologies) was mixed with Resovist for 1 hour in cell culture medium at room temperature on a rotating shake. Cells were washed three times with PBS to remove free Resovist–Lipofectamine. For Perl’s Prussian blue staining, cells were fixed with 4% glutaraldehyde for 30 minutes with 2% potassium ferrocyanide in 6% hydrochloric acid and washed three times. The serum-containing medium was replaced by the serum-free medium containing lipid-encapsulated SPIOs. The cells were then incubated in 5% CO2 at 37°C for 12 hours and washed with PBS until the supernatant was clear. The cells were then trypsinized and centrifuged at 1,400 rpm for 5 minutes and the tagged cells were collected.
Electron microscopy examination
The 7 days’ cultured cells (1 × 10⁶) labeled with SPIOs, as well as nonlabeled control cells, underwent electron microscopy tests. The specimens were fixed in 3% glutaraldehyde-cacodylate buffer at 4°C overnight. After 1 hour in 1% OsO4, the specimens were dehydrated in graded dilutions of ethanol and processed for electron microscopy. Thin sections (50 nm) of SPIO-labeled cells and control cells were examined with electron microscopy (60–80 kV; Philips CM120 electron microscopy), (Philips, Amsterdam, the Netherlands). One experienced investigator evaluated the cells for any structural changes as well as the presence and localization of intracellular iron oxide particles.
Cell phantom
The 5.0 × 10⁶ SPIO-tagged EPCs were well distributed in 1% agarose gel. The phantom consisted of five glass tubes (20 mL capacity) filled with 4 mL 1% agarose gel which contained different cell concentrations from 0 to 2.5 × 10⁶ cells/mL. The other five tubes contained free SPIOs of different concentrations from 0 to 2.0 μg Fe/mL agarose gel.
Animal model of acute injury liver
Three C57 mice (female, 6 weeks old, weight 19–20 g) were used for the experimental group. For inducing acute carbon tetrachloride-induced liver injury, a single dose of 2.0 mL/kg of body weight (2:5 volume/volume (v/v) in olive oil) was administered by intraperitoneal injection.
MR of cell phantoms and animals
Cell phantoms were performed on 3.0T clinical whole-body MR unit (Signa Excite, GE Healthcare, Little Chalfont, UK). Cell phantoms were placed in the center of transmit-receive head coil (eight-channel HRBRAIN). R2* mapping was obtained by using a multigradient-echo sequence, and a series of images was reconstructed at different echo times. To avoid phase effects from eddy currents, the even and odd echoes were treated separately. For the phantom experiments, 36 gradient echoes were used to reconstruct a time series of images for R2* determination (160 millisecond [msec] repetition time, 1.9 msec interval between two uneven echoes, 30° flip angle, 256 × 256 spatial resolution, 2 mm section thickness, 180 mm field of view). R2 mapping were acquired by using a multiecho multisection sequence (eight echoes, 500 msec repetition time, 6.9 msec interval between two echoes, 128 × 128 spatial resolution, 2.5 mm section thickness, 180 mm field of view, 90° flip angle).
Three C57 mice with liver injury and three normal mice received 1 × 10⁶ tagged EPCs diluted in 500 μL PBS by tail vein injection. The other three normal mice and three mice with liver injury received 1 × 10⁶ unlabeled EPCs by tail vein injection. On Days 0, 1, 4, 8 after cell transplantation, all mice were anesthetized with sodium ketamine (12.5 mg/kg), fixed on a small wooden plate, and transferred to the clinical 3.0T MR unit and into a custom-made small animal solenoid coil (70 mm in diameter and 70 mm in length, GE Healthcare). The head-to-tail symmetry line was placed perpendicular to B0 in the magnet bore. For in vivo R2* mapping, 15 gradient echoes were acquired by using a spectral inversion-recovery fat-suppressed multisection sequence (160 msec TR, 2.85 msec interval between two echoes, 256 × 256 spatial resolution, 2 mm section thickness, 70 mm field of view, flip angle 30°, bandwidth 1.7 kHz). For in vivo T2 mapping, the same location was measured with eight echoes (500 msec repetition time, 6.9 msec interval between two echoes, 256 × 256 spatial resolution, 2 mm section thickness, 70 mm field of view, flip angle 90°, bandwidth 25.0 kHz.) The multisection multiple-echo quantitative R2 and R2* data were evaluated by using FuncTool 4.5.3 (GE Healthcare). The regions of interest (ROI) (mean size, 70 pixels) were determined in consensus by an experienced radiologist and an MR engineer.
Statistical analyses
All data are presented as mean ± standard deviation. Linear regression analyses were performed by using commercially available statistics software (Prism4, version 4; GraphPad Software, San Diego, CA, USA). The R2 and R2* data in vivo of the different groups were compared by using the unpaired Student’s t test. In our study, P≤0.05 was considered to indicate statistical significance.
Results
Characterization of EPCs
After 4 days’ culture, more than 80 percent of cells demonstrated a spindle-shaped morphology (Figure 1A) and uptake endocytosed Dil-Ac-LDL (Figure 1B) and UEA1 (Figure 1C). Double positive cells for Dil-Ac-LDL and UEA1 uptake (Figure 1D) account for more than 80% of all cells. These three characteristics are generally accepted as identifying EPCs. These cells were characterized further by demonstrating the expression of the mouse stem-cell marker Sca-1 (64.0%±5.4%) as well as the endothelial cell lineage antigen VEGFR-2 (85.1%±8.6%) by flow cytometry (n=6).
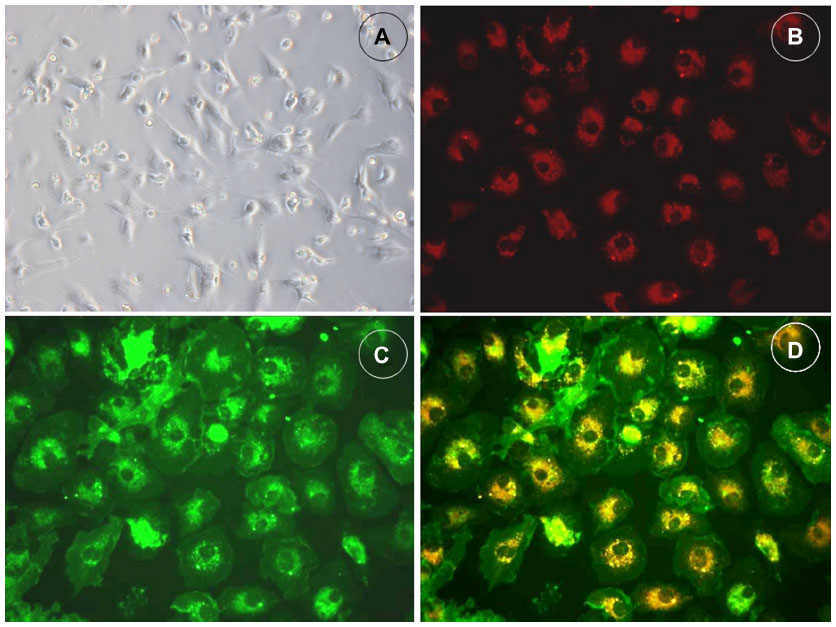 | Figure 1 Culture and characterization of bone marrow-derived EPCs. |
Electron microscopy demonstrated intracellular accumulations of iron oxides forming clusters in secondary lysosomes (arrows, Figure 2A and B). Prussian blue staining of EPCs incubated with SPIO–Lipofectamine complexes with the concentration 50 μg of iron per culture media for 24 hours are presented in Figure 2C. The labeling efficiency was approximately 100% for EPCs. Electron microscopy did not reveal any structural changes of labeled cells compared with control cells (Figure 2D).
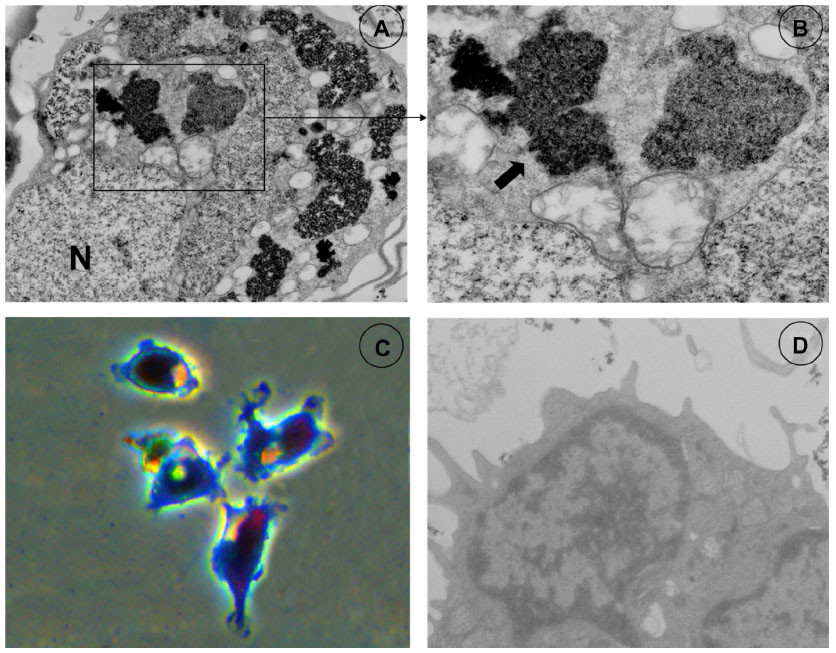 | Figure 2 Electron microscopy and Perls Prussian blue stain. |
MR of cell phantoms
In all cell phantom experiments, the standard deviation of the mean relaxation rate was similar for coronal and transverse regions of interest, suggesting a homogeneous distribution of the cells within the phantom. The transverse images of different R2* (Figure 3A) and R2 (Figure 3B) relaxation time maps were clearly demonstrated, indicating different amounts of tagged cells in the phantoms. Both R2 and R2* had a linear relation to the number of tagged cells (R2=0.955 and 0.992 respectively, P<0.01) (Figure 3C–D) and free SPIOs (R2=0.931 and 0.967 respectively, P<0.01) (Figure 3E–F). The slope for the R2* effects (6.32 × 10⁻⁶ mL/cells/second) was 8.8-fold higher than the R2 effects (5.59 × 10⁻⁵ mL/cells/second).
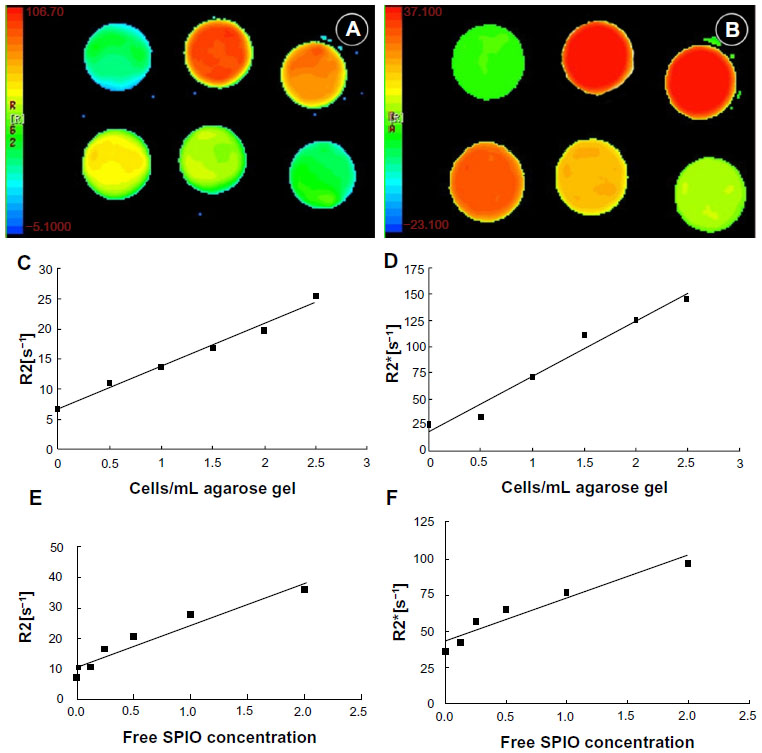 | Figure 3 In vitro R2 (A) and R2* (B) relaxation time MR of agar gel-suspended EPCs labeled with SPIO at varying iron concentrations in a six-well plate; graphs show R2 (C) and R2* (D) relaxation rates of cell samples, and R2 (E) and R2* (F) relaxation rates of free SPIOs of different concentrations. |
MR of in vivo experiment
High-spatial-resolution R2 and R2* maps of mouse livers were acquired by a 3.0T clinical MR unit (Figure 4A–C). Histological analysis showed Perls Prussian blue stain–positive cells distributed in the liver parenchyma of mice injected with labeled cells (Figure 4D). The mean R2* values of the three groups were significantly different on the first day and the fourth day after administration of labeled or nonlabeled EPCs (P<0.01) (Figure 5). The mean R2 values of the livers in the different groups showed little difference (P>0.05) (Figure 6).
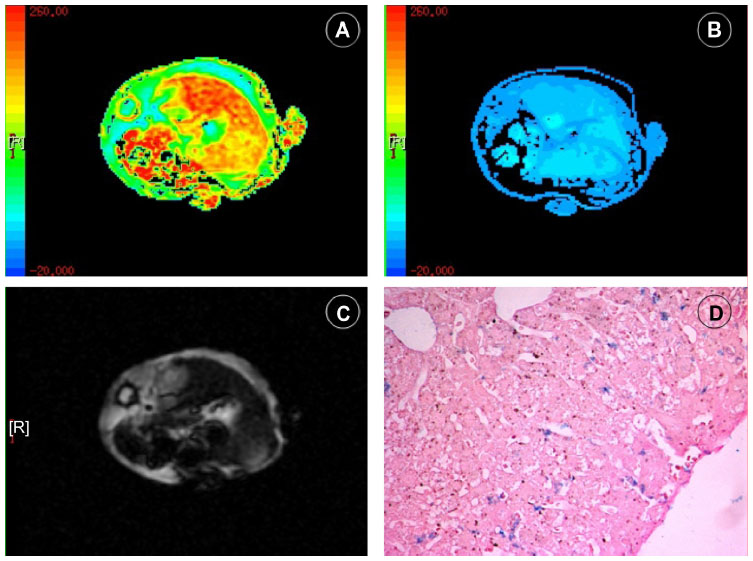 | Figure 4 In vivo R2* (A) and T2* (B) relaxation time MR of mouse liver after SPIO-labeled EPCs were injected through tail vein; raw T2* image (C) shows decreased signal intensity in the mouse liver; and detected iron oxides in liver (D) with Prussian blue staining. |
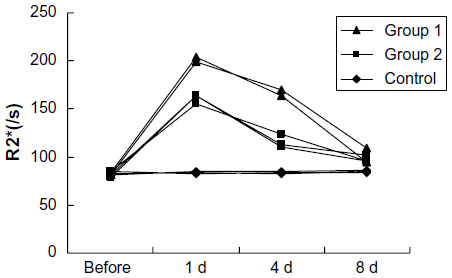 | Figure 5 Graph shows R2* relaxation rates determined at 3.0T MR for different time points of mouse livers after SPIO-labeled EPCs injection through tail vein. |
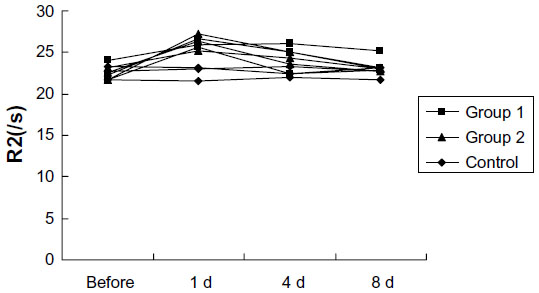 | Figure 6 Graph shows R2 relaxation rates determined at 3.0T MR for different time points of mouse livers after SPIO-labeled EPCs injection through tail vein. |
Discussion
Endothelial progenitor cell transplantation is a novel area of investigation in ischemic or injurious diseases.1,7–11 Cell migration and homing to ischemic or injury sites is the initial step for cell therapies. Noninvasively demonstrating the location, distribution, and long-term viability of the cells is imperative. MR of cells labeled with an MR contrast agent may be the most promising means for achieving the goal. MR of cells labeled with SPIO has been shown to be a sensitive method of noninvasively tracking various cell populations in the brain,12–17 bone marrow,18–20 kidneys,21,22 and myocardial tissue.23–25 However, relatively few in vivo studies have assessed quantifying the recruitment of EPCs by intravenous injection after liver injury using a clinical 3.0T MR system.
SPIO is adopted as a promising labeling agent for in vivo cell tracking because the high-spatial-resolution capabilities of MR can be exploited, and SPIO resulted in strong susceptibility effects, so that using a high-field MR scanner enables the detection of even small amounts of cells labeled with iron oxides.26,27 Our study showed that EPCs can be efficiently labeled in vitro by using a commercially available and clinically approved contrast media of SPIO. These labeled cells can be visualized and quantified in a clinical 3.0T MR scanner. SPIO tagging does not affect cell viability or EPC function, as shown by electron microscope and Dil-Ac-LDL uptake.
Light microscopy and electron microscopy revealed efficient labeling without toxic effects, in accordance with other findings, by using commercially available contrast agents for cell labeling.28 Electron microscopy examinations revealed a lysosomal deposition of SPIOs, as observed in the other study.29
In vitro, we observed a linear relationship between R2 and R2* values and the number of tagged cells in the phantoms. This finding is consistent with the observations by Kuhlpeter et al,30 who also performed tests with a 3.0T clinical whole-body MR unit. We observed that R2* effects were stronger than R2 effects (P<0.05), and accordingly, R2* mapping has superior sensitivity for the detection of a low density of tagged cells. Our observations are supported by the observation of Bowen et al,31 who found that R2* values exceeded R2 by a factor of 70 and were sensitive to iron concentration in cells, and that R2* quantitation provides a measure independent of image windowing to demonstrate the presence of tagged cells.
In vivo, we observed that R2* effects of the livers in all groups were obviously greater than the R2 values, just like the findings in the phantom tests. After intravenous transplantation, the cells accumulate where they are needed due to cell migration and homing. Our study revealed that the selective distribution of intravenous injection of EPCs after liver injury significantly increased the number of EPCs in the liver, which was in accordance with previous studies that demonstrate that tissue ischemia is a major stimulus for circulating progenitor cells.32–35 EPCs were observed to be diffusely distributed in the liver after intravenous injection. EPCs were particularly present along sinusoids and portal areas, where the cells could be mechanically trapped. Thus, in vivo MR tracking can provide a direct-viewing detection in cell transplantation and facilitate research for cell migration and homing. For clinical cell therapy purposes, we adopted intravenous administration, which is attractive because it is an easy way for administration and may reduce some side effects like cell transplantation-related hepatic veno-occlusive disease.36 But in vivo, the motion and susceptibility artifacts affect the true measurements of R2 and R2* due to breathing, vessel pulsation, and gut movement. In our experience, the distortion can be diminished by using a higher spatial resolution and better animal anesthesia. Moreover, dilution of the labeling agent may occur over time – for example, due to cell proliferation, apoptosis of tagged cells and consequently phagocytosis.29 Moreover, the precision of the measurement can be limited by random noise. Finally, baseline R2 and R2* may change as a consequence of disease, healing, and iron metabolism.
A recent study by Kuhlpeter et al30 introduced the concept of R2′(R2*–R2), which may differentiate free iron and cell-bound iron. However, our data demonstrated the R2 showed little change in the different groups after the administration of SPIO-tagged EPCs; in addition, the R2 values are not stable, probably because R2 is not sensitive to iron oxide and affected by the reasons mentioned above. Therefore, R2* mapping was used as an effective quantifying means for tracking tagged EPCs in vivo.
Conclusion
In summary, the results of our study show that R2 and R2* effects depend on the number of labeled cells in vitro. The measurement of R2 and R2*, especially R2* should be advantageous for quantifying cell recruitment in vivo, which may help in cell transplantation therapies and cell homing studies.
Disclosure
The authors report no conflicts of interest in this work.
References
Taniguchi E, Kin M, Torimura T, et al. Endothelial progenitor cell transplantation improves the survival following liver injury in mice. Gastroenterology. 2006;130(2):521–531. | |
Ueno T, Nakamura T, Torimura T, Sata M. Angiogenic cell therapy for hepatic fibrosis. Med Mol Morphol. 2006;39(1):16–21. | |
Wassmann S, Werner N, Czech T, Nickenig G. Improvement of endothelial function by systemic transfusion of vascular progenitor cells. Circ Res. 2006;99(8):e74–e83. | |
Strehlow K, Werner N, Berweiler J, et al. Estrogen increases bone marrow-derived endothelial progenitor cell production and diminishes neointima formation. Circulation. 2003;107(24):3059–3065. | |
Werner N, Priller J, Laufs U, et al. Bone marrow-derived progenitor cells modulate vascular reendothelialization and neointimal formation: effect of 3-hydroxy-3-methylglutaryl coenzyme a reductase inhibition. Arterioscler Thromb Vasc Biol. 2002;22(10):1567–1572. | |
Frank JA, Miller BR, Arbab AS, et al. Clinically applicable labeling of mammalian and stem cells by combining superparamagnetic iron oxides and transfection agents. Radiology. 2003;228(2):480–487. | |
Ding DC, Shyu WC, Lin SZ, Li H. The role of endothelial progenitor cells in ischemic cerebral and heart diseases. Cell Transplant. 2007;16(3):273–284. | |
McKay R. Stem cells – hype and hope. Nature. 2000;406(6794):361–364. | |
Park S, Tepper OM, Galiano RD, et al. Selective recruitment of endothelial progenitor cells to ischemic tissues with increased neovascularization. Plast Reconstr Surg. 2004;113(1):284–293. | |
Werner N, Junk S, Laufs U, et al. Intravenous transfusion of endothelial progenitor cells reduces neointima formation after vascular injury. Circ Res. 2003;93(2):e17–e24. | |
Nakamura T, Torimura T, Sakamoto M, et al. Significance and therapeutic potential of endothelial progenitor cell transplantation in a cirrhotic liver rat model. Gastroenterology. 2007;133(1):91–107. e1. | |
Bulte JW, Duncan ID, Frank JA. In vivo magnetic resonance tracking of magnetically labeled cells after transplantation. J Cereb Blood Flow Metab. 2002;22(8):899–907. | |
Fleige G, Nolte C, Synowitz M, Seeberger F, Kettenmann H, Zimmer C. Magnetic labeling of activated microglia in experimental gliomas. Neoplasia. 2001;3(6):489–499. | |
Hoehn M, Küstermann E, Blunk J, et al. Monitoring of implanted stem cell migration in vivo: a highly resolved in vivo magnetic resonance imaging investigation of experimental stroke in rat. Proc Natl Acad Sci U S A. 2002;99(25):16267–16272. | |
Miyoshi S, Flexman JA, Cross DJ, et al. Transfection of neuroprogenitor cells with iron nanoparticles for magnetic resonance imaging tracking: cell viability, differentiation, and intracellular localization. Mol Imaging Biol. 2005;7(4):286–295. | |
Syková E, Jendelová P. Magnetic resonance tracking of implanted adult and embryonic stem cells in injured brain and spinal cord. Ann N Y Acad Sci. 2005;1049:146–160. | |
Zelivyanskaya ML, Nelson JA, Poluektova L, et al. Tracking superparamagnetic iron oxide labeled monocytes in brain by high-field magnetic resonance imaging. J Neurosci Res. 2003;73(3):284–295. | |
Hinds KA, Hill JM, Shapiro EM, et al. Highly efficient endosomal labeling of progenitor and stem cells with large magnetic particles allows magnetic resonance imaging of single cells. Blood. 2003;102(3):867–872. | |
Jendelová P, Herynek V, DeCroos J, et al. Imaging the fate of implanted bone marrow stromal cells labeled with superparamagnetic nanoparticles. Magn Reson Med. 2003;50(4):767–776. | |
Jendelová P, Herynek V, Urdzíková L, et al. Magnetic resonance tracking of transplanted bone marrow and embryonic stem cells labeled by iron oxide nanoparticles in rat brain and spinal cord. J Neurosci Res. 2004;76(2):232–243. | |
Bos C, Delmas Y, Desmoulière A, et al. In vivo MR imaging of intravascularly injected magnetically labeled mesenchymal stem cells in rat kidney and liver. Radiology. 2004;233(3):781–789. | |
Hauger O, Frost EE, van Heeswijk R, et al. MR evaluation of the glomerular homing of magnetically labeled mesenchymal stem cells in a rat model of nephropathy. Radiology. 2006;238(1):200–210. | |
Himes N, Min JY, Lee R, et al. In vivo MRI of embryonic stem cells in a mouse model of myocardial infarction. Magn Reson Med. 2004;52(5):1214–1219. | |
Kraitchman DL, Heldman AW, Atalar E, et al. In vivo magnetic resonance imaging of mesenchymal stem cells in myocardial infarction. Circulation. 2003;107(18):2290–2293. | |
Rivière C, Boudghène FP, Gazeau F, et al. Iron oxide nanoparticle-labeled rat smooth muscle cells: cardiac MR imaging for cell graft monitoring and quantitation. Radiology. 2005;235(3):959–967. | |
Lewin M, Carlesso N, Tung CH, et al. Tat peptide-derivatized magnetic nanoparticles allow in vivo tracking and recovery of progenitor cells. Nat Biotechnol. 2000;18(4):410–414. | |
Weissleder R, Mahmood U. Molecular imaging. Radiology. 2001; 219(2):316–333. | |
Daldrup-Link HE, Rudelius M, Oostendorp RA, et al. Targeting of hematopoietic progenitor cells with MR contrast agents. Radiology. 2003;228(3):760–767. | |
Matuszewski L, Persigehl T, Wall A, et al. Cell tagging with clinically approved iron oxides: feasibility and effect of lipofection, particle size, and surface coating on labeling efficiency. Radiology. 2005;235(1):155–161. | |
Kuhlpeter R, Dahnke H, Matuszewski L, et al. R2 and R2* mapping for sensing cell-bound superparamagnetic nanoparticles: in vitro and murine in vivo testing. Radiology. 2007;245(2):449–457. | |
Bowen CV, Zhang X, Saab G, Gareau PJ, Rutt BK. Application of the static dephasing regime theory to superparamagnetic iron-oxide loaded cells. Magn Reson Med. 2002;48(1):52–61. | |
Shintani S, Murohara T, Ikeda H, et al. Augmentation of postnatal neovascularization with autologous bone marrow transplantation. Circulation. 2001;103(6):897–903. | |
Takahashi T, Kalka C, Masuda H, et al. Ischemia- and cytokine-induced mobilization of bone marrow-derived endothelial progenitor cells for neovascularization. Nat Med. 1999;5(4):434–438. | |
Shintani S, Murohara T, Ikeda H, et al. Mobilization of endothelial progenitor cells in patients with acute myocardial infarction. Circulation. 2001;103(23):2776–2779. | |
Aicher A, Brenner W, Zuhayra M, et al. Assessment of the tissue distribution of transplanted human endothelial progenitor cells by radioactive labeling. Circulation. 2003;107(16):2134–2139. | |
Kumar S, Deleve LD, Kamath PS, Tefferi A. Hepatic veno-occlusive disease (sinusoidal obstruction syndrome) after hematopoietic stem cell transplantation. Mayo Clin Proc. 2003;78(5):589–598. |
 © 2014 The Author(s). This work is published and licensed by Dove Medical Press Limited. The full terms of this license are available at https://www.dovepress.com/terms.php and incorporate the Creative Commons Attribution - Non Commercial (unported, v3.0) License.
By accessing the work you hereby accept the Terms. Non-commercial uses of the work are permitted without any further permission from Dove Medical Press Limited, provided the work is properly attributed. For permission for commercial use of this work, please see paragraphs 4.2 and 5 of our Terms.
© 2014 The Author(s). This work is published and licensed by Dove Medical Press Limited. The full terms of this license are available at https://www.dovepress.com/terms.php and incorporate the Creative Commons Attribution - Non Commercial (unported, v3.0) License.
By accessing the work you hereby accept the Terms. Non-commercial uses of the work are permitted without any further permission from Dove Medical Press Limited, provided the work is properly attributed. For permission for commercial use of this work, please see paragraphs 4.2 and 5 of our Terms.