")
Back to Journals » Neuropsychiatric Disease and Treatment » Volume 11
Quetiapine mitigates the ethanol-induced oxidative stress in brain tissue, but not in the liver, of the rat
Authors Han J, Tian H, Lian Y, Yu Y, Lu C, Li X, Zhang R, Xu H
Received 7 January 2015
Accepted for publication 16 March 2015
Published 15 June 2015 Volume 2015:11 Pages 1473—1482
DOI https://doi.org/10.2147/NDT.S80505
Checked for plagiarism Yes
Review by Single anonymous peer review
Peer reviewer comments 3
Editor who approved publication: Professor Wai Kwong Tang
Jin-hong Han,1,2 Hong-zhao Tian,2 Yang-yang Lian,1 Yi Yu,1 Cheng-biao Lu,2 Xin-min Li,3 Rui-ling Zhang,1 Haiyun Xu4
1The Second Affiliated Hospital of Xinxiang Medical University, 2School of Basic Medicine, Xinxiang Medical University, Xinxiang, Henan, People’s Republic of China; 3Department of Psychiatry, Faculty of Medicine and Dentistry, University of Alberta, Edmonton, AB, Canada; 4The Mental Health Center, Shantou University Medical College, Shantou, Guangdong, People’s Republic of China
Abstract: Quetiapine, an atypical antipsychotic, has been employed to treat alcoholic patients with comorbid psychopathology. It was shown to scavenge hydroxyl radicals and to protect cultured cells from noxious effects of oxidative stress, a pathophysiological mechanism involved in the toxicity of alcohol. This study compared the redox status of the liver and the brain regions of prefrontal cortex, hippocampus, and cerebellum of rats treated with or without ethanol and quetiapine. Ethanol administration for 1 week induced oxidative stress in the liver and decreased the activity of glutathione peroxidase and total antioxidant capacity (TAC) there. Coadministration of quetiapine did not protect glutathione peroxidase and TAC in the liver against the noxious effect of ethanol, thus was unable to mitigate the ethanol-induced oxidative stress there. The ethanol-induced alteration in the redox status in the prefrontal cortex is mild, whereas the hippocampus and cerebellum are more susceptible to ethanol intoxication. For all the examined brain regions, coadministration of quetiapine exerted effective protection on the antioxidants catalase and total superoxide dismutase and on the TAC, thus completely blocking the ethanol-induced oxidative stress in these brain regions. These protective effects may explain the clinical observations that quetiapine reduced psychiatric symptoms intensity and maintained a good level of tolerability in chronic alcoholism with comorbid psychopathology.
Keywords: ethanol, quetiapine, oxidative stress, antioxidant
Introduction
Clinical studies suggest that some atypical antipsychotics, such as clozapine, olanzapine, and quetiapine, may reduce alcohol craving and consumption, especially among patients with comorbid psychopathology. Clozapine treatment was associated with a decrease in alcohol use in schizophrenic patients with comorbid substance use disorders.1–3 Olanzapine treatment resulted in a reduction in the use of alcohol and other abused substances4 and helped nonpsychotic alcohol-dependent individuals to maintain sobriety.5 Similar benefits of quetiapine in reducing alcohol use and craving were also reported in posttraumatic stress disorder.6,7 In a recent open-label study, quetiapine decreased alcohol consumption, craving for alcohol, and psychiatric symptoms intensity while maintaining a good level of tolerance.8 Moreover, in a double-blind, placebo-controlled pilot trial, alcohol craving was significantly reduced in quetiapine-treated subjects compared with that in placebo-treated type B alcoholics (early-onset alcoholics), although it provided no advantage over placebo in improving drinking outcomes among type A alcoholics.9
The dopaminergic system has been described as the principal neurotransmitter associated with reward from alcohol.10–12 The serotonergic system, which modulates dopamine release, has also been associated with drinking behaviors.13,14 Atypical antipsychotics target both the dopamine and the serotonin systems, thus exerting their actions for alcohol dependence. In addition, some other factors may also contribute to the effective use of atypical antipsychotics in alcohol-dependent individuals. For example, a good level of tolerance or counteracting the toxic effects of alcohol may be important.
The toxicity of alcohol is associated with increased generation of free radicals and the development of oxidative stress. It is known that ethanol is metabolized into acetaldehyde, mainly by the enzyme alcohol dehydrogenase. Acetaldehyde reacts with hepatic glutathione (GSH), which is a major cytosolic antioxidant in the liver, and causes depletion of GSH.15,16 In addition, ethanol promotes the formation of reactive oxygen species (ROS) within the mitochondria and decreases mitochondria GSH content, thus making these organelles more susceptible to oxidative damage.17,18 Via these mechanisms, ethanol causes oxidative stress in humans and animals. In support of this notion, oxidative stress was found in the blood of patients with alcohol-related liver cirrhosis.19 In ethanol-fed rats, increased levels of thiobarbituric acid substances and lipid hydroperoxides were detected, while activities of superoxide dismutase (SOD), catalase, and glutathione peroxidase (GPx) were decreased by the same treatment.20,21 Moreover, simultaneous administration of antioxidants along with ethanol prevented oxidative alterations of mitochondria in alcohol-treated rats,22 attenuated the oxidative stress, and restored the levels of enzymatic and nonenzymatic antioxidants.20,21,23
In our previous studies, quetiapine exerted protective effects on PC12 cells experiencing serum withdrawal,24 or exposed to N-methyl-4-phenylpyridinium ion25 or amyloid β protein.26,27 All these insults increased the production of ROS.28,29 These results suggest an antioxidant action of quetiapine. This antioxidant mechanism was further demonstrated in cell-free and cell culture systems, in which quetiapine was shown to capture hydroxyl radicals produced in the Fenton system and in the amyloid β solution.30 In line with the aforementioned findings, the 7-hydroxymetabolite of quetiapine was detected in the plasma of patients who received quetiapine treatment,31 suggesting that this drug effectively captures hydroxyl radicals in the human body.
On the basis of the aforementioned previous studies, quetiapine was hypothesized to protect subjects against oxidative stress caused by ethanol. To test this hypothesis, we measured and compared some oxidative stress-related parameters in the liver and various brain regions of rats subjected to different treatments with or without ethanol and quetiapine.
Materials and methods
Animals
Adult (10-week-old) male Sprague-Dawley rats were purchased from Vital River Laboratories (Beijing, People’s Republic of China) and housed in the animal facility of Xinxiang Medical University with a 12 hours dark/12 hours light cycle and free access to food and water. The vivarium was kept at a constant temperature of 22°C±1°C and a relative humidity of 60%. All procedures were performed in accordance with the guidelines set by the Animal Care and Use Committee of Xinxiang Medical University and approved by the committee.
Ethanol and quetiapine administrations
Dehydrated ethanol was purchased from Sabex Inc. (Boucherville, QC, Canada). It was diluted with saline to 20% (vol/vol). On the basis of the primary data of our pilot study, the rats were given the 20% ethanol at a dose of 2 g/kg/day via intraperitoneal (IP) administration once a day for 7 days. Quetiapine was provided by AstraZeneca (Wilmington, DE, USA). It was dissolved in 0.6% glacial acetic acid and given to rats via IP administration at a dose of 10 mg/kg/day for 3 weeks. This protocol was exercised following that in our previous animal studies.32,33 The volume of each injection was 1 mL/kg.
After 1-week acclimation to the laboratory conditions, the rats were given quetiapine or the vehicle of it for 3 weeks. During the 3rd week, they were given ethanol or an equal volume of sterilized saline once a day. Depending on the treatment, the rats were divided into four groups: CNT (controls), ETH (ethanol), QUE (quetiapine), and QUE + ETH (quetiapine plus ethanol). Each group consisted of eight rats. During the 3-week experimental period, all rats had free access to water and food, and their body weight was measured every other 2 days.
Preparation of tissue samples for biochemical analyses
Twenty-four hours after the last injection, rats were killed by decapitation, and their brains and livers were quickly removed and immediately transferred to ice-cold containers containing 0.89% sodium chloride. The brain regions of cerebellum, prefrontal cortex (PFC), and hippocampus were dissected out of the whole brain. Then the liver and these brain samples were homogenized in 0.1 M Tris-HCl buffer, pH 7.4, followed by centrifugation at 12,000× g for 10 minutes at 4°C. The protein concentrations of the supernatants were quantified using the BCA protein assay kit (Bio-Rad Laboratories, Hercules, CA, USA).
The liver is the organ with which the toxic effects of ethanol have been well documented.34 For the hippocampus, much work has been done investigating acute and chronic effects of ethanol on learning-related synaptic plasticity.35 The cerebellum is one of the brain regions that are most susceptible to ethanol during development.36 PFC is also compromised in ethanol-exposed animals, indicated by working memory deficit and neurobiological changes that occur in this brain region.37 Each group had eight samples of the aforementioned brain regions and the liver that were used for the following biochemical analyses.
Determination of lipid peroxidation and reactive oxygen species
Levels of lipid peroxidation in the samples were determined following the manufacturer’s protocol (Nanjing Jiancheng Bioengineering Institute, Nanjing, People’s Republic of China). Briefly, 10 μL supernatant was mixed with an equal volume of working solution 1. Then working solutions 2 (0.30 mL) and 3 (0.10 mL) were added, followed by incubation at 95°C for 40 minutes. After cooling, the solution was centrifuged at 1,000× g for 10 minutes. Absorbance at 532 nm was read, and the concentration of malondialdehyde (MDA) in the samples was calculated according to the formula provided by the manufacturer and expressed as nmol/mg protein.
ROS in the samples was detected using a commercial ROS assay kit (Nanjing Jiancheng) and following the manufacturer’s protocol. Briefly, the molecular probe 5,6-chloromethyl-2’,7’-dichlorodihydrofluorescein diacetate was added into the samples (1:19) and mixed; then the mixed solution was incubated at 37°C for 30 minutes. Plates were read in F97 Pro fluorospectrophotometer (Lengguang Tech, Shanghai, People’s Republic of China) at 485/530 nm. The results are expressed as fluorescence intensity (FI)/mg protein.
Assessments of antioxidant enzymes and capacity
The activity of catalase in the samples was measured following the manufacturer’s protocol (Nanjing Jiancheng). Briefly, 10 μL sample solution was mixed with 1.5 mL substrate solution (prepared with an optical density value between 0.50 and 0.55 and preincubated at 25°C). The absorbance at 240 nm was measured. One minute later, another reading was taken at the same wavelength. The enzyme activity was calculated according to the formula provided by the manufacturer and expressed as U/mg protein.
The activity of GPx in the samples was measured following the manufacturer’s protocol (Nanjing Jiancheng). Briefly, 20 μL sample solution was mixed with an equal volume of GSH solution (1.0 mmol) in an Eppendorf tube. After incubation at 37°C for 5 minutes, 10 μL working solution 1 was added. After incubation at 37°C for 5 minutes, 0.20 mL working solution 2 was added. The solution was mixed and centrifuged at 1,000× g for 10 minutes. In another parallel tube, sample solution was added at the last step rather than the first step. About 0.10 mL of the final solution was taken up and mixed with an equal volume of working solution 3, 25 μL working solution 4, and 5 μL working solution 5. The absorbance at 412 nm was measured. The enzyme activity was calculated according to the formula provided by the manufacturer and expressed as U/mg protein.
The total superoxide dismutase (T-SOD) activity in the samples was measured following the manufacturer’s protocol (Nanjing Jiancheng). Briefly, 5 μL of sample was mixed with 1.0 mL working solution 1 and same volume (0.1 mL) of working solutions 2, 3, and 4. Then the mixed solution was incubated at 37°C for 40 minutes. After adding the color developing agent, the absorbance of the solution at 550 nm was measured. The activity of T-SOD was calculated according to the formula provided by the manufacturer and expressed as U/mg protein.
The total antioxidant capacity (TAC) in the samples was measured following the manufacturer’s protocol (Nanjing Jiancheng). Briefly, the sample (20 μL) was mixed with working solutions 1 (100 μL), 2 (200 μL), and 3 (50 μL). Then the mixed solution was incubated at 37°C for 30 min. After adding solutions 4 (200 μL) and 5 (200 μL) and mixing the solutions, the absorbance of the mixed solution at 520 nm was measured. The activity of TAC was calculated according to the formula provided by the manufacturer and expressed as U/mg protein. It should be noted that this test measures predominantly the low-molecular-weight, chain-breaking antioxidants, excluding the contribution of antioxidant enzymes and metal-binding proteins. In general, TAC is decreased in conditions associated with oxidative stress, and the administration of chain-breaking antioxidants increases antioxidant capacity.38
Statistical analysis
Data were subjected to two-way analysis of variance (ANOVA), with ethanol and quetiapine as the two factors, followed by Bonferroni’s post hoc comparisons. The level of statistical significance was set at P<0.05.
Results
Quetiapine ameliorates the inhibiting effect of ethanol on weight gain of rats
During the first 2 weeks, all rats in the four groups showed comparable body weight gains (Figure 1A). However, during the 3rd week when ethanol was administered, the rats in ETH group showed a smallest weight gain relative to the other three groups. Two-way ANOVA indicated a significant interaction (F(1, 28) =26.38, P<0.0001) between the two main factors (ethanol and quetiapine). Both factor A (F(1, 28) =29.43, P<0.0001) and B (F(1, 28) =16.72, P<0.001) exerted significant effect. Post hoc comparisons found significant differences between ETH group and all the other three groups, and between QUE + ETH group and all the other three groups. The difference between ETH and QUE + ETH was also significant (Figure 1B).
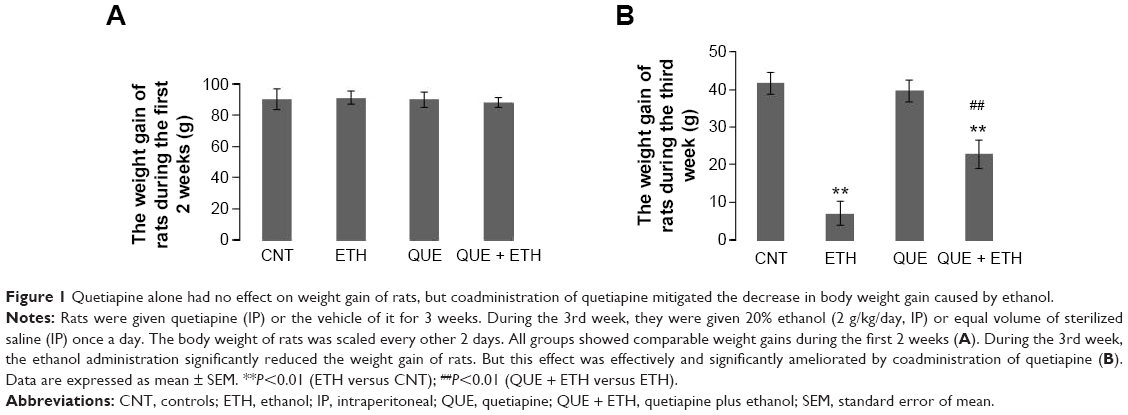 | Figure 1 Quetiapine alone had no effect on weight gain of rats, but coadministration of quetiapine mitigated the decrease in body weight gain caused by ethanol. |
Effects of quetiapine on the ethanol-induced oxidative stress in the liver
For MDA in the liver, ETH and QUE + ETH groups showed higher levels relative to the other two groups. Two-way ANOVA indicated no significant interaction (F(1, 28) =0.14, P=0.71) between the two main factors; factor A (F(1, 28) =27.84, P<0.0001), but not B, exerted a significant effect. Post hoc comparisons found significant differences between CNT and ETH and between CNT and QUE + ETH. The differences between QUE and the ethanol-treated groups (ETH and ETH + QUE) were also significant. No significant difference was found between CNT and QUE (Figure 2A). For ROS, ETH and QUE + ETH groups showed higher levels relative to the other two groups. Two-way ANOVA indicated no significant interaction (F(1, 28) =0.18, P=0.67) between the two main factors; factor A (F(1, 28) =12.95, P=0.001), but not B, exerted a significant effect. Post hoc comparisons found significant differences between CNT and ETH and between CNT and QUE + ETH. The differences between QUE and the ethanol-treated groups (ETH and ETH + QUE) were also significant. No significant difference was found between CNT and QUE (Figure 2B).
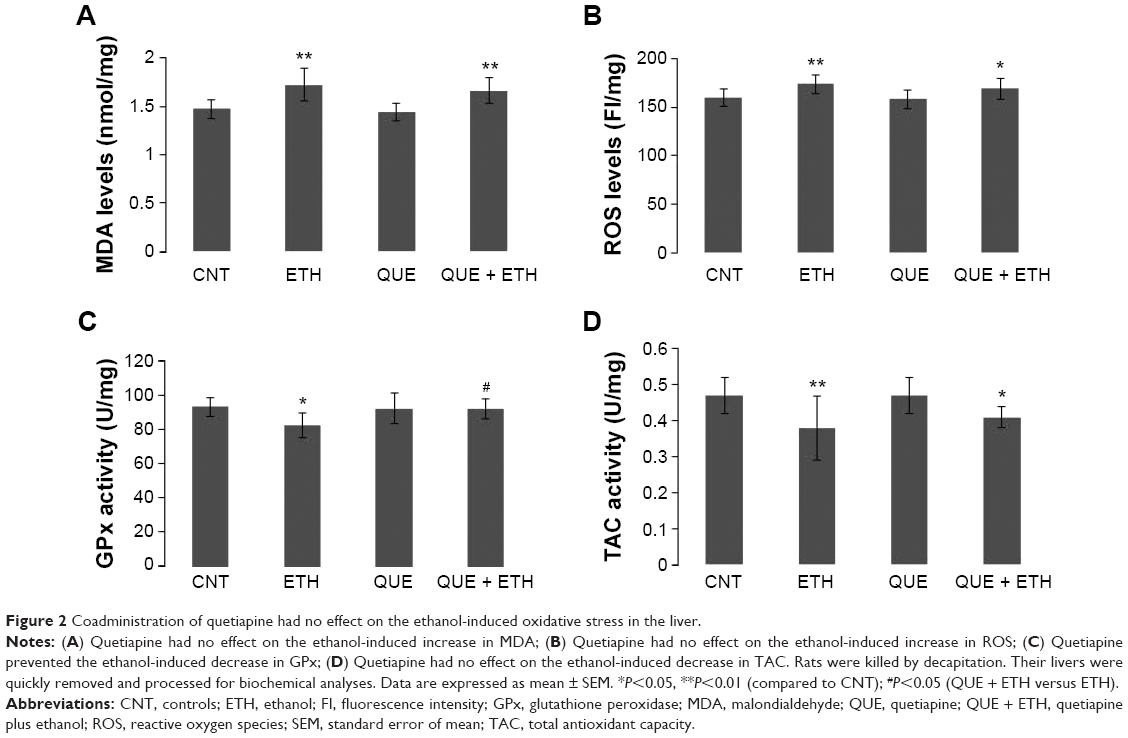 | Figure 2 Coadministration of quetiapine had no effect on the ethanol-induced oxidative stress in the liver. |
For GPx activity in the liver tissue, ETH group showed a lowest level relative to the other three groups. Two-way ANOVA indicated a significant interaction (F(1, 28) =4.63, P=0.04) between the two main factors, although neither factor A nor factor B show significant effect. Post hoc comparisons found significant differences between CNT and ETH and between ETH and QUE + ETH. The difference between QUE and ETH was significant, but not between QUE and the other two groups (Figure 2C). For TAC activity, ETH and QUE + ETH groups showed lower levels relative to the other two groups. Two-way ANOVA indicated no significant interaction (F(1, 28) =0.26, P=0.61) between the two main factors; factor A exerted a significant effect (F(1, 28) =12.30, P<0.001). Post hoc comparisons found significant differences between CNT and ETH and between CNT and QUE + ETH. The differences between QUE and the ethanol-treated rats (ETH and ETH + QUE groups) were also significant. No significant difference was found between CNT and QUE (Figure 2D). The ethanol and quetiapine administrations showed no effect on the activities of catalase and T-SOD in the liver tissue as all four groups had comparable values of these two indices (data not shown).
Quetiapine protected rats against the ethanol-induced changes in redox status in PFC
Ethanol administration for 1 week increased ROS levels in PFC relative to the other three groups. Two-way ANOVA indicated no significant interaction (F(1, 28) =0.38, P=0.25) between the two main factors; factor A exerted a significant effect (F(1, 28) =19.38, P=0.0001). Post hoc comparisons found significant differences between CNT and ETH and between ETH and QUE + ETH. The differences between QUE and the ethanol-treated rats (ETH and ETH + QUE groups) were also significant. No significant difference was found between CNT and QUE (Figure 3A). The ethanol treatment, in contrast, decreased the activity of catalase in PFC relative to the other three groups. Two-way ANOVA indicated a significant interaction (F(1, 28) =17.44, P<0.001) between the two main factors; both factors A (F(1, 28) =5.72, P=0.02) and B (F(1, 28) =4.52, P=0.046) showed significant effects. Post hoc comparisons found significant differences between CNT and ETH and between ETH and QUE + ETH. The difference between QUE and ETH was also significant. No significant difference was found between QUE and the other two groups (CNT, ETH + QUE) (Figure 3B). Similarly, ethanol administration decreased the activity of TAC in this brain region. Two-way ANOVA indicated a significant interaction (F(1, 28) =5.70, P=0.024) between the two main factors; both factors A (F(1, 28) =17.44, P=0.0003) and B (F(1, 28) =4.94, P=0.03) showed significant effects. Post hoc comparisons found significant differences between CNT and ETH and between ETH and QUE + ETH. The difference between QUE and ETH was also significant. No significant difference was found between QUE and the other two groups (CNT, ETH + QUE) (Figure 3C). The treatment, however, showed no effect on MDA levels and the activity of GPx and T-SOD in PFC (data not shown).
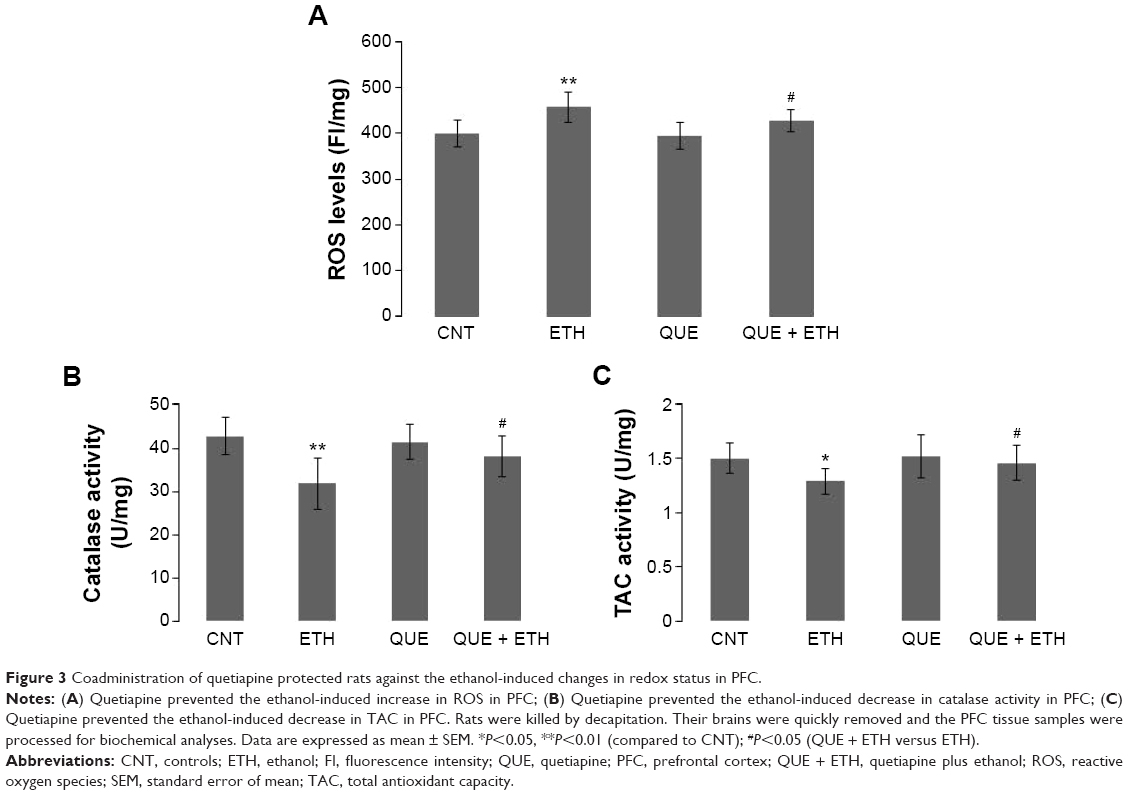 | Figure 3 Coadministration of quetiapine protected rats against the ethanol-induced changes in redox status in PFC. |
Quetiapine blocked the ethanol-induced oxidative stress in the hippocampus of rats
Ethanol administration for 1 week increased MDA levels in the hippocampus. Two-way ANOVA indicated a significant interaction (F(1, 28) =5.21, P=0.03) between the two main factors; both factors A (F(1, 28) =5.21, P=0.03) and B (F(1, 28) =4.68, P=0.04) showed significant effects. Post hoc comparisons found significant differences between CNT and ETH and between ETH and QUE + ETH. The differences between QUE and the ethanol-treated rats (ETH and ETH + QUE groups) were also significant. No significant difference was found between CNT and QUE (Figure 4A). Similar effects were also found for ROS levels (Figure 4B).
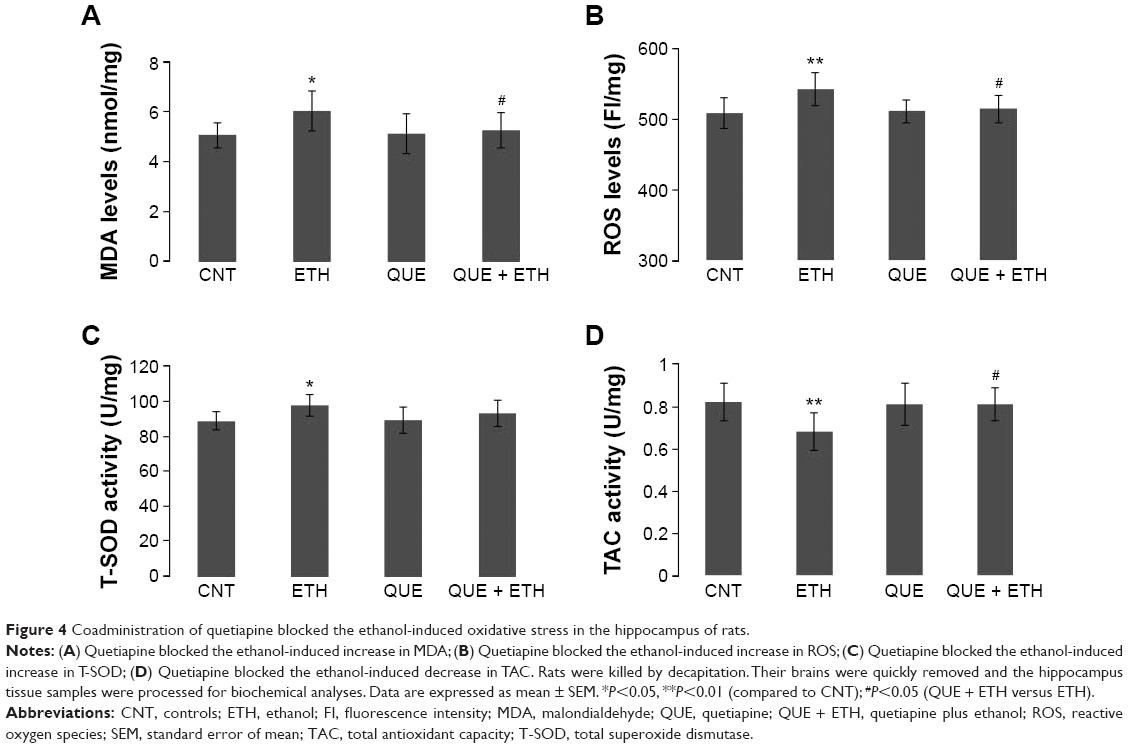 | Figure 4 Coadministration of quetiapine blocked the ethanol-induced oxidative stress in the hippocampus of rats. |
Interestingly, ethanol administration increased the activity of T-SOD in the hippocampus. Two-way ANOVA indicated a significant interaction (F(1, 28) =7.02, P=0.013) between the two main factors; factor A (F(1, 28) =7.02, P=0.013), but not B, showed a significant effect. Post hoc comparisons found a significant difference between CNT and ETH, but no difference between any other two groups (Figure 4C). Like in PFC, ethanol administration decreased the activity of TAC in the hippocampus. Two-way ANOVA indicated a significant interaction (F(1, 28) =4.28, P=0.04) between the two main factors; factor A (F(1, 28) =4.28, P=0.04), but not B, showed a significant effect. Post hoc comparisons found significant differences between CNT and ETH and between ETH and QUE + ETH. The difference between QUE and ETH was also significant. No significant difference was found between QUE and the other two groups (CNT, ETH + QUE) (Figure 4D). The treatment showed no effect on the activity of catalase and GPx in the hippocampus (data not shown).
Quetiapine blocked the ethanol-induced oxidative stress in the cerebellum of rats
Ethanol administration for 1 week increased MDA levels in the cerebellum. Two-way ANOVA indicated no significant interaction (F(1, 28) =3.60, P=0.06) between the two main factors; factor A (F(1, 28) =5.47, P=0.03), but not B, showed a significant effect. Post hoc comparisons found significant differences between CNT and ETH and between ETH and QUE + ETH. The difference between QUE and ETH was also significant. No significant difference was found between QUE and the other two groups (CNT, ETH + QUE) (Figure 5A). Similar effects were also found in ROS levels (Figure 5B).
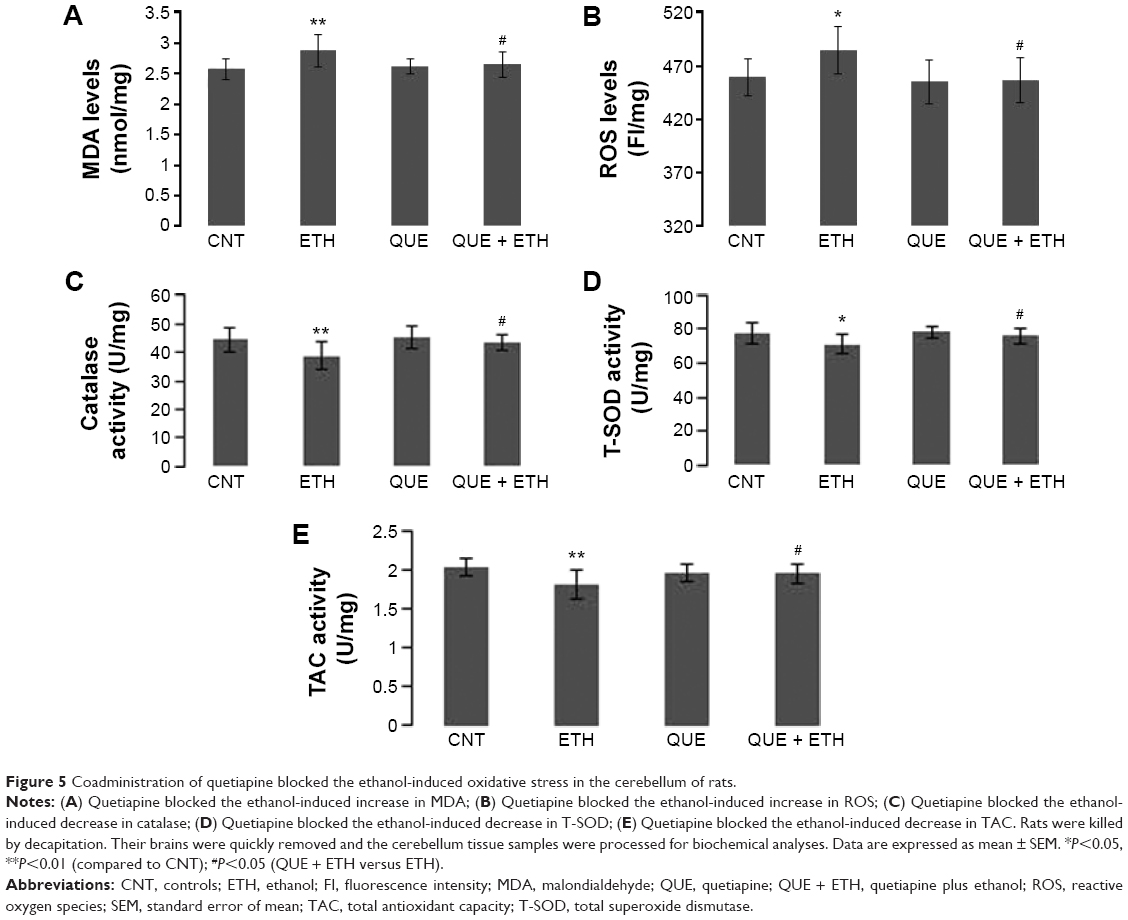 | Figure 5 Coadministration of quetiapine blocked the ethanol-induced oxidative stress in the cerebellum of rats. |
Like in PFC, ethanol administration decreased the activity of catalase in the cerebellum. Two-way ANOVA indicated no significant interaction (F(1, 28) =1.72, P=0.20) between the two main factors; factor A (F(1, 28) =7.72, P=0.009), but not B, showed a significant effect. Post hoc comparisons found a significant difference between CNT and ETH and between ETH and QUE + ETH. The difference between QUE and ETH was also significant. No significant difference was found between QUE and the other two groups (CNT, ETH + QUE) (Figure 5C). Similar effects were also found for the activity of T-SOD (Figure 5D) and TAC (Figure 5E). But the ethanol administration showed no effect on the activity of GPx in the cerebellum (data not shown).
Discussion
Ethanol administration for 1 week significantly inhibited the weight gain of rats, suggesting a toxic effect of ethanol on the metabolism of the subjects. This noxious effect was moderate as the ethanol-exposed rats had a positive weight gain, though small. More significantly, coadministration of quetiapine in the ethanol-exposed rats effectively ameliorated the weight gain decrease seen in ETH group, although significant differences existed between CNT and QUE + ETH. With this counteracting effect, quetiapine may make rats more tolerable to ethanol administration.
In accordance with previous studies,20,21 ethanol administration induced oxidative stress in the liver of rats, indicated by increased levels of MDA and ROS. It also decreased activity of GPx and TAC, but had no effect on the activity of catalase and T-SOD. These results suggest that ethanol targets GPx and TAC in the liver. Indeed, acetaldehyde reacts with hepatic GSH, which is a major cytosolic antioxidant in the liver, and causes depletion of GSH as introduced before.15,16 Unexpectedly, the increases in MDA and ROS were also seen in QUE + ETH group, suggesting the absence of a protective effect of quetiapine against the oxidative stress caused by ethanol. Neither did quetiapine have protective effect on the inhibiting effect of ethanol on TAC activity. But quetiapine did ameliorate the decrease in GPx activity caused by ethanol. Considering all these results, we may conclude that the protective effect of quetiapine on GPx in the liver is not sufficient to protect this organ against the noxious effects of ethanol. This conclusion is in line with the observations of weight gain during the ethanol administration week. However, it should be noted that only one dose of ethanol was used in this study. With this relatively high dose, ethanol might accumulate in the liver for clearance, thus keeping at a higher level (although we did not measure it). Future studies should examine the effects of quetiapine on the oxidative stress parameters of the liver treated with lower doses of ethanol.
Ethanol administration for 1 week increased ROS levels, but not MDA, in PFC, suggesting a mild toxic effect of this treatment on PFC. This is different from the oxidative stress seen in the liver of ethanol-exposed rats. The other differences between PFC and liver include: 1) ethanol administration for 1 week decreased the activity of catalase in PFC, whereas this enzyme was unimpaired in the liver; 2) the treatment decreased the activity of GPx in the liver, whereas this enzyme was unimpaired in PFC. All these results suggest the presence of different metabolic machineries responsible for the metabolism of ethanol in the liver and PFC. More significantly, the ethanol-induced ROS increase in PFC was completely blocked by coadministration of quetiapine, which also prevented the activity of catalase and TAC in this brain region from decrease due to ethanol-exposure. In a word, the noxious effect of ethanol on PFC is mild, and the protection of quetiapine is effective.
Unlike that in PFC, ethanol administration for 1 week caused oxidative stress in the hippocampus with the evidence of increased MDA and ROS and changed the activity of T-SOD and TAC. These results suggest that the hippocampus is more susceptible to ethanol than PFC. In line with this suggestion, the hippocampus was one of the brain regions most susceptible to chronic ethanol treatment with oxidative stress.38 But the damage to the hippocampus in the present study seems to be moderate and reversible as the ethanol-induced increases in MDA and ROS were completely blocked by the coadministration of quetiapine. Another supporting evidence is that ethanol-exposure significantly increased, rather than decreased, the activity of T-SOD in the hippocampus, suggesting a compensatory reaction. In line with these, the ethanol-induced changes in T-SOD and TAC were completely blocked by the coadministration of quetiapine.
Compared to the hippocampus and PFC, the ethanol-induced oxidative stress is most severe in the cerebellum, indicated by increased MDA and ROS and decreased activity of catalase, T-SOD, and TAC. The only unimpaired one was GPx. This conclusion confirms the specific sensitivity of the cerebellum to alcohol-induced toxicities seen in previous studies.39–41 Supporting evidence is also seen in human studies showing abnormalities of the cerebellum in patients with histories of alcohol dependence or abuse.42–44 Moreover, cerebellar atrophy was associated with greater daily ethanol consumption.45
Although the ethanol-induced oxidative stress in the cerebellum is severe as discussed earlier, coadministration of quetiapine completely blocked these noxious effects on this brain region. This effective protection in the cerebellum is contrasting to the no effect of coadministration of quetiapine on the ethanol-induced oxidative stress in the liver. This phenomenon suggests a neurophilic property of quetiapine. Indeed, coadministration of quetiapine completely blocked the ethanol-induced oxidative stress in all brain regions examined in this study. For this neurophilic property, this drug may also protect other brain regions against oxidative stress.
The mechanisms underlying the different effects of ethanol on the liver and brain are unknown and were not addressed in this study. However, a heuristic finding of the present study is that the activity of GPx in the liver was impaired by ethanol administration, but it was escaped in all examined brain regions. This finding reminded us of the results from previous studies that the ethanol-induced mitochondrial lipid peroxidation in the liver was insensitive to SOD, catalase, or hydroxyl radical scavengers, but was sensitive to GSH46 and that no change was found in the levels of GSH produced by acute ethanol in the three brain regions of frontal cortex, hippocampus, and striatum of juvenile and adult rats.47 In short, GSH and GPx are the main antioxidants that respond to ethanol in the liver, whereas catalase, SOD, and the other hydroxyl radical scavengers protect brain tissue against the ethanol intoxication. Therefore, quetiapine, via its ability to scavenge hydroxyl radicals as demonstrated in our previous study,30 effectively blocked the ethanol-induced oxidative stress in brain tissue, but not in the liver.
In summary, ethanol administration for 1 week induced oxidative stress in the liver, where GSH and GPx are main antioxidants responding to lipid peroxidation. Coadministration of quetiapine did not protect GPx in the liver against the noxious effect of ethanol, thus was unable to mitigate the ethanol-induced oxidative stress there. The ethanol-induced alteration in the redox status in PFC is mild, whereas the hippocampus and cerebellum are more susceptible to ethanol intoxication. For all the examined brain regions, coadministration of quetiapine exerted effective protection on the antioxidants catalase and T-SOD and the TAC, thus completely blocking the ethanol-induced oxidative stress in these brain regions. These protective effects may be attributed to the ability of quetiapine to scavenge hydroxyl radical as demonstrated in our previous study.30 These protective effects may explain the clinical observations that quetiapine reduced psychiatric symptoms intensity and maintained a good level of tolerability in chronic alcoholism with comorbid psychopathology.8,48,49
Acknowledgments
This research project was supported by grants from the Fund for Talents with Innovation in Medical Science and Technology of Henan Province (3052) and the Scientific Research Fund of Xinxiang Medical University (2013ZD116).
Disclosure
The authors report no conflicts of interests in this work.
References
Drake RE, Xie H, McHugo GJ, et al. The effects of clozapine on alcohol and drug use disorders among patients with schizophrenia. Schizophr Bull. 2000;26:441–449. | ||
Green AI, Burgess ES, Dawson R, et al. Alcohol and cannabis use in schizophrenia: effects of clozapine vs risperidone. Schizophr Res. 2003; 60:81–85. | ||
Zimmet SV, Strous RD, Burgess ES, et al. Effects of clozapine on substance use in patients with schizophrenia and schizoaffective disorders: a retrospective survey. J Clin Psychopharmacol. 2000;20:94–98. | ||
Littrell KH, Petty RG, Hilligoss NM, et al. Olanzapine treatment of patients with schizophrenia and substance abuse. J Subst Abuse Treat. 2001;21:217–221. | ||
Sattar SP, Grant K, Bhatia S, et al. Potential use of olanzapine in treatment of substance dependence disorder. J Clin Psychopharmcol. 2003;23:413–415. | ||
Monnelly EP, Ciraulo DA, Knapp C, et al. Quetiapine for treatment of alcohol dependence. J Clin Psychopharmacol. 2004;24:532–535. | ||
Sattar SP, Ucci B, Grant K, et al. Quetiapine as an adjunct in a substance abusing veteran with PTSD. Ann Pharmacother. 2002;36: 1875–1878. | ||
Martinotti G, Andreoli S, Di Nicola M, et al. Quetiapine decreases alcohol consumption, craving, and psychiatric symptoms in dually diagnosed alcoholics. Hum Psychopharmacol. 2008;23:417–424. | ||
Kampman KM, Pettinati HM, Lynch KG, et al. A double-blind, placebo-controlled pilot trial of quetiapine for the treatment of type A and type B alcoholism. J Clin Psychopharmacol. 2007;27:344–351. | ||
Imperato A, Di Chiara G. Preferential stimulation of dopamine release in the nucleus accumbens of freely moving rats by ethanol. J Pharmacol Exp Ther. 1986;239:219–228. | ||
Mereu G, Fadda F, Gessa GL. Ethanol stimulates the firing rate of nigral dopaminergic neurons in unanesthetized rats. Brain Res. 1984;292:63–69. | ||
Noble EP. Alcoholism and the dopaminergic system. Addict Biol. 1996;1:333–348. | ||
Koob G, Roberts A. Brain reward circuits in alcoholism. CNS Spectr. 1999;4:23–37. | ||
Pettinati HM, Oslin D, Decker K. Role of serotonin and serotonin-selective pharmacotherapy in alcohol dependence. CNS Spectr. 2000;5: 33–46. | ||
Lieber CS. Alcohol and the liver: metabolism of alcohol and its role in hepatic and extrahepatic diseases. Mt Sinai J Med. 2000;67:84–94. | ||
Quertemont E. Genetic polymorphism in ethanol metabolism: acetaldehyde contribution to alcohol abuse and alcoholism. Mol Psychiatry. 2004;9:570–581. | ||
Bailey SM, Cunningham CC. Contribution of mitochondria to oxidative stress associated with alcoholic liver disease. Free Rad Biol Med. 2002;32:11–16. | ||
Fernandez-Checa JC, Kaplowitz N. Hepatic mitochondrial glutathione: transport and role in disease and toxicity. Toxicol Appl Pharmacol. 2005;204:263–273. | ||
Szuster-Ciesielska A, Daniluk J, Kandefer-Szerszen M. Oxidative stress in the blood of patients with alcohol-related liver cirrhosis. Med Sci Monit. 2002;8:CR419–CR424. | ||
Aydin S, Ozaras R, Uzun H, et al. N-Acetylcysteine reduced the effect of ethanol on antioxidant system in rat plasma and brain tissue. Tohoku J Exp Med. 2002;198:71–77. | ||
Pushpakiran G, Mahalakshmi K, Anuradha CV. Taurine restores ethanol-induced depletion of antioxidants and attenuates oxidative stress in rat tissues. Amino Acids. 2004;27:91–96. | ||
Bailey SM, Robinson G, Pinner A, et al. S-Adenosylmethionine prevents chronic alcohol-induced mitochondrial dysfunction in the rat liver. Am J Physiol. 2006;291:G857–G867. | ||
Anuradha CV, Vijayalakshmi S. The effects of L-Cysteine on tissue lipid peroxidation and antioxidants in experimental ethanol toxicity. Med Sci Res. 1995;23:699–702. | ||
Bai O, Wei Z, Lu W, et al. Protective effects of atypical antipsychotic drugs on PC12 cells after serum withdrawal. J Neurosci Res. 2002;69: 278–283. | ||
Qing H, Xu H, Wei Z, et al. The ability of atypical antipsychotic drugs vs haloperidol to protect PC12 cells against MPP+-induced apoptosis. Eur J Neurosci. 2003;17:1563–1570. | ||
Wang H, Xu H, Dyck LE, et al. Olanzapine and quetiapine protect PC12 cells from β-amyloid peptide(25–35)-induced oxidative stress and the ensuing apoptosis. J Neurosci Res. 2005;81:572–580. | ||
Wei Z, Mousseau DD, Richardson JS, et al. Atypical antipsychotics attenuate neurotoxicity of β-amyloid(25–35) by modulating Bax and Bcl-X(l/s) expression and localization. J Neurosci Res. 2003;74:942–927. | ||
Boraldi F, Annovi G, Paolinelli-Devincenzi C, et al. The effect of serum withdrawal on the protein profile of quiescent human dermal fibroblasts in primary cell culture. Proteomics. 2008;8:66–82. | ||
Jung TW, Lee JY, Shim WS, et al. Rosiglitazone protects human neuroblastoma SH-SY5Y cells against MPP+ induced cytotoxicity via inhibition of mitochondrial dysfunction and ROS production. J Neurol Sci. 2007;253:53–60. | ||
Xu H, Wang H, Zhuang L, et al. Demonstration of an anti-oxidative stress mechanism of quetiapine: implications for the treatment of Alzheimer’s disease. FEBS J. 2008;275:3718–3728. | ||
Davis PC, Wong J, Gefvert O. Analysis and pharmacokinetics of quetiapine and two metabolites in human plasma using reversed-phase HPLC with ultraviolet and electrochemical detection. J Pharm Biomed Anal. 1999;20:271–282. | ||
Xu H, Qing H, Lu W, et al. Quetiapine attenuates the immobilization stress-induced decrease of brain-derived neurotrophic factor expression in rat hippocampus. Neurosci Lett. 2002;321:65–68. | ||
Xu H, Chen Z, He J, et al. Synergetic effects of quetiapine and venlafaxine in preventing the chronic restraint stress-induced decrease in cell proliferation and BDNF expression in rat hippocampus. Hippocampus. 2006;16:551–559. | ||
Sid B, Verrax J, Calderon PB. Role of AMPK activation in oxidative cell damage: implications for alcohol-induced liver disease. Biochem Pharmacol. 2013;86:200–209. | ||
Zorumski CF, Mennerick S, Izumi Y. Acute and chronic effects of ethanol on learning-related synaptic plasticity. Alcohol. 2014;48:1–17. | ||
Luo J. Mechanisms of ethanol-induced death of cerebellar granule cells. Cerebellum. 2012;11:145–154. | ||
Trantham-Davidson H, Burnett EJ, Gass JT, et al. Chronic alcohol disrupts dopamine receptor activity and the cognitive function of the medial prefrontal cortex. J Neurosci. 2014;34:3706–3718. | ||
Woodford FP, Whitehead TP. Is measuring serum antioxidant capacity clinically useful? Ann Clin Biochem. 1998;35:48–56. | ||
Zhong Y, Dong G, Luo H, et al. Induction of brain CYP2E1 by chronic ethanol treatment and related oxidative stress in hippocampus, cerebellum, and brainstem. Toxicology. 2012;302:275–284. | ||
Celec P, Jáni P, Smreková L, et al. Effects of anabolic steroids and antioxidant vitamins on ethanol-induced tissue injury. Life Sci. 2003;74:419–434. | ||
Heaton MB, Madorsky I, Paiva M, et al. Ethanol-induced reduction of neurotrophin secretion in neonatal rat cerebellar granule cells is mitigated by vitamin E. Neurosci Lett. 2004;370:51–54. | ||
Xia J, Simonyi A, Sun GY. Chronic ethanol and iron administration on iron content, neuronal nitric oxide synthase, and superoxide dismutase in rat cerebellum. Alcohol Clin Exp Res. 1999;23:702–707. | ||
Cavanagh JB, Holton JL, Nolan CC. Selective damage to the cerebellar vermis in chronic alcoholism: a contribution from neurotoxicology to an old problem of selective vulnerability. Neuropathol Appl Neurobiol. 1997;23:355–363. | ||
Sullivan EV, Deshmukh A, Desmond JE, et al. Cerebellar volume decline in normal aging, alcoholism, and Korsakoff’s syndrome: relation to ataxia. Neuropsychology. 2000;14:341–352. | ||
Sullivan EV, Deshmukh A, Desmond JE, et al. Contribution of alcohol abuse to cerebellar volume deficits in men with schizophrenia. Arch Gen Psychiatry. 2000;57:894–902. | ||
Brown ES, Garza M, Carmody TJ. A randomized, double-blind, placebo-controlled add-on trial of quetiapine in outpatients with bipolar disorder and alcohol use disorders. J Clin Psychiatry. 2008;69:701–705. | ||
Kukielka E, Dicker E, Cederbaum AI. Increased production of reactive oxygen species by rat liver mitochondria after chronic ethanol treatment. Arch Biochem Biophys. 1994;309:377–386. | ||
García-Valdecasas-Campelo E, González-Reimers E, Santolaria-Fernández F, et al. Brain atrophy in alcoholics: relationship with alcohol intake, liver disease, nutritional status, and inflammation. Alcohol Alcohol. 2007;42:533–538. | ||
Longoria J, Brown ES, Perantie DC. Quetiapine for alcohol use and craving in bipolar disorder. J Clin Psychopharmacol. 2004;24:101–102. |
 © 2015 The Author(s). This work is published and licensed by Dove Medical Press Limited. The full terms of this license are available at https://www.dovepress.com/terms.php and incorporate the Creative Commons Attribution - Non Commercial (unported, v3.0) License.
By accessing the work you hereby accept the Terms. Non-commercial uses of the work are permitted without any further permission from Dove Medical Press Limited, provided the work is properly attributed. For permission for commercial use of this work, please see paragraphs 4.2 and 5 of our Terms.
© 2015 The Author(s). This work is published and licensed by Dove Medical Press Limited. The full terms of this license are available at https://www.dovepress.com/terms.php and incorporate the Creative Commons Attribution - Non Commercial (unported, v3.0) License.
By accessing the work you hereby accept the Terms. Non-commercial uses of the work are permitted without any further permission from Dove Medical Press Limited, provided the work is properly attributed. For permission for commercial use of this work, please see paragraphs 4.2 and 5 of our Terms.