")
Back to Journals » International Journal of Nanomedicine » Volume 9 » Issue 1
Photoprotective effects of apple peel nanoparticles
Authors Bennet D, Kang SC, Gang J, Kim S
Received 5 September 2013
Accepted for publication 12 October 2013
Published 18 December 2013 Volume 2014:9(1) Pages 93—108
DOI https://doi.org/10.2147/IJN.S54048
Checked for plagiarism Yes
Review by Single anonymous peer review
Peer reviewer comments 2
Devasier Bennet,1 Se Chan Kang,2 Jongback Gang,3 Sanghyo Kim1,4
1Department of Bionanotechnology, 2Department of Life Science, 3Department of Nano Chemistry, Gachon University, Bokjeong-Dong, Sujeong-Gu, Seongnam-Si, Gyeonggi-Do, Republic of Korea; 4Graduate Gachon Medical Research Institute, Gil Medical Center, Inchon, Republic of Korea
Abstract: Plants contain enriched bioactive molecules that can protect against skin diseases. Bioactive molecules become unstable and ineffective due to unfavorable conditions. In the present study, to improve the therapeutic efficacy of phytodrugs and enhance photoprotective capability, we used poly(D,L-lactide-co-glycolide) as a carrier of apple peel ethanolic extract (APETE) on permeation-enhanced nanoparticles (nano-APETE). The in vitro toxicity of nano-APETE-treated dermal fibroblast cells were studied in a bioimpedance system, and the results coincided with the viability assay. In addition, the continuous real-time evaluations of photodamage and photoprotective effect of nano-APETE on cells were studied. Among three different preparations of nano-APETE, the lowest concentration provided small, spherical, monodispersed, uniform particles which show high encapsulation, enhanced uptake, effective scavenging, and sustained intracellular delivery. Also, the nano-APETE is more flexible, allowing it to permeate through skin lipid membrane and release the drug in a sustained manner, thus confirming its ability as a sustained transdermal delivery. In summary, 50 µM nano-APETE shows strong synergistic photoprotective effects, thus demonstrating its higher activity on target sites for the treatment of skin damage, and would be of broad interest in the field of skin therapeutics.
Keywords: apple peel ethanolic extract, antioxidant, cellular uptake, electric cell-substrate impedance sensing, phyto-drugs, light-induced damage
Introduction
Recently, the environmental incidence and mortality of human skin carcinogens have continued to rise. Solar radiation causes skin photo-oxidative damage, including premature aging of the skin, melanomas, and nonmelanoma skin cancers.1–6 Intense light from the sun can penetrate human skin cells due to the presence of chromophores, which absorb light radiation,7 resulting in cellular damage and photo-oxidative stress. Further, some cellular organelles are easily affected by high-energy radiation and Q-bands of longer wavelength due to high chromophore content.8,9 The photodynamic elevation of free radicals is due to the combination of radiation with low oxygen levels, which can cause oxidative stress and damage.10 Collectively, these reports suggest that the radiation-induced damage to human skin can be attributed to photo-oxidative mechanisms mediated by the elevation of free radicals.11,12 Therefore, free radical scavenging is an important strategy for drug screening as well as development of photoprotective activity.13,14 Numerous investigations have confirmed a minimum level of photoprotection in animal and human models, and the inhibition of photocarcinogenesis by various compounds was recently observed.15 Although the onset of photo-oxidative skin diseases can often be prevented with correct treatment, only a few therapeutic agents are available so far. Further, the curable effects of antioxidants and other therapeutic agents are insufficient due to their temporary state as well as photoirradiation, oxidative, and environmental degradation effects.16 For these reasons, the intervention against radiation toxicity remains a challenge in dermatological fields. In search of the most suitable candidate compounds against light-induced diseases, we used a light-induced human dermal fibroblast neonatal (HDFn) cell model and a real-time continuous measurement system. Bennet and Kim have developed the real-time light setup with electric cell-substrate impedance sensing (ECIS), a model for continuous monitoring of light-induced changes in cells.17 The proposed model is an ideal system for real-time continuous monitoring of HDFn cell behavior study with various natural drug concentrations, and this system imitates the in vivo environment.
Natural products can play an important adjuvant role in photo-oxidative mechanisms for the prevention of early stage degenerative skin diseases. Numerous studies have been conducted to improve the absorption of natural products through the skin, which is a suitable route for the application of photoprotective agents since the skin is a target site for photo-oxidative stress-related damage.18,19 However, few studies have tested for the photoprotective effects of natural product extracts nanoencapsulated with biodegradable polymers. The investigation of a synthetic polymer such as poly(D,L-lactide-co-glycolide) (PLGA)20 has been invaluable in demonstrating their adaptability to drug delivery.21 Also, PLGA exhibits low toxicity and more compatibility for encapsulation of a natural product to achieve high efficacy of drug delivery as a natural product–loaded PLGA nanoparticle.
Apple is a pomaceous fruit species of Malus domestica in the Rosaceae family. Apples possess abundant therapeutic benefits, and apple peels are highly packed with powerful polyphenols and antioxidants. These disease-fighting compounds can help to prevent and repair oxidative damage. Therefore, we chose to further study the health benefits of apple peels. Apple peels are robust in bioactive compounds, but the apple peel ethanolic extract (APETE) can provide more than 90% of phenolics, anthocyanins, and flavonols, which are more useful in rejuvenating skin-related damage and diseases.22 Nanopreparations have been previously applied to improve the therapeutic efficacy of various phytodrugs. The present research has been conducted to formulate and develop new strategies to improve the therapeutic efficacy of natural product delivery. In order to improve the efficacy of APETE-loaded nanoparticle (nano-APETE) delivery, the present research utilizes the permeation-enhanced nanoencapsulation of APETE based on PLGA. Then the nano-APETE was utilized in a photo-oxidative stress study on HDFn cells using the ECIS system. In this study, light-induced behavior and viability were addressed, and the effect of nano-APETE on light-induced HDFn cell damages was monitored by the ECIS system. Further, the prepared nano-APETE formulations were applied to examine their physicochemical characteristics, effects on cellular uptake, and in vitro bioactivity. Light radiation–induced HDFn cell responses (attachment, proliferation, and mitosis during cell culture) against different concentrations of nano-APETE were measured using a real-time ECIS system. The nano-APETE was evaluated for transdermal drug delivery and compared with raw drugs.
Materials and methods
Materials
Apple fruit peels (Malus pumila var dulcissima) were obtained from Munkyong, South Korea. Medium-106, low serum growth supplement, trypsin-ethylenediaminetetraacetic acid solution, and penicillin-streptomycin were purchased from Life Technologies (Carlsbad, CA, USA). HDFn cells, retinal ganglion cells (RGC-5) and phosphate buffered saline (PBS) were purchased from Life Technologies. Tetramethylrhodamine isothiocyanate mixed isomers (TMR), poly(D,L-lactide-co-glycolide), dimethyl sulfoxide, Tween-20 (T-20), 1,1-Diphenyl-2-picryhydrazyl (DPPH), and oleic acid were purchased from Sigma-Aldrich (St Louis, MO, USA). Trypan blue dye was purchased from Alfa Aesar (Ward Hill, MA, USA). The other chemicals used were of pharmaceutical grade. Milli-Q water (18.2 MΩ) was used throughout the experiment.
Preparations of APETE
Apple fruits were washed with water to remove any impurities such as sand, after which the apple peels were separated from the flesh. The peels were dried in a light shadow at room temperature. Dried apple peels were then crushed and percolated in 70% ethanol solvent at room temperature, after which the extract was filtered (Whatman filter paper, Sigma-Aldrich, St. Louis, MO, USA), centrifuged (4,000 rpm, 15 minutes), concentrated using a rotary vacuum evaporator under reduced pressure at 45°C±5°C, and dried for 24 hours to obtain an APETE powder.
Synthesis of nano-APETE
Nano-APETE was prepared through an emulsion solvent evaporation method with slight modifications.23,24 Figure 1 shows a schematic diagram of the nano-APETE preparation by the emulsion solvent evaporation method. The basic composition of a preparation system comprising a stable quantity of active/other ingredients and different concentrations of anionic surfactants was used to prepare the nano-APETE. Nano-APETE was synthesized using different phases (organic phases containing PLGA and aqueous phases containing T-20) with a permeation enhancer (PE). Optimization and development of stable, uniform, and smooth particles can be carried out by modifying the anionic surfactant (T-20) concentration. Briefly, 150 mg of PLGA was dissolved in 3 mL of acetone, after which the dissolved solution was agitated at a constant speed in a vortex mixer for 3 minutes. Then, 2 mL of the APETE solution (250 μg/mL) was vortexed with PLGA solution for 2 minutes to obtain a primary emulsion. The primary emulsion was then re-emulsified with 10 mL of water containing T-20 (at ratios of 0.06, 0.04, and 0.02% w/v; formulations were named F1, F2, and F3, respectively) solution under magnetic stirring at 2,500 rpm for 1 hour in order to generate a crude PLGA-APETE nanoemulsion. The preparation variables (0.02, 0.04, and 0.06% w/v) were optimized to obtain monodispersed uniform nanoparticles. Initial nanoparticles were lipid-coated with PE (oleic acid; 4% w/v) using sonication. PE was added to the crude emulsion, followed by sonication for 15 minutes. The sonication process was carried out by probe sonicator (VCX750; Sonics and Materials Inc., Newtown, CT, USA) at 40% amplitude, 20 kHz frequency, and utilized an on/off cycle. Sonication is a crucial step for nanoformulation, as it can raise the temperature and inactivate active ingredients. Therefore, we utilized an ice bath to maintain temperature. The color gradually changed to a milky white yellowish color. The final preparation was diluted by the addition of Milli-Q water up to a volume of 50 mL. Finally, acetone was removed by rotary evaporation at 40°C under reduced pressure, after which the concentrated aqueous phase containing nano-APETE was centrifuged, washed, freeze-dried, and stored at 4°C for further experiments.
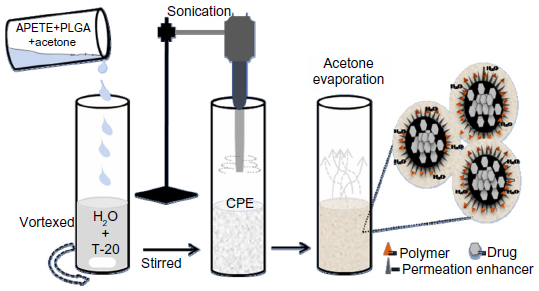 | Figure 1 Schematic diagram represents the nanoparticle preparation by emulsion solvent evaporation technique. |
Physicochemical characterization of nano-APETE
Field emission scanning electron microscopy (FE-SEM; JEOL-ISM-7500F, JEOL USA, Peabody, MA, USA) was employed to study the morphology of nano-APETE. Samples were mounted on double-sided adhesive carbon tape on a metal stub, which was platinum-sputtered for 80 seconds under a vacuum. The samples were examined for their morphology at 15 kV. Photon correlation spectroscopy (DLS; Malvern Zetasizer Nano ZS series, Malvern Instruments, Malvern, Worcestershire, UK) was employed to determine the size distribution, zeta potential, and polydispersity index (PI) of the samples. Measurements were preformed with a laser at 488 nm, 25°C, and a scattering angle of 90°. Sample distributions were diluted 1:10 with the aqueous phase to obtain suitable kilocounts per second.
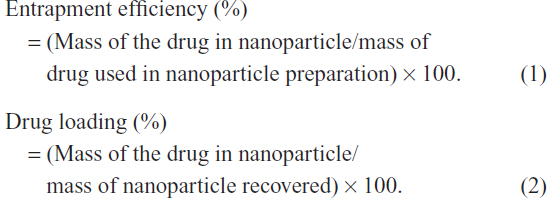
Ultraviolet-visible (UV-Vis) absorption spectroscopy measurement was conducted to determine the characteristic absorbance peak of APETE at 282 nm (Figure S1A). A standard curve was plotted using various concentrations of APETE (Figure S1B). To calculate the drug loading and entrapment efficacy, the nanoparticles were suspended in 50 mL of dimethyl sulfoxide and then subjected to ultracentrifugation at 20,000 rpm for 30 minutes. The concentration of drug present in the supernatant was elucidated from the standard curve using spectrophotometry. The loading and entrapment efficiencies were determined using the following formulas:
All experiments were performed in triplicate.
Identification of phytochemicals
The bioactive compounds of APETE were identified by gas chromatography-mass spectrometry (GC-MS) using an Agilent 7890A Network GC system consisting of a 5975C Network mass selective detector equipped with an MPS2 series automated liquid sampler (Agilent Technologies, Santa Clara, CA, USA). The entire system was controlled by Chemstation® Software (Agilent Technologies). Instrument operational conditions were an automatic split injection volume of 2 μL and a port temperature of 250°C. Helium gas was used as a carrier flow at a constant pressure of 135 kPa. An HP-5MS column (0.25 mm × 30 m × 0.25 um) at a flow of 1.0 mL/minute was used to analyze the samples.
In addition, the prepared nano-APETE formulations were analyzed and compared with standard pectin by high-performance liquid chromatography (HPLC) (Shimadzu LCCBM-20A with PDA detector, Shimadzu Co, Kyoto, Japan) with a Synergi Fusion RP80A column (4 μm, 250 × 4.6 mm, Phenomenex, Torrance, CA, USA). Solvents 1) acetonitrile containing 0.1% formic acid, and 2) 96/2.5/1.5 (water/acetonitrile/formic acid) were used at a flow rate of 1.0 mL/minute to analyze the samples. The sample injection volume was 10 μL, and the wavelength detection range was from 200–540 nm. Pectin was identified based on retention time and maximum absorbance.
Determination of nontoxic nano-APETE concentrations
To evaluate the HDFn cells survival effects on nano-APETE, we used the WST-1 assay kit to examine the toxic effects of nano-APETE at various concentrations of three formulations (F1, F2, and F3). HDFn cells were taken after 48 hours from subconfluent cultures. Cells at a density of 2 × 10⁴ cells/well were then subjected to cytotoxicity measurement in 96-well plates containing 100 μL of culture medium for 24 hours. All preparations were dispersed in fresh medium at various concentrations (5, 10, 50, 100, 250, 750, and 1,000 μM/mL−1) to all wells after replacing the initial culture medium. The positive and negative controls were maintained for three different concentrations of T-20 (0.02 for F1, 0.04 for F2, and 0.06 % w/v T-20 for F3 samples) to check the anionic surfactant concentration effect. After 3 days, HDFn cells were screened using a WST-1 toxicity test kit. WST-1 solution (10 μL) was added to all wells and incubated for 1 hour, after which the optical density was quantified using an ELISA plate reader at 480 nm. All experiments were performed in triplicate.
In vitro cell behavioral and toxicity study by ECIS
ECIS was used to measure changes in cell activity during cell attachment, spreading, and movement, as previously reported by Giaever and Keese25 and Keese et al.25,26 Computer software, 8W10E arrays, and a lock-in amplifier were obtained from Applied Biophysics (Troy, NY, USA). Protein-precoated electrodes (8 W10E) were used; 250 μL of Medium-106 was added to wells containing microelectrodes, a detection electrode was joined to a common gold counter electrode, and all electrodes were joined to one end of the culture chip. The chip was then connected to the lock-in amplifier and incubated at 37°C for 20 minutes in order to measure the background impedance value (Z0). Data acquisition and processing were performed using Applied Biophysics software. Responses of HDFn cells during culture in different concentrations of F1 preparation (monodispersed particles with a uniform size distribution and maximum cell survival concentrations) were measured by high-throughput screening testing. Cells at a density of 5 ×10⁵ cells/well were seeded on an eight-well ECIS chip with different concentrations of F1 preparation (5, 10, 50, 100, 250, 750, and 1,000 μM), after which the volume of each well was adjusted to 400 μL using culture medium. This system was used to provide relevant physical information by measuring the electrical impedance of cells according to the concentrations of F1 sample. The impedance-based cell study was performed over 3 days. When cells were exposed to high (toxic level) concentrations of drugs, the impedance values decreased due to total cell mortality.
MTT measurement and cell viability on microelectrodes
Simultaneously, cell viability was calculated by MTT assay and using live/dead staining dye kit for quantitative and qualitative estimation of HDFn cells grown on microelectrodes, respectively. After 3 days of incubation, cell viability was quantified using MTT assay reagent (followed the manufacturer’s protocol). For live/dead staining, 1 μL each of A Live-dye, a cell-permeable green fluorescent dye, and B propidium iodide, a cell nonpermeable red fluorescent dye, were mixed with 1,000 μL of dilution buffer. The stained, cultured microelectrode was examined by fluorescence microscopy. Control wells were examined in the same experiments, and all experiments were performed in triplicate.
Photoprotective effects in real-time
ECIS was used to measure the changes in the photoprotective activity in vitro, as previously reported by Bennet et al.17 Precise amounts of HDFn cells were seeded to each electrode well, after which volume was adjusted to 400 μL using culture medium. Cells adhered to the surface of the electrode after 10 hours of incubation, resulting in confluence. After 24 hours, fresh medium containing various concentrations of F1 preparation (media concentration, from 10–50 μM) were added by replacing the initial cultured medium. Cultured wells were then exposed to light under normal culture environmental conditions. Irradiation wavelength in the visible region (400–700 nm) was measured using a Spectroradiometer (CS-1000, Konica Minolta, Tokyo, Japan). The real-time light exposure set up was used as described previously.27 All the controllers were operated from outside of the incubator; monitoring of impedance typically lasted about 48 hours, with similar times and conditions for positive (without any drugs or light treatment) and negative (without drug treatment) controls. Changes in cell activity resulting from exposure to light were reflected as impedance signals, which were registered by the ECIS.
Antioxidant activities of nano-APETE using DPPH
Simultaneously, the antioxidant activities of various concentrations of nano-APETE were quantitatively measured based on the DPPH radical scavenging activity, in which the HDFn cells were grown on microelectrodes. We quantitatively evaluated the scavenging capacity of encapsulated nano-APETE to inhibit the production of free radicals,28 with slight modifications. After 24 hours, different concentrations of nano-APETE were added. At the end of the experiment, about 48 hours later (after 24 hours of drug treatment), the electrode wells containing HDFn cells were mixed with 100 μL of a 0.001% ethanolic DPPH solution. The samples were then incubated for 15 minutes in the dark environment at room temperature; after 15 minutes the absorbance was read at 515 nm using a UV-Vis spectrophotometer. DPPH radical scavenging activity was calculated by the following equation:

Ethanol was used as a blank. Control wells were also maintained for positive (without any drugs or light treatment) and negative (without drug treatment) controls. All experiments were performed in triplicate.
Cellular uptake of nano-APETE
Cellular uptake of nano-APETE by HDFn and RGC-5 cells were studied. Cells were taken after 24 hours from subconfluent cultures, and then seeded to six-well culture plates containing 3 mL of medium, followed by incubation at 37°C as a normal culture environment. After 24 hours, fresh media containing different concentrations of nanoparticle prepared from tetramethylrhodamine isothiocyanate mixed isomer-labeled nano-APETE were added by replacing the initial cultured medium, and then incubated for 6 hours. Also maintained were three control experiments to compare the cell uptake: one for tetramethylrhodamine isothiocyanate only, one for nano-APETE only, and the third without added nano-APETE. After incubation, cells were washed with medium and PBS in order to remove excess nano-APETE. Cells were then examined under a fluorescence microscope and the images were captured. The color of the fluorescence emitted by the nano-APETE was dotted red. This experiment was repeated several times; the data presented here are the average standard values.
Ex vivo release study
Drug release study was performed using Franz diffusion cells with a human cadaver skin model. The human cadaver skin (back thigh, 40-year-old male) samples, 3 cm2, were obtained from Hans Biomed Corp, Sungdong-gu, Seoul, Korea, and were placed between the donor and receiver compartments such that its stratum corneum layer faced up. PBS medium (15 mL, containing 1% T-20, pH 7.4) was placed in the receiver compartment, and the donor compartment was filled with 1.0 mL of F1 preparation and raw extract (APETE). The sample preparations were adjusted to 5% drug concentration for all experiments. This setup was kept in an immersed state, and temperature was maintained at 37°C±0.5°C; the mixture was agitated with magnetic stirring at 100 rpm during the experiment. Samples (1.0 mL) were collected from the receiver compartment at different time intervals (0, 1, 2, 4, 8, 12, 24, 36, 48, 60, 72, 84, and 96 hours) and replaced with the same quantity of fresh saline solution. The collected samples were analyzed by UV/Vis spectrophotometer (Optizen 3220, Optizen Labs, Warszawa, Poland) at 282 nm.
Statistical analysis
All statistical analyses employed GraphPad software (GraphPad Software, La Jolla, CA, USA). One-way analysis of variance was performed with a 95% confidence interval followed by Tukey multiple comparison tests; results are presented as mean ± standard deviation. The results were considered statistically significant at P<0.05. All error bars show the standard deviation; n=3 for all cases.
Results and discussion
Preparation and characterization of nano-APETE
The nano-APETE was synthesized by a simple solvent evaporation technique. This method was used to generate natural product–loaded nano-APETE. Figure 2 shows the FE-SEM image of APETE-loaded particles with various sizes. The F1 preparation (Figure 2A) of nano-APETE size (94.6±25 nm) was smaller than other preparations, as size increased to approximately 169.6±32 nm for the F2 preparation (Figure 2B), followed by 179.9±49 nm for the F3 preparation (Figure 2C). Different preparations of nano-APETE were found to be 90–180 nm in size. Table 1 shows the physicochemical properties and percentages of drug entrapment for all preparations. It shows the high negative zeta potentials for all preparations. But the F1 preparation showed a monodispersion of uniform spherical particles with no aggregation. However, Figure 2B and C show slight aggregation as well as a variety of particle sizes. To reduce the aggregation of small particles, we used T-20, which was previously reported.29,30 The lowest concentration of T-20 preparation shows better particles, possibly due to controlling the lipid coat of oleic acid present in the preparations. PI measures the size distribution of the population. The PI result reveals that F1 formulation shows homogeneous distribution, and the increased concentration of T-20 shows slight aggregation with constant oleic acid concentration. It means that the lesser concentration of surfactant gave comparatively steadier particles by incorporation of the hydrophobic core. The increased ratio of T-20 shows decreased PI value, which increases heterogeneity, it is due to the ratio of oleic acid and T-20 concentration. Particularly, the 0.02% w/v T-20 with oleic acid 4% w/v concentration of F1 sample would be promoted to the high stability which prevents the aggregation of nanoparticles. The nano-APETE size highly depends on the ratios of the surfactants balance (hydrophilic–T-20 and lipophilic–oleic acid), probably due to the de-protonation of −OH group from oleic acid. Hence, the surface charge of the formed nano-APETE (F1) shows a strong negative charge resulting from the de-protonation of the −OH group of oleic acid and COOH groups of nanoparticle surface during formulation. PI for all samples holds less than 0.160 with high negative zeta potential (−29.8). At decreased concentrations of T-20, the PI values were increased, which indicates the formation of monodispersed particles with uniform distribution. The appropriate uniform nano-APETE formation is directly dependent on the concentration of oleic acid and surfactant. The increased ratio of T-20 shows increases in the PI value and indicates the nano-APETE have uniformity.
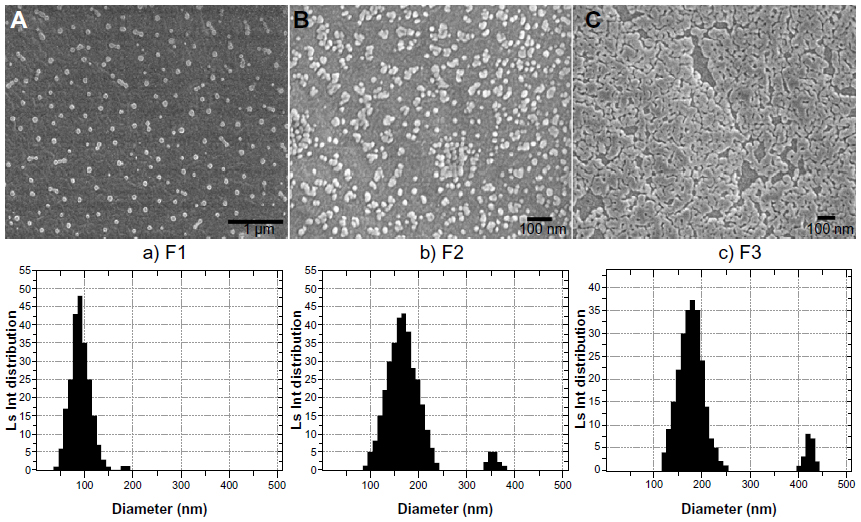 | Figure 2 Particle size analyses of permeation-enhanced APETE-loaded nanoparticles. |
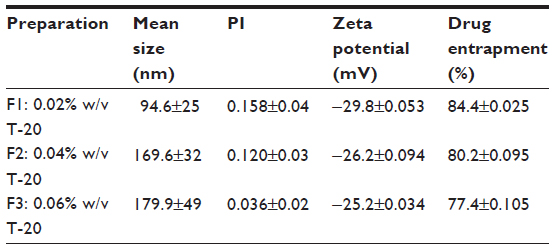 | Table 1 Physicochemical properties and percentages of drug entrapment for all preparations |
The maximum absorbance levels of supernatants of the APETE-loaded polymeric nanoparticles were used for drug quantification. Drug entrapment is generally based on the ionic charge of the surfactant, polymer, oleic acid, and drug ratios. High negative surface charge (high negative zeta potential; F1 preparation) resulted at the interface with displacement of drug from organic to aqueous phase. Elevation of high negative surface-charge improves particle characteristics as well as drug encapsulation. However, drug encapsulation is directly related to the presence of water-insoluble bioactive compounds present in the organic phase.31 The high polymer content with suitable surfactant concentration that encapsulates a maximum amount of drugs could explain the higher entrapment efficiency.32 Each value reported is the mean of three independent measurements. Figure 2 and Table 1 reveal that the F1 preparation produced a monodispersed, spherically uniform nanosized particle. Hence, this preparation could have an excellent storage capability and could be used for further study.
Identification of phytochemicals
A total of six compounds produced by APETE were identified by GC-MS (Table 2). The chromatogram obtained from the sample is not shown. The majority of compounds were highly branched with hydroxyl, methyl, alcohol, and aldehyde groups. Generally, the natural compound has complex molecules, which consist mainly of long chain acid resides. The acid groups along the chain are largely esterifed with methoxy groups. In pectin, D-galacturonic acid units were connected by 1→ 4 linkages with a highly branched polysaccharide. The most abundant substance was found to be most likely pectin, with some other compounds. Enriched compounds of nano-APETE were identified by HPLC, as shown in Figure S2, and ensured the product quality. Figure S2 reveals that the structures of pectin present in nano-APETE coincided with those of standard apple pectin.
 | Table 2 Compounds identified in apple peel ethanolic extracts, as analyzed by GC-MS |
Determination of nontoxic nano-APETE concentrations
In order to select the safest, nontoxic and cell compatible concentrations of nano-APETE formulation, we utilized F1, F2 and F3 samples for the cell survival study over 3 days. All three preparations were subjected to cytotoxicity screening using the WST-1 method. Cytotoxic activities of the F1, F2, and F3 preparations were analyzed, along with the viabilities and proliferation rates of nano-APETE-treated HDFn cells. Cell survival over 3 days in response to different concentrations of nano-APETE is presented in Figure 3. As the concentration of nano-APETE increased, the cell survival decreased. Mitochondrial activities indicate that the F2 and F3 preparations were more cytotoxic to cells than the F1 preparations. We used three different concentrations of T-20 in order to find the toxicity effect to cell viability. These 0.02, 0.04, and 0.06% w/v T-20 concentrations did not affect their cell viability because these are negligible concentrations to make the formulation; the conclusion is that this concentration of T-20 does not affect the cell viability. However, exposure to various concentrations of nano-APETE affected cell viability levels. Particularly, cell exposure to nano-APETE for 1 or 2 days showed no change in cell survival compared to control (data not shown). But the cells were exposed to nano-APETE for 3 days, which resulted in the dose-dependent suppression of cell growth due to the destruction of cellular components. Particularly, the F1 preparation at <100 μM concentration showed maximum drug cell activity; thus, the F1 sample was established as a nontoxic, safer concentration among the three preparations. Effective doses that are lower than the toxic concentration of F1 sample are well tolerated and thus used for further study using a real-time, noninvasive, and continuously online ECIS evaluation. By extension, the results of the WST-1 method were appropriate and could be compared with those of ECIS.
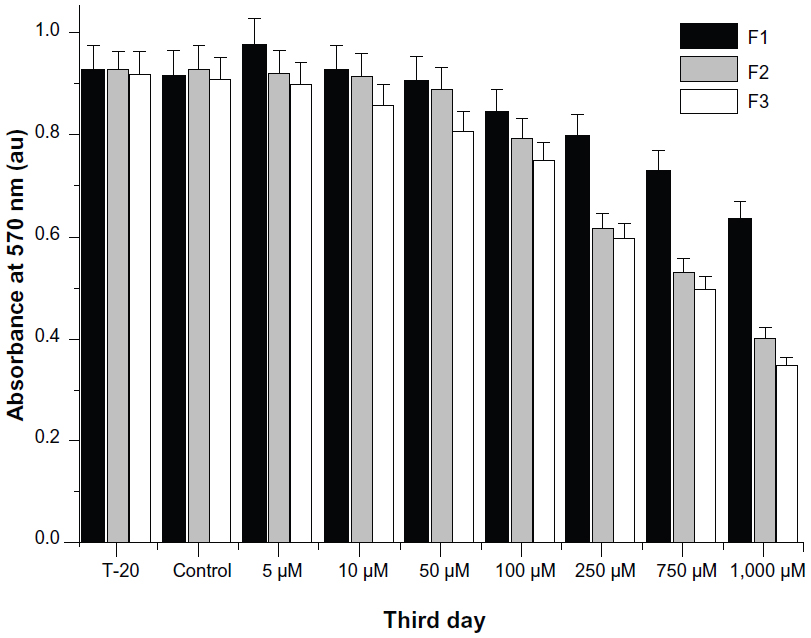 | Figure 3 Effects of different concentrations of samples on HDFn cell viability. |
ECIS profiling for cell behavioral toxicity of nano-APETE
In the present study, the F1 preparation of nano-APETE was examined for its photoprotective effects on HDFn cells. Hence, these drugs were subjected to high-throughput screening to ensure the safety of maximum drug activity concentrations. ECIS real-time impedance responses33 to HDFn cell attachment, proliferation, and mitosis during culture were measured with different concentrations of F1 sample. The impedance of HDFn cells was varied with different concentrations of F1 sample, as shown in Figure 4. The ECIS result shows continuous changes in cell behavior in response to different doses of F1 sample (from 5 μM to 1,000 μM). After seeding, cells are attached to the detection electrode. Cell resistance increased very rapidly according to the nano-APETE concentration. Further, the resistance of the cell-covered electrode increased dramatically at a lower concentration, which indicates the maximum number of cells attached to the electrode and maximum cell activity. On the other hand, a higher concentration of F1 sample shows decreases in impedance value, which means that a minimum number of cells attached to the electrode. Therefore, a low level of cell activity can be provided as a measure of toxic concentration. The physical information data of high concentration samples suggest that the HDFn cell development was impaired. Figure 4A shows that a concentration of F1 sample from 5–50 μM promoted greater cell attachment and proliferation even after 3 days. However, HDFn cells at a lower concentration of F1 sample exhibited increased cell growth activity as well as confluent cell growth on the electrodes, which increased cell impedance value. Cells exposed to a high concentration of F1 sample did not grow well. In fact, the cells were not able to survive at a greater than 50 μM concentration of F1 sample. The impedance results were confirmed by microscopic image, as shown in Figure 4B. The physical information of impedance-based cell activity coincided with the microscopy images. Figure 4A and B reveal that a moderate concentration of F1 sample (5–50 μM) could be promoted as improved cell survival and activity concentration.
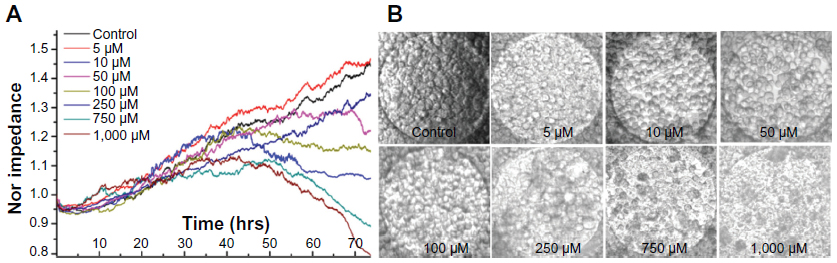 | Figure 4 Real-time HDFn cell responses to different concentrations of F1 sample. |
Three days after the ECIS study, cells were examined for their viability using an MTT assay kit for quantitative determination (Figure 5A) and a live/dead cell staining dye kit (Biovision Incorporated, Milpitas, CA, USA) for imaging (Figure 5B). After 3 days estimation, the lowest concentration of F1 sample had no effect on cell viability, whereas a higher concentration reduced viability. Control showed no reduction of growth even after 3 days, although the lowest concentration showed improved cell growth. A greater than 50 μM concentration of F1 sample showed a continuous growth decline. Moreover, live/dead staining helped to imaging of cell viability (Figure 5B). Green color shows the viable cells whereas red color represents the dead cells. Cell viability decreased with increasing F1 sample concentration, whereas the lowest concentration was not significantly different from that of control. Qualitative results coincided well with the quantitative cell viability assay results. However, in comparison with the ECIS data, the quantitative and qualitative evaluations better coincided with the physical information of continuous measurements. All toxicity study data reveal that the 5–50 μM concentrations of F1 sample show improved cell survival and no toxicity.
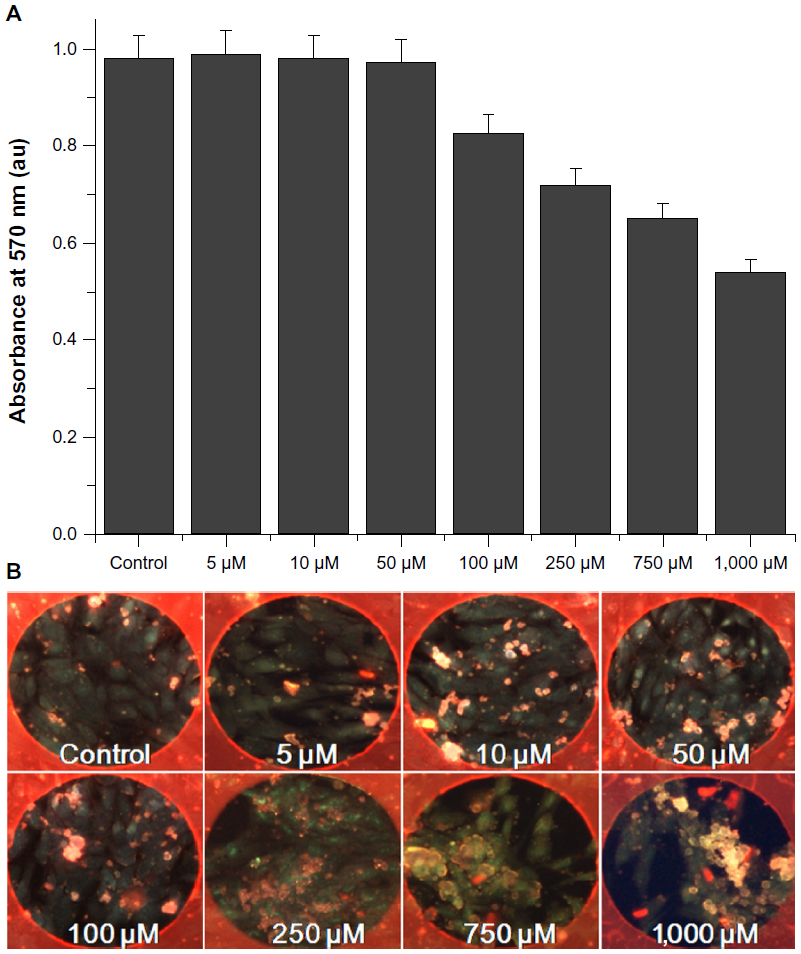 | Figure 5 Viability of HDFn cells in different concentrations of F1 sample. |
Evaluation of photoprotective effect on HDFn cells by ECIS
For efficient treatment, the present study investigated all safer concentrations of F1 sample from 10–50 μM in order to obtain a nontoxic maximum cell activity with no adverse side effects in terms of high-throughput drug screening. The various cell responses to different concentrations of F1 sample are shown in Figure 6. A normalized impedance value for relative changes in cellular resistance was reported. Normally, the seeded cells are attached to the electrode and create cell confluence, which increases the impedance value. During normal cell growth, the different concentrations of F1 sample were added and then exposed to light, after which cell activity changes were continuously monitored. The positive control showed no changes in cell growth, which suggests no influence on cells. On the other hand, the negative control showed a continuous decline in impedance value, thereby implying that the cells lost their strength and underwent detachment from the electrode as well as undergoing apoptosis. Initially, the high concentration of F1 sample shows maximum cellular protection against light, whereas the low concentration of F1 sample shows minimum cell protection, followed by a reduction in impedance value after 10–12 hours. Furthermore, 50 μM Naked-APETE showed no significant cell protective capability after light exposure, which makes it clear that the extract containing active biomolecules was irradiated by light.
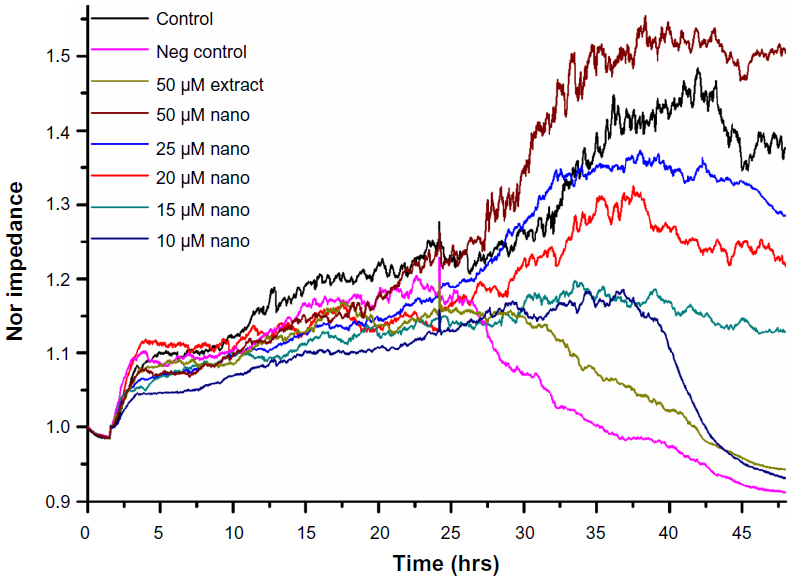 | Figure 6 Effects of different concentrations (10, 15, 20, 25, and 50 μM) of F1 sample on light-induced HDFn cells. |
Antioxidant activities of nano-APETE using DPPH
Antioxidant activities of various concentrations of nano-APETE were assessed by DPPH radical scavenging activity (Figure 7). DPPH scavenging assay demonstrated the effective inhibition activity of nano-APETE when compared with ascorbic acid, a positive standard. The inhibitory activity of nano-APETE increased at higher concentration. Further, a 50 μM concentration of nano-APETE shows more than 80% DPPH radical scavenging activity. The above physical information of impedance-based cell activity coincided with the scavenging activity. Figures 6 and 7 further show that the 50 μM concentration of F1 sample could be used to increase cell activity and survival. The DPPH radical scavenging activity of APETE-loaded particles increased at higher concentration. Natural antioxidants are present in phytomedicines, which are highly responsible for protecting against photo-oxidative stress. However, the real-time photoprotective effects of nano-APETE suggest that HDFn cells are fully protected against light radiation. This ECIS system has been extensively used for screening the photoprotective agents in an early stage.
 | Figure 7 Evaluation of radical scavenging activities of F1 samples using DPPH assay. |
Nano-APETE uptake into HDFn cells
The intracellular fate of TMR-labeled nano-APETE was monitored by fluorescence microscopy, and the images are shown in Figure 8. HDFn and RGC-5 cells were incubated with 5, 10, 15, 20, 25, 50, and 100 μM concentrations of fluorescent-labeled nano-APETE for a given period of time, washed, and viewed under a microscope to examine the cellular internalization. Figure 8A shows the HDFn cellular uptake behavior. The uptake of nano-APETE was increased with increased concentration, and reached a maximum at 50 μM for the higher active cells (the nano-APETE is denoted with white arrows; Figure 8). The 100 μM concentration of added cells shows the higher fluorescence intensity, but it shows less cellular activity (the cells are undergoing detachment from the surface). Images clearly confirm the presence of particles in the cytoplasm. The discrete red color suggests that nano-APETE was successfully internalized, most probably via endocytosis. Figure 8B shows the RGC-5 cellular uptake behavior. These RGC-5 cell images clearly show that the evidence of TMR-labeled nano-APETE was less in the cell cytoplasm and that it did not cross the cell membrane. Some of the nano-APETE are attached on the surface of the cell membrane whereas the remains are aggregated. Figure 8C and D clearly show the single cell images, and the nano-APETE are present inside for HDFn and outside for RGC-5 cells. It is clearly shown that the nano-APETE target the inside of the HDFn cells. These nano-APETE-treated HDFn and RGC-5 cells showed a significant increase in fluorescence intensity with higher concentration of F1 sample (Figure 8E). This experiment confirmed that nano-APETE is effective for drug release and that APETE-loaded particles are comparatively more helpful in targeting drugs to inside the cell area of the skin.
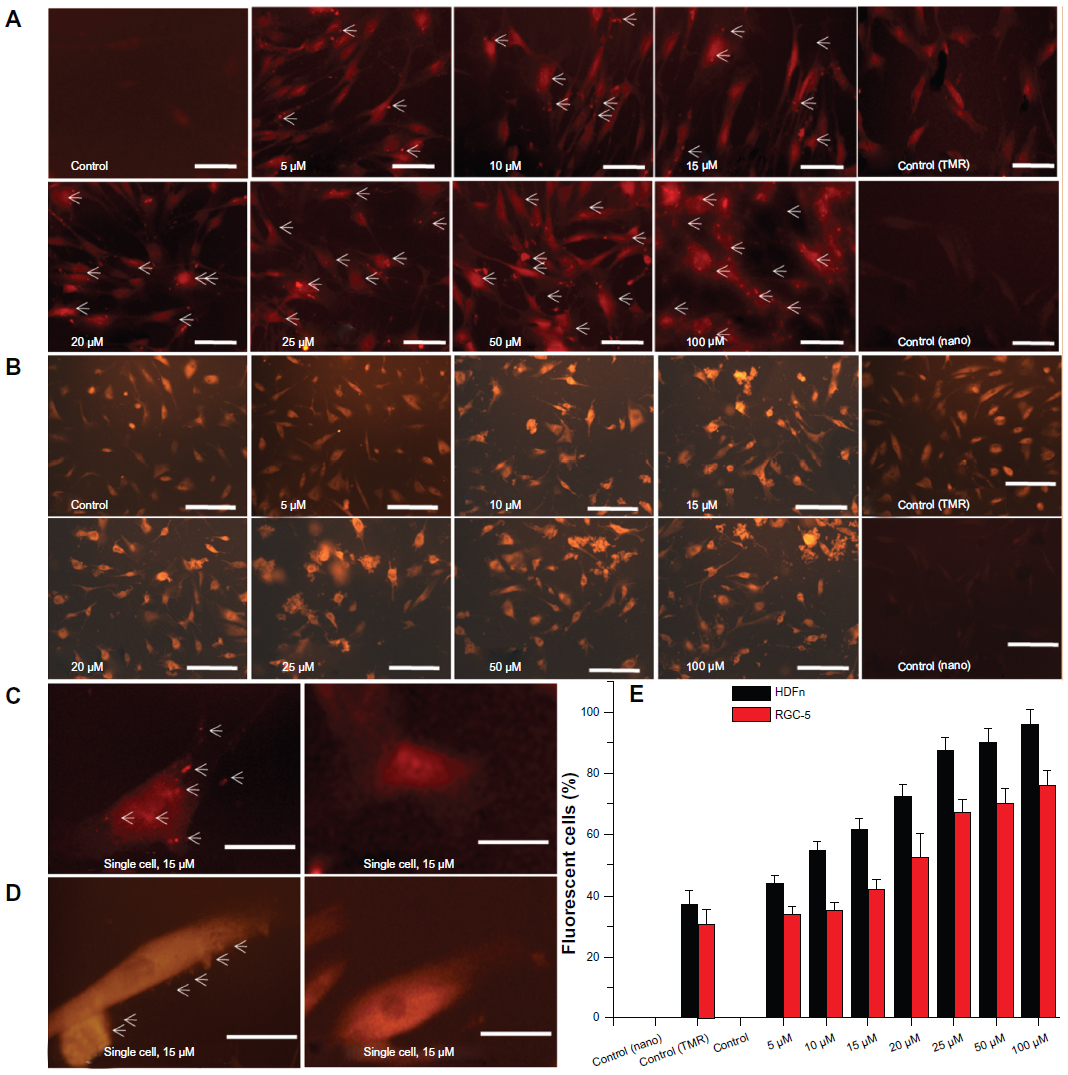 | Figure 8 Cellular uptake of nano-APETE in HDFn and RGC-5 cells. |
Ex vivo release study
The permeation profiles of F1 sample and raw extract obtained by plotting the cumulative amount of drugs permeated across unit area of human cadaver skin against time in hours are shown in Figure 9. The nano-APETE drug-release rate was compared to raw extract (APETE). The permeability of drugs is poor because of high hydrophilicity, so the oleic acid coated on the nano-APETE enhances the permeation rate and these results were in agreement with previous reports.34 Based on the results shown in Figure 9, the F1 sample has significant drug release over a period of 96 hours; after that the skin texture was collapsed. The initial cumulative drug release of F1 sample was much higher than the raw extract, but the raw extract does not release much. Among two samples, the F1 sample shows a predominant controlled drug release of 90% for 96 hours. The result reveals that the cumulative release of F1 sample was more significant. The F1 sample contains an appropriate proportion of PE with surfactant for enhanced drug permeation. Since PLGA is highly hydrophobic towards the outside of nanoparticles and the inside core containing natural drugs, it helps sustained drug release. The outermost tailored oleic acid can help enhance the skin permeation. The F1 nano-APETE were permeated through the human cadaver skin and delivered a higher amount of drug when compared to raw extract. This could be due to the texture similarity of the skin membrane.35–37 So this system confirms that the synthesized nano-APETE has flexibility for adjusting its structure. The outer layered negative charge particle permeates through the lipophilic bilayer of skin through the transepidermal route, similar to transferosome.38–41 Permeation of raw extract was lower than that of its nanoparticle preparation; this may be due to the lack of its flexibility in hydrophilic and liphophilic content according to the lipidic bilayer of skin. Furthermore, this new natural drug formulation has the ability to treat skin diseases such as photodamage, photoaging, and photodegenerative disease.
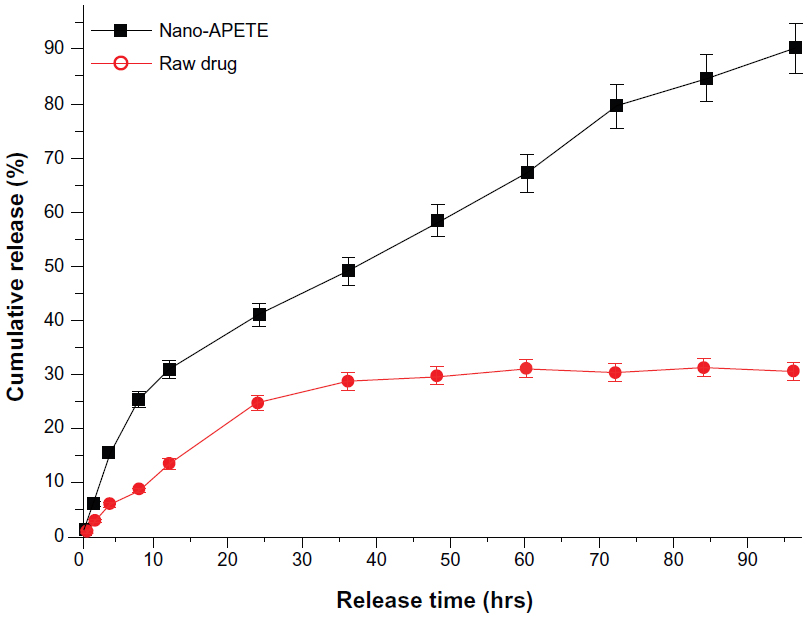 | Figure 9 Release profiles of nano-APETE and raw drug using human cadaver skin. |
Conclusion
There are several methods available to produce nanoparticles. In the present study, we utilized an emulsion solvent evaporation method with some modifications in order to develop permeation-enhanced apple peel ethanolic extract-loaded nanoparticles. This method is simple, reproducible, and yields high encapsulation or maximum activity nanoparticles. This system produced monodispersed nano-APETE, which has applicability to advanced therapeutic systems based on the increased stability through reduced aggregation. This nanocarrier system increases the stability of APETE and prevents photoirradiation. The nontoxic, safest concentrations (10, 15, 20, 25, and 50 μM) were utilized to study photoprotective effects using a real-time system. This established unprecedented setup is a very reliable approach for investigating the onset of the skin cell response, high-throughput natural product drug screening, and photoprotective effects. Evaluation of impedance-based cell activity provided reproducible and significant physical information. The results show that a 50 μM concentration of F1 sample improved cell survival by scavenging radicals from photo-oxidative stress. Real-time investigation into the photoprotective effect of nano-APETE found that HDFn cells are fully protected against light radiation. Further, APETE possesses enriched antioxidant properties due to its abundance of phytochemicals. The high amounts of protective compounds are identified and matched, and they provide synergetic effect against light radiation. Moreover, the combination of hexadecanoic acid and pectin with other protective compounds present in nano-APETE provides a synergetic photoprotective effect, and this synergetic effect needs further investigation. This ECIS system has been extensively used to screen the photoprotective agents in early stages. The cellular activity of nano-APETE might extend drug release times, thereby improving photoprotective activity. Also, in the drug release profile, the F1 sample shows the predominant controlled release of 90% for 96 hours. This result reveals that the cumulative release of F1 nano-APETE sample was more significant compared to raw drugs. Furthermore, this system has the ability to treat skin diseases such as photodamage, photoaging, and photodegenerative disease with high patient compliance because this formulation can limit their drug administration through the sustained release behavior. Altogether, our results propose that a 50 μM concentration of F1 sample is safe and has potential for use in skin phototherapeutics.
Acknowledgment
This research was supported by the Gachon University Research Fund in 2013 (GCU 2013-R130).
Disclosure
The authors report no conflicts of interest in this work.
References
Markovic SN, Erickson LA, Rao RD, et al; Melanoma Study Group of the Mayo Clinic Cancer Center. Malignant melanoma in the 21st century, part 1: epidemiology, risk factors, screening, prevention, and diagnosis. Mayo Clin Proc. 2007;82(3):364–380. | |
Bowden GT. Prevention of non-melanoma skin cancer by targeting ultraviolet-B-light signalling. Nat Rev Cancer. 2004;4(1):23–35. | |
Dennis LK. Analysis of the melanoma epidemic, both apparent and real: data from the 1973 through 1994 surveillance, epidemiology, and end results program registry. Arch Dermatol. 1999;135(3):275–280. | |
de Gruijl FR. Photocarcinogenesis: UVA vs UVB radiation. Skin Pharmacol Appl Skin Physiol. 2002;15(5):316–320. | |
Kielbassa C, Roza L, Epe B. Wavelength dependence of oxidative DNA damage induced by UV and visible light. Carcinogenesis. 1997;18(4):811–816. | |
Agar NS, Halliday GM, Barnetson RS, Ananthaswamy HN, Wheeler M, Jones AM. The basal layer in human squamous tumors harbors more UVA than UVB fingerprint mutations: a role for UVA in human skin carcinogenesis. Proc Natl Acad Sci U S A. 2004;101(14):4954–4959. | |
Hockberger PE, Skimina TA, Centonze VE, et al. Activation of flavin-containing oxidases underlies light-induced production of H2O2 in mammalian cells. Proc Natl Acad Sci U S A. 1999;96(11):6255–6260. | |
Boulton M, Rózanowska M, Rózanowski B. Retinal photodamage. J Photochem Photobiol B. 2001;64(2–3):144–161. | |
Osborne NN, Lascaratos G, Bron AJ, Chidlow G, Wood JP. A hypothesis to suggest that light is a risk factor in glaucoma and the mitochondrial optic neuropathies. Br J Ophthalmol. 2006;90(2):237–241. | |
Ruffolo JJ, Ham WT, Mueller HA, Millen JE. Photochemical lesions in the primate retina under conditions of elevated blood oxygen. Invest Ophthalmol Vis Sci. 1984;25(8):893–898. | |
Kvam E, Tyrrell RM. Induction of oxidative DNA base damage in human skin cells by UV and near visible radiation. Carcinogenesis. 1997;18(12):2379–2384. | |
Tyrrell RM. Ultraviolet radiation and free radical damage to skin. Biochem Soc Symp. 1995;61:47–53. | |
Wlaschek M, Tantcheva-Poór I, Naderi L, et al. Solar UV irradiation and dermal photoaging. J Photochem Photobiol B. 2001;63(1–3):41–51. | |
Einspahr JG, Stratton SP, Bowden GT, Alberts DS. Chemoprevention of human skin cancer. Crit Rev Oncol Hematol. 2002;41(3):269–285. | |
Wondrak GT, Jacobson MK, Jacobson EL. Endogenous UVA-photosensitizers: mediators of skin photodamage and novel targets for skin photoprotection. Photochem Photobiol Sci. 2006;5(2):215–237. | |
Wondrak GT. Let the sun shine in: mechanisms and potential for therapeutics in skin photodamage. Curr Opin Investig Drugs. 2007;8(5):390–400. | |
Bennet D, Kim S. Impedance-based cell culture platform to assess light-induced stress changes with antagonist drugs using retinal cells. Anal Chem. 2013;85(10):4902–4911. | |
Nichols JA, Katiyar SK. Skin photoprotection by natural polyphenols: anti-inflammatory, antioxidant and DNA repair mechanisms. Arch Dermatol Res. 2010;302(2):71–83. | |
Bonina F, Lanza M, Montenegro L, et al. Flavonoids as potential protective agents against photo-oxidative skin damage. Int J Pharm. 1996;145(1–2):87–94 | |
Govender T, Stolnik S, Garnett MC, Illum L, Davis SS. PLGA nanoparticles prepared by nanoprecipitation: drug loading and release studies of a water soluble drug. J Control Release. 1999;57(2):171–185. | |
Cevc G, Vierl U. Nanotechnology and the transdermal route: A state of the art review and critical appraisal. J Control Release. 2010;141(3):277–299. | |
Huang, MC, Agrios GN. Effect of scar skin and dapple apple diseases on certain groups of phenolic compounds in apple. Phytopathology. 1979;69(1):35–40. | |
Bennet D, Kim S. A transdermal delivery system to enhance quercetin nanoparticle permeability. J Biomater Sci Polym Ed. 2013;24(2):185–209. | |
Bennet D, Marimuthu M, Kim S, An J. Dual drug-loaded nanoparticles on self-integrated scaffold for controlled delivery. Int J Nanomedicine. 2012;7:3399–3419. | |
Giaever I, Keese CR. A morphological biosensor for mammalian cells. Nature. 1993;366(6455):591–592. | |
Keese CR, Wegener J, Walker SR, Giaever I. Electrical wound-healing assay for cells in vitro. Proc Natl Acad Sci U S A. 2004;101(6):1554–1559. | |
Bennet D, Kim MG, Kim S. Light-induced anatomical alterations in retinal cells. Anal Biochem. 2013;436(2):84–92. | |
Hu F, Lu R, Huang B, Liang M. Free radical scavenging activity of extracts prepared from fresh leaves of selected Chinese medicinal plants. Fitoterapia. 2004;75(1):14–23. | |
Oberdörster G, Oberdörster E, Oberdörster J. Nanotoxicology: an emerging discipline evolving from studies of ultrafine particles. Environ Health Perspect. 2005;113(7):823–839. | |
Birnbaum DT, Kosmala JD, Brannon-Peppas L. Optimization of preparation techniques for poly(lactic acid-co-glycolic acid) nanoparticles. J Nanopart Res. 2000;2(2):173–181. | |
Peng D, Huang K, Liu Y, Liu S. Preparation of novel polymeric microspheres for controlled release of finasteride. Int J Pharm. 2007; 342(1–2):82–86. | |
Song X, Zhao Y, Wu W, et al. PLGA nanoparticles simultaneously loaded with vincristine sulfate and verapamil hydrochloride: systematic study of particle size and drug entrapment efficiency. Int J Pharm. 2008;350(1–2):320–329. | |
Xie F, Xu Y, Wang L, Mitchelson K, Xing W, Cheng J. Use of cellular electrical impedance sensing to assess in vitro cytotoxicity of anticancer drugs in a human kidney cell nephrotoxicity model. Analyst. 2012;137(6):1343–1350. | |
Han IH, Choi SU, Nam DY, et al. Identification and assessment of permeability enhancing vehicles for transdermal delivery of glucosamine hydrochloride. Arch Pharm Res. 2010;33(2):293–299. | |
Shah JC, Sadhale Y, Chilukuri DM. Cubic phase gels as drug delivery systems. Adv Drug Deliv Rev. 2001;47(2–3):229–250. | |
Lara MG, Bentley MV, Collett JH. In vitro drug release mechanism and drug loading studies of cubic phase gels. Int J Pharm. 2005;293(1–2):241–250. | |
Boyd BJ, Whittaker DV, Khoo SM, Davey G. Lyotropic liquid crystalline phases formed from glycerate surfactants as sustained release drug delivery systems. Int J Pharm. 2006;309(1–2):218–226. | |
Cevc G, Blume G. Lipid vesicles penetrate into intact skin owing to the transdermal osmotic gradients and hydration force. Biochim Biophys Acta. 1992;1104(1):226–232. | |
Cevc G. Rationale for the production and dermal application of lipid vesicles: In: Falco OB, Korting HC, Maibach HI, editors. Liposome Dermatics. Berlin: Springer-Verlag, 1992:82–90. | |
Cevc G, Schatzlein A, Blume G. Transdermal drug carriers: Basic properties, optimization and transfer efficiency in the case of epicutaneously applied peptides. J Control Release. 1995;36(1–2):3–16. | |
Cevc G, Gebauer D, Stieber J, Schätzlein A, Blume G. Ultraflexible vesicles, Transfersomes, have an extremely low pore penetration resistance and transport therapeutic amounts of insulin across the intact mammalian skin. Biochim Biophys Acta. 1998;1368(2):201–215. |
Supplementary materials
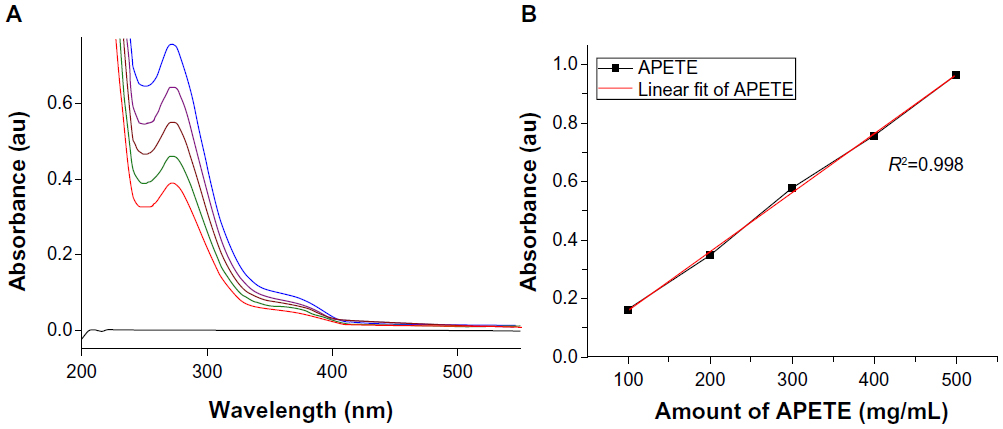 | Figure S1 Calibration curve of APETE by UV-visible spectroscopic method. (A) UV-visible spectra of different concentrations of APETE. (B) Standard plot was found by plotting various concentrations of APETE versus absorbance with linear correlation co-efficient. |
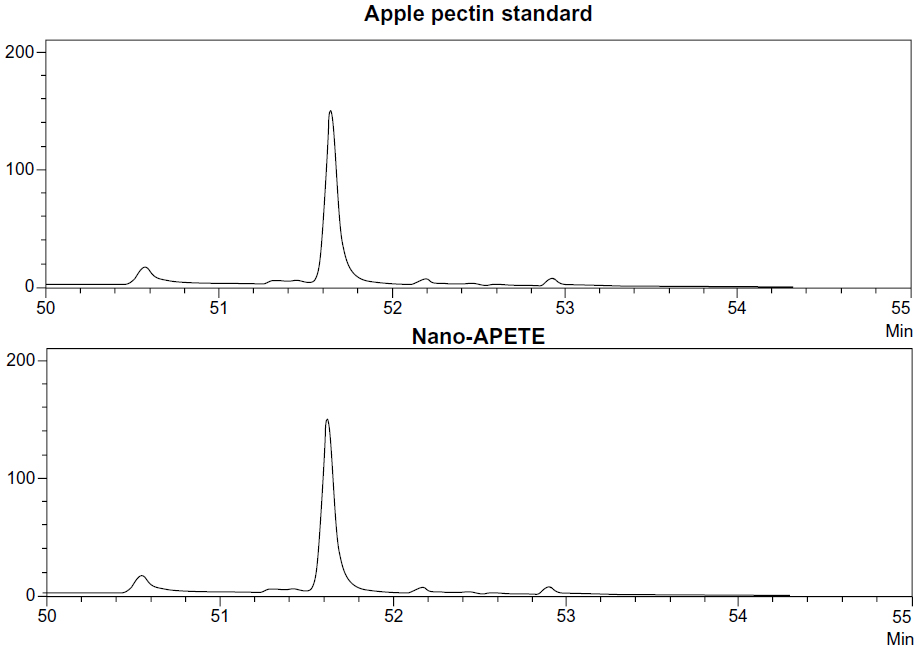 | Figure S2 HPLC chromatograms of standard apple pectin compared with nano-APETE. The peak of APETE coincided with that of standard pectin. |
 © 2013 The Author(s). This work is published and licensed by Dove Medical Press Limited. The full terms of this license are available at https://www.dovepress.com/terms.php and incorporate the Creative Commons Attribution - Non Commercial (unported, v3.0) License.
By accessing the work you hereby accept the Terms. Non-commercial uses of the work are permitted without any further permission from Dove Medical Press Limited, provided the work is properly attributed. For permission for commercial use of this work, please see paragraphs 4.2 and 5 of our Terms.
© 2013 The Author(s). This work is published and licensed by Dove Medical Press Limited. The full terms of this license are available at https://www.dovepress.com/terms.php and incorporate the Creative Commons Attribution - Non Commercial (unported, v3.0) License.
By accessing the work you hereby accept the Terms. Non-commercial uses of the work are permitted without any further permission from Dove Medical Press Limited, provided the work is properly attributed. For permission for commercial use of this work, please see paragraphs 4.2 and 5 of our Terms.